



Abstract
According to optimal distinctiveness theory, sufficiently small minority groups are associated with greater membership trust, even among members otherwise unknown, because the groups are seen as optimally distinctive. This article elaborates on the prediction’s motivational and cognitive processes and tests whether sufficiently small minorities (defined by relative size; for example, 20%) are associated with greater membership trust relative to mere minorities (45%), and whether such trust is a function of optimal distinctiveness. Two experiments, examining observers’ perceptions of minority and majority groups and using minimal groups and (in Experiment 2) a trust game, revealed greater membership trust in minorities than majorities. In Experiment 2, participants also preferred joining minorities over more powerful majorities. Both effects occurred only when minorities were 20% rather than 45%. In both studies, perceptions of optimal distinctiveness mediated effects. Discussion focuses on the value of relative size and optimal distinctiveness, and when membership trust manifests.
Human beings are innately social creatures. Such sociality has its functions, allowing people the opportunity to collaborate and depend on others, to form groups, and expand our capabilities beyond those of a single individual. But what sustains that cooperation and maintains an entire community of people collaborating? We believe it has to do at least in part with group size, particularly individuals’ perceptions of relative group size. We argue that sufficiently small groups are more likely to be seen as trustworthy, and when seeking to trust others, individuals will prefer membership in such groups. We draw from optimal distinctiveness theory (Brewer, 2003; Leonardelli, Pickett, & Brewer, 2010) to support these assertions, and test these predictions for the first time in two controlled experiments.
Optimally distinctive group memberships are defined by balancing two fundamental human motives (Brewer, 1991, 2003), the need for inclusion and the need for differentiation. First, individuals seek group memberships that are large enough to meet a need for inclusion, where they desire security, group immersion, and similarity. Second, in contrast, individuals also seek groups that are sufficiently small to permit them to feel distinctive. These motives are not only fundamental but also in opposition, an assumption with a long history in psychology (e.g., Codol, 1984; Lemaine, 1974; Maslach, 1974; Snyder & Fromkin, 1980; Ziller, 1964): Individuals wish to meet both needs, seeking to stand out, but not too much.
Moreover, these motives are presumed to operate at different levels of self (Brewer, 1991; Brewer & Roccas, 2001). Not only do individuals seek to meet both needs, but they can meet them with reference to different identities, not only their individual identity but also increasingly inclusive nested identities (i.e., individual, subgroups, groups, superordinate groups, etc.; Brewer, 1991; see also Hornsey & Jetten, 2004). Individuals can feel that their personal and group identities can feel distinctive or inclusive. However, meeting a need with one level of self does not mean that the need is met at every level of self. Feeling individually similar to or included with fellow group members (within-group inclusion) does not presuppose that the group itself is also seen as similar to other groups (between-group inclusion). As a consequence, even though the needs oppose each other at the same level of self, one may feel simultaneously distinctive and included, with the needs met at different levels of the self. Herein lies the experience of optimal distinctiveness; it can be achieved when individuals belong to groups that are more distinctive than other groups but simultaneously yield a sense of inclusion within the group. Achieving optimal distinctiveness—that is, by simultaneously meeting the needs via between-group distinctiveness and within-group inclusion—is presumed to be predicted by relative group size and to predict membership trust.
Individuals find groups to be optimally distinctive by considering the group’s size relative to the surrounding population (Brewer, 1991): a group of 500 is large in a population of 600, but small in a population of 6,000. The relative size of groups could thus be conceptualized as a continuum and may be indexed by percentages, ranging from extremely small groups (such as 1% or less of the population) to extremely large groups (99% or more) to any number in between. Groups that are relatively small (hereafter referred to as “minorities”) have the potential to be distinctive, and sufficiently small minorities are expected to be optimally distinctive.
Relative group size is expected to yield optimal distinctiveness based on how size affects social categorization (Allport, 1954; Bruner, 1957), the cognitive process by which individuals form perceptions of groups (Wilder, 1981). Social categorization refers to a process of understanding individuals by knowing to which other people they are similar and from which other people they differ (adapted from McGarty, 1999). People form categories when they observe meta-contrast (Campbell, 1958), that is, when individuals or objects are perceived to be increasingly similar to some other individuals or objects, and these individuals or objects are unlike others (for a recent review, see Leonardelli & Toh, 2015; see also Rosch, 1978; Turner, 1987; Tversky & Gati, 1978). Decreasing minority size accentuates category formation, increasing between-group distinctiveness and within-group inclusion (Brewer, 1991). Evidence supports this prediction: Relative to numerical majority categories, moderately small minority categories are more distinctive (McGuire & McGuire, 1988), and minority versus majority group members are perceived to be more similar to each other (Nelson & Miller, 1995). In this regard, optimally distinctive groups can simultaneously meet both needs, via between-group distinctiveness and within-group inclusion, and relative size can achieve this state, assuming the group is sufficiently small.
According to Brewer (2003), between-group distinctiveness and within-group inclusion produced by relative size will strengthen mutual expectations of trust and obligatory cooperation within the category. The more distinctive size of the minority group reduces the risk of nonreciprocation of cooperation; after all, holding all else constant, depending on fewer people is expected to increase mutual accountability among existing group members. Moreover, greater inclusion within-group extends trust expectations to all members, even those otherwise unknown. In this regard, it is the shared features that lead individuals to trust others, even if the group members are otherwise unknown to the individual. Thus, we elaborate on how perceptions of minority group size, optimal distinctiveness, and membership trust came to be associated with each other, and test such predictions in two studies.
We take a different approach from other research on group size and cooperation. In contrast with Dunbar’s (1993) research connecting larger primate brains with absolute group size and cooperation among familiar others, our work targets relative group size, social comparison and categorization processes, and implications for trust and cooperation even for unfamiliar group members. Crucially, too, Dunbar’s work does not depend on and cannot explain the connection between cooperation and perceptions of relative size and optimal distinctiveness, upon which our theoretical perspective rests. In two experiments, we test for the first time whether individuals associate minority size with membership trust, and whether such trust is a function of optimal distinctiveness. Previous research has established that group members trust fellow members more than nonmembers (e.g., Brewer & Kramer, 1986; Foddy, Platow, & Yamagishi, 2009; Lount, 2010). Investigating the role of relative size in membership trust requires tests that disentangle group size effects from those of shared group membership. Thus, our experiments determine whether individuals associate more membership trust with sufficiently small minority groups when they are members of neither group.
Experiment 1: Observer’s Perceptions
This study explored individuals’ perceptions of minorities and majorities when they themselves belonged to neither group. We expected observers to see members of the minority more than majority group as likely to trust and assist each other as a function of optimal distinctiveness specifically when the minority was sufficiently small. This prediction was tested by manipulating relative group size; the size distribution was more extreme for some participants (20% vs. 80%) than for others (45% vs. 55%). Compared with a mere minority (operationalized at 45%), we expected that substantially smaller minorities (operationalized at 20%) would be perceived as more optimally distinctive, and thus perceived to have higher levels of intragroup trust relative to majority groups.
Method
Although the study was conducted prior to the developing conclusions the field of psychology is reaching over how to address the determination of sample size, we sought to make the sample larger than what previous research has used to determine sample size in studies with laboratory-created groups (cell size ranged from 20 to 35; for example, Hogg & Turner, 1987). Thus, we sought to recruit between 45 and 50 participants for each theoretically relevant cell of the design, a two-cell (minority relative size: 20%, 45%) between-participants design. Ninety-one individuals were recruited for this study; 36 were initially recruited through the Rotman School of Management’s Paid Participant Pool; they completed the study in exchange for CA$3. As the recruitment from the paid pool was progressing slowly, to facilitate data collection, another 55 were recruited from Amazon’s Mechanical Turk (MTurk) website and were paid US$1.00 to participate. Although MTurk participants reported higher trust ratings (M = 5.16) than local participants (M = 4.25), F(1, 87) = 20.20, p < .05, differences in recruitment source had no other significant effects, main effects or moderation, on dependent measures. Consequently, this difference is no longer addressed.
To reduce alternative explanations associated with some minority groups (e.g., group history or socioeconomic status), participants were asked to report their perceptions regarding two supposedly real (but laboratory-created) minimal groups (Tajfel, Billig, Bundy, & Flament, 1971), presumably defined by preferences for paintings by Wassily Kandinsky or Paul Klee. Participants were also randomly assigned to one of two relative group size conditions, reading that the painting preference groups represented 45% and 55% of the population or 20% and 80% of the population. Here is what the participants’ read:
In this study we are examining how accurately people perform group classifications. Previous research has shown that simply based on facial features, individuals can at times accurately classify other people by their group membership. This study will investigate how well individuals can classify people by their painting preference group membership. For about three decades, research (Brewer, 1979; Brewer & Pickett, 2005) has established that different painting preference groups are associated with differences in cognitive psychology, social psychology, and personality. The Painting Preferences Classification Task identifies the painting preferences of an individual and classifies them into one of two painting preference groups, either Kandinsky or Klee. The results of prior research using this task have shown that roughly [20%, 45%, 55%, or 80%] of the population is classified into the [smaller, larger] Klee group, whereas [80%, 55%, 45%, or 20%] of the population is classified into the [larger, smaller] Kandinsky group.
One category was always a minority and the other a majority; which category was smaller was counterbalanced across participants as a control factor. This control factor (minority group: Kandinsky, Klee) did not yield significant or meaningful effects, and consequently is no longer addressed.
To confirm they were aware of this size information, we asked participants to report the size of one group relative to another. For participants to continue with the study, they were required to correctly report the exact percentage of the two groups.
Participants then reported on the groups’ optimal distinctiveness using a 7-point scale (1 = Kandinsky group much more to 7 = Klee group much more). The four-item measure included questions about between-group distinctiveness (i.e., “Which group do you feel is more distinctive?”; “Which group ‘stands out’ more?”) and within-group inclusion (i.e., “In which group are members more associated with each other?”; “In which group do members fit in more with the others of their group?”). The item responses were averaged to index perceptions of optimal distinctiveness (α = .71). Responses were recoded to range from −3 to +3, where positive scores indicated greater minority optimal distinctiveness relative to the majority group. With this recoding, zero reflects a point where neither group is rated higher than the other. 1
Finally, participants completed a measure of intragroup trust, rating their agreement with three statements about each group (i.e., “[Klee/Kandinsky] group members think other members of their group are trustworthy”; “[Klee/Kandinsky] group members trust other members of their group”; “Members of the [Klee/Kandinsky] group are willing to assist each other”) using a 7-point scale (1 = disagree strongly to 7 = agree strongly). These ratings were recoded to reflect intragroup trust ratings for the minority or majority group. Internal consistency was high for both sets of items (αmin = .92, αmaj = .94). Item scores were averaged to form separate scores for the minority (M = 5.18, SD = 1.05) and majority (M = 4.80, SD = 1.16) groups; higher numbers indicated greater intragroup trust. For more information, the online supplemental materials summarize exploratory factor analyses, from Experiments 1 and 2, which support the notion that the distinctiveness, inclusion, and trust measures are indexing different constructs.
Results and Discussion
Two participants failed to accurately report the relative size of the two groups, but because conclusions of analyses do not substantially differ when excluding them, reported analyses include the manipulation failures. The counterbalance manipulation yielded no meaningful or consistent effects here and is thus excluded from analysis.
Trust perceptions
Scores were submitted to an ANOVA, with relative group size (20% vs. 80%, 45% vs. 55%) as a between-subject factor and target group (minority, majority) as a within-subject factor. Analysis yielded a target group main effect, F(1, 89) = 7.15, p = .009, r = .27, which was qualified by a Relative Group Size × Target Group interaction, F(1, 89) = 5.04, p = .03, r = .23. Observers expected intragroup trust to be higher among group members belonging to the 20% minority (M = 5.36, SD = 1.00; M 95% confidence interval [CI] = [5.06, 5.67]) than the 80% majority (M = 4.68, SD = 1.23; M 95% CI = [4.35, 5.02]), F(1, 89) = 12.23, p = .001, r = .35. By contrast, observers expected intragroup trust for members of the 45% minority (M = 4.98, SD = 1.08; M 95% CI = [4.68, 5.29]) to be similar to that of the 55% majority (M = 4.93, SD = 1.08, M 95% CI = [4.58, 5.27]), F(1, 89) = 0.09, p = .76, r < .01. Intragroup trust ratings of the 20% minority were higher and significantly different from the ratings for every other group, as indicated by the CIs.
Optimal distinctiveness
Scores were submitted to a t test, which revealed that the 20% minority was perceived to be more optimally distinctive (M = 0.58, SD = 1.45, M 95% CI = [0.16, 1.00]) than the 45% minority (M = −0.08, SD = 1.04, M 95% CI = [−0.38, 0.23]), t(81.73) = −2.47, p = .015, rpb = 0.25. The CIs also indicated that the 20% minority was perceived to be more optimally distinctive than the 80% majority (as indexed by the CI not including zero), but that the 45% minority was no more optimally distinctive than the 55% majority (CI includes zero).
Mediation
We predicted that the greater perceived trust associated with the 20% minority group was a function of the greater perceptions of optimal distinctiveness attributed to the 20% than the 45% minority. To test this predicted mechanism, we conducted an analysis using PROCESS (SPSS version; Hayes, 2016). PROCESS is an analysis procedure that tests for different models of moderation and (for our purposes) mediation. The procedure follows a causal steps framework (Baron & Kenny, 1986) using a series of (in our case, linear regression) analyses in addition to indirect effect tests. In this case, we sought to test whether optimal distinctiveness can explain the effect of relative size on minority membership trust (a single mediator model; in PROCESS, Model 4).
We submitted minority trust ratings as the outcome measure, relative group size as the causal variable, and optimal distinctiveness scores as the mediator. Majority trust scores were included as a covariate on the minority trust ratings to establish that it is perceptions of minority trust above and beyond that which would be predicted by perceptions of group trust in general (as indexed by majority trust scores) that would be best predicted by relative size and mediated by optimal distinctiveness. Relative size was dummy coded (0 = 45% minority, 1 = 20% minority).
Prior to conducting PROCESS, we submitted minority trust scores to a regression analysis with relative size as a predictor and majority trust scores as a covariate. This analysis revealed that the majority trust ratings were a significant covariate (b = 0.26, SE = .09, p = .006, sr [semipartial correlation] = .28), with higher trust from majorities yielding higher trust for minorities. However, even controlling for majority trust scores, relative size significantly predicted minority trust (b = 0.44, SE = .21, p = .04, sr = .21), revealing that observers perceived minority group members displaying greater intragroup trust when their group was 20% rather than 45%. Albeit conducted in a different way, these results are consistent with the mixed ANOVA reported earlier. These results are presented here to offer a point of comparison for the PROCESS model; presumably, were optimal distinctiveness to mediate the effect of relative size on minority trust, then the relative size effect on minority trust should be reduced or become nonsignificant.
The outcomes of the PROCESS analysis are reported in Figure 1. The results revealed that smaller minority size was related to greater optimal distinctiveness, a significant effect (and an analysis consistent with our previously reported t test). An analysis of minority trust with relative size and optimal distinctiveness included as predictors and majority trust as a covariate revealed, as would be expected, the covariate continued to be a significant predictor of minority trust (b = 0.28, SE = .09, p = .002). More importantly, and consistent with the prediction, optimal distinctiveness positively predicted minority trust such that higher optimal distinctiveness scores were associated with higher membership trust, but relative group size no longer predicted minority trust (ns). A bootstrap test of the indirect effect through optimal distinctiveness did not include zero in the CI, indicating evidence consistent with mediation (b = 0.12, 95% CI = [0.0012, 0.369]; 10,000 resamples). To conclude, the evidence is consistent with the prediction that individuals associated trustworthiness more with 20% than 45% minorities for reasons of optimal distinctiveness.
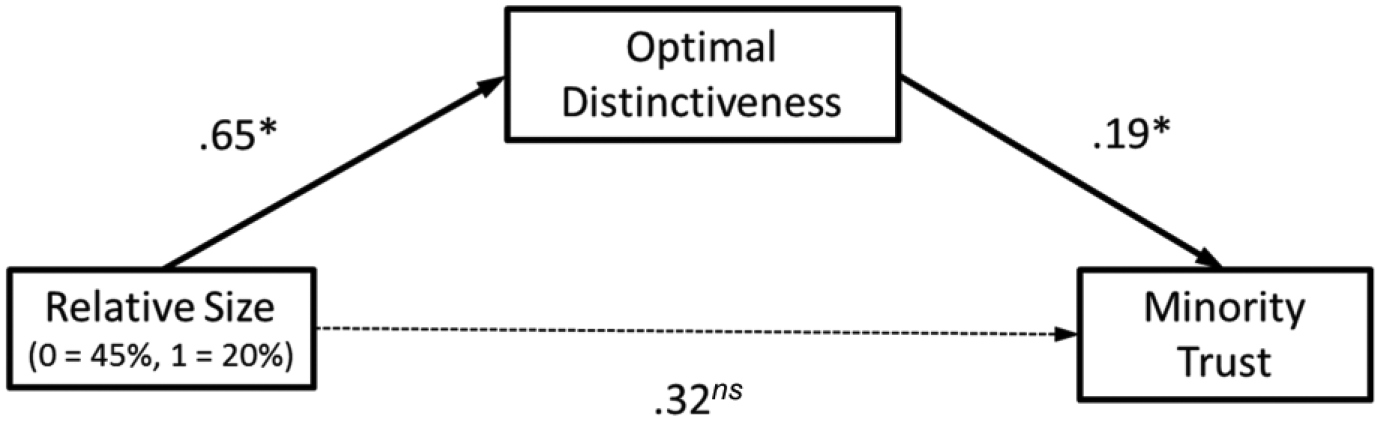
Relative size affects minority trust via optimal distinctiveness: Experiment 1.
Distinctiveness and inclusion as separate contributors
According to theory (Brewer, 2003), it should be the combined optimal distinctiveness measure that most strongly predicts minority trust rather than inclusion or distinctiveness scores alone. We explored this assumption by calculating the correlations for minority trust with optimal distinctiveness scores, and separately with inclusion and distinctiveness scores. Positive correlations would indicate that the more distinctive, included, or optimally distinctive the minority is perceived to be, the more observers perceive minority intragroup trust. We also calculated the correlations of these measures with majority trust, included here as a counterpoint. Here, negative correlations would indicate that the more the majority is perceived to be distinctive, included, or optimally distinctive, the more observers perceive majority trust (we did not expect optimal distinctiveness to be related to majority intragroup trust). Table 1 summarizes these correlations in the first two rows.
Bivariate Correlations Between Trust and Distinctiveness, Inclusion, and Optimal Distinctiveness.
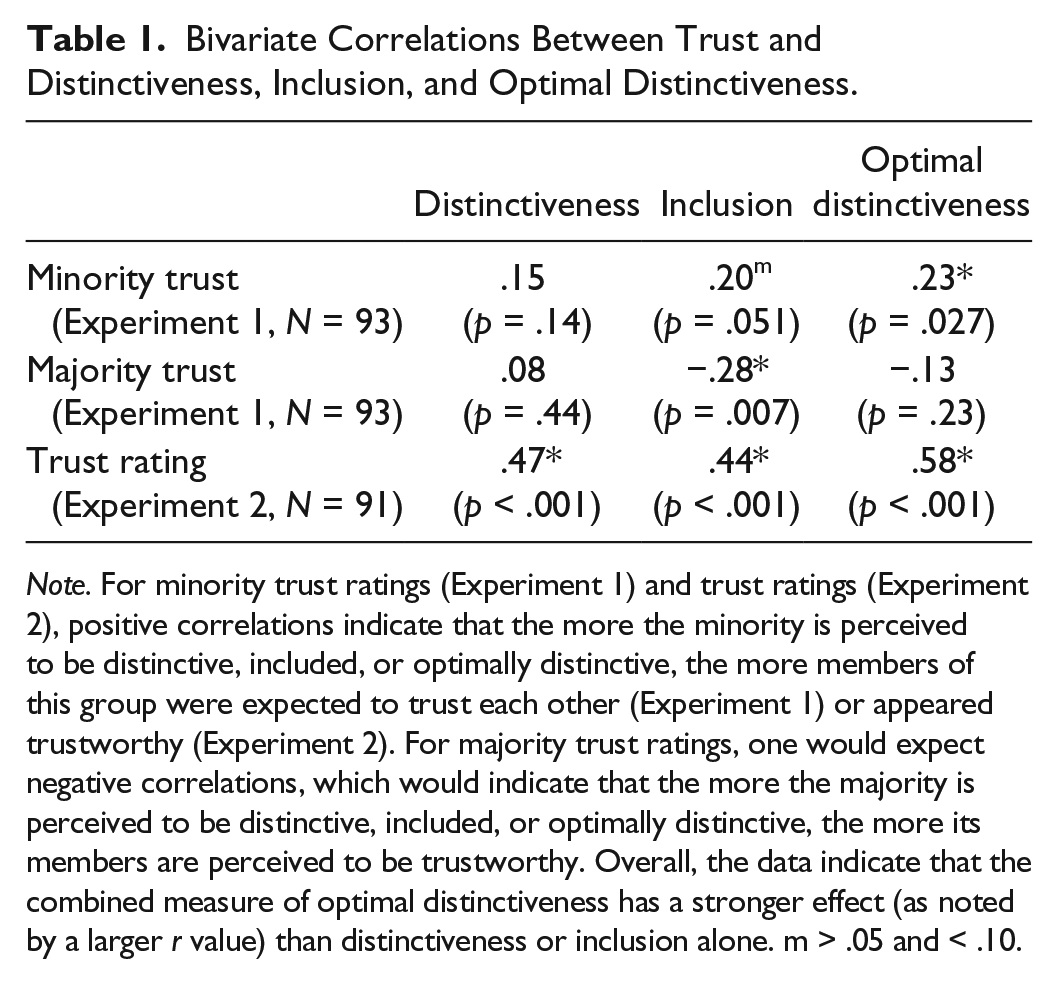
Note. For minority trust ratings (Experiment 1) and trust ratings (Experiment 2), positive correlations indicate that the more the minority is perceived to be distinctive, included, or optimally distinctive, the more members of this group were expected to trust each other (Experiment 1) or appeared trustworthy (Experiment 2). For majority trust ratings, one would expect negative correlations, which would indicate that the more the majority is perceived to be distinctive, included, or optimally distinctive, the more its members are perceived to be trustworthy. Overall, the data indicate that the combined measure of optimal distinctiveness has a stronger effect (as noted by a larger r value) than distinctiveness or inclusion alone. m > .05 and < .10.
Three features of the data are worth discussing. First, the combined optimal distinctiveness measure is significantly related to greater minority trust, and although nonsignificant, distinctiveness and inclusion individually are positively related to trust. Second, the optimal distinctiveness correlation is bigger than either need satisfaction measure alone, accounting for 1% more variance, consistent with the idea that the combined total is more predictive of intragroup trust than either alone. Third, the needs do not correlate with majority trust in the same way. If anything, the data seem to suggest that while greater majority inclusion relates to greater majority trust, distinctiveness does not, and neither did the combined optimal distinctiveness index. The data are certainly consistent with our predictions. While correlations between minority trust and the distinctiveness and inclusion were not significant, our theoretical approach does not require significant effects of each; rather, it focuses on the overall concept of optimal distinctiveness, which was significantly related to minority trust. The online supplemental materials include some additional mediation analyses exploring between-group distinctiveness and within-group inclusion as independent mediators to membership trust, using data from Experiments 1 and 2.
Experiment 2: Membership Preferences
Although in Experiment 1 individuals associated trustworthiness more with 20% rather than 45% minorities for reasons of optimal distinctiveness, it was not clear whether this association between trustworthiness and minority size was desirable and would manifest behaviorally. Experiment 2 sought to test whether individuals would prefer and join a minority or majority group before doing a task where they would depend on the trustworthiness of a member of their selected group. Moreover, as in the first study, we experimentally manipulated relative group size, where the distribution between minority and majority groups was more extreme for some participants (20% vs. 80%) than for others (45% vs. 55%) and measured optimal distinctiveness. As reported in Experiment 1, we expected that the 20% minority would be perceived to be more optimally distinctive and its members more trustworthy compared with the 45% minority. Furthermore, we expected that individuals would prefer membership in and join minorities more than majorities when the minorities were 20% versus 45% of the population as a result of perceptions of optimal distinctiveness and intragroup trust. This model is presented in Figure 2.
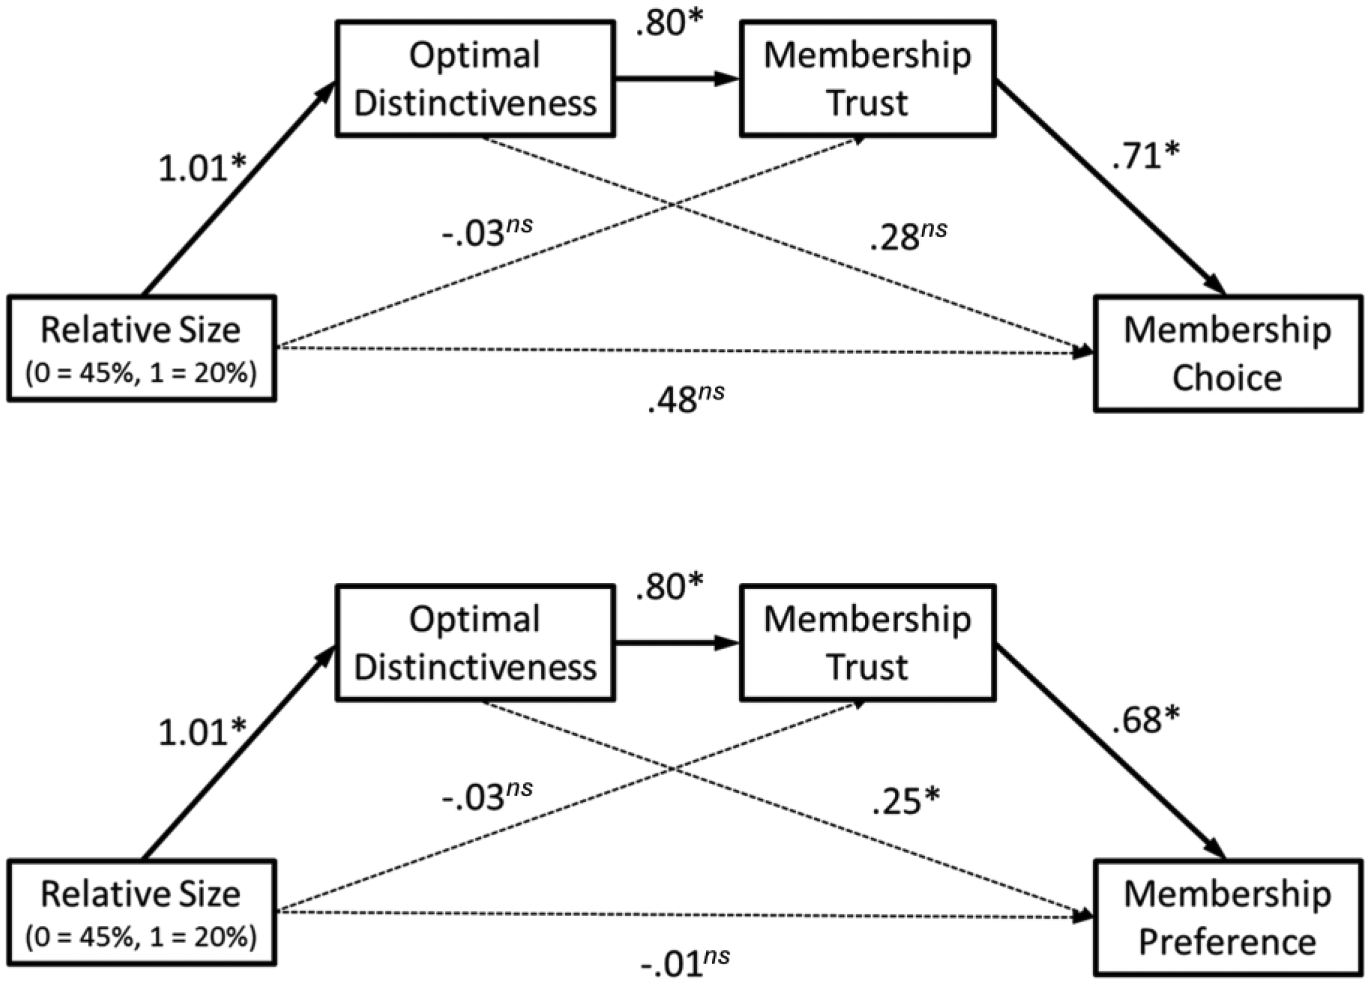
Relative size affects membership choice and preference via optimal distinctiveness and membership trust: Experiment 2.
Method
As in Experiment 1, we targeted a total sample size of 45 to 50 participants per theoretically meaningful cell of our two-cell (minority relative size: 45%, 20%) between-participants design. A total of 99 participants were recruited from Amazon’s MTurk website and paid US$0.75 to participate in this study. Once recruited, participants were presented with a decision to join one of two groups (Group A or B)—a numerical minority or majority—before participating in a trust game with an anonymous member of their selected group.
In the trust game (Berg, Dickhaut, & McCabe, 1995), a participant is given a sum of money and decides how much to send to an anonymous recipient. The money sent is tripled, and the recipient decides how much (if anything) to return to the participant. More money sent by the participant represents a greater degree of trust in the recipient. In our study, participants decided how to distribute US$10 between themselves and another, described only as a member of their selected group. Participants first read about the trust game and their group decision (all participants received these instructions):
For the task, first you will choose which group to join (Group A or Group B). Then, you will decide on a quantity of dollars ranging from zero to $10 that you would like to send to another person, who will be a randomly chosen member from the group you join. The amount that you send will be multiplied by 3 and given to that group member (i.e., if you choose to send $10, the group member will receive 3 × $10 = $30). The group member will then respond with an amount that he or she wants to return to you.
Prior to making their group choice, participants read some additional details about the trust game. Group size was manipulated as follows: “For the purposes of this study, these groups have been labeled Group A, which represents 20% [45%] of the population, and Group B, which represents 80% [55%] of the population.” Group size was counterbalanced with category label; for about half the participants, Group A was the smaller group. As counterbalance yielded no consistent effects, it is no longer discussed. Participants then had to report the size of each group before continuing.
Participants then completed measures of power, trust, and membership preference with single-item questions (i.e., “Which group do you feel is more powerful?”; “Who would you be more likely to trust: A Member of Group A or B?”; “Which group do you prefer more?”) as well as the optimal distinctiveness measure from Experiment 1. Participants completed the measures using the following response scale (1 = Group A much more, 4 = neither group more than the other, to 7 = Group B much more). The item responses were averaged to index perceptions of optimal distinctiveness (α = .78). Responses on these measures were recoded to range from −3 to +3, with positive scores indicating greater optimal distinctiveness, power, membership trust, and membership preference of the minority than majority group. With this recoding, zero reflects a point where neither group is rated higher than the other.
Finally, participants chose their group membership and made decisions of how much of US$10 to send to the other party. Before completing any dependent measures, participants were told that 10% of the trust games would be conducted using real money, and after making their trust game decision, they were informed whether their game was selected to be played with real money. Participants were then paid for their participation. For participants who were chosen to play trust games with real money, we tripled the amount of the outcomes sent to the other party, and gave this new total to a new set of individuals recruited from MTurk, who then decided how much to keep and how much to return. No experimental manipulations or other measures were introduced with this second set of participants; they were merely paid according to their decision. Within 2 weeks, we then contacted participants in the original study and paid them accordingly (what they originally decided to keep plus whatever was returned to them).
Results and Discussion
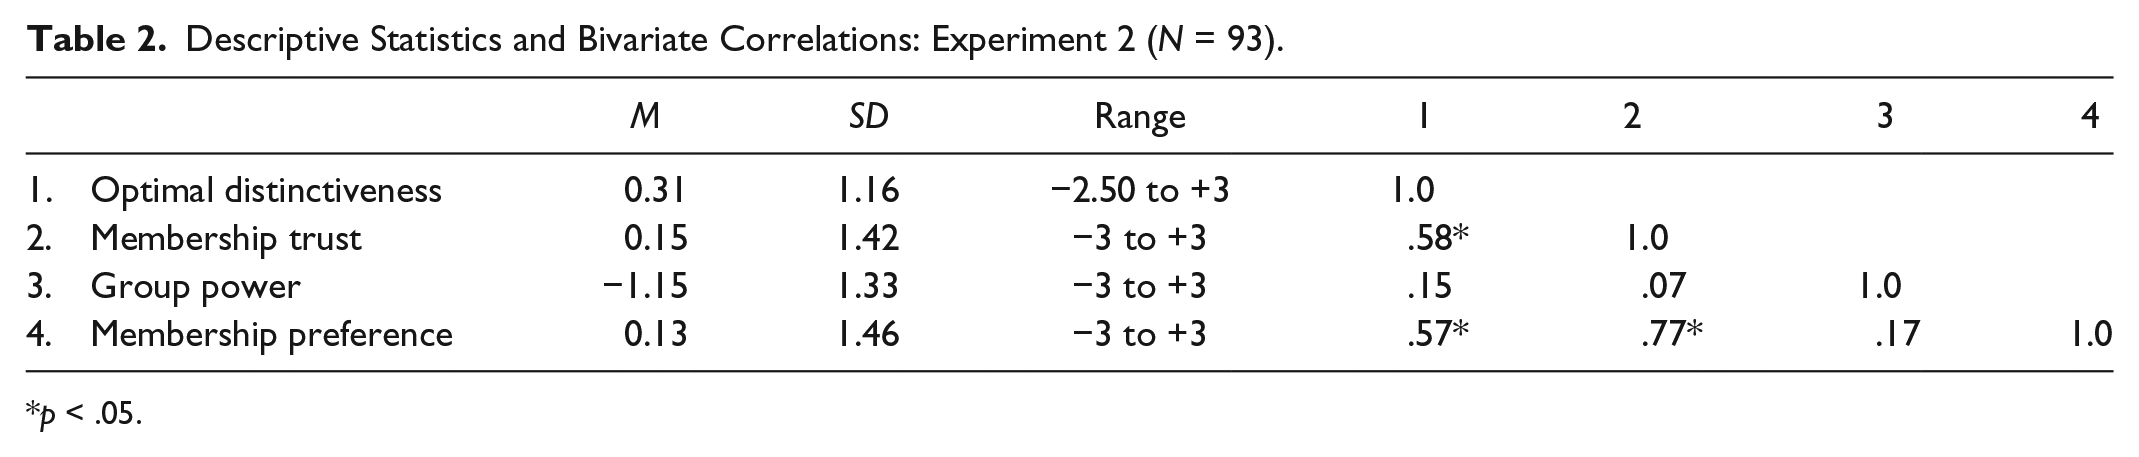
Manipulation checks revealed that all participants correctly reported percentages of the minority and majority groups depending on their group size condition. Participants’ open-ended comments about the study revealed that four were confused about the trust game instructions. Also, one person did not complete the measures, and another was consistently an outlier within condition as identified by box plot analysis, that is, more extreme than the Tukey fence on inclusion (−3 < −2.5), trust (3 > 1), and membership preference (3 > 1). These six individuals were dropped from analysis, resulting N = 93 (ages 18-68 years, Mdn = 34; 52 females, 41 males). Table 2 contains descriptive statistics and bivariate correlations among the measures.
Descriptive Statistics and Bivariate Correlations: Experiment 2 (N = 93).
p < .05.
Group ratings and choice
Individuals perceived the majority to be more powerful than the minority (M = −1.15, SD = 1.33, M 95% CI = [−1.43, −0.87]; CI does not include zero), but relative group size (20% vs. 80%, 45% vs. 55%) did not affect this perception, t < 1, p > .54. Logistic regression analysis revealed a relative group size effect on group choice (b = 1.02, p = .02, requivalent = .25). More participants joined the minority when its relative size was 20% (30/46 = 65%; 95% CI = [51%, 77%]) than 45% (19/47 = 40%; 95% CI = [28%, 55%]). Likewise, individuals preferred minority over majority group membership more when the minority was 20% (M = 0.52, SD = 1.49, M 95% CI = [0.11, 0.94]) than 45% (M = −0.26, SD = 1.34, M 95% CI = [−0.67, 0.16]), t(91) = −2.65, p = .01, rcontrast = .27.
Similarly, participants rated the 20% minority as more optimally distinctive (M = 0.86, SD = 1.09, M 95% CI = [0.56, 1.16]) and its members as more trustworthy (M = 0.54, SD = 1.49, M 95% CI = [0.14, 0.95]) than the 45% minority (optimal distinctiveness: M = −0.23, SD = 0.95, M 95% CI = [−0.53, 0.06]; trustworthiness: M = −0.23, SD = 1.25, M 95% CI = [−0.63, 0.16]), ts < −2.70, ps < .009, rscontrast > .28. Also, the 20% minority was perceived to be more optimally distinctive and its members more trustworthy than the 80% majority, as indicated by the CIs not including zero. There was no difference between the 45% minority and the 55% majority on perceptions of optimal distinctiveness or trust (i.e., CIs include zero).
Sequential mediation tests
We sought to replicate the mediation effects from Experiment 1, where optimal distinctiveness mediated the effects of relative group size on membership trust, and to extend this model one step further, by demonstrating that individuals will prefer and choose membership in a sufficiently small minority for reasons of membership trust. Such a prediction requires a sequential mediation model, with relative size predicting optimal distinctiveness, which in turn predicts membership trust, which in turn predicts membership choice (or preference; these models are depicted in Figure 2, upper and lower panels, respectively). We tested this model using PROCESS (Hayes, 2016, Model 6), first using membership choice as the outcome measure, and conducting it again with membership preference. We expected analyses with both outcomes would yield consistent effects.
Figure 2 summarizes the coefficients for each of the predicted paths for membership choice (upper panel) and preference (lower panel). Consistent with predictions, the sequential mediation path—namely, that a smaller relative size would yield the inference that the minority group was optimally distinctive, and thus its members more trustworthy, and in turn preferred or chosen more—was supported (bolded line); all paths were in the predicted direction and significant. The direct effect from relative size to membership choice or preference was no longer significant, and tests indicate that the indirect sequential mediation effect was significant on choice (b = 0.57, 95% CI = [0.19, 1.25]; 10,000 resamples) and membership preference (b = 0.55, 95% CI = [0.28, .97]; 10,000 resamples). None of the indirect effect tests through only one mediator was significant on choice or preference, although evidence suggests the effect of relative size on membership preference may also be mediated by optimal distinctiveness alone. While the indirect effect test for this path was not significant, future research would benefit from exploring this potential separate effect with additional testing. Overall, as minority size decreased, the minority was perceived to be optimally distinctive, which provoked greater membership trust, which in turn was associated with minority membership preference and choice (Figure 2).
One possible alternative explanation might be that observers saw intragroup trust as a necessary feature of a less attractive and weaker minority group; perhaps members of such groups have nothing else to depend on, so they depend on each other. This explanation is unlikely and the data in this study help to reject it. If this alternative were supported, we should have found a negative correlation between trust and power ratings; such a correlation would indicate that the more power the majority has, the more observers believe that members of the weaker minority group trust each other. However, we find no such correlation (r = .07; Table 2). Analyzing this correlation within experimental conditions also reveals no correlation between power and trust ratings in the 45% minority condition (r = .15) or in the 20% minority condition (r = .006). Among the data reported in this article, there is no evidence to support this alternative explanation. Trustworthiness thus appears to be a valued attribute of group membership (Cottrell, Neuberg, & Li, 2007; Leach, Ellemers, & Barreto, 2007).
Trust game decision
Analysis of the trust game decision revealed that those who joined the minority gave marginally more (M = 8.52, SD = 2.90) than those who joined the majority (M = 7.36, SD = 3.21), t(91) = −1.94, p = .06, r = .20. Analyzing only participants in the 20% minority condition produced the same pattern; participants gave significantly more money when they joined the minority (M = 8.17, SD = 3.25) than when they joined the majority (M = 6.00, SD = 2.83), t(43) = −2.24, p = .03, r = .20. By contrast, for those in the 45% minority condition, this difference did not reach significance, t = −1.21, p = .22. On the surface, these data appear to support our basic notion that group members will exhibit higher levels of trust and cooperation when they are members of a sufficiently small minority rather than majority group members. Interestingly, in this paradigm, where individuals selected their group membership before engaging in the decision to trust the other party, we may have expected to see no difference in trust game decisions. After all, those who chose to be in the majority would have likely optimized their investment decision given their preferred group membership. It would be helpful to test whether the trust decision effect we find here in this paradigm replicates.
Demographic characteristics
Of note, age and income were not related to any of the dependent measures (ps > .15). Gender yielded a marginally significant effect on membership trust, t(91) = −1.96, p = .052, where women were more likely to trust minority group members (M = 0.40, SD = 1.32) than men were (M = −0.17, SD = 1.50). Gender also yielded a marginally significant effect on group power, t(91) = −1.71, p = .08, where men considered majorities to be more powerful (M = −1.41, SD = 1.14) than women did (M = −0.94, SD = 1.45). However, gender did not moderate any of the effects yielded by the minority size manipulation (ps > .33).
Distinctiveness and inclusion as separate contributors to trust
The combined optimal distinctiveness measure should more strongly predict membership trust than inclusion or distinctiveness scores alone. We explored this assumption by calculating the correlations between membership trust and optimal distinctiveness, inclusion and distinctiveness scores. Positive correlations would indicate that the more distinctive or included the minority is perceived to be, the more participants believed members of the minority group are trustworthy. Table 1 summarizes these correlations in the bottom row.
Consistent with Experiment 1, distinctiveness and inclusion were individually and positively related to trust (and in this study, the correlations were significant) as was the optimal distinctiveness measure, although the optimal distinctiveness correlation was bigger than either distinctiveness or inclusion alone, accounting for 11% to 13% more variance, consistent with the idea that the combined total is more predictive of intragroup trust than either alone. The data are consistent with our predictions, and the effects overall are larger here than they were in Experiment 1, consistent with the notion that the paradigm used in Experiment 2 was more personally relevant, which in turn made the inferences about trust larger.
General Discussion
This article is the first to empirically demonstrate the connections between relative size and intragroup trust as mediated by optimal distinctiveness. Moreover, this is the first article to show, to our knowledge, a membership preference for a 20% minority group in spite of seeing it as less powerful than the numerical majority (Experiment 2). Such data—collected with highly controlled procedures and experimental manipulations—allow for causal inference and rule out additional explanations associated with self-justification (through employing participants as observers rather than group members), brain size (through manipulating relative rather than absolute size), and status (through using minimal groups). These effects were replicated with different samples, procedures, and measures of trust, adding confidence to the findings. Overall, the evidence supports the conclusion that sufficiently small minority group size is associated with optimal distinctiveness, membership trust, and membership preference. Although much of this program was under way prior to psychology’s replicability crisis, we find it encouraging that, given our sample sizes (N = 89, Study 1; N = 93, Study 2) and effect size estimates (.23 ≤ rs ≤ .35), our tests had acceptable observed power ranging from .72 to above .90.
The Function of Relative Size and Optimal Distinctiveness
The evidence reported within this article supports, more generally, the notion that when it comes to decisions related to trust, cooperation, and group effectiveness, a sufficiently small group size is an important determinant. Other literature has identified benefits to optimally sized groups, whether it be more effective coordination (Hackman, 1987) or evolutionary explanations for cooperation rooted in genetics (West, El Mouden, & Gardner, 2011) or ecology (Boyd & Richerson, 1988). What our conclusions indicate, however, is that individuals are aware of such associations and they use them to guide their decision making about groups. Individuals’ attention to a group’s relative size and degree of optimal distinctiveness suggests that, when motivated to do so, individuals seek to balance trade-offs between group capability and sustainability. Individuals care about the cooperative success of their communities, and one way they can safeguard it is by ensuring their communities and groups are perceived by them to be optimally distinctive.
Some evidence supports the idea that individuals will actively regulate the size of their groups. Take the Hutterite community (as described in Dunbar, 1993; Hardin, 1988); these communities typically swell to a particular group size before steps are taken to divide into two smaller communities. Actively managing group size, we argue, is a less aggravating way of adjusting group size when resources run thin relative to means such as starvation, pestilence, or war (Malthus, 1826). Fissioning (as it is called when groups subdivide; Hart & Van Vugt, 2006) can be considered a less aggravating circumstance wherein individuals or their group members could use relative size and perceived optimal distinctiveness to regulate group memberships.
Given increased individual migration patterns later in life, say through the departure from home as individuals enter university or find work, individuals may find such associations helpful as they seek membership in communities that are self-sustaining. In this instance, we can see parallels between a personal life experience and the paradigm used in Experiment 2. As an individual starts life away from parents or guardians and wishes to build a community for himself or herself, to which groups does he or she turn? Were the individual seeking a basis for trust and cooperation, holding all else constant, a group perceived as sufficiently small—one that is perceived to be optimally distinctive—would be one way to do so. We see such parallels between the paradigms used here and some instances of real-life events.
That noted, we expect that existing group memberships—particularly those to which individuals were born or assigned—played an important role in sharing individuals’ perceptions on the relatedness of relative group size, optimal distinctiveness, and membership trust. Evolutionary explanations for cooperation, whether rooted in genetics (Hamilton, 1964), ecology (Boyd & Richerson, 1988), or some combination of the two, propose that cooperation will be sustained with sufficiently small groups. Such theories give rise to the possibility that the structural realities of group life would have reinforced perceived associations people formed between relative size, optimal distinctiveness, and trust throughout an individual’s extended period of dependence by repeated assembly (Caporael, 1997) into groups that are part of larger populations (that would have allowed comparisons of relative size). With such a linkage established between optimal distinctiveness and trust, individuals are expected to cooperate with and trust others who they see as members of their optimally distinctive group, even if the group is vast (but still a minority) and far from their place of origin.
An additional feature goes beyond the scope of this article but would benefit from additional investigation. Limited dispersal, defined as reduced movement and mixing of human groups from natal and breeding sites (for a recent review, see Ronce, 2007), is considered an important boundary condition for distal genetic and ecological theories linking group size and cooperation. Smaller group size is related to greater intragroup cooperation under limited dispersal. It would be interesting to determine whether the perceived connections among relative size, optimal distinctiveness, and intragroup trust depend on the degree of limited dispersal experienced by individuals, perhaps the degree of dispersal during their developmental history.
The Conditions for Membership Trust
A powerful application that this theory and evidence offers is that leaders of groups (even large ones) may facilitate more cooperative interdependence among their members if they frame the group as being sufficiently small percentage of a reference population. It speaks to the potential value that shaping relative size perceptions of the teams, units, and the institution or organization as a whole may have on members of the industry or government. Importantly, as this work demonstrates, it is not enough to be a numerical minority, but rather, a sufficiently small minority, one that would conjure perceptions of optimal distinctiveness. We showed that participants found 20% groups as more optimally distinctive than 45% groups, but it would be helpful to explore whether there is a more precise estimate (or range of estimates) that would be considered optimally distinctive.
Part of what may inform the conditions of membership trust, at least as such perceptions result from the interplay of distinctiveness and inclusion, is to consider how features of these motives coexist and mutually sustain and constrain each other (Brewer, 1991), particularly the interplay of the motives at the same levels of analysis (in opposition) and across levels of self (complementary). Taking these coexisting features of the motives one step further, meeting a need at one level of self (at intragroup or group) is not expected to completely satiate the need at another level of self. For example, individuals may belong to and identify with an optimally distinctive group membership—with between-group distinctiveness and within-group inclusion—and also choose to identify themselves with optimally distinctive subgroups within that group (what has been called “dual identity”; for supporting evidence, see Leonardelli, Pickett, Joseph, & Hess, 2011). In this regard, individuals may achieve optimal distinctiveness at multiple levels of identification, and relatedly, membership trust at multiple levels of identification.
That such needs mutually constrain each other also may help address whether membership trust is likely to manifest with really exclusive minority groups (e.g., 1%). Greater group distinctiveness is presumed to reduce the risk of noncooperation from others, and within-group inclusion is expected to extend expectations of trust to all group members. By this rationale, extremely small groups are also likely to be highly distinctive between-group and highly included within. Groups that are too small are believed to be insufficient to expand capabilities. Moreover, such a prediction neglects the assumption that the needs are in opposition at the same level of analysis; holding all else constant, complementarity (between-group distinctiveness and within-group inclusion) is expected to be an insufficient substitute for, respectively, individual distinctiveness and between-group inclusion.
Consistent with this prediction, evidence has indicated that individuals are less likely to identify with groups that are too small (Abrams, 2009, Study 1; Bearman & Brückner, 2001; Lau, 1989) especially when individuals are motivated to be included in their group (Leonardelli et al., 2011). Future research would benefit from determining whether optimal distinctiveness effects resulting from trust will occur with groups that are extremely small, and whether group identification may indirectly affect trust effects by reducing individuals’ tendency to identify with extremely small groups.
Conclusion
Our findings help to substantiate why individuals in optimally distinctive groups—whether defined by race, music preferences, location, or minimal classification—exhibit greater identification with or support on behalf of their group relative to those in numerical majorities (for a review, see Leonardelli et al., 2010; for example, Abrams, 2009; Badea, Jetten, Czukor, & Askevis-Leherpeux, 2010; Bernardo & Palma-Oliveira, 2012; Blanz, Mummendey, & Otten, 1995; Brewer, Manzi, & Shaw, 1993; Ellemers, Kortekaas, & Ouwerkerk, 1999; Ellemers & Van Rijswijk, 1997; Feather, 1995; Hornsey & Hogg, 1999; Lau, 1989; Leonardelli & Brewer, 2001; Leonardelli et al., 2011; Lücken & Simon, 2005; Pickett, Bonner, & Coleman, 2003; Simon & Brown, 1987; Simon & Hamilton, 1994, Experiment 1; Vignoles & Moncaster, 2007). Specifically, these individuals are supporting group memberships that are perceived to be optimally suited for sustained group cooperation, such that they feel obliged to cooperate on behalf of group members beyond those known through personal connections (Leonardelli et al., 2010). Future research would benefit from exploring at what point (if any) the burden of cooperation outweighs the benefits of shared trust expectations.
Footnotes
Acknowledgements
We thank Jane Yao and Konstantin Chestopalov for help in data collection; Marilynn Brewer, Bill von Hippel, and Bob Lount for comments on former drafts; and the Self and Identity Lab (SAIL) for feedback.
Author Contributions
G.J.L. devised theory with input from D.L.L. G.J.L./D.L.L. devised method and oversaw data collection. G.J.L. analyzed the data and conducted the literature review. Authors cowrote the paper.
Authors’ Note
Early presentations were discussed at the INGRoup Conference (2010) and the Society for Experimental Social Psychology (2013).
Declaration of Conflicting Interests
The author(s) declared no potential conflicts of interest with respect to the research, authorship, and/or publication of this article.
Funding
The author(s) disclosed receipt of the following financial support for the research, authorship, and/or publication of this article: This work was supported by Social Sciences and Humanities Research Council of Canada grant to the first author (410-2010-1221).

Notes
References
Supplementary Material
Please find the following supplemental material available below.
For Open Access articles published under a Creative Commons License, all supplemental material carries the same license as the article it is associated with.
For non-Open Access articles published, all supplemental material carries a non-exclusive license, and permission requests for re-use of supplemental material or any part of supplemental material shall be sent directly to the copyright owner as specified in the copyright notice associated with the article.
