



Abstract
We tested predictions about religiosity and terror management processes in 16 nations. Specifically, we examined weekly variation in Google search volume in each nation for 12 years (all weeks for which data were available). In all 16 nations, higher than usual weekly Google search volume for life-threatening illnesses (cancer, diabetes, and hypertension) predicted increases in search volume for religious content (e.g., God, Jesus, prayer) in the following week. This effect held up after controlling for (a) recent past and annual variation in religious search volume, (b) increases in search volume associated with religious holidays, and (c) variation in searches for a non-life-threatening illness (“sore throat”). Terror management threat reduction processes appear to occur across the globe. Furthermore, they may occur over much longer periods than those studied in the laboratory. Managing fears of death via religious belief regulation appears to be culturally pervasive.
Why are many human beings highly religious? Although answers to this question invite dissension, this question can be addressed empirically. People certainly spend lots of time praying, worshipping, and thinking about religion (Baker, 2008; Crabtree, 2010; Iannaccone & Everton, 2004). Furthermore, there is predictable variation across time and place in the degree to which people do so. For example, there is a strong correlation between national wealth and religiosity (Crabtree, 2010). In the world’s poorest nations, nonbelievers are rare. In Indonesia, Niger, and the Philippines, 96% to 99% of residents say religion plays an important role in their daily lives (Crabtree, 2010). Conversely, in the world’s wealthiest nations, nonbelievers often outnumber believers. In Japan, Hong Kong, and the United Kingdom, only about 25% of residents say that religion plays an important role in their daily lives. Work in human cultural evolution suggests that it is actually pathogen load (exposure to major communicable illnesses) rather than wealth per se that predicts religiosity across nations (Fincher & Thornhill, 2012). In any case, religion thrives where life is very difficult.
Religiosity has also varied across time. Today, most European nations guarantee their citizens freedom of worship. In Galileo’s day, the church guaranteed that no one disagreed with Ptolemy. Many Western nations are becoming increasingly agnostic. Franck and Iannaccone (2014) argued that many Westerners are becoming secularized because governments now provide social safety nets that the church once provided (see also Hungerman, 2005). Although scholars debate the exact reasons for secularization, there is a growing consensus that it is occurring in most wealthy countries (Berman, Iannaccone, & Ragusa, 2012; Bruce, 2011; Pew Forum on Religion and Public Life, 2012; Saad, 2015; but cf. Fuller, 2001).
From Iannaccone and Everton’s (2004) perspective, much of this is economics. The market for religion is shrinking. Economists suggest that the same market forces that determine how often people eat canned tuna determine how often people gather to recite the Canon. Places of worship satisfy basic human needs that range from safety and nutrition to connectedness and inner peace. They thus compete with other activities and organizations that fill these same needs. Iannaccone and Everton (2004) argued that weekly church attendance is tightly connected to opportunity costs. People are less likely to attend worship services when delightful weather means that competing activities (e.g., a day at the beach) are especially appealing. By the same token, major religious holidays, which offer would-be celebrants perks such as egg hunts and living nativities, typically bring in a cornucopia of believers.
Sociological and economic views of religion provide insights that help explain phenomena as diverse as suicide and weekly church attendance. In fact, modern sociology was arguably born when Durkheim (1897/1951) published his famous monograph on the sociodemographic and religious correlates of suicide. Although some of Durkheim’s findings have proven controversial, Durkheim’s sociological view of religion remains influential. Durkheim viewed religion as a socially constructed extension of the power of social ties. He argued that society could transcend even the complete death of religion—as long as people recognized shared social bonds.
In this report, we argue that economic and sociological models of religion provide only part of the picture. Psychological factors matter, too. A case in point comes from terror management theory. Inspired by anthropologist Ernst Becker (1973), terror management theory argues that managing our knowledge of our own mortality requires human beings to develop a shared set of cultural worldviews (Pyszczynski, Greenberg, & Solomon, 1999; Solomon, Greenberg, & Pyszczynski, 2015). Specific cultural worldviews vary radically across cultures, but the fact that they are widely shared within a given culture reinforces their subjective validity (Hardin & Higgins, 1996). Cultural worldviews in the United States include the idea that we are the land of opportunity, that God smiles upon us, and that even the Chicago Cubs could win a World Series every 100 years or so.
Hundreds of studies support terror management theory. Human beings do seem to cope with their fear of death by defending their cultural worldviews. For many, this includes believing that although your physical body will someday die, your soul will not. According to terror management theory, it is no accident that practically every world religion promotes a belief in an afterlife. A central tenet of terror management theory is the mortality salience hypothesis: When we have recently been reminded of our own deaths, we work harder than usual to validate our cultural worldviews. In a typical terror management experiment, some people provide brief descriptions of their own physical deaths. Others write about a control topic (e.g., a distressing but death-irrelevant topic). After such mortality salience manipulations, people defend their cultural worldviews more vigorously than usual (Burke, Martens, & Faucher, 2010). For example, people who have recently been thinking about their own deaths become reluctant to use a cross as a hammer or to stain a small U.S. flag to solve a difficult problem (Greenberg, Simon, Porteus, Pyszczynski, & Solomon, 1995; see also Weise, Arciszewski, Verlhiac, Pyszczynski, & Greenberg, 2012).
Research also supports a terror management function of religious beliefs (for reviews, see Soenke, Landau, & Greenberg, 2013; Vail et al., 2010). Lab studies have shown that (a) deeply held religious beliefs can reduce worries about death (Jonas & Fischer, 2006), (b) threatening the validity of people’s religious beliefs increases the accessibility of death-related thoughts (Schimel, Hayes, Williams, & Jahrig, 2007), and (c) mortality salience manipulations increase the strength of religious beliefs (Norenzayan & Hansen, 2006; Vail, Arndt, & Abdollahi, 2012). Although numerous studies converge to suggest that terror management process influence religious beliefs, almost all previous studies have been laboratory experiments focusing on small temporal windows. We know almost nothing about whether terror management processes influence the way people navigate their daily lives, over weeks rather than minutes.
If interest in religion varies over time, and if concerns about death increase interest in religion, changes in the degree to which people are thinking about topics closely related to death might predict changes in how much they later think about religion. Thinking about cancer this week, for example, may make people more likely to think about God next week. This hypothesis might seem difficult to test. Studies of attendance at religious services provide insights into weekly religious behavior, and studies of public opinion about religion reveal how collective religious views change over time. But is it possible to assess both weekly concerns about death and weekly interest in religion in large populations? If people rely on Internet search engines to explore their interests, the answer may be yes.
The Google research tool “Google Trends” allows researchers to assess weekly changes in Google Internet search volume for a wide range of search terms. What specific search terms might suggest collective concerns about death? The present research focuses on one potential answer: major (life-threatening) illnesses. Research shows that thoughts of health and death are closely intertwined. For instance, getting people to think about health problems, health risks, or health-related issues increases people’s thoughts of death. This list includes smoking (Hansen, Winzeler, & Topolinski, 2010), unprotected solar exposure (Cooper, Goldenberg, & Arndt, 2014), binge drinking (Jessop & Wade, 2008), risky sex (Grover, Miller, Solomon, Webster, & Saucier, 2010), and even insurance (Fransen, Fennis, Pruyn, & Das, 2008). Even getting a breast exam (Goldenberg, Arndt, Hart, & Routledge, 2008) arouses thoughts of death for women. Furthermore, very brief exposure to the word “cancer” can increase the accessibility of thoughts about death (Arndt, Cook, Goldenberg, & Cox, 2007). In light of such findings, it makes sense that more than 60% of people in a representative survey reported that when they think of cancer, they automatically think of death (Moser et al., 2014). When people search for life-threatening diseases, death-related concerns may also be activated.
Can Google search terms really serve as a reliable proxy for the thoughts of millions of people? Yes. The U.S. week-by-week Google search volume for terms such as “flu” and “influenza” have proven to be very highly correlated with official week-by-week assessments of the prevalence of the flu across the United States—as determined by the U.S. Centers for Disease Control and Prevention (CDC; Ginsberg et al., 2009). To be clear, the algorithms Google developed in the hopes of predicting future outbreaks of the flu in specific regions of the United States have been far from perfect (Lazer, Kennedy, King, & Vespignani, 2014). However, even critics of the original Ginsberg et al. (2009) influenza prediction paper acknowledge that—at the national level—weekly Google search volumes effectively capture weekly variation in things like influenza levels. It should thus be possible to treat weekly Google search volumes as indicators of the public’s collective interest in almost anything—from cancer to Christmas.
We thus examined variations in weekly Google search volumes for major illnesses and for key religious terms. Based on the idea that mortality threats facilitate increased interest in religious ideas, we expected to see that heavier than usual search volumes for life-threatening illnesses in a given week would predict increases in religious search volumes in the following week. Before conducting our primary investigations, however, we conducted a pilot study to assess the face validity of our approach. We next assessed whether there is seasonal variation in (a) the volume of searches for major illnesses and (b) the volume of searches for religious terms. Building on these preliminary studies, we then conducted studies in 16 nations in which we predicted temporal changes in the volume of religiously themed Google searches from the recent volume of searches for major illnesses.
Study 1: Methods, Results, and Brief Discussion
In Study 1, we harvested data available in Google Trends in late April of 2016—to assess weekly U.S. search volume for 2004-2016 for the major holidays “Easter,” “Independence Day,” “Halloween,” and “Christmas.” We also assessed weekly search volumes for one term strongly associated with summer and one strongly associated with winter, namely, “sunglasses” and “ski trip.” We expected search volumes for each holiday to increase in the weeks leading up to that holiday and to drop off quickly thereafter. We also expected the search volume curves to be much flatter for the two seasonal terms than for any specific holidays. As shown in Figure 1, this is what we observed. Note that relative to Independence Day, Easter had a wider window of elevated search volume, presumably because it occurred as early as March 22 and as late as April 24 in this 12-year window. It is also no accident that search volume for “sunglasses” greatly exceeded that for “ski trip” throughout the summer. This situation predictably reversed in the fall and winter. Apparently, public interest in things as diverse as skiing and Easter can be discerned from weekly Google search volumes.
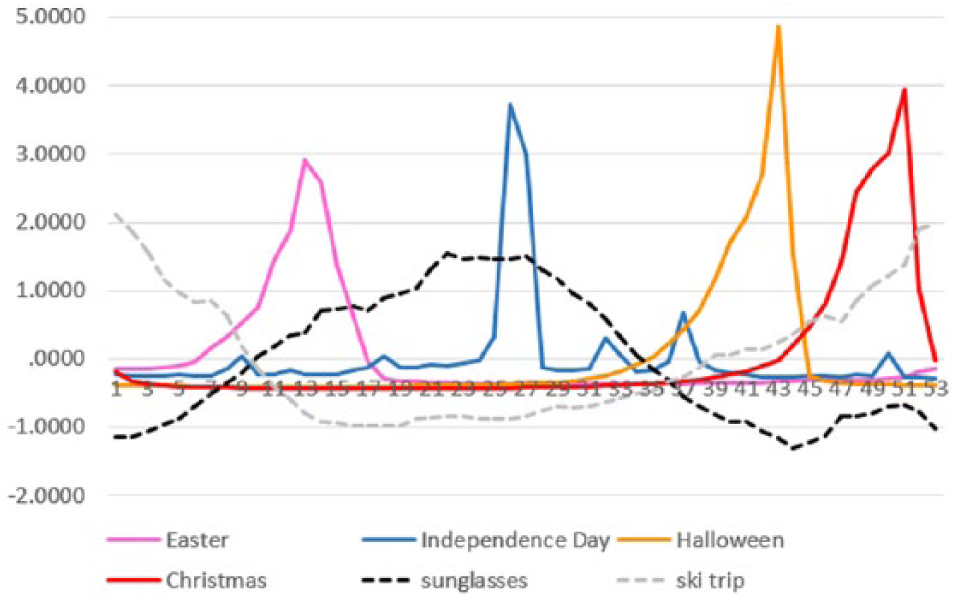
Weekly U.S. Google search volume for four major holidays and two terms strongly associated with summer or winter (2004-2016). The x axis is week of the year.
Study Set 2a: Methods, Results, and Discussion
Public interest in ski trips fits a predictable seasonal pattern. But does public interest in major illnesses or religious ideas follow any pattern? Research using official records of church attendance has shown that church attendance among Christians increases dramatically for Christmas and Easter services (Iannaccone & Everton, 2004). This research also identified seasonal patterns. Church attendance reaches a low point in the summer, is much higher than usual in the spring and fall, and falls somewhere in between the extremes in the winter. Iannaccone and Everton (2004) suggested that winter church attendance is mediocre because winter can either facilitate or disrupt attendance. Whereas mild winter weather can reduce the appeal of competing activities, severe winter weather can reduce the appeal of leaving one’s home. It would not be very surprising if public interest in religious ideas followed a similar seasonal pattern. If public inquiries about life-threatening illnesses also followed such a seasonal pattern, this would begin to suggest that collective interest in religion is influenced by collective thoughts of major illness.
In Study 2, we assessed seasonal variation in Google search volume for (a) three major illnesses (“cancer,” “diabetes,” and “hypertension”) and (b) three major concepts that are central to Christianity (“God,” “Jesus,” and “prayer”). Both our major illness measure (α = .88) and our religiosity measure (α = .76) proved to be internally consistent. Our choice of these terms was both conceptual and empirical. In the case of major illnesses, we began with a list of the four noncommunicable diseases that (according to the CDC) most often lead to death in the United States. We thus included search volume data for “heart attack,” for example, to cover heart disease. However, adding this term to the major illness search measure dramatically reduced the measure’s internal consistency (from α = .88 to α = .58). We also excluded terms for respiratory illnesses such as “cold” and “flu,” for three reasons: (a) respiratory illnesses are not usually perceived as life-threatening; (b) respiratory illnesses are communicable, and we wished to distinguish our findings from the effects of pathogens; and (c) many upper respiratory illnesses failed to yield any hits (any data) in pilot tests for nations other than the United States. For the measure of religious content, we initially included a search for “church,” but including this term would have reduced the reliability of the measure (from .76 to .69).
We also considered assessing variation in search volume for terms such as “death” and “homicide.” However, we quickly found that in the nations we hoped to study, these terms often yielded no data whatsoever (probably because Google Trends censors sensitive searches). This would have made cross-national comparisons impossible. It is worth adding that a central tenet of terror management theory is that subtle reminders of death typically lead to worldview defense. Obvious reminders of death usually do not do so (unless people have time to forget about them consciously). It is thus likely that even if one could obtain Google Trends search volumes for words like “death” in many nations, such blatant indicators would not yield the subtle effects examined here (Greenberg, Pyszczynski, Solomon, Simon, & Breus, 1994). In contrast to this problem, almost all of the specific terms for major illnesses and religion that we selected in the United States yielded hits in all of the other nations we studied. Occasionally, Google Trends yielded data for only two of the three indicators we identified. For example, “cancer” yielded no hits in New Zealand. Instead of ignoring New Zealand, we created a two-item composite major illness measure for New Zealand. We also examined several potential indicators of minor illness in the initial study of the United States (e.g., “bronchitis”). We chose “sore throat” because pilot tests showed that this was the only measure (or its translation) that yielded hits in all 16 nations we studied.
To see whether searches for major illnesses were related to religious searches, we assessed the search volume for both variables in the United States by season. To see if our findings extended to other English speaking countries, and to see if the effects were truly seasonal, we replicated our findings not only in Canada, Ireland, and the United Kingdom but also in Australia and New Zealand (where the seasons are reversed). As shown in Figure 2, there was seasonal variation in searches for major illnesses and for religious searches. A one-way ANOVA treating individual weeks as the unit of analysis, and treating season as the four-level independent variable, yielded significant effects for both search categories (illness and religion) for all six nations, all ps < .001. Moreover, the two different seasonal patterns were strikingly similar within each of the six countries. Averaging across nations, the search volume patterns for both major illnesses and religiosity strongly resemble patterns of actual church attendance (Iannaccone & Everton, 2004). Although there was cross-national variation, search volumes were generally lowest in the pleasant days of summer, highest in the fall, and modest in the spring and winter. In all six nations, however, the summer dip in searches for both major illness and religious content represented a significant deviation from all other months, all ps < .001. It is a bit surprising that, even in the Northern hemisphere, religious search volume was always at least slightly higher in the fall than in the spring (all ps < .001)—despite the fact that there is no religious holiday in the fall to balance out Easter in the spring. (This pattern is less surprising for Australia and New Zealand, where Easter comes in the fall).
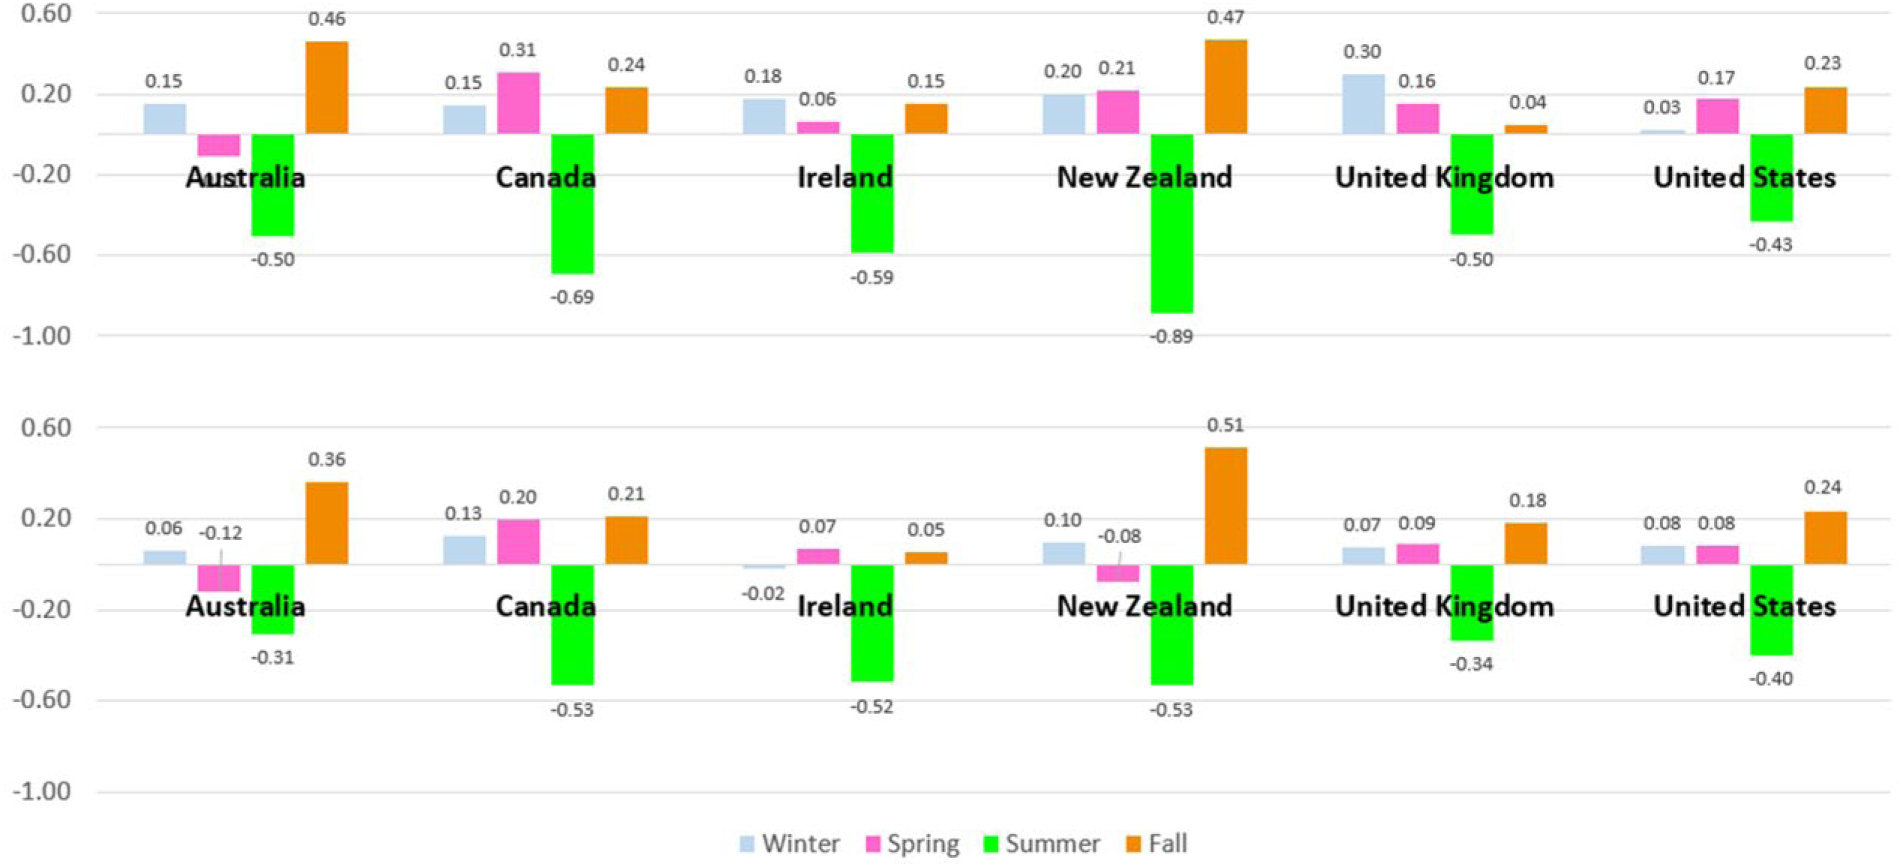
Seasonal variation in volume of major illness searches (top panel) and religious searches (bottom panel) in six English speaking nations.
Thoughts of death may foster religious thoughts. However, one critique of these findings is that Internet search volume simply drops across the board in the summer. Note, though, that this did not prevent us from observing a large increase in summer searches for “sunglasses” (see Figure 1). Furthermore, Figure 1 also shows that the summer lull in searches for “Halloween” and “Christmas” is no lower than the spring lull for these same holidays. It is also hard to explain these findings in strictly pragmatic or economic ways (as others have explained church attendance). It may be hard to attend one’s home church during a beach vacation, but it should be easy to Google “Jesus.” As the long days of summer give way to the dwindling days of fall, people’s thoughts may drift toward illness and death for psychological reasons. College students report that they consider fall “a transition to winter” whereas they do not consider summer a transition to fall (Pelham, 2017a). When people’s thoughts turn to life-threatening illnesses, religious thoughts may prove to be a highly reassuring response.
Before we address our main research question in a more direct way, it might be useful to see if the findings of Study 2 would replicate in other cultures. Although most terror management studies have been conducted with Western samples, terror management processes do seem to occur in non-Western cultures. Heine, Harihara, and Niiya (2002) found that Japanese participants who had recently been thinking about their own mortality were more critical of an essayist who criticized Japan. Fernandez, Castano, and Singh (2010) found that both naturally occurring and experimentally manipulated levels of mortality salience led to greater worldview defense among Indian Hindus. Finally, Vail et al. (2012) found that Iranian Muslims who were reminded of their mortality increased their belief in Allah but decreased their belief in alternative deities (see also Pirutinsky, 2009). To our knowledge, however, no other studies have assessed religiosity as a worldview defense process in non-Western nations. Study Set 2b assessed whether the findings of Study Set 2a would replicate in the six Spanish-speaking Latin American nations for which data are available at Google Trends.
Study Set 2b: Methods, Results, and Discussion
Study Set 2b was an exact replication of Study Set 2a except that we focused on the six Spanish-speaking Latin American nations for which data were available. The nations were Argentina, Chile, Colombia, Mexico, Peru, and Venezuela. To replicate Study 2a, the bilingual fourth author (M.C.) and the semilingual first author (B.P.) independently translated all of the English search terms into Spanish. Agreement was perfect. “Prayer,” for example, became “oración.” The results for the Latin American countries appear in Figure 3. Considering the fact that three of these nations sit very near the equator (with Mexico in the Northern hemisphere and Argentina and Chile in the Southern), the patterns are predictable. The pattern for Mexico, for example, is a weaker version of the U.S. pattern. The pattern for Peru is even stronger than the U.S. pattern. The differences between summer and fall seen elsewhere disappear completely for Colombia, which enjoys a mostly tropical climate. Of course, these Latin American nations all enjoy warm, temperate weather. This may help explain the small differences in the volume of searches for both major illnesses and religious terms in most of these nations (Chile and Peru being exceptions). Although the parallels between major illness volume and religious search volume in these Latin American nations are not as striking as those observed in the English-speaking nations, it is clear that, seasonally, search rates for major illnesses and religious content go hand in hand in these nations.
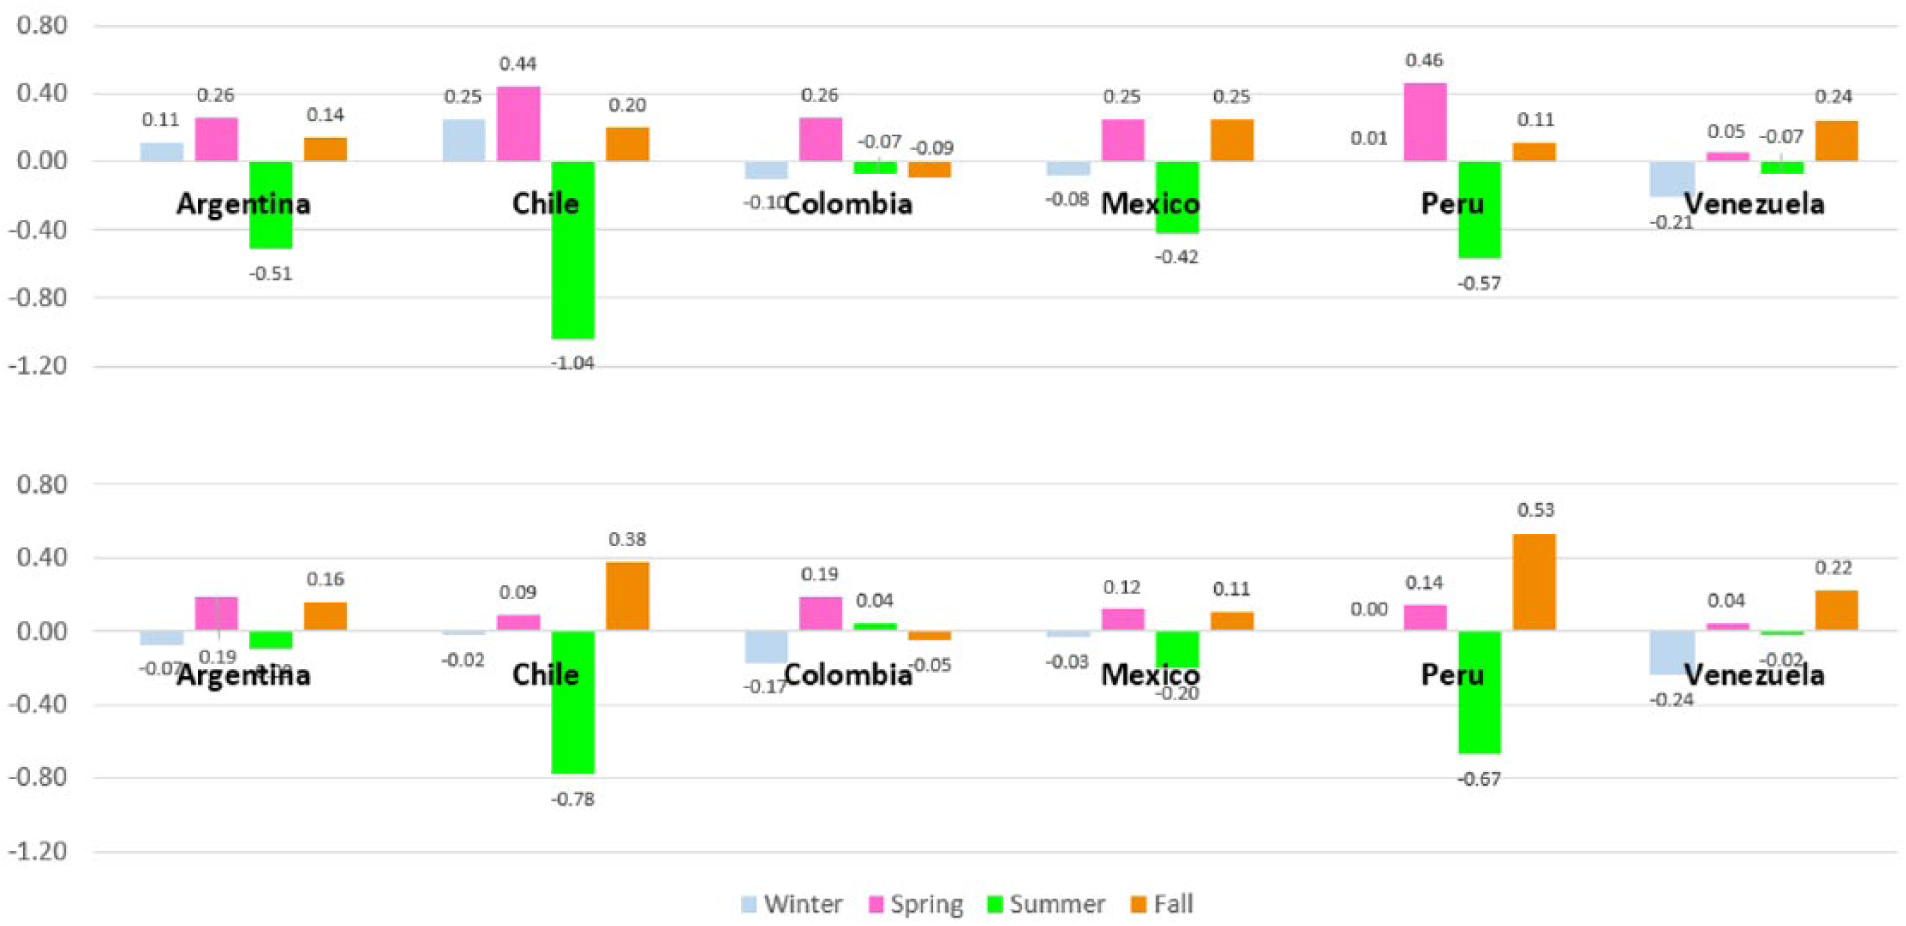
Seasonal variation in volume of major illness searches (top panel) and religious searches (bottom panel) in six Latin American nations.
Study Set 3: Methods, Results, and Discussion
In Study Set 3, we submitted data from the nations in Study Sets 2a and 2b to more sophisticated analyses that included several important statistical controls. These analyses were always simultaneous multiple regressions in which weekly search volume rates were the individual data points. In these analyses, we predicted levels of religious search volume in the present week (week x), from six predictors: (a) religious search volume in week x – 1, (b) year (coded as a linear, continuous variable), (c) “Easter” (or a variant of “Pascua” in Spanish) in week x, (d) “Christmas” (“La Navidad”) in week x, (e) major illness searches in week x, and (f) sore throat (“dolor de garganta”) in week x. We controlled for religious search volume in the prior week (x – 1) to allow us to assess changes in religious search volume rather than simple variation in it. We controlled for year because we noticed yearly variation (in the form of linear trends) in religious search volume in most nations. Failing to control for year could conceivably conflate average yearly levels of religiosity with the week by week changes in which we were interested. We controlled for “Easter” and “Christmas” because worship behavior increases in these holiday windows.
As explained previously, we also included “sore throat” as a health-related predictor. As a reminder, we knew that in North America, sore throats are less common in the summer—when religious attendance is lowest. Recall also that sore throats are usually connected to communicable illnesses whereas none of our major illnesses are communicable (Fincher & Thornhill, 2012). Of course, controlling for “sore throat” also makes for specific hypothesis tests involving illnesses that are life-threatening—rather than illnesses that are merely a source of unhappiness. We expected that even after controlling for all of the other predictors, higher than average search volumes for major illnesses in a given week would predict increases in religious search volume for that same week.
Results for English-Speaking Nations
Focusing on the English-speaking nations, Figure 4 reveals strong support for predictions. First, the standardized regression coefficients for both recent religious search volume (for week x – 1) and calendar year were robust in all six nations (even the small effect for year in New Zealand was significant). Thus, two strong predictors of religious search volume in a given week were (a) the average religious search volume for that specific year and (b) the religious search volume for the week immediately prior to the to-be-predicted week. Easter and Christmas also yielded robust effects—which support research on church attendance during religious holidays. The findings for Easter and Christmas also support the validity of the Google Trends research tool. More importantly, we also observed the predicted effects for major illness search volume in all six English-speaking nations. The standardized regression coefficients ranged from β = .16 in the United States to β = .38 in Australia, all ps < .001, with an average of β = .24. In contrast to these findings for major illnesses, there was no average effect for “sore throat” (average β = –.01). When major illnesses such as cancer and diabetes are in the national consciousness in a given week, national levels of interest in religious terms show increases from the previous week.
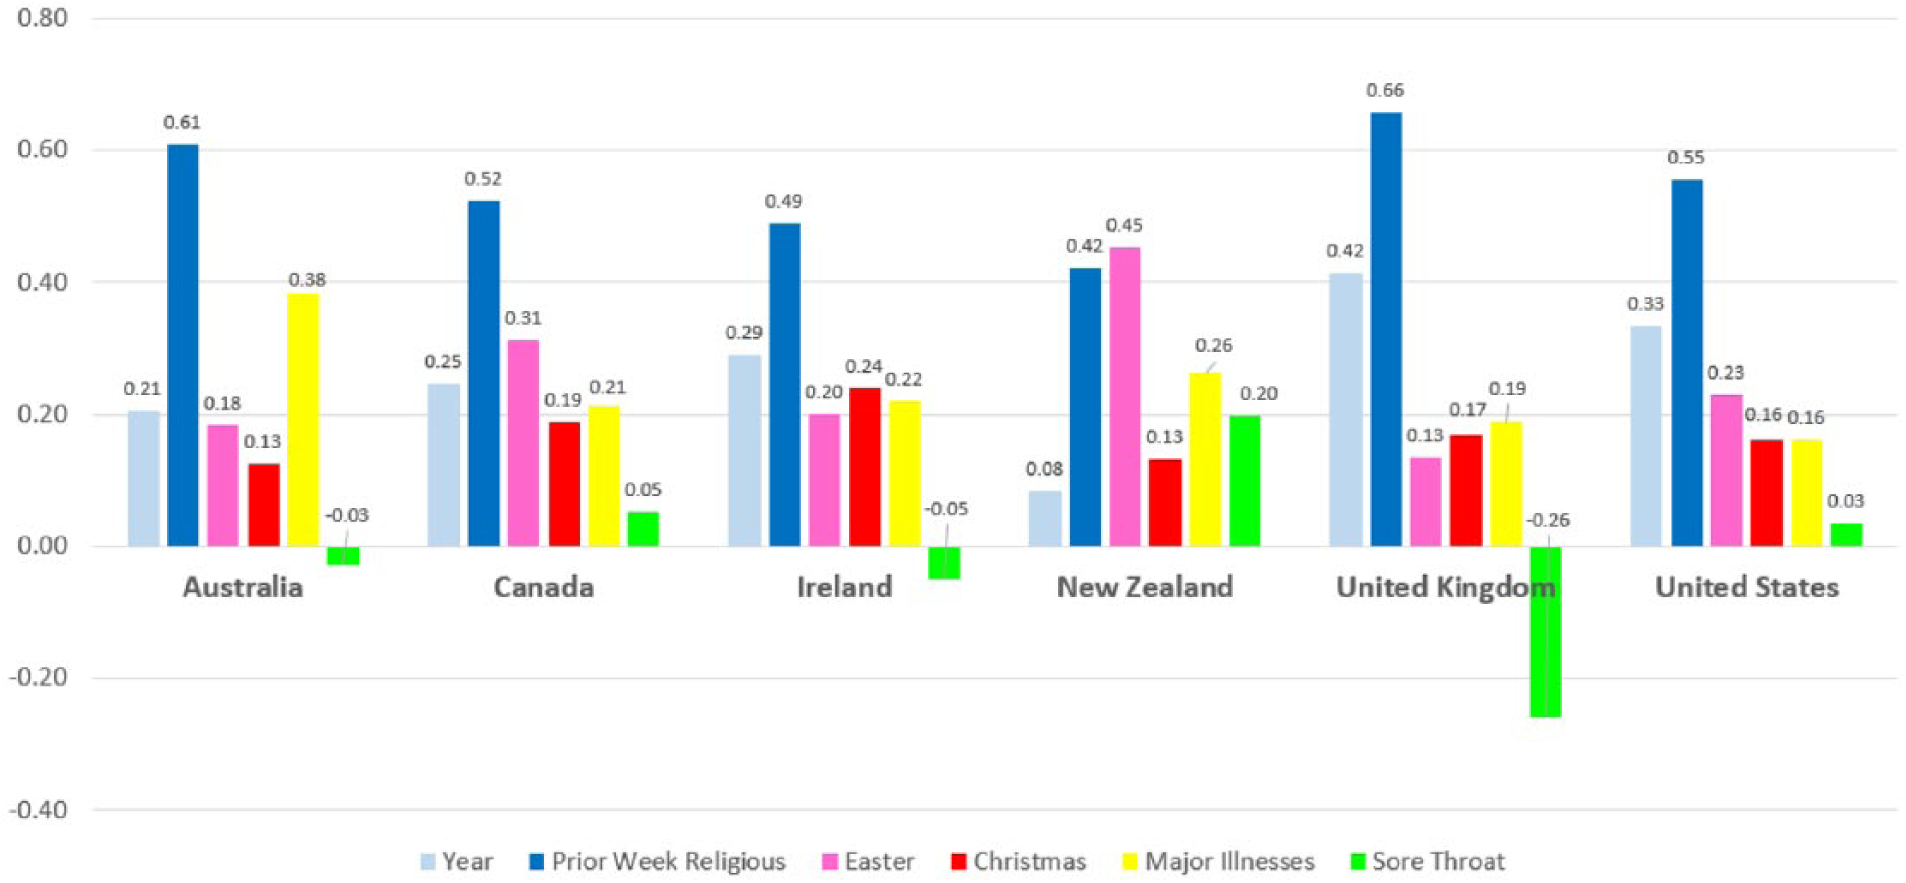
Predictors of weekly variation in religious search volume in six English-speaking nations.
Results for Latin American Nations
As shown in Figure 5, the results for Latin America also supported predictions. This includes the finding that high search volume for major illnesses predicted increases in religious search volume. However, a comparison of Figures 4 and 5 reveals that the effect sizes in Latin America were somewhat smaller than those in the English-speaking nations. This was true for the effects of the religious holidays as well as for the effects of the major illness index. For Easter, the average effect size dropped from a value of β = .25 in the English-speaking nations to an average of β = .20 in the Latin American nations. The comparable respective values for Christmas were β = .17 and β = .09. Along the same lines, the average effect size of β = .24 for major illnesses in the English-speaking nations was reduced to β = .16 in the Latin American nations. Nonetheless, the effect of major illnesses was significant in each individual Latin American country, all ps < .01.
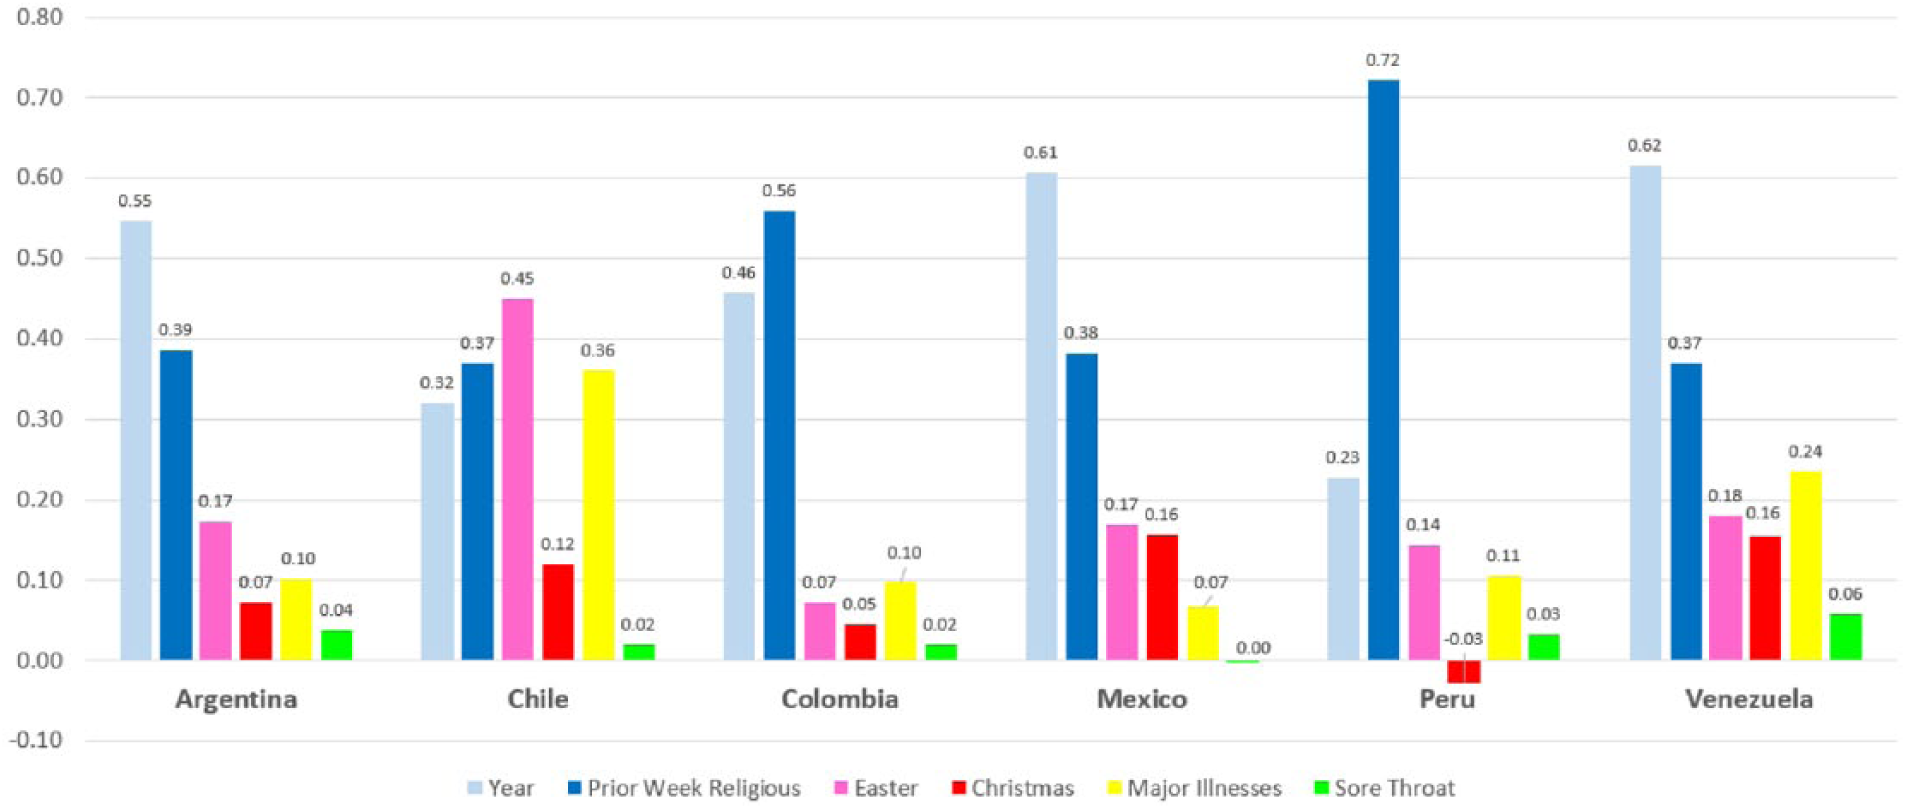
Predictors of weekly variation in religious search volume in Six Latin American Nations.
Which Illnesses Mattered?
Did one particular major illness drive these findings? No. The three major illness scores all mattered. When we tested each illness alone (rather than using the composite), every illness yielded a significant terror management effect in the predicted direction for 34 of the 34 analyses for which there were data. Furthermore, as shown in the left hand column of Table 1, the composite measure of major illness searches was highly reliable (for a three-item measure) in all 12 nations (as well as elsewhere in the world).
Reliability (Cronbach’s α) of the Major Illness Search Volume Measure and the Religious Search Volume Measure in All 16 Nations Studied.

Note. Composite scores for which only two indicators were available are marked with an asterisk. Religiosity search scores for India were based on a five-item measure.
Which Religious Terms Mattered?
In contrast to the measure of major illness search volume, the measure of religious search volume was not internally consistent in all 12 nations. As shown in the right hand column of Table 1, three of the first 12 reliability scores were extremely low. Did some specific religious search terms drive these terror management findings? Again, the answer was no. When we tested each religious term alone (e.g., Jesus searches alone, controlling for Jesus searches alone the prior week, along with all of the other predictors), we observed a significant finding (at p ≤ .001) in the predicted direction for 30 of the 34 possible hypothesis tests (two scores for individual religious terms were missing across the 12 nations).
Does the Causal Arrow Run Both Ways?
One can ask not only whether elevated interest in major illnesses predicts increased interest in religion but also whether elevated interest in religion predicts increased interest in major illnesses. For example, increased interest in religion might promote attendance at religious services, where worshippers learn about unhealthy fellow worshippers. It would also be loosely consistent with terror management if people who have recently been thinking about their faith become more willing than usual to think about major illnesses (Edmondson, Park, Chaudoir, & Wortmann, 2008). Did religious search volume in a given week predict increases in major illness search volume? To see, we conducted multiple regression analyses that switched (a) the measure of major illness searches and (b) the religious search terms. In these analyses, for example, we controlled for search volume for major illnesses in week x – 1, just as we had controlled for search volume for religious terms in week x – 1.
These analyses revealed that elevated interest in religion in a given week did, in fact, predict increases in search volume for major illnesses. However, the average effect size for religious search volume in these reverse causal models was about half as large as the average effect size observed for major illness searches. Furthermore, when it came to the effects of the religious holidays, the results changed dramatically. Search volumes for Easter and Christmas were consistently negative predictors of increases in search volume for major illnesses. When people are focused on making holiday preparations, they may be too preoccupied to ponder major illnesses.
Do Other Temporal Models Fit the Data?
In any prospective study, researchers face difficult decisions about causal windows. Arguably, a superior way to test our hypotheses about terror management processes would be to predict changes in religious search volume in week x + 1 from (a) religious search volumes in week x – 1 and (b) all of the other conceptual predictors, all assessed in week x. In this way, all of the presumed causes would clearly precede the presumed consequence. In analyses in which we made this adjustment, we observed robust effects of major illness search volume in all 12 nations. In fact, the average effect size for the English-speaking nations increased from β = .24 to β = .35. The average effect size for the Latin American nations also increased, albeit slightly (from β = .16 to β = .19). These effects are robust.
Degrees of Freedom
Critics of research that treats temporal or geographic units as the unit of analysis often argue that because individual observations are not independent, traditional statistical models may be biased toward Type I errors (false positives). In these studies, we treated the 7,560 weekly observations (630 per nation) as separate scores. To be more conservative, we treated the standardized regression coefficients in each of our 12 separate studies as single data points and conducted a one-sample t test to see if the average positive effect (M = 0.20 across the 12 nations) differed statistically from the null hypothesis value of zero (Pelham & Carvallo, 2015). It did, t(11) = 6.92, p < .001. Our findings are not an artifact of statistical nonindependence. It is worth adding that we chose these 12 nations on a prori basis and that we did not conduct tests in any other nations (expect for the four Asian nations to be discussed).
Confidence Intervals
Readers may have noticed that we do not report 95% confidence intervals for effects sizes in this report. This is because such confidence intervals would not be useful. Confidence intervals provide an estimate for a population parameter for a statistic based on the assumption of randomly sampling data points (usually people). The values we present are population values for 12-year windows, and we do report the average population value across the nations we were able to study. When one has access to multiple populations, as we did, the average effect size and the range of the effect sizes across those nations constitute the best possible indicators of the typical magnitude and the replicability of an effect. Confidence intervals would add nothing. Two things we did necessarily “sample” are time and nations. Although we used all of the Google data that were available at the time of data-harvesting, one can never know for sure if these patterns will hold up in the future (except by waiting). Confidence intervals do not predict the future. As far as nations go, we sample four more nations in Study 4, and the only way to sample even more nations would be to collaborate with experts who are fluent in additional languages. A social scientist fluent in Arabic, for example, could spend less than a day to see how well the effects reported here replicate in Saudi Arabia.
Culture
Studies 1 to 3 focus on majority-Christian nations. This limitation applies even to the six highly collectivistic Latin American nations we studied. In much of Asia, in contrast, religions such as Buddhism, Hinduism, and Islam predominate. Do our findings extend to nations with other faith traditions? Study 4 addressed this question by focusing on the Philippines, India, Japan, and Malaysia. These four Asian nations collectively include a very wide range of faith traditions. We chose these nations merely because we had cultural and linguistic expertise (or assistance) regarding them.
Study 4: Replications in Four Eastern Cultures
It was challenging to extend our analyses to non-Western nations. First, there are no African nations whatsoever in the Google Trends database (presumably due to low Internet penetration). There are several Asian nations in the Google Trends database. In all of these nations, replication issues include not only language use but also specific religious traditions, which vary dramatically across nations. We discuss each of these issues, country by country.
The Philippines
We began by translating all of our search terms into Tagalog. We then asked a bilingual native speaker of Tagalog (Mariah Pelham) to back translate the terms into English. However, a feasibility test revealed that the majority of the Tagalog terms simply yielded no hits. We discovered, however, that all of the English terms we had used in our original studies yielded hits for the Philippines. We thus proceeded in English. This is not as problematic as it might seem, because more than 90% of Filipinos speak English (CIA World Factbook). Nonetheless, it may reassure readers to learn that when we made partial indicators of our primary measures using all the Tagalog terms that did yield hits in Google Trends, we observed significant effects that paralleled those we present here. As shown in the bottom of Table 1, reliabilities in the Philippines were good to excellent, as were reliabilities in all other Asian nations except for Japan.
Japan
Our native Japanese-speaking author (M.S.) tabulated the Japanese data using a phonetic keyboard to create search terms in Kanji. Recognizing that Japan is a highly secular society, we nonetheless tried to develop a measure of religiosity. The religious terms we searched included Bukkyo (Buddhism), syukyo (religion), and jinjya (shrine). Jinyja proved to negatively correlate with the other two religious terms, and so we deleted it. Even after eliminating “Jinjya,” however, our measure of Japanese religious search volume had poor reliability (α = .31). We thus report the results for the composite as well as for the two separate measures in Figure 6. Based on M.S.’s cultural expertise, we selected Syogatsu (a “New Year’s” holiday period in which people visit shrines or temples) and Bon (an August festival associated with ancestor reverence) as holidays. The Japanese translations for our major illnesses were gan (cancer), Tounyobyo (diabetes), and Kouketsuatsu (hypertension). The major illness search volume composite had acceptable reliability (α = .70).
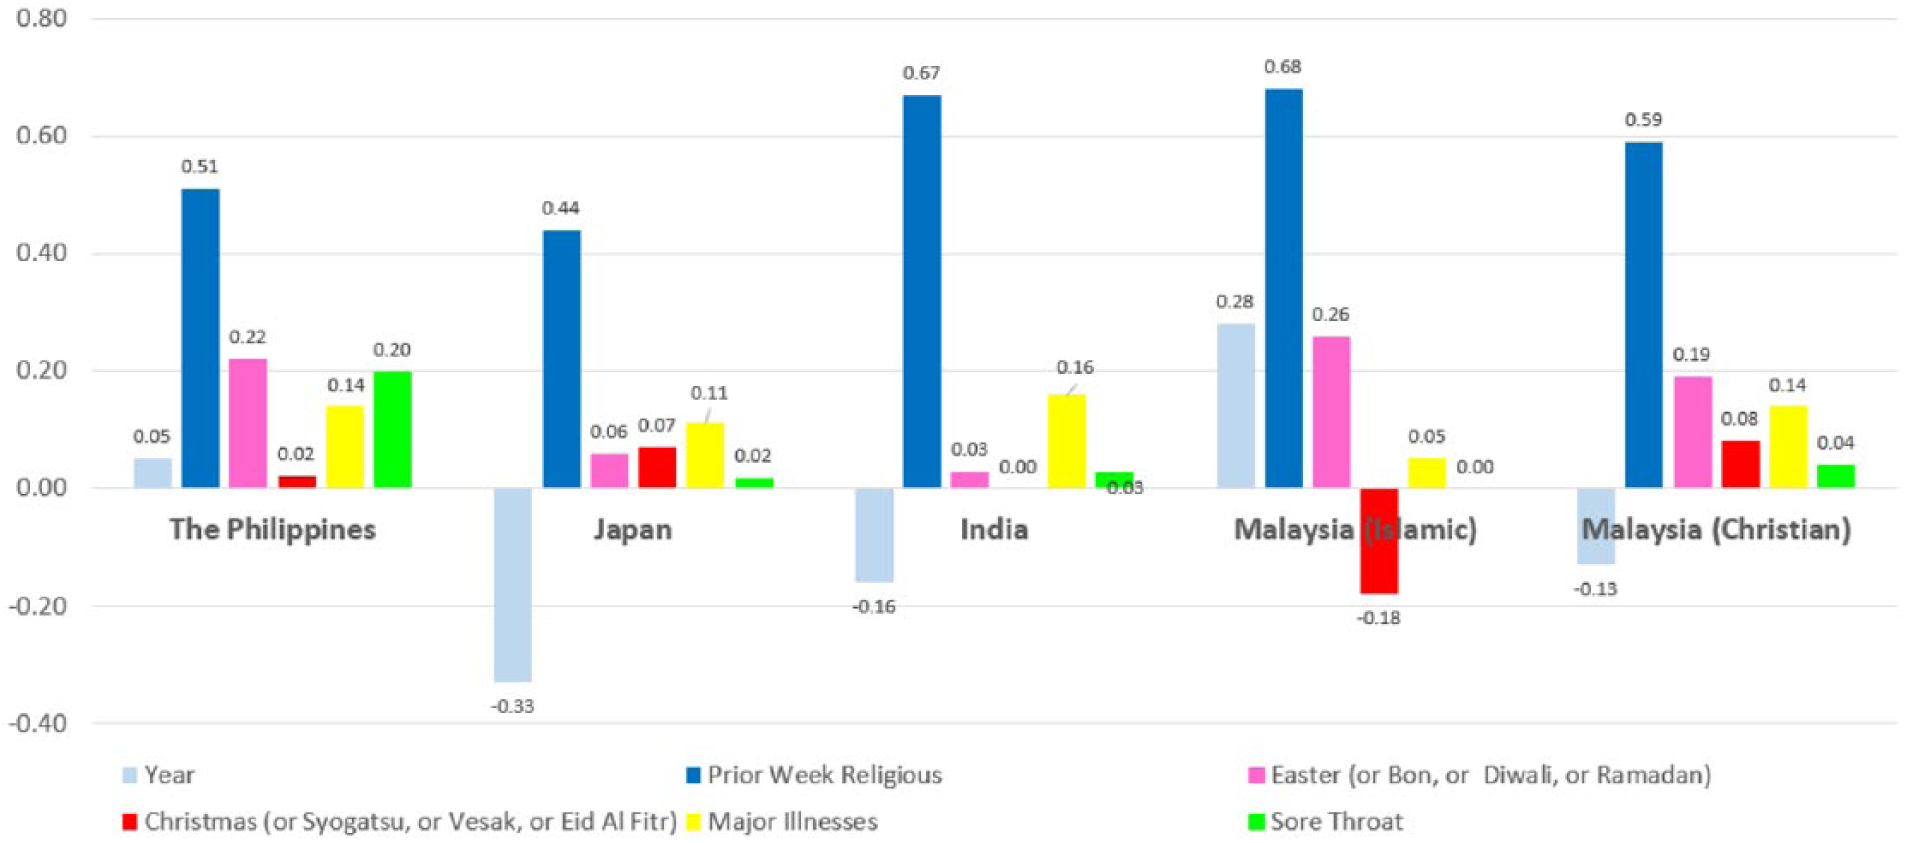
Predictors of weekly variation in religious search volume in the Philippines, Japan, India, and Malaysia.
India
In contrast to Japan, India is a deeply religious nation. India is also a land of tremendous cultural and religious diversity. Because English is used frequently in Internet searches in India, and because we had no access to native speakers of Indian languages, we searched for India in English. Of course, Indians who (a) have access to the Internet and (b) perform Google searches in English might differ from Indians in general. This linguistic concern might be less serious than it seems at first blush. As N. Bose (personal communication, February 28, 2011) argued, “Two centuries of British colonial oppression have done wonders for Indian fluency in English.” In the most recent English Fluency EPI rankings (http://www.ef.edu/epi/), India ranks 22nd (out of 72 nations). This being said, Indians who search Google in English almost certainly have higher socioeconomic standing (SES) than the Indian population. Given that SES is negatively correlated with religiosity, this bias could work against predictions because religion is less likely to serve a death-buffering function for the wealthy and educated (Norenzayan & Hansen, 2006). Because of India’s complexities, we cast a broad net for assessing religious search volume. We first harvested search volume data for 11 religious terms (including our Christian terms): Buddha, Buddhism, God, Hinduism, Jainism, Jesus, karma, prayer, satguru, Sikhism, and Vedas. We submitted the data for these 11 terms to a principle components factor analysis, which yielded only one factor. Its eigenvalue was 6.14 (all other eigenvalues were less than 1.1). Five terms loaded strongly (≥.85) on this factor: Buddhism, Hinduism, Jainism, Sikhism, and Vedas (four Indian religious traditions, plus Vedas which is a revered set of sacred Hindu writings). We accordingly created a five-item composite measure of religious search interest in India (α = .96). Because of the tremendous number and diversity of religious holidays in India (there are more than 30 Hindu holidays), we selected only the most important holiday for each of the two most popular religions. These were the Buddhist holiday Vesak (a celebration of the life of Buddha) and the Hindu holiday Diwali. Diwali also happens to double as the name of a Jainist holy day.
Malaysia
Like India, Malaysia has a history of colonial occupation. Furthermore, about 63% of Malaysians speak English. The EFI ranks Malaysia 12th out of 72 nations in English fluency. Malaysia is also the only majority-Muslim nation we were able to study. In the hopes of creating a religious search composite that closely paralleled our Christian measure, we chose “prayer,” “Allah,” and “Muhammad.” When these terms failed to produce a reliable measure (mainly because “prayer” was psychometrically poor), we added “Quran” to the list. A reliability analysis now revealed that both “prayer” and “Muhammad” reduced the reliability of the scale. We thus created a two-item religious search score from “Allah” and “Quran” (α = .69). There are only three major Islamic religious holidays. We thus chose them all: “Ramadan,” “Eid Al Fitr,” and “Eid Al Adha.” Because about 9% of Malaysians are Christian, we also attempted an exact replication in Malaysia using our Christian search terms (including holidays). Searches for “God” were negatively correlated with searches for “Jesus” and “prayer” and we thus deleted this item and created a two-item measure of (Christian) religiosity in Malaysia (α = .58).
Results in Asian Nations
We conducted exactly the same multiple regression analyses used in Study Set 3. As shown in Figure 6, search volume for major illnesses was a significant predictor of increases in religious search volume in all four Asian countries (including separate Islamic and Christian analyses in Malaysia). Effect sizes ranged from β = .05 in the Malaysian Islamic search to β = .16 in India (with room for debate about the proper effect size in Japan). There was also a sizable effect of Easter in the Philippines and a small but significant effect for Diwali in India. Both Christian holidays were significant in the Malaysian Christian analysis. In the Malaysian Islamic analysis, Ramadan had a positive effect, and Eid A-Fitr (which marks the end of Ramadan) had a negative effect. No other holidays yielded significant effects (though both Indian holidays yielded marginal trends in the expected direction).
One surprising result was the sizable effect for sore throat in the Philippines. A possible reason for this is that according to the World Health Organization (WHO), the Philippines has the highest death rate from communicable diseases of all the nations we examined. Furthermore, many of the deadly communicable diseases that afflict Filipinos (e.g., Ebola, diphtheria, the Bird Flu) have a sore throat as a symptom. Sore throats may be considered much deadlier in the Philippines than in Ireland or Peru. Whatever the reason for this anomaly, the most important finding was that in these Asian nations, as elsewhere, heavy searches for major illness in a given week predicted subsequent increases in search rates for religious content (average effect size; β = .10). It may be no accident that the Asian nation with the smallest effect size was Malaysia, an equatorial nation with virtually no seasonal temperature variations.
Autocorrelation and Other Methodological Concerns
In time-series data, errors of prediction at one time may be very similar to errors of prediction for adjacent periods (Montgomery, Peck, & Vining, 2001). The Durbin–Watson test diagnoses this problem. It takes on a value of 2.0 when there is absolutely no autocorrelation. It takes on values smaller than 2.0 when error terms are positively correlated and takes on values larger than 2.0 when error terms are negatively correlated. Durbin–Watson tests in the main regression analyses for these 16 nations yielded values that were very close to the ideal value of 2.0. The average value was 1.87. The score for the U.S. data was a strikingly unbiased 1.96. The highest score observed for any nation was 2.20, for India. The lowest score was 1.36, for Peru. Furthermore, the average effect size for major illness across the 16 nations was independent of these Durbin–Watson scores. These findings are not an artifact of autocorrelation.
Could the findings of this report be driven by simple seasonality? We do not think so. Of course there is seasonal variation in thoughts about religion (e.g., based on holidays). However, we controlled for seasonal patterns in religious searches by controlling for (a) specific religious holidays and (b) religious search volume the week before the predicted religious search volume scores for a specific week.
Do these findings constitute “cherry picking”? No. First, we did not collect data in any other nations except those reported here. Second, we focused on a priori predictions that flow logically from terror management theory. Third, although we had to identify different religious concepts and holidays in different nations, we used exactly the same operational definitions in all 16 nations. It is not a design flaw of these studies that Jesus is more popular in Mexico than in India. Fourth, pitting major illness search volume against the only minor illness for which we could consistently get data (“sore throat”) reflects a specific, falsifiable hypothesis rather than an exercise in confirmation. In fact, a strength of these findings is that they are immune to some of the criticisms commonly made of laboratory studies (e.g., experimenter bias, changes in operational definitions across laboratories). Terror management processes appear to matter outside the laboratory.
Would we have observed the same results if we had assessed absolute rather than relative search volumes? In principle, this might allow for alternate operational definitions of our key constructs. However, Google Trends does not yield absolute search frequencies. Scores are always z scores with a mean of zero and a standard deviation of 1.0. A z score of 2.0 could represent 20,000 searches for “beaver” for the week of July 11, 2004. It might have taken 20 million searches for “Justin Bieber” to yield a z score of 2.0 for the same week. This may sound like a problem, but it is not unlike the problem of measuring response latencies in milliseconds and attraction to a confederate on a 7-point Likert-type scale (and adding both variables to a regression analysis). This does not mean that absolute search volume scores could not be useful. There could be absolute threshold effects, for example. A z score of 2.0 that only reflects 10,000 searches in the United States might have little punch. If this were the case, it could make it hard to detect a real effect, but it could not easily create a false one. Finally, we did make comparisons in this research with other Google search terms. Recall that we selected other Google search terms that either (a) had obvious relevance for religious search volume (e.g., “Christmas” in Ireland) or (b) served as an illness-relevant control term (“sore throat” all over the world).
General Discussion
This report suggests that concerns about life-threatening illnesses influence how often people think about religion. This includes a wide range of religious concepts, namely, deities (like Jesus), prayer, holy writings (like the Vedas), and the teachings of specific religions (e.g., Buddhism, Jainism). The mortality salience hypothesis—the idea that subtle thoughts of death increase the defense of our cultural worldviews—seems to be alive and well across the globe. Terror management processes seem to occur not only outside the laboratory but also outside Europe and the Americas.
One puzzling question about this report is why there was any temporal variation in the first place in searches for major illnesses. Many readers reasonably assume that deaths from cancer, hypertension-related illnesses, and diabetes are stable across the year. But this is not the case. Using millions of CDC death records, Pelham and Shimizu (2017) found that there is substantial seasonal variation in deaths from both diabetes and hypertension-related disorders. Americans are about 30% more likely to die of hypertension-related conditions in the winter than in the summer. There is also substantial seasonal variation in diabetes death rates, and there is even a small amount of seasonal variation in cancer death rates. Even if this were not the case, however, there are plenty of events that bring public attention to specific major diseases. For example, in the United States in 1989, October became Breast Cancer Awareness month. In fact, in the U.S. data, the z score for “cancer” searches was higher in October than for any other month (average z = +1.60). September was a distant second at z = +0.68. Whatever the source of variation in public awareness of life-threatening diseases, this report suggests that an apparent consequence is an increased public appetite for religion.
An important implication of the present findings is that economic and sociological models of religion are incomplete. As important as such models are, they are largely mute regarding the psychological underpinnings of religion. In contrast, terror management theory suggests that people are drawn to religion for much the same reason that they are drawn to friends, co-workers, and political candidates who share their cultural worldviews. Having said this, some authors of this report hasten to add that showing that religious thoughts may spring from thoughts about major illnesses does nothing to invalidate (or validate) any particular religious belief. It is well-established that authoritarian Americans who have recently been thinking about their own deaths become more critical than usual of a person who criticizes America (Weise et al., 2012). But just as this finding says nothing about whether it is correct to criticize America, the finding that death makes people think about religion says nothing about the validity of any religion. Whether existential terror fools people into accepting soothing myths or draws people closer to divine realities is a matter of opinion. Along similar lines, research shows that mortality salience manipulations can facilitate either constructive or destructive behavior (see Vail et al., 2012). On one hand, mortality salience manipulations sometimes make people more willing to stereotype or derogate outgroup members. On the other hand, the same manipulations sometimes make people draw closer to those they love (Mikulincer, Florian, & Hirschberger, 2003) or help others in need (e.g., see Jonas, Schimel, Greenberg, & Pyszczynski, 2002, and cf. Hirschberger, Ein-Dor, & Almakias, 2008).
A question for future research is why the association between major illnesses searches and religious searches was stronger in some nations than in others. If national religiosity level were a powerful moderator, effects should have been larger in Colombia than in Canada. This was not the case. However, at least two confounds could muddy these waters. First, Colombia has a warmer, more stable climate than Canada. Second, Internet penetration is lower in Colombia. Colombian data may simply be less reliable than Canadian data. Perhaps the most informative comparison one can make is for the two religious traditions in Malaysia. Christians there are a statistical minority, and the Christian effect was larger than its Muslim equivalent. Terror may be in need of more management than usual for religious or cultural minorities.
Although this report focused on major illnesses and religious interest, there are other reasonable ways to put terror management theory to the test in the field using Google search volume scores. For example, if the arguments made here are correct, searches for major illnesses should predict other forms of worldview affirmation. One of the most widely studied forms of worldview defense is patriotic bias (Solomon et al., 2015). In fact, pilot studies by the first author show that in the weeks after elevated search volumes for the same major illnesses examined here, U.S. Google users showed an increased interest in worldview-supporting terms such as “the American revolution,” “founding fathers,” and “American flag” (Pelham, 2017b). These effects do not appear to be driven by children’s school assignments because the effects get bigger rather than smaller when searching only in the academic year—thus eliminating the summer months when children have little or no schoolwork.
Along similar lines, other death-related experiences and events might predict increased collective interest in religion. For example, in the wake of a local school shooting or terrorist attack, religious search content might increase in a specific city or state (but not in distant areas). Unfortunately, Google Trends does not allow users to search specific cities—nor does it allow simultaneous geographical and temporal searches (users must choose one or the other). Finally, searches go back only to January of 2004, making national searches in the window of September 11, 2001 impossible. However, other studies do suggest that collective exposure to violence relates to religiosity. Du and Chi (2016) found that relative to the citizens of nations that are not at war, the citizens of nations that are at war report more religious beliefs and behaviors, from prayer to belief in God. Future research should address similar questions using different techniques.
Terror management theory is not the only psychological theory to suggest that threat promotes religiosity. However, to our knowledge, related perspectives do not focus on major illnesses such as cancer. For example, research in evolutionary psychology has shown that regional pathogen loads are strongly associated with the long-term development of both religious and collectivistic cultures (Fincher, Thornhill, Murray, & Schaller, 2008). Research on pathogen load has generated many intriguing findings, including the finding that Internet searches for Ebola virus in 2014 predicted a shift toward voting for Republican political candidates—at least in Republican-leaning states (Beall, Hofer, & Schaller, 2016). However, the major diseases examined here were all non-communicable and not likely to be positively correlated with pathogen load across nations. It is thus unclear whether pathogen load, non-communicable diseases, or death rates per se have more to do with religiosity across nations. Research does, in fact, suggest that pathogen load is uniquely linked to religiosity across the globe (Fincher & Thornhill, 2012). But because the present studies focus on non-communicable diseases, and further control for a communicable disease (“sore throat”), it is difficult to see how a pathogen perspective would explain these findings.
Of course, multiple factors surely contribute to variation in people’s religious thoughts. The present findings, derived from terror management theory, indicate that major illness may be one such factor. Anything that subtly activates thoughts of death—from life insurance advertisements to searching on-line for hypertension—should increase people’s desire to support their existing cultural worldviews. This should be true whether this means Googling for “God,” feeding the homeless, displaying a U.S. flag on one’s lawn, or deciding that we should build a great, great wall. Managing thoughts of death appears to play a pervasive role in daily life.
Footnotes
Declaration of Conflicting Interests
The author(s) declared no potential conflicts of interest with respect to the research, authorship, and/or publication of this article.
Funding
The author(s) received no financial support for the research, authorship, and/or publication of this article.
Supplemental Material
Supplementary material is available online with this article.
References
Supplementary Material
Please find the following supplemental material available below.
For Open Access articles published under a Creative Commons License, all supplemental material carries the same license as the article it is associated with.
For non-Open Access articles published, all supplemental material carries a non-exclusive license, and permission requests for re-use of supplemental material or any part of supplemental material shall be sent directly to the copyright owner as specified in the copyright notice associated with the article.
