




Abstract
How do people respond to multiple risk feedback in a real-life context? Based on theoretical assumptions, three different predictions for risk perceptions were tested: (a) relative accuracy in risk perceptions, (b) self-defensive responses according to self-affirmation theory, and (c) compensatory responses according to the compensatory health belief model. Participants of a community health screening (N = 725) received multiple risk indicator feedback for actual blood pressure, blood glucose, and blood lipid levels. Consistent multiple risk feedback profiles encompassed three consistent readings (three normal or three elevated readings). Mixed risk profiles included one elevated and two normal readings. Results indicate relative accuracy in responses: an elevated reading triggered higher risk perception of the respective risk factor. Importantly, the effect was not modulated by the presence of normal readings as assumed by the self-defensive or compensatory response perspective, indicating that people accurately integrate multiple risk indicator feedback as it is often provided in real life.
Introduction
Cardiovascular diseases are the leading cause of death in Western countries and are associated with multiple risk factors (Li, Hüsing, & Kaaks, 2014; Mozaffarian et al., 2015; Organisation for Economic Co-Operation and Development, 2014). Some risk factors such as family history, ethnicity, and age are not modifiable. However, lifestyle-related risk factors can be changed or treated, such as smoking, physical inactivity, high blood pressure (hypertension), or diabetes (Sheeran, Harris, & Epton, 2013; Webb & Sheeran, 2006; World Health Organization, 2011). Accordingly, health promotion programs aim to motivate people to change their behavior-related risk factors by initiating lifestyle changes. A necessary prerequisite for lifestyle changes is, according to health behavior theory, that people feel personally at risk (e.g., Leventhal, 1970; Rogers, 1975, 1983; Schwarzer, 1992, 2008; Witte, 1992; for an overview, see Renner & Schwarzer, 2003; Schmälzle, Renner, & Schupp, 2017). Hence, one way to motivate lifestyle changes is to increase personal risk perception by providing personalized health risk feedback informing people about their behavior-related risk factors.
Prior research on the reception of personalized health risk feedback commonly examined reactions to feedback about a single risk indicator (e.g., Cioffi, 1991; Croyle, 1990; Croyle, Sun, & Louie, 1993; Ditto, Munro, Apanovitch, Scepansky, & Lockhart, 2003; Gamp & Renner, 2015; Linnenbringer, Roberts, Hiraki, Cupples, & Green, 2010; Weinstein et al., 2004; for an exception on multiple genetic testing see Shiloh et al., 2015). For example, a study on breast cancer examined participants’ reactions to personalized feedback about their risk of getting breast cancer based on the Gail score risk indicator (Lipkus, Biradavolu, Fenn, Keller, & Rimer, 2001). However, in real-life settings, people typically receive feedback about multiple risk indicators simultaneously, such as blood pressure, blood glucose, and cholesterol levels. Thus, the question arises, “How do people respond to multiple risk feedback?”
When receiving multiple feedbacks, the individual risk factor profile might be straightforward and consistent. A straightforward reading has either consistently high or consistently low-risk readings, for example, low blood pressure and cholesterol levels, indicating a low-risk status, or high blood pressure and high cholesterol levels, indicating a high-risk status. Studies examining responses toward feedback about a single risk indicator showed that people demonstrate relative accuracy in their responses. Specifically, in a study on the emotional and cognitive impact of health risk information, participants read vignettes describing their personal risk status as low or high (French, Sutton, Marteau, & Kinmonth, 2004). Participants in the high-risk feedback group subsequently perceived a higher vulnerability than participants in the low-risk feedback group, indicating relative accuracy in risk perception (also see Gamp & Renner, 2016). In line with these findings on the reception of a single risk indicator feedback, one could assume that people respond relatively accurately to consistent readings for multiple risk indicators. Therefore, a risk profile indicating a consistent high-risk status (e.g., high blood pressure and high cholesterol level readings) should lead to greater personal risk perception than a risk profile indicating a consistent low-risk status (e.g., low blood pressure and low cholesterol level readings; cf. French et al., 2004; Gamp & Renner, 2016; see Figure 1).

Hypothetical means of risk perception for risk factors 1, 2, and 3 to illustrate predictions on the reception of multiple risk indicator feedback derived from (a) the relative accuracy hypothesis, (b) the self-defensive self-affirmation theory, and (c) the compensatory health belief (CHB) model.
However, multiple risk indicator feedback can also be mixed, encompassing an elevated risk status on one risk measure (e.g., high blood pressure reading) and a normal, all-clear status on another measure (e.g., low cholesterol level reading). Responses to mixed multiple risk indicator feedback may differ from responses to consistent multiple risk indicator feedback. Predictions on how people react to mixed multiple risk indicator feedback can be derived from three different lines of research: research on the relative accuracy of risk feedback reception, research examining the effect of self-affirmation on risk feedback reception, and research on compensatory health beliefs (CHBs; see Figure 1).
First, in line with the previous findings on the reception of single risk indicator feedback, one could propose that mixed risk profiles might be processed relatively accurately. This prediction is supported by studies on the perception of health risks that indicate that people generally perceive their current risk status with relative accuracy (without having received personalized risk feedback; for example, Hahn & Renner, 1998; Weinstein, 1998). For example, participants in a longitudinal survey were asked to report their meat consumption and their perceived risk in relation to bovine spongiform encephalopathy (BSE) and other related livestock diseases. Cross-sectional analyses at both measurement points (T1 and T2) showed that participants with low levels of preventive nutrition (high meat consumption) felt more at risk for BSE-related diseases than those reporting comparable higher levels of preventive behavior (low meat consumption). Accordingly, people realized when their behavior was risky, indicating relative accuracy in risk perception (Renner, Schüz, & Sniehotta, 2008). In addition, participants also showed adaptive accuracy in risk perception as a function of behavior change: Increases in preventive nutrition from T1 to T2 were significantly associated with decreases in perceived risk between T1 and T2 (Renner et al., 2008; also see Brewer, Weinstein, Cuite, & Herrington, 2004). Thus, extending the relative and adaptive accuracy hypothesis on risk perception to the reception of mixed risk feedback, mixed risk profiles might show a selective increase to the respective high-risk indicator, that is, a specific accuracy hypothesis (see Figure 1a). Thus, risk perceptions might be accurately adapted to an increased risk status for a specific risk indicator in both consistent and mixed risk profiles. As a consequence, the increase of risk perceptions following high-risk indicator feedback is expected to be comparable in mixed and consistent high-risk profiles (i.e., no compensations in either mixed or consistent high-risk profiles).
In contrast to the relative accuracy line of research, extensive empirical literature on health risk feedback reception of single risk indicator feedback suggests that people may respond self-defensively to health risk feedback. Specifically, research on the effect of self-affirmation on health risk feedback reception is informative for deriving predictions on reactions to mixed risk profiles (Armitage, Harris, Hepton, & Napper, 2008; Epton & Harris, 2008; Epton, Harris, Kane, van Koningsbruggen, & Sheeran, 2015; Klein & Harris, 2009; Steele, 1988). Personalized health risk feedback indicating an elevated risk status represents self-relevant, negative, and threatening information for the self (Ditto & Croyle, 1995; McQueen, Vernon, & Swank, 2013; Renner, Gamp, Schmälzle, & Schupp, 2015; Renner & Schupp, 2011). This feedback conflicts, according to Steele’s self-affirmation theory, with the fundamental motivation to protect a view of oneself as “adaptively and morally adequate” (Steele, 1988, p. 262; also see Cohen & Sherman, 2014; Harris & Napper, 2005). Consequently, when confronted with personalized health risk feedback, an often-replicated finding is that people accept high-risk information to a lesser degree than low-risk information (e.g., Armitage et al., 2008; Harris & Napper, 2005; Klein, Hamilton, Harris, & Han, 2015; Sherman, Nelson, & Steele, 2000). However, according to self-affirmation theory, people are concerned primarily with their global sense of self-worth and integrity. Consequently, they can meet a threat to their self in one domain by affirming an aspect of their identity in a different domain (Harris & Napper, 2005; Steele, 1988). Transferring the assumption of self-affirmation theory to the reception of mixed risk profiles, low-risk feedback on one risk indicator may have an affirming effect on recipients. Therefore, participants should show less self-defensiveness in receiving high-risk status feedback in a mixed risk profile (see Figure 1b). Thus, recipients should be more open-minded to threatening (high-risk) information in mixed risk profiles leading to higher feedback acceptance (cf. Armitage et al., 2008; Harris & Napper, 2005; Klein et al., 2015; Schüz, Schüz, & Eid, 2013; Sherman et al., 2000). However, if the risk profile encompasses consistent high-risk status feedback, recipients have no source of self-affirmation. Therefore, they should be more likely to react self-defensively. As a consequence, the increase of risk perception in a consistent high-risk profile should be less pronounced (self-defensiveness) than in mixed risk profiles (no self-defensive compensation; see Figure 1b).
Finally, a third concept allowing to derive of predictions on reactions to mixed risk profiles is the CHB model (Rabiau, Knäuper, & Miquelon, 2006). According to the CHB model, people strive to reach equilibrium between maximizing pleasure and minimizing harm. One possibility for reaching equilibrium is activating CHBs that comprise the beliefs that the negative effects of an unhealthy behavior can be compensated for by engaging in a healthy behavior (e.g., Berli, Loretini, Radtke, Hornung, & Scholz, 2014; Knäuper, Rabiau, Cohen, & Patriciu, 2004; Rabiau et al., 2006; Rabiau, Knäuper, Nguyen, Sufrategui, & Polychronakos, 2009; Radtke, Scholz, Keller, & Hornung, 2012). In a similar vein, one might assume that people who receive mixed risk feedback might compensate “bad news” (e.g., elevated cholesterol level reading) with “good news” (e.g., normal blood pressure reading). Consequently, if a high-risk status on one risk indicator is compensated for by a low-risk status on another risk indicator, the increase of risk perception in mixed risk profiles should be less pronounced (compensation) than in a consistent high-risk profile (no compensation; also see Figure 1c).
The Present Study
The present study examines how people respond to multiple risk indicator feedback. During a community health screening, participants received feedback on their actual blood pressure, blood glucose, and blood lipid levels. This feedback constituted either a consistent risk profile (low blood pressure, blood glucose, and blood lipid readings, respectively, high blood pressure, blood glucose, and blood lipid readings) or a mixed risk profile encompassing an elevated risk status for one risk indicator and a normal, nonelevated risk status for the other two risk indicators.
Method
Design and Participants
Data were collected as part of the Konstanz Life-Study, a longitudinal cohort study undertaken at 6 months intervals in spring 2012, autumn 2012, and spring 2013 (Renner, Sproesser, Klusmann, & Schupp, 2012; also see Klusmann, Musculus, Sproesser, & Renner, 2016; Sproesser, Klusmann, Schupp, & Renner, 2015, 2017; www.uni-konstanz.de/life-studie). The Konstanz Life-Study funded by the German Federal Ministry of Education and Research and the German Research Foundation. In all three waves, objective health data (e.g., blood samples, blood pressure readings), cognitive and functional fitness parameters, anthropometric measures, and self-report variables were assessed.
The present study focuses on data collected at Wave 1, for which 1,321 participants were recruited via flyers, posters, and newspaper articles. Of these, 26 were excluded because of missing data with regard to the risk indicators. In addition, 480 participants did not return risk perception measures after receiving risk feedback via mail (also see section “Procedure”). In addition, due to small group sizes, 90 participants who received an elevated risk status for two risk factors and a normal reading for the third risk factor were excluded from the analyses (also see section “Measures”). Therefore, the data for 725 (65% female) participants were included in the analyses. Age ranged from 18 to 93 years, with a mean age of 44.8 (SD = 17.3). The sample had a mean body mass index (BMI) of 24.5 kg/m2 (SD = 3.7, ranging from 16.6 to 39.9 kg/m2) and had completed on average 15.7 (SD = 2.4, ranging from 8 to 20) years of education, including primary, secondary, and tertiary education. Compared with German population data (Statistisches Bundesamt, 2014a, 2014b), the sample was 1 year older, comprised 14% more females, and had a slightly lower average BMI (the average BMI of the German population is 26 kg/m2 according to Microcensus data from 2013).
The dropout sample comprised participants with either consistently low, consistently high, or one elevated and two normal (mixed risk profile) readings who did not return the questionnaire letter and, thus, did not provide data on the risk perception measures (n = 422; note n = 58 participants were excluded for receiving feedback on two elevated risk factors, totaling n = 480 participants without data on the risk perception measures as was mentioned above). The dropout sample (n = 422 participants) did not differ from the study sample (n = 725) regarding risk status, F(1, 1145) < 0.01, p = .948 and BMI, F(1, 1141) < 1, p = .439. However, with a mean age of 38.5 (SD = 16.9) and an average education of 15.4 (SD = 2.5) years, dropouts were younger, F(1, 1145) = 36.5, p < .001, η² = .031, and reported slightly fewer years of education, F(1, 1126) = 4.49, p = .034, η² = .004, than the study sample. In addition, male participants were more likely to drop out than female participants, χ2(1) = 8.19, p = .004, ϕ = .085.
The local ethical review board (University of Konstanz) approved the study protocol. The procedures were performed in compliance with relevant laws and institutional guidelines. We strictly followed the German Psychological Society’s guidelines, 1 which are translated from the American Psychological Association, 2 and the study conforms to the Declaration of Helsinki.
Procedure
Upon arrival at the screening site, participants received a detailed description of the study and signed a consent form. Subsequently, fasting blood samples were collected in cooperation with the Red Cross Konstanz and analyzed by a professional laboratory. After blood collection, participants’ blood pressure and anthropometric measures were assessed (cf. Renner et al., 2012). Based on these data, participants received written multiple risk indicator feedback and a questionnaire by mail. Specifically, participants were provided with their actual (a) blood pressure reading, (b) fasting blood sugar level, and (c) blood lipid levels (total cholesterol, high-density lipoprotein [HDL], low-density lipoprotein [LDL], and triglycerides). According to the definition of the Metabolic Syndrome by the International Diabetes Federation (2006), participants received high-risk status feedback on their (a) blood pressure if their reading was at or over 130/85 mm Hg, (b) blood glucose if their fasting blood sugar level was at or above 100 mg/dl, (c) triglycerides if their level was at or above 150 mg/dl, and (d) HDL if their level was below 50 mg/dl for men or below 40 mg/dl for women. 3 In contrast, participants with readings below/above these threshold values received low-risk status feedback.
Participants received the exact numerical reading and verbal feedback. Moreover, they had received a booklet including a description of each risk factor at the first session, including how the reading is interpreted according to medical guidelines. Participants were asked to file their risk feedback letter in the booklet.
Along with their risk feedback, participants received a questionnaire that assessed their reactions to the provided multiple risk indicator feedback, including their risk perceptions for various coronary heart diseases (CHDs) risk factors and perceived severity. After completion, participants returned the questionnaire by mail in a postage-free envelope.
Measures
Risk profiles
Based on the evaluative feedback of their risk status for multiple risk indicators (blood pressure, blood glucose, blood lipids), participants received either consistent or mixed risk profiles. Consistent risk profiles indicated either a consistently low- or a consistently high-risk status across all three risk indicators. 4 Participants with mixed risk profiles received normal readings for two risk indicators and a high-risk status for the third. Participants with a normal reading for one risk indicator and a high-risk status for two risk indicators were excluded from the analyses due to small group sizes as only two participants had elevated blood glucose and blood lipid levels but a normal blood pressure reading (see also the section “Design and Participants”).
BMI
Height and weight were measured by trained research staff and following standardized procedures. Participants wore light indoor clothing and were asked to take off their shoes. Height was measured to the nearest 0.1 cm using a wall-mounted stadiometer. Weight was measured to the nearest 0.1 kg using a digital scale (Omron Body Composition Monitor, BF511). BMI was calculated as weight in kilograms divided by height in meters squared (kg/m2).
Lifetime absolute personal risk perception
At the first session and after they received personalized information on their risk status with regard to their blood pressure, blood glucose, and blood lipid levels, participants were asked to estimate their personal absolute lifetime risk of developing hypertension, diabetes, and hypercholesterolemia on a 7-point Likert-type scale ranging from 1 (very unlikely) to 7 (very likely), “How likely do you think you are to develop [a too high blood pressure (hypertension)/glucose disease (diabetes)/too high blood fats] during your lifetime?”; cf. Perloff & Fetzer, 1986).
Perceived severity
After receiving risk feedback, participants were asked to rate “How serious a threat to your health [is/are] your [blood pressure/blood sugar/blood fats]?” on a 7-point Likert-type scale ranging from 1 (not at all severe [might be neglected]) to 7 (very severe [life-threatening]; cf. Renner, Hahn, & Schwarzer, 1996; Sun & Croyle, 1995).
Results
Data were analyzed with a 3 (risk perception) × 5 (risk profile) repeated-measure ANOVA. Lifetime absolute personal risk perception for hypertension, diabetes, and hypercholesterolemia comprised the within-subject variable “risk perception.” The five different risk profiles served as between-subjects variable “risk profile” (consistently low [CL] vs. mixed high blood pressure [MBP] vs. mixed high blood glucose [MBG] vs. mixed high blood lipids [MBL] vs. consistently high [CH]). According to all three predictions, a “risk perception” by “risk profile” interaction effect is to be expected. A simple main effect analysis of “risk profile” within “risk perception” will indicate which prediction is supported by the data.
The ANOVA yielded significant main effects for both “risk perception,” F(2, 1430) = 7.10, p =.001,
Repeated-Measure ANOVA With Lifetime Absolute Personal Risk Perception for Three Different Risks (Hypertension, Diabetes, Hypercholesterolemia) and Five Different Risk Profiles (Consistently Low, Mixed High Blood Pressure, Mixed High Blood Glucose, Mixed High Blood Lipids, Consistently High).

Note. MS = mean square.
p < .01. ***p < .001.
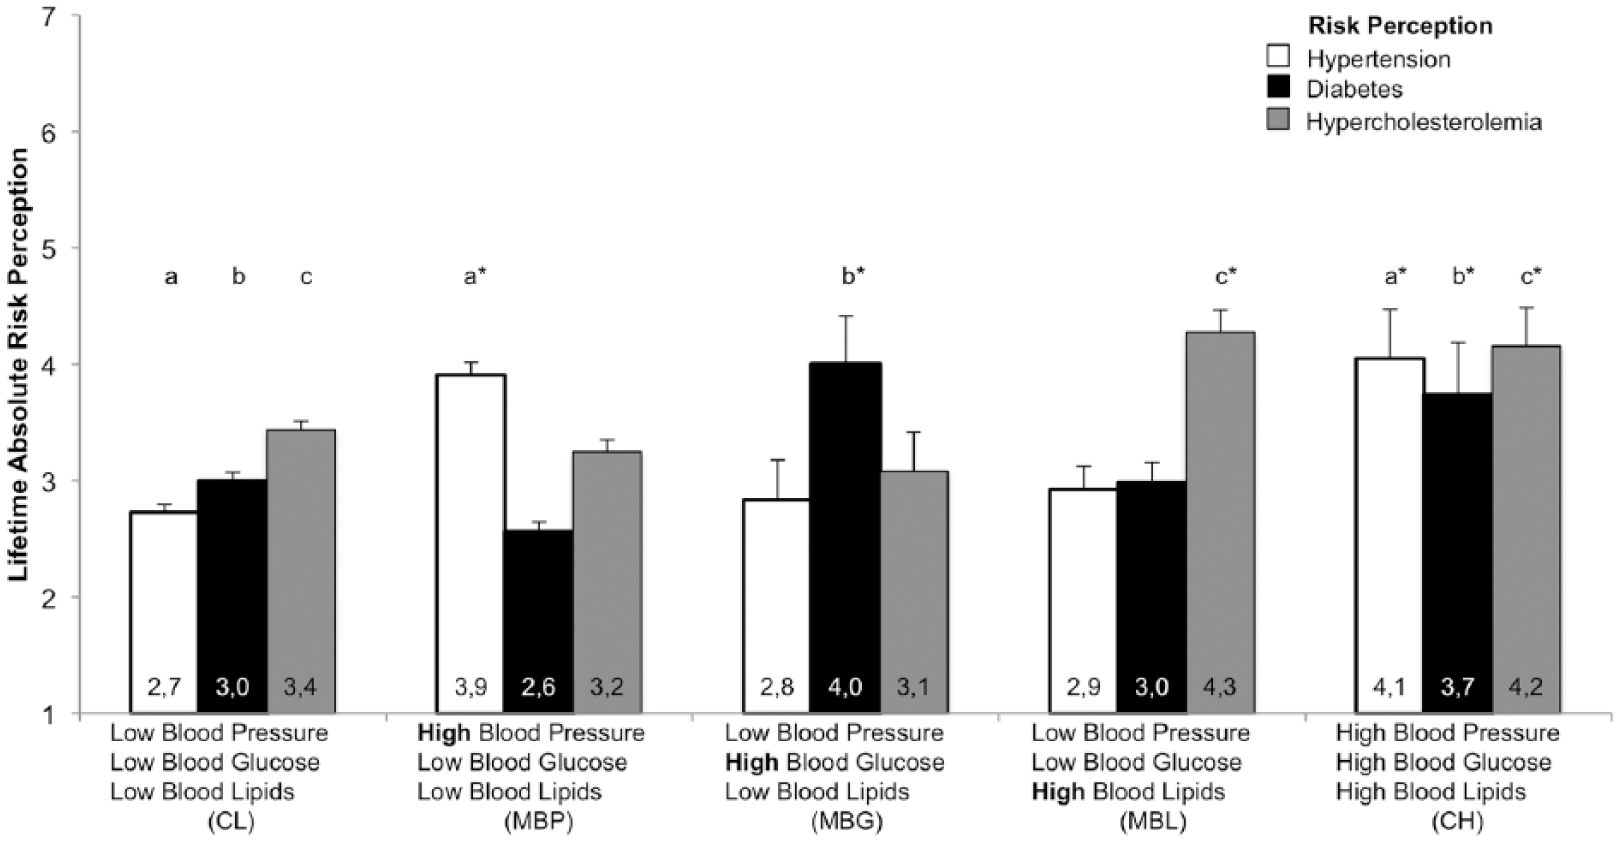
Lifetime absolute risk perception for hypertension, diabetes, and hypercholesterolemia following multiple risk indicator feedback as a function of consistent low-risk feedback (CL, n = 404); mixed risk feedback with high-risk feedback on blood pressure (MBP, n = 218), blood glucose (MBG, n = 24), or blood lipids (MBL, n = 55); and consistent high-risk feedback profiles (CH, n = 19), ± SE.
The simple main effect analysis of “risk profile” within “risk perception” showed that risk perceptions differed as a function of risk profile for all three risk factors: hypertension, F(4, 715) = 24.58, p < .001,
For the reception of consistent risk profiles, participants showed significantly higher risk perception if the profile comprised consistent high-risk status feedback (CH, right three bars) compared with consistent low-risk status feedback (CL, left three bars) for hypertension (MCL = 2.7, SDCL = 1.4 vs. MCH = 4.1, SDCH = 1.8), diabetes (MCL = 3.0, SDCL = 1.5 vs. MCH = 3.7, SDCH = 2.0), and hypercholesterolemia (MCL = 3.4, SDCL = 1.5 vs. MCH = 4.2, SDCH = 1.4; also see Figure 2 and Table 2). Thus, participants who received consistent multiple high-risk status feedback accurately adapted their risk perception to their increased risk status. This pattern is supported by all three predictions.
Significant Mean Difference for the Simple Main Effect Analysis.

Note. MD = mean difference; CI = confidence interval; LL = lower limit; UL = upper limit; CL = consistent low-risk feedback; MBP = mixed risk feedback with high-risk feedback on blood pressure; CH = consistent high-risk feedback; MBG = mixed risk feedback with high-risk feedback on blood glucose; MBL = mixed risk feedback with high-risk feedback on blood lipids.
p < .05. **p < .01. ***p < .001.
In a similar vein, participants who received mixed risk profiles adapted their risk perceptions compared with the consistent low-risk status group if the respective risk indicator was elevated: hypertension (MCL = 2.7, SDCL = 1.4 vs. MMBP = 3.9, SDMBP = 1.6), diabetes (MCL = 3.0, SDCL = 1.5 vs. MMBG = 4.0, SDMBG = 2.0), and hypercholesterolemia (MCL = 3.4, SDCL = 1.5 vs. MMBL = 4.3, SDMBL = 1.4; also see Figure 2 and Table 2).
To test the different predictions, the proportional increase in risk perception for the consistently high compared with the mixed risk profiles is key: Risk perceptions for the respective elevated risk indicator in the mixed risk profile groups did not significantly differ from risk perceptions in the consistent high-risk profile group (ps > .5). That is, the increase in risk perception was equally pronounced for high-risk indicators in both consistent high and mixed risk profiles (also see Figure 2). This finding supports the prediction of specific accuracy in responses to multiple risk feedback but does not support self-defensive or compensatory mechanisms.
Control Analysis
A 3 × 5 repeated-measure ANCOVA controlling for gender, age, and BMI revealed a significant effect for age, F(1, 710) = 21.81, p < .001,
To further secure the observed pattern of results, perceived severity in response to given risk feedback was analyzed. The 3 (severity) × 5 (risk profile) repeated-measure ANOVA with perceived severity for the provided blood pressure, blood glucose, and blood lipid risk status as within-subject factor “severity” yielded a main effect for “severity,” F(1.93, 1410) = 9.52, p < .001,
Discussion
The present study examined participants’ reactions to multiple risk feedback to test three different predictions: a relative accuracy prediction, a self-defensive prediction derived from self-affirmation theory, and a prediction adapted from the CHB model. Results show that risk perceptions were increased whenever a risk indicator was elevated, for both consistent and mixed health risk profiles. Hence, participants were sensitive to the given health risk status and accurately related high-risk feedback to greater personal consequences. The present results thus support the relative accuracy prediction but not the self-defensive or compensatory mechanisms perspectives.
How does the accuracy relate to previous empirical findings on health risk feedback reception? Accuracy in risk perception after receiving risk feedback that is consistent across multiple risk indicators is congruent with findings on the reception of single risk indicator feedback (French, Hevey, Sutton, Kinmonth, & Marteau, 2006; French et al., 2004; Gamp & Renner, 2016) and the assumption of reality constraints on responses to health risk feedback. According to this view, people’s reactions to health risk feedback are constrained by their wish to construe plausible justifications for their judgments and behaviors (Baumeister, Bratslavsky, Finkenauer, & Vohs, 2001; Kunda, 1990; Renner & Schupp, 2011). Thus, even if receiving high-risk feedback might be threatening, people acknowledge their actual increased risk status indicated by increased risk perceptions.
Previous research on the reception of multiple risk indicator feedback is scarce and partly confirms the present results on the reception of mixed multiple risk feedback. A recent study examining the impact of multiplex genetic testing on disease risk perceptions supports the accuracy of the finding in the present study (Shiloh et al., 2015). Specifically, participants stated their risk perception 3 months after having received genetic risk feedback for eight common diseases. Indicating specific accuracy, most participants increased or decreased their risk perceptions for specific diseases in accordance with the number of risk markers they carried (Shiloh et al., 2015). However, contradictory results are reported in a study examining the impact of conjoint health risk feedback for heart disease and diabetes on risk perception (Hovick, Wilkinson, Ashida, de Heer, & Koehly, 2014). In this study, Mexican Americans received a pedigree or personalized risk feedback indicating either a low or elevated risk for heart disease and diabetes. At 3 months follow-up, mixed risk feedback on heart disease and diabetes, that is, low heart disease and elevated diabetes risk, and vice versa, did not significantly increase or decrease the odds of elevated risk perception for the respective disease (Hovick et al., 2014). However, comparability to the present results is limited because Hovick et al. (2014) provided participants with aggregated, global risk feedback for heart disease and diabetes, whereas the present study provided participants with feedback on multiple specific risk indicators. In addition, time of assessment varied between both studies. This is noteworthy as people receiving elevated risk feedback may engage in health behaviors to reduce their risk (for a meta-analytical view see, for example, Sheeran et al., 2013), leading to attenuated risk perceptions over time. As the pattern for risk perception in the Hovick et al. (2014) study was not consistent for a 3- and a 10-month follow-up, the time of assessment might have affected risk perceptions. Examining the impact of time as well as behavioral changes that might occur in the meantime is, therefore, highly important to foster a better understanding of how people respond to (multiple) risk indicator feedback.
Regarding the predictions, the present findings do not support a self-defensive and compensatory interpretation of responses to multiple health risk feedback suggested by self-affirmation theory and the CHB model (e.g., Armitage et al., 2008; Harris & Epton, 2009; Rabiau et al., 2006; Radtke et al., 2012). However, when interpreting the present results, it is important to note that both of the predictions unsupported by the present study were adapted from the conventional assumptions of self-affirmation theory and the CHB model.
Specifically, self-affirmation is commonly applied in at least two different important self-identity domains. Thus, the threatened self-identity domain is affirmed through a self-identity in another domain. One popular means of self-affirmation is, for example, the “kindness questionnaire” (Reed & Aspinwall, 1998), which elicits examples of situations in which people were kind to others, what has been shown to increase people’s receptiveness to threatening health messages (e.g., Armitage et al., 2008; Armitage & Rowe, 2011; Epton & Harris, 2008; Schüz et al., 2013). In contrast, in the present study, the threatening (elevated risk indicator) and affirming (nonelevated, normal risk indicator) information is exclusively health related. Although previous literature acknowledges that there are many possible ways of self-affirmation (Steele, 1988), there are inconsistent findings on the effectiveness of affirmations in the same domain compared with a different domain than that threatened. Specifically, some same-domain affirmations increased biased processing and resistance to counterattitudinal reports and health risk messages, indicating that self-affirmation in domains related to the threat can backfire (Jessop, Sparks, Jessop, Dodds, & Lynch, 2016; D. Sherman & Cohen, 2006). This raises the question, “How different do the domains need to be?” In previous research, for example, different personality aspects were used to test self-affirmation effects (e.g., Aronson, Blanton, & Cooper, 1995). Hence, as health is a core multifaceted value for almost all people, one could argue that receiving “good news” on a different aspect of one’s own health potentially offers a very effective way to affirm a positive view of the self and to reduce the perception of self-threat. Supporting this line of notion, a study on the moderating effect of self-affirmation on unrealistic optimism and pessimism showed that same-domain self-affirmation (“health”) increased interest in colorectal cancer screening compared with a nonaffirmed control group (Klein et al., 2010), which supports the intended self-affirmation effect of reducing defensiveness in responses to risk feedback. In line with this finding, participants in the mixed risk profile conditions increased their risk perceptions (no compensation, also see Figure 1b). Thus, reactions to mixed risk indicator feedback, where the self-affirming mechanism was presumed to operate, would in fact have supported a self-affirmation hypothesis.
Importantly, it was the lack of self-defensiveness in the reception of a consistent high-risk profile (see Figure 1b) that challenged the self-affirmation prediction as the increase of risk perceptions in the consistent high-risk profiles was comparable to the increase in the mixed risk profiles. Due to the lack of a self-affirming normal risk indicator, the consistent high-risk profile group should have shown a less pronounced increase in its risk perceptions, according to a self-affirmation perspective. 5 Another aspect might be whether participants self-selected the domain for affirmation rather than being provided with the information. As, to our knowledge, this has been not systematically tested, we can only speculate about potential implications. It seems likely that the valence (positive vs. negative information) is more important than the message source. However, this line of reasoning is highly speculative and needs to be tested in future studies designed to systematically examine the impact of information valence and message source (self-selected vs. provided domain for affirmation) on the reception process.
In a similar vein, the original CHB model defines the beliefs that certain unhealthy behaviors are compensated for by engaging in other healthy behaviors (Knäuper et al., 2004; Rabiau et al., 2006). However, the present study did not focus on behavior but investigated whether an “unhealthy” (elevated) risk indicator may be processed in a compensatory manner when accompanied by a “healthy” (normal) risk indicator. The nature of the compensated variable might be critical as a recent study showed that CHBs can be delimited from actual compensatory health behaviors (CBs; Radtke & Scholz, 2016). However, the adaption of the conventional CHB assumption in the present study might be supported by the fact that one of the driving forces for CHBs is identical to the motivated reasoning discussed in the health risk feedback reception literature. That is, according to the CHB model, cognitive dissonance initiating CHBs may be perceived for a variety of reasons, including the violation of a valued self-perception (e.g., being somebody who eats healthily; Knäuper et al., 2004). In a similar vein, motivated reasoning has been the object of investigation in responses to health risk information (e.g., Helzer & Dunning, 2012; Kunda, 1990; McQueen et al., 2013). Thus, similar to the automatic motivated behavioral regulatory process in the CHB model that functions to reduce cognitive dissonance (Knäuper et al., 2004), automatically activated compensatory risk perceptions to protect one’s positive self-view might be assumed (cf. Helzer & Dunning, 2012; Kunda, 1990; McQueen et al., 2013). Accordingly, using an adapted prediction from the CHB model seems likewise insufficient to account for the lack of support of this prediction.
This lack of support for self-defensive and compensatory mechanisms in risk feedback reception adds to the growing literature showing inconsistent results regarding a self-defensive and compensatory perspective on health risk feedback response (e.g., Dillard, McCaul, Kelso, & Klein, 2006; Gamp & Renner, 2016; Michie et al., 2002; Renner, 2004). Specifically, contrary to a self-defensive motivated reasoning assumption, previous studies show that low-risk feedback, that is “good news,” does not always lead to acceptance and reassurance. For example, Gamp and Renner (2015) provided participants with computerized, personalized risk feedback about their risk of developing a (fictitious) stress-related disease. Responses to the risk feedback were moderated by prefeedback expectancy. Unexpected low-risk feedback was associated with less acceptance and higher perceived negative consequences for the self compared with expected low-risk feedback. Thus, low-risk feedback was significantly less reassuring when received unexpectedly (see also Gamp & Renner, 2016; Renner, 2004). This lack of reassurance is not in accordance with a self-defensive interpretation that assumes people to be primarily motivated to establish or maintain a positive self-view.
In a similar vein, one might argue that prefeedback expectancies modulate defensiveness and compensatory responses. Various studies showed that expected negative risk feedback is generally perceived as more trustworthy and diagnostically accurate than information that is inconsistent with preexisting expectancies (e.g., Edwards & Smith, 1996; Shrauger, 1975; Swann, Griffin, Predmore, & Gaines, 1987) and is more readily accepted than unexpected bad news (e.g., Gamp & Renner, 2015; Renner, 2004). This pattern of results concurs with the rationale that negative feedback, such as a high blood pressure reading, is less surprising when people already knew about their condition, which may in turn induce less defensiveness. However, the same effect was observed for “good” news, where unexpected good news, such as an unexpected normal cholesterol reading, was less readily accepted than expected good news (Renner, 2004; see also Gamp & Renner, 2016).
Integrating these findings with the present results indicating a lack of self-defensive and compensatory reactions but supporting a specific accuracy in health risk feedback reception, may point to adaptive responses to one’s risk status. According to a model of risk perception and risk behavior by Brewer et al. (2004), there is a positive correlation between both variables, indicating that high perceived risk leads people to increase precautionary behavior (e.g., Moser, Mccaul, Peters, Nelson, & Marcus, 2007; Renner et al., 2008; Weinstein et al., 2007, for overviews, see Brewer et al., 2007; Sheeran et al., 2013). A necessary prerequisite for this adaptive, positive correlation is that people accurately understand health risk information. As the present results indicate, people accurately integrate multiple risk indicator feedback in their respective risk perceptions in relative terms.
However, from a theoretical perspective, it still remains open whether or not self-defensive motives drive risk feedback reception, that is, whether defensive or compensatory reactions occurred along with specific accuracy. Although the present study showed a specific accuracy in multiple health risk feedback reception, it has yet to be determined whether people are also accurate in absolute terms. That is, although risk perceptions in the mixed and consistent high-risk feedback groups reflected the provided feedback (specific accuracy), the observed increase might be still below the normative level. Hence, perceptions might be accurate in relative but not in normative or absolute terms (Rothman, Klein, & Weinstein, 1996; Shepperd, Pogge, & Howell, 2017). However, assessing absolute accuracy in risk perceptions is a challenging task as we typically lack an absolute or objective criterion for measuring perception accuracy or biases. Hence, we cannot rule out conclusively that the pattern of results may reflect, along with relative accuracy, some degree of bias. This bias might either represent defensiveness (assuming that the risk perceptions of the high-risk feedback group were lower than an objective criterion might suggest) or some sort of positive bias (assuming that the risk perceptions of the low-risk feedback group were lower than an objective criterion might suggest). The argument about absolute accuracy applies for groups receiving low or high feedback as both can deviate from objective criteria. To determine absolute accuracy or biases, future research needs to turn toward a long-term perspective and investigate incidences of the respective risk factors. Recording which participants develop hypertension, diabetes, or hypercholesterolemia will enable the disentanglement of accurate or biased participants.
In addition, the present study focused on one reaction to personalized health risk feedback, that is risk perception, which is a central variable in almost all health behavior theories (e.g., Health Action Process Approach, Health Belief Model; cf. Renner & Schwarzer, 2003; Sheeran et al., 2013). Defensiveness in risk perceptions can be a major barrier to the adoption of preventive behavior (see also optimistic bias, Shepperd et al., 2017). However, receiving risk feedback triggers different types of responses that can unfold at different stages within the illness threat appraisal process and may not be equivalent (Ditto, Jemmott, & Darley, 1988; Ditto & Lopez, 1992; Lazarus, 1998; Weisman, 1972 also see Renner & Schupp, 2011). This point raises the question, “Which variables are the most valid indicators of defensiveness?” In previous research, different variables have been used based on conceptual reasoning, research traditions, and practicability issues (see, for example, Croyle, Sun, & Louie, 1997; Epton et al., 2015). Present theories usually do not specify indicators of defensiveness but rather mechanisms that probably apply in a similar way to various indicators, including risk perceptions and perceived threat or severity. Hence, the most conservative assumption is to assume the same response pattern across different indicators. Interestingly, additional control analyses, with perceived severity as an alternative indicator for defensiveness, revealed a similar pattern of results as obtained with risk perceptions. The consistency of results across two different indicators supports the notion that responses in the present study lack defensiveness and compensation. However, there is an almost unlimited number of potential indicators, and therefore we cannot exclude that other indictors might have yielded a divergent pattern. As we currently lack a theory entailing which indictors might be most valid, we would like to suggest that focusing on core variables related to the health behavior theories such as risk perception is, among others, a fruitful approach. This testing can provide useful insights into whether defensiveness might affect specific aspects of the behavior change process.
In a similar vein, the relevance of the measured health outcomes and behaviors might differ between individuals and therefore also the dissonance activating and reducing mechanisms. 6 For example, smokers might respond differently to receiving high blood pressure feedback than nonsmokers. A promising avenue for future research might be to determine what people believe about risk and health parameters (e.g., Bostrom, Fischhoff, & Morgan, 1992) and to identify those that have the greatest relevance for each individual. For example, cognitive mapping method could be used to elicit individual mental models of a risk (e.g., Morgan, Fischhoff, Bostrom, & Atman, 2001). This could be combined with adaptive mobile assessments of risk perceptions and behaviors (Miller, 2012) to capture individual belief and behavior trajectories after receiving multiple risk feedback. Furthermore, the generalizability of the health outcomes needs to be tested in future studies. For example, accuracy and defensiveness might vary in dependence of the personal value of the respective health outcome. Specifically, health outcomes that are highly relevant to the identity of the self (e.g., profession, hobby) or can be attributed to different causes (e.g., genetics, environment, behavior) might elicit a lower relative accuracy and greater defensiveness (see Note 6).
This study is not without limitations. Thus, several aspects need to be acknowledged when interpreting the present results. Participants who choose to be tested are not representative of the general population and are by definition self-selected. Even though our sample was representative of the German population in terms of BMI and age (Statistisches & Bundesamt, 2014a, 2014b) one should be careful to generalize the results to people who refrained from testing as self-selected participants may, in part, be psychologically and behaviorally prepared for dealing with bad news (see also Croyle et al., 1997; Renner, 2004). In addition, the sample was rather healthy, causing unequal group sizes and the subsequent exclusion of the few participants with mixed risk profiles comprising two elevated and one nonelevated risk indicator. Also, demand effects might have occurred as participants reported their risk perceptions to the same investigators. However, face-to-face contact was only included in the first stage of the study, during blood samples collection. All subsequent steps, including the risk status feedback communication, were based on participant IDs. Specifically, participants received the test results and the questionnaire by mail and returned their completed questionnaire with only ID number identification. Subsequently, the demand effect of reporting to the same investigators was potentially reduced. Nonetheless, self-report data are inevitably prone to reporting biases, which certainly also applies to the present data.
Conclusion
Previous research has commonly investigated reactions to single risk feedback. However, little research has examined reactions to the multiple risk feedback often provided in real-life settings. The present study aimed to contribute to filling this gap in the literature. The results demonstrate that people integrate multiple risk indicator feedback into their risk perceptions relatively accurately. This finding is noteworthy because, in contrast to single risk indicator feedback, participants have much more information to process and may select the type and amount of information they focus on (cf. Shiloh et al., 2015). In contrast, predictions on self-defensive or compensatory mechanisms were not supported. These findings may point to adaptive responses to health risk feedback as increased risk perception leads people to increase precautionary behavior.
Supplementary Material
Supplementary Material, gamp_online_appendix – Risk Perceptions After Receiving Multiple Risk Feedback
Supplementary Material, gamp_online_appendix for Risk Perceptions After Receiving Multiple Risk Feedback by Martina Gamp, Harald T. Schupp and Britta Renner in Personality and Social Psychology Bulletin
Footnotes
Declaration of Conflicting Interests
The author(s) declared no potential conflicts of interest with respect to the research, authorship, and/or publication of this article.
Funding
The author(s) disclosed receipt of the following financial support for the research, authorship, and/or publication of this article: This work was supported by the German Research Foundation under Grant FOR 2374, “The Dynamics of Risk Perception and Risk Behavior in the Context of Mental and Physical Health” (granted to B.R. and H.S.), under Grant FP655/13 “Risk” funded by the Excellence Initiative by the German Federal and State Governments within the program “Research Initiatives, Infrastructural and Networking Platforms” at the University of Konstanz (granted to B.R. and H.S.), and the EATMOTIVE project funded by the Federal Ministry of Education and Research (BMBF Grant 0315671, granted to B.R. and H.S.).
Notes
Supplemental Material
Supplementary material is available online with this article.
References
Supplementary Material
Please find the following supplemental material available below.
For Open Access articles published under a Creative Commons License, all supplemental material carries the same license as the article it is associated with.
For non-Open Access articles published, all supplemental material carries a non-exclusive license, and permission requests for re-use of supplemental material or any part of supplemental material shall be sent directly to the copyright owner as specified in the copyright notice associated with the article.
