



Abstract
Despite evidence that variation exists between individuals in high-stakes truth and deception detection accuracy rates, little work has investigated what differences in individuals’ cognitive and emotional abilities contribute to this variation. Our study addressed this question by examining the role played by cognitive and affective theory of mind (ToM), emotional intelligence (EI), and various aspects of attention (alerting, orienting, executive control) in explaining variation in accuracy rates among 115 individuals (87 women; mean age = 27.04 years [SD = 11.32]) who responded to video clips of truth-tellers and liars in real-world, high-stakes contexts. Faster attentional alerting supported truth detection, and better cognitive ToM and perception of emotion (an aspect of EI) supported deception detection. This evidence indicates that truth and deception detection are distinct constructs supported by different abilities. Future research may address whether interventions targeting these cognitive and emotional traits can also contribute to improving detection skill.
A successful lie pays dividends to the liar if he or she gets away with a severe personal or moral transgression, even if it harms individual victims or society at large. Thus, people have a personal and social interest in preventing or minimizing such harm by catching liars—and by not falsely accusing truth-tellers. However, some scientific evidence has shown that variation exists across individuals in the ability to accurately identify truths and lies. This article presents an exploration of possible sources of this variation by analyzing whether particular individual traits underlie differences in accuracy rates for high-stakes truth and deception detection.
Deception
Deception (lying) is “a successful or unsuccessful attempt, without forewarning, to create in another a belief which the communicator considers to be untrue” (Vrij, 2008, p.15). It is a deliberate act of controlling information to manipulate other’s beliefs or their psychological or cognitive states (Buller & Burgoon, 1996). The purpose is usually to hamper the decision-making abilities of the receiver of the deceptive communication (Wardle & Gloss, 1982). A related concept is veracity, which is an umbrella term for both deception and honesty. Here, we use the terms liars for individuals who make deceptive statements, truth-tellers for individuals who make honest statements, and truth/deception detection for the process in which observers identify truth-tellers and liars, respectively. Targets refers to individuals who are being observed who could potentially be either a truth-teller or a liar. Researchers contrast high-stakes deception in which the consequences of being caught lying can be severe, for example, hiding the commission of a serious crime, versus low-stakes deception in which the consequences of lying are mild or moderate, for example, guests complimenting a host for a delicious meal when it was anything but. Typically, researchers measure ability to accurately assess veracity through discrimination accuracy, which requires participants to make a forced-choice response about whether an individual is lying or being truthful (Bond & DePaulo, 2006). Meta-analytic findings (Bond & DePaulo, 2006) show that people perform consistently (but statistically significantly) just above chance at low-stakes discrimination accuracy. Frequently, this is explained as resulting from truth bias, a heuristic which stems from individuals tending to judge statements as truthful because of their experience of everyday social interactions tending to be truthful (Mann, Vrij, & Bull, 2004). This occurs because observers use base rate information (i.e., previous experience) when clear indicators of deception are unavailable (Street, Bischof, Vadillo, & Kingstone, 2016). Consequently, truths tend to be accurately identified more often than lies in detection research. However, greater variance exists in high-stakes discrimination accuracy (Mann & Vrij, 2006; Mann et al., 2004; Mann, Vrij, & Bull, 2006; Vrij & Mann, 2001a; Vrij, Mann, Robbins, & Robinson, 2006; Wright Whelan, Wagstaff, & Wheatcroft, 2015a). One explanation for this is that because people may have a greater expectation of deception in high-stakes situations, truth bias is less influential. In other words, because the contextual base rate (e.g., truth bias) is less reliable in high-stakes situations, diagnostic behavioral cues from individual targets may be relied upon more (Street et al., 2016).
The Leakage Account Versus the Few Transparent Liars (FTP) Account
In considering whether and why observers vary in their discrimination accuracy, we must first evaluate the assumption that discernible high-stakes truthful and deceptive contexts exist. One relevant, prominent explanatory framework is the “Leakage Account” (Buller & Burgoon, 1996; Ekman & Friesen, 1969), as we refer to it here. This account suggests that although liars are motivated to successfully and performatively mimic truth-telling to avoid the consequences of being caught, the emotionality and cognitive load involved in lying can lead to “leakage” of verbal and nonverbal cues that distinguish liars from truth-tellers. Specifically, liars and truth-tellers evidence differing intensities and frequencies of verbal and nonverbal behaviors that cumulatively produce observable, distinctive patterns (Harpster, Adams, & Jarvis, 2009; ten Brinke & Porter, 2012; Wright Whelan, Wagstaff, & Wheatcroft, 2014; Wright Whelan, Wagstaff, & Wheatcroft, 2015b). For example, liars produce more speech errors (Sporer & Schwandt, 2006) and head shakes (Wright Whelan et al., 2014) and use more equivocal or evasive language (ten Brinke & Porter, 2012). The Leakage Account has dominated much of the deception detection literature; however, its explanatory power is limited because, to date, research has not identified any single cue that is diagnostic of lying and because both lying and truth-telling can be emotional and subject to cognitive load (Vrij, Granhag, & Porter, 2010) which creates ambiguous displays of emotional stress. Therefore, even if leakage can be identified in research, many real-world observers may fail to recognize leaked cues to the extent that they can only be moderately successful detectors.
Criticism of the Leakage Account comes from Levine (2010) who utilized Bond and DePaulo’s (2006) meta-analysis to demonstrate that the average discrimination accuracy rate is consistently only slightly above chance. Levine argues that this stems from a few “bad” liars who are so leaky that most observers accurately identify their lies, while most liars are generally successful. We refer to this explanation, as Levine does, as the “Few Transparent Liars” Account. Furthermore, Levine et al. (2011) found that demeanor complicates detection by adding “noise”: Some targets appear more or less honest regardless of their veracity. Thus, observers may evaluate targets’ demeanor even though this is generally independent of any leaked diagnostic cues. Demeanor means that variation within groups of liars and groups of truth-tellers exists in addition to the variation that exists between liars versus truth-tellers: Some people will be convincing liars (and others unconvincing), and some truth-tellers may be frequently doubted (and others frequently believed).
Thus, the Leakage and FTL Accounts give different explanations about the degree to which liars and truth-tellers evince useful cues to their veracity. Accordingly, it is consistent with the Leakage Account that high-stakes observers also vary greatly in their ability to detect those cues; in contrast, the FTL Account would suggest that observers do not demonstrate variation in their abilities and consequent accuracy because accuracy is almost totally dependent on the opacity of most liars and the transparency of a few.
Are Truth and Deception Detection Distinct?
The controversy over the degree to which observers vary in their discrimination accuracy could be due to a lack of construct validity. Rather than conceptualizing the discrimination of truths and lies as a singular ability, Levine, Sun Park, and McCornack (1999) suggest that truth and deception detection represent distinct abilities as demonstrated by differential accuracy rates in studies that compute them separately. Imaging work supports this supposition because additional brain areas are required when processing lies versus truths (Lissek et al., 2008). Varied accuracy rates are, in part, caused by truth bias, meaning that recognizing false information requires greater mental effort in everyday contexts (Levine et al., 1999). However, because truth bias is less influential when lying is expected (Mann et al., 2004), accurate high-stakes truth and deception detection may be similarly effortful, yet competence in either may engage different cognitive and emotional resources. These different resources may underlie the perception and successful interpretation of the distinctive behavioral patterns displayed by high-stakes truth-tellers and liars. Evidence of this would prompt the reasonable conclusion that truth and deception detection are (at least partially) distinct because some of the key underlying mechanisms that influence detection skill are nonoverlapping.
What Individual Differences Might Support Truth and Deception Detection?
Consistent with the Leakage Account, variance in accuracy rates among high-stakes observers could be due, in part, to variance in observers’ abilities to perceive and understand the meaning of targets’ verbal and nonverbal behaviors and to use them diagnostically. This process likely draws on cognitive and emotional resources (Wojciechowski, Stolarski, & Matthews, 2014), and so individual differences in these relevant resources may contribute, especially as accurate judgments may rely on integrating and understanding how targets’ behaviors relate to each other in internally (in)consistent ways (DePaulo et al., 2003; Wright & Wheatcroft, 2017). However, little research has consistently shown what personal factors might support accurate detection (Aamodt & Custer, 2006), and even less has investigated the contribution of specific cognitive and emotional resources. Evaluation of relevant findings is complicated by the potential limitations of operationalizing truth and deception detection as a single construct, which has been the tendency of most research. In this section, we outline some relevant cognitive and emotional abilities that are potential contributors to variation in truth and/or deception detection skill.
Theory of Mind (ToM)
One contributor may be natural variation in ToM, which is the ability to understand others’ mental states and predict their behavior (Premack & Woodruff, 1978). Recently, researchers have identified two types: cognitive ToM, which involves explicit, detached, effortful reasoning, and affective ToM, which involves implicit, emotionally based, instinctive judgments (Shamay-Tsoory, Tomer, Berger, Goldsher, & Aharaon-Peretz, 2005). Using video clips of a gameshow based on the Prisoner’s Dilemma, Sylwester, Lyons, Buchanan, Nettle, and Roberts (2012) found that better affective ToM supported the identification of co-operators (consistent mental states and behaviors; truthful intentions) but hindered the identification of defectors (inconsistent mental states and behaviors; deceptive intentions), which is also evidence that differential processes may support truth versus deception detection. In another study, Sylwester et al. found no relationship between cognitive ToM and the accurate identification of previous co-operators and defectors from photographs; however, photographs poorly replicate real-life contexts. Other works demonstrated that training observers to explicitly use their mentalizing capacity in actively interviewing suspects led to improved discrimination accuracy (Granhag & Hartwig, 2008). Despite these intriguing findings, the published literature examining the contribution of ToM to discrimination accuracy remains limited in scope. However, both forms of ToM could plausibly contribute to accurate detection. Affective ToM may enable observers to effectively perceive and decode emotional mental states (such as guilt) that are involved in high-stakes scenarios. Cognitive ToM may support observers in accurately reasoning about others’ behaviors (and their underlying causative mental states) to understand that inconsistent verbal and nonverbal cues may indicate a deceptive mental state, whereas consistent verbal and nonverbal cues may indicate an honest one.
Emotional Intelligence (EI)
Another possible contributor to variation in detection skill is EI. Definitions of EI vary, but generally researchers agree that EI describes intrapersonal and interpersonal competencies that converge on emotion perception, regulation, understanding, and utilization (Ciarrochi, Chan, & Caputi, 2000). This may be important in truth and deception detection; for example, Warren, Schertler, and Bull (2009) found that the ability to recognize emotional facial expressions was related to accurate detection of emotional lies/truths. EI is conceptually linked to ToM, as there is some overlap in the recognition of others’ emotional states, but they are distinct constructs (Ferguson & Austin, 2010). ToM comprises the ability to infer others’ mental states and to predict others’ behavior, although there can be an emotional component to some mental states in the case of affective ToM. Models of EI have been both ability-based (Salovey & Mayer, 1990) and trait-based (Bar-On, 2006). Trait EI relates to personality and is often measured through self-report. Ability EI relates to intelligence models of skills, in which EI has the potential to develop and is often examined through performance-based measures (Schutte, Malouff, & Bhullar, 2009; Schutte et al., 1998). Schutte, Malouff, and Thorsteinsson (2013) write, Ability emotional intelligence consists of an individual’s actual capacity for adaptive emotional functioning. The individual may or may not act on this capacity depending on factors such as the individual’s motivation and the opportunities and demands of situations. Trait or typical emotional intelligence describes to what extent an individual actually displays emotional competencies in everyday life. (pp. 63)
Many studies have shown that both trait and ability EI can be improved by training (Schutte et al., 2013).
A handful of studies have examined whether more highly developed EI facilitates discrimination accuracy. Wojciechowski et al. (2014) found that ability EI promotes the recognition and use of subtle facial expressions as potential cues to veracity. They also concluded that greater EI may enable the integration of perceived affective/nonverbal and cognitive/verbal cues and the identification of inconsistencies between these cues, which is notable because inconsistent cues can signal deception. However, Baker, ten Brinke, and Porter (2013), using a trait measure of EI, found that global EI was not related to discriminating between high-stakes emotional truths and lies. Instead, a negative relationship existed between the emotionality factor of EI (perceiving and expressing emotion) and detecting liars. The researchers suggested that highly emotionally intelligent individuals may be gullible to deception because they are less able to temper their empathy with detached reasoning; hence, they may develop sympathy for liars and wrongly judge them as truthful. Importantly, the findings also suggest the possibility that EI is differentially related to truth versus deception detection. Fellner et al. (2007) found that higher trait EI was unrelated to detection and processing of simulated emotional facial expressions. Self-report trait EI measures may not accurately reflect ability and may be vulnerable to overconfident and misleading responding (Fellner et al., 2007; Petrides, Perez-Gonzalez, & Furnham, 2007). These equivocal findings may derive partly from differences in measurement (trait- versus ability-based EI) and stimulus materials (simulated versus real, high-stakes emotions), and so more research is necessary. The present work focused on trait EI as a self-reported indication of everyday emotional skills because it likely has less overlap with ToM; both ToM and ability EI are usually examined through performance-based measures. Indeed, Qualter, Barlow, and Stylianou (2011) found that ability EI was linked to two different ToM measures in younger and older children, whereas trait EI was only linked to the more sophisticated ToM measure in older children.
Attention
Although some research has examined the role of cognitive functions in producing lies (e.g., Christ, van Essen, Watson, Brubaker, & McDermott, 2009), little work has examined the role of cognitive functions in detecting lies. Existing studies often investigate higher cognitive functions (Fellner et al., 2007), even though basic cognitive functions, such as attention, may be essential. Directing one’s attention quickly and appropriately may facilitate relevant cue perception. Some evidence suggests that some aspects of attention (gaze perception, joint attention) are critical to detecting deception (Frischen, Bayliss, & Tipper, 2007). On the contrary, Phillips, Tunstall, and Channon (2007) found that detecting deceptive social cues does not require additional attentional resources (working memory load) compared with other types of (truthful) social cues. In the current study, we examine three related attentional processes. Faster alerting (initiating and maintaining an alert state) may be necessary to perceive relevant cues. Faster orienting (selectively focusing on a stimulus) may help individuals pay attention to particular diagnostic cues. Finally, better executive control (attending to appropriate responses while inhibiting conflicting ones) may aid truth detection and particularly deception detection by allowing an observer to suppress responses generated from inconsistent observed cues or through truth bias.
The Present Study
One explanation for the inconsistent findings outlined above is that operationalizing truth and deception detection as a single construct obscures the different contributions of EI, ToM, and attention to each. Furthermore, the two highlighted accounts make differing predictions about truth and deception detection and individual differences. The Leakage Account suggests that targets vary greatly in their leakiness. Empirical evidence supportive of this account demonstrates that, in turn, observers vary greatly in their high-stakes discrimination accuracy. The Leakage Account would be supported by evidence of the intersection of these in which less transparent targets are typically judged accurately by the most skillful observers (with some lucky guesses from others) while more transparent targets are judged accurately by both more- and less-skillful observers. The Leakage Account would be further supported by evidence that individual differences in ToM, EI, and attention are predictive of variation in accurate veracity judgments.
In contrast, the FTL Account suggests that a dichotomous split exists between a few transparent liars and the rest. Thus, the FTL Account predicts that targets’ transparency and observers’ skill do not intersect because observers’ accuracy is based on the transparency of some targets and the opacity of the rest, rather than variation in observers’ capacity. Therefore, because it suggests a lack of natural variation in observers’ detection ability, the FTL Account would be consistent with evidence of no predictive relationship between individual differences in ToM, EI, and attention and any variation in accurate veracity judgments.
Therefore, using an exploratory approach, we investigated two main questions. First, is there a relationship between observer skill and target transparency? We computed the percentages of observers who correctly categorized each target (higher percentages indicate more transparent liars and truth-tellers) and the mean overall accuracy rates of the observers who correctly categorized each target (higher means indicate that the group of observers are generally more skillful). A negative relationship between these would demonstrate that as the percentage of observers who correctly categorized each target decreases (i.e., due to targets demonstrating decreasing transparency across the sample of targets), the mean accuracy rate of correct observers for each target increases (i.e., correct observers demonstrate increasing skill); this would be consistent with the Leakage Account. No relationship would be consistent with the FTL Account. The second key question was whether individual differences in EI, affective ToM, cognitive ToM, and attention (alerting, orienting, and executive control) contributed to variation in truth and deception detection. We predicted that distinctive, nonoverlapping groupings of these abilities underlie truth versus deception detection accuracy. However, we could not predict exactly which of these processes would support one versus the other because of the limited scope of the literature and the inconsistent findings of existing research.
Method
Participants
University staff and students were recruited via opportunity sampling (see Table 1 for sample characteristics). Participants were reimbursed with £15 and student participation credits where applicable (n = 30). The sample size of 115 was determined with an a priori power analysis utilizing parameters of Cohen’s f2 = 0.15, power = 80%, and α = .05 for nine predictors (Faul, Erdfelder, Buchner, & Lang, 2009).
Participant Characteristics and Scores on Outcome Measures.

Note. EI = emotional intelligence; RMET = Reading the Mind in the Eyes Test; ToM = theory of mind; SST = Short Story Task; ANT = Attention Network Test.
Participants were required to be native or fluent English speakers and have no serious visual or hearing impediments. The study was given ethical approval by the University of Chester Department of Psychology Ethics Committee and executed according to the Declaration of Helsinki. Participants gave written consent.
Materials and Procedure
Six measures were administered in a laboratory setting although some were computerized, as indicated. Participants first completed a computerized demographics questionnaire presented in Bristol Online Surveys (BOS), which collected data on age, gender, ethnicity, occupation and/or studies, and languages spoken. This information was used to fully describe the sample; it was not used in the inferential analysis. The remaining measures were administered in an individually randomized order for each participant.
Assessing Emotions Scale (AES)
The AES (Schutte et al., 2009; Schutte et al., 1998) is a self-report trait EI measure based on Salovey and Mayer’s (1990) ability-based model, which comprises expression and understanding of emotion, emotion management, and using emotions in problem solving. Participants responded to 33 statements, presented in BOS, about their experience of emotions in the self and others, including the meaning and use of emotions in their everyday lives on a 5-point Likert-type scale (1 = do not agree to 5 = completely agree). Three items were reverse coded. The AES produces a total EI score (scored 33-165) and four subscale scores: Perception of Emotions (10 questions; scored 10-50), Managing Emotions in the Self (nine questions; scored 9-45), Managing Others’ Emotions (eight questions; scored 8-40), and Utilizing Emotions (six questions; scored 6-30). The AES has good convergent validity, internal and test–retest reliability, and discriminant validity (Schutte et al., 2009; Schutte et al., 1998). In our sample, the Cronbach’s alphas were .727 for Perception of Emotions, .724 for Managing Emotions in the Self, .601 for Managing Others’ Emotions, and .519 for Utilizing Emotions. We selected the AES because of its wide use and its ease of administration. Furthermore, as a self-report trait-based measure, the conceptualization of EI in the AES was thought to be distinguishable from affective ToM measured by the performance-based Reading the Mind in the Eyes test (RMET; Baron-Cohen, Wheelwright, Hill, Raste, & Plumb, 2001).
RMET
The revised RMET (Baron-Cohen et al., 2001), also presented in BOS, measured affective ToM. Participants responded to 36 grayscale pictures of eye regions (and one unscored practice item) by choosing which one of four emotion words best describes the eyes’ expression. Definitions of the response options and examples of each used in a sentence were presented. The total number of correct responses (0-36) was recorded for each participant. The RMET discriminates among groups who vary in their ToM abilities (e.g., adults with and without autism), has been widely used, and has a lower risk of ceiling effects (Baron-Cohen et al., 2001). We will refer to this predictor as “RMET Affective ToM.”
Short Story Task (SST)
The SST (Dodell-Feder, Hope, Lincoln, Coulson, & Hooker, 2013) measured cognitive ToM. Participants first read The End of Something by Ernest Hemingway (originally published 1925). Then the researcher conducted an audio-recorded structured interview which measured Comprehension (five questions), Spontaneous Mentalizing (one question), and explicit ToM Reasoning (eight questions). Participants responded freely and verbally. Responses were coded according to Dodell-Feder et al.’s (2013) instructions, with the Comprehension and ToM Reasoning responses being awarded a 0, 1, or 2 depending on their accuracy and comprehensiveness. The Spontaneous Mentalizing response was awarded a 0 or 1 based on the absence or presence of spontaneous mentalizing language about the story’s characters. Scores range from 0 to 10 for Comprehension, 0 to 16 for ToM Reasoning, and 0 to 1 for Spontaneous Mentalizing. Although the SST has good inter-rater reliability and convergent validity, Dodell-Feder et al. suggested that internal reliability for ToM Reasoning would be lower due to the range of ToM areas probed. We selected the SST for cognitive ToM because it has a lower risk of ceiling effects compared with similar tests.
Prior to the present study, 12 separate participants completed the SST for the purpose of coding calibration among the researchers. Furthermore, 25% of interviews (n = 29) were coded by all authors. Inter-rater reliability was assessed using a two-way random effects intraclass correlation coefficient (ICC) for single measures (Comprehension ICC = .933, 95% confidence interval [CI] = [.880, .965]; ToM Reasoning ICC = .892, 95% CI = [.812, .944]) and Cohen’s kappa for Spontaneous Mentalizing (average κ = .851). One author completed the coding for all participants. For the analysis, we used ToM Reasoning scores as a measure of cognitive ToM; we refer to this predictor as “SST Cognitive ToM.”
Attention Network Test (ANT)
The ANT measures the efficiency of attention in three areas: alerting, orienting, and executive control (Fan, McCandliss, Sommer, Raz, & Posner, 2002). Alerting refers to entering and maintaining an alert state, orienting refers to selectively attending to incoming sensory information, and executive control refers to selecting appropriate responses while inhibiting conflicting ones (Fan et al., 2002). The task was presented on a laptop with a 30.48-cm screen. Participants were positioned with their eyes 42.40 cm away from the screen (following Fan et al.’s instructions) with their thumbs resting on the right and left trackpad buttons. Participants completed a practice block of 24 trials with feedback followed by three no-feedback experimental blocks of 96 trials each. Participants could take a break between each block, and their distance was remeasured and adjusted as necessary. Participants were briefly reminded about the instructions after each block. Each trial required participants to respond as quickly and accurately as possible to a target arrow by pressing the appropriate trackpad button to indicate whether the target arrow was pointing right or left. Reaction times (RT) in milliseconds (ms) and accuracy were recorded. Sometimes the target arrow was accompanied by flankers which were either lines or arrows pointing in the same or opposite direction. Each trial contained five events. First, there was a fixation period whose duration varied randomly between 400 and 1,600 ms. Then, a warning cue (no cue, center cue, double cue, or spatial cue) was displayed for 100 ms. This was followed by a 400-ms-long fixation period after which the target arrow (and flankers) appeared. They remained until the participant responded or for a maximum of 1,700 ms. Participants then viewed another fixation point for a time equal to 3,500 ms minus the first fixation time and minus the RT. The ANT produces three scores calculated over correct trials. The Alerting Effect equaled the mean RT of the no-cue condition minus the mean RT of the double-cue condition. The Orienting Effect equaled the mean RT of the spatial-cue conditions minus the mean RT of the center-cue condition. The Executive Control Effect equaled the mean RT of the incongruent flanker condition minus the mean RT of the congruent flanker condition. Larger values indicated greater impact of an alerting cue, greater impact of an orienting cue, and slower inhibition, respectively. Fan et al. found that raw RTs had good test–retest reliability although the test–retest correlations for each effect were .52, .61, and .77, respectively. They also found that the three effects were independent of each other. We selected the ANT because it could quickly assess three independent areas of attention and has been widely used.
Truth and Deception Detection Videos Task
We used a high-stakes truth and deception detection accuracy task following the methods of Wright Whelan et al. (2015a) but with materials expressly compiled for the present study. This paradigm has been used in several previous studies, with different populations, resulting in overall accuracy rates ranging from 49% to 72% (e.g., Baker et al., 2013; Canter, Ioannou, Youngs, & Chungh, 2016; Wright Whelan et al., 2015a). Participants viewed 20 video clips of individuals making pleas for help with missing or murdered relatives in real-life criminal investigations. These pleas were originally broadcasted in news conferences and programs and were included because they satisfied stringent criteria for establishing ground truth (ten Brinke & Porter, 2012; Vrij & Mann, 2001b), were not recent and high profile in the United Kingdom, and were made soon after the event. (See the Supplemental Material for summaries of the cases used.) Ten pleaders were honest and 10 were dishonest (as determined by outcome convictions in each case). The honest pleaders did not know what had happened to their relative, and later someone else was convicted for the relative’s disappearance or death or their relative had voluntarily disappeared. The dishonest pleaders had already killed their relatives and were later convicted for involvement in the death. Pleas were selected to provide a balance of sex and relationship (e.g. partner, child) in both groups. Some videos contained more than one person, but participants were asked to respond about the main speaker. Before each video, the researcher described the familial relationship between the pleader and the missing or murdered person. Some videos also indicated the name and age of the missing person as part of the content of the broadcast; for these videos only, the researcher also verbally presented this information prior to each. Participants were asked to indicate their responses of either “lying” or “truthful” on paper. Participants were also asked to indicate whether they were familiar with the case. Where participants indicated familiarity, the response to that video was discarded from scoring (63 responses total, or 2.7%). Because it was possible that responses to each video would influence subsequent responses, the presentation order was individually randomized for each participant to control for order effects. The researcher administering this task remained blind to the pleaders’ veracity. Each response (correct or incorrect) was recorded.
Most participants completed the measures in a single 1.5-hr session. Nine participants attended two sessions (four had a 1-day gap; five had a 1-week gap) due to personal time constraints. In rare cases, technical issues with BOS meant that paper versions of the demographic questionnaire (n = 3), AES (n = 4), and RMET (n = 3) were administered. To check that these events did not affect the results, data from participants who had completed split sessions or who completed paper versions of computerized measures were excluded from a reanalysis of the data, but the pattern of findings remained the same.
Analysis
We initially explored the data through four analyses. First, a signal detection analysis examined the degree of bias in the detection task. Second, we used one-sample tests (t test or Wilcoxon as appropriate) to compare the sample’s detection accuracy rates with a chance performance level designated as .50. Third, we ran a correlation between the truth and deception detection accuracy rates. Fourth, a t test compared the difference in the mean truth and deception detection rates.
To test the first research question (whether there was a relationship between observers’ skill and targets’ transparency), we ran a correlation. We first calculated the percentage of observers who correctly categorized each target. Higher percentages indicated more transparent targets. We then calculated the mean overall accuracy rates of the observers who correctly categorized each target. Higher rates indicated that those observers tended to have higher accuracy rates overall (i.e., they tended to be more skillful observers). A negative relationship would demonstrate that as observers’ mean accuracy rates increase across the sample of targets (i.e., increasingly skillful observers), the percentage of observers who correctly categorized each target decreases (i.e., decreasingly transparent targets). This would occur because less transparent targets would be accurately categorized primarily by observers who are more skillful overall.
For our main analysis investigating the contribution of individual differences to variation in truth and deception detection accuracy, we fitted a series of mixed logit models (MLMs; Jaeger, 2008) in R (R Development Core Team, 2017) to the data. MLMs are a type of generalized linear mixed model (GLMM) that model both fixed effects (e.g., measured predictors) and multiple random effects simultaneously (see Clark, 1973) for a categorical dependent variable, allowing more variance to be modeled compared with other common analysis strategies (e.g., ANOVA or logistic regression; Jaeger, 2008). In addition, GLMMs typically have more statistical power because individual observations for each participant can be entered as GLMMs are able to account for this interdependence (Baayen, Davidson, & Bates, 2008). For interpretation of the MLMs, we referred to Baayen et al. (2008), Barr, Levy, Scheepers, and Tily (2013), and Jaeger (2008).
The dependent variable was a categorical measure of Hits (i.e., every correct/incorrect video task response). In the full model, we entered the predictors as interactions of each fixed effect (four EI subscales, SST cognitive ToM, RMET affective ToM, and three attentional effects) with Video Condition (Lie vs. Truth). This would tell us whether the fixed effects predicted Hits differently for the Lie versus Truth conditions. For the random effects, we included crossed random intercepts and slopes for Participants and random intercepts for Items (each Item being a video clip). The inclusion of random slopes for Video Condition in the Participants random effects term allows us to account for variation in each participant’s truth versus deception detection ability. Including random slopes for Video Condition in the Items random effects term was not possible as each item appeared in either the Lie or the Truth condition (see Baayen et al., 2008, for a detailed discussion of random effects structures for crossed vs. nested designs). Individual Truth Detection and Deception Detection trials were entered (excluding trials where the participant was familiar with the case). Predictors that had 95% CIs that did not cross zero were entered into a second model. The final model was compared with a null model that contained only the random effects terms to determine whether the final model was a significantly better fit for the data than the null model. The glmer function in the lme4 package (Bates, Maechler, Bolker, & Walker, 2015) was used to fit the MLMs using the binomial distribution in R. Laplace approximation was used to estimate the fixed effects parameters for the dependent variable (Hits). Given the number of fixed effects in the initial, most complex model, all fixed effects variables were rescaled. Model fit was checked by examining binned residual plots. The anonymized dataset and analysis code for this analysis can be found here: https://osf.io/3f7gx/
Results
Data Preparation
One hundred seventeen participants were tested, but two participants’ data were discarded because of a computer failure during data collection and because a participant voluntarily admitted to not following the ANT instructions. Data for 115 participants were used. One participant did not complete the AES, so his or her data are excluded from the MLMs containing EI variables. Distributions of the predictor variables were examined. There was no evidence of multicollinearity among the predictor variables (see Table 2).
Pearson’s Correlation Coefficients Among the Continuous Predictor Variables.

Note. EI = emotional intelligence; RMET = Reading the Mind in the Eyes Test; ToM = theory of mind; SST = Short Story Task; ANT = Attention Network Test.
Data Exploration
Table 1 presents the participants’ scores on the various measures. For the purpose of the signal detection analysis, correctly responding to truths = hits, correctly responding to lies = correct rejections, incorrectly responding to truths = misses, and incorrectly responding to lies = false alarms (these designations were arbitrary and apply to the signal detection analysis only). To calculate sensitivity, A′ was computed for each participant, and the sample mean A′ = 0.58 (SD = 0.16) was significantly better than chance, t(114) = 5.56, p < .001. To calculate bias, B″D was calculated for each participant and the sample mean B″D = −0.08 (SD = 0.45). There was no significant bias, t(114) = 1.83, p = .069.
Forty-one participants performed above chance (designated as .50) for truth detection only, 29 for deception detection only, 29 for both truth and deception detection, and 16 for neither truth nor deception detection. The sample’s mean accuracy rate was above chance for both truth detection (58% [SD = 15%], one-sample Wilcoxon signed-rank test, p < .001) and deception detection, 53% (SD = 17%), t(114) = 2.04, p = .043, 95% CI of the difference = [0.001, 0.064]. These above chance mean accuracy rates are consistent with previous studies using this paradigm (e.g., Wright Whelan et al., 2015a). The accuracy rates for truth and deception detection were not significantly correlated (τ = –.122, p = .082). There was no significant difference in the mean accuracy rates for identifying truth-tellers versus liars, t(18) = 0.63, p = .536.
Research Question 1: Is There a Relationship Between Observers’ Skill and Targets’ Transparency?
We calculated the percentage of observers who correctly categorized each target as a measure of targets’ transparency (minimum = 20.18% to maximum = 83.81%). We then calculated the mean accuracy rates of the observers who correctly categorized each target as a measure of observers’ skill (minimum = 55% to maximum = 63%). These variables were significantly negatively correlated (τ = –.475, p = .006).
Research Question 2: What Individual Differences Support Truth and Deception Detection?
The full model included the nine predictors each interacting with Video Condition and random intercepts and slopes for Participants and random intercepts for Items. Table 3 shows the model’s parameter estimates. The only predictor interacting with Truth with a 95% CI that did not cross zero was ANT Alerting, while the predictors interacting with Lie with 95% CI that did not cross zero were SST Cognitive ToM and EI Perceiving Emotions. The positive values of their coefficients indicated that these were positive predictors of Truth Hits and Lie Hits, respectively.
Full Detection Model Parameters (n = 114).
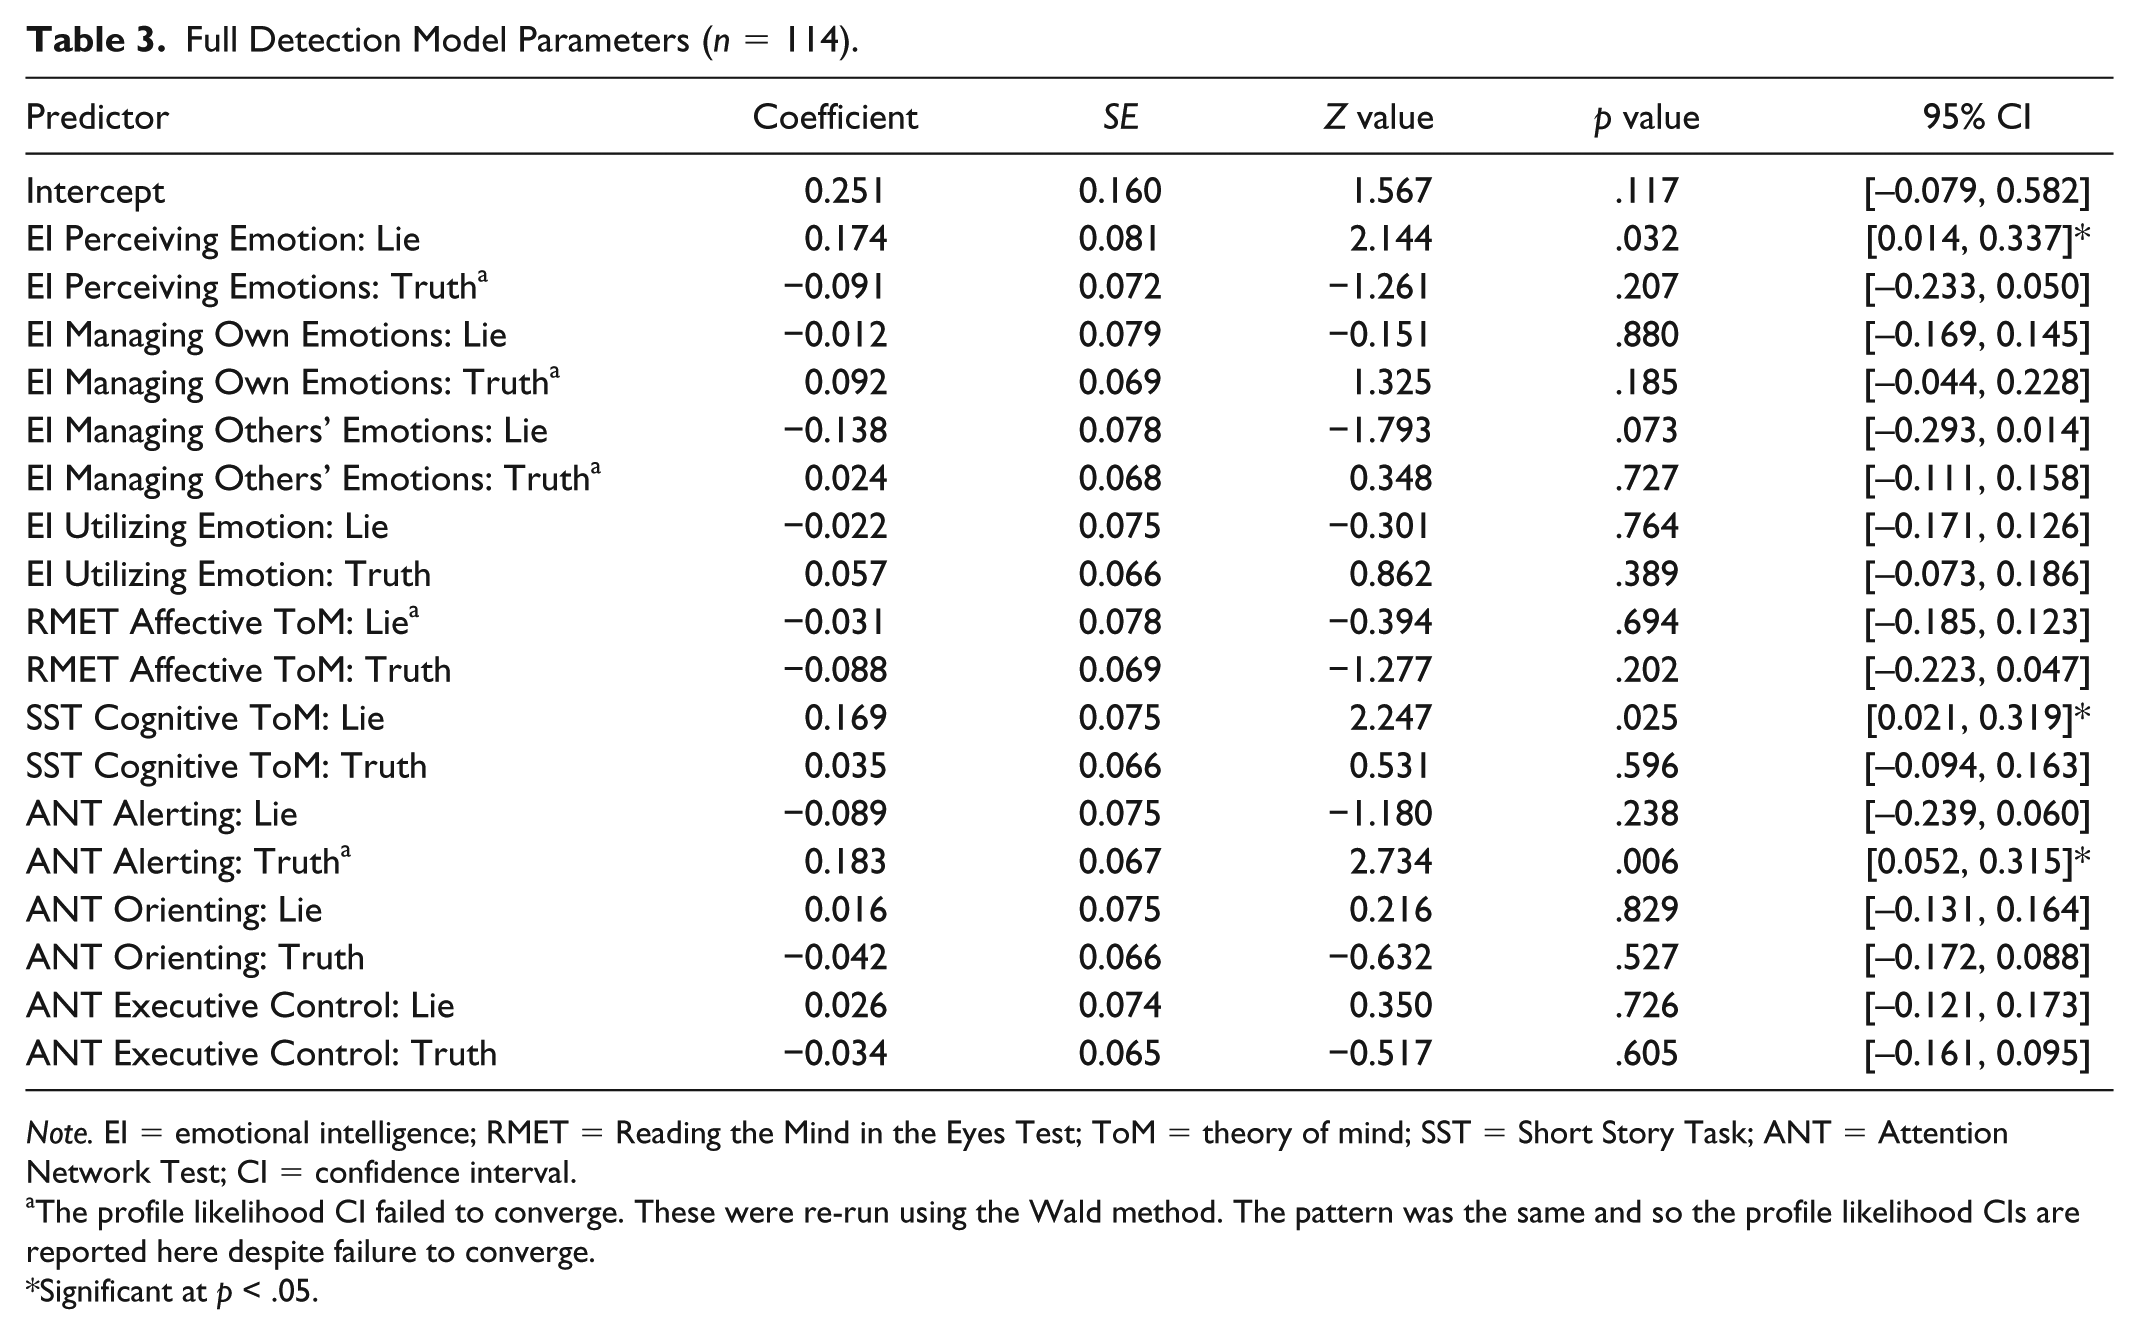
Note. EI = emotional intelligence; RMET = Reading the Mind in the Eyes Test; ToM = theory of mind; SST = Short Story Task; ANT = Attention Network Test; CI = confidence interval.
The profile likelihood CI failed to converge. These were re-run using the Wald method. The pattern was the same and so the profile likelihood CIs are reported here despite failure to converge.
Significant at p < .05.
The next model included these three predictors interacting with Video Condition and random intercepts and slopes for Participants and random intercepts for Items. However, the 95% CI for EI Perceiving Emotions crossed zero. This was a possible indicator that one of the excluded predictors acted as a suppressor. Suppressor variables are often characterized by no significant correlation with the dependent variable but may be correlated with one or more predictors. They suppress elements represented within the related predictor(s) which do not influence the outcome (Pandey & Elliott, 2010). Thus, when suppressor variables are included in the model, the coefficient of the related predictor increases and the predictive power of the model improves, although the suppressor variable is not necessarily a significant, independent predictor of the outcome. We re-ran the full model and systematically eliminated the predictors whose 95% CI crossed zero until we arrived at a model in which the 95% CI for EI Perceiving Emotions also crossed zero, indicating that the suppressor variable had been eliminated. Because there is some conceptual overlap among the EI subscales and between ToM and EI, the EI and ToM variables were eliminated first. When EI Managing Others’ Emotions was removed, the 95% CI for EI Perceiving Emotions crossed zero, indicating that EI Managing Others’ Emotions was the likely suppressor. We re-ran the small model, including ANT Alerting, SST Cognitive ToM, EI Perceiving Emotions, and EI Managing Others’ Emotions (interacting with Video Condition) and random intercepts and slopes for Participants and random intercepts for Items. This model failed to converge. We dropped the Items random effects term to preserve the inclusion of both slopes and intercepts for Participants, as intercepts-only models may inflate Type 1 error (Barr et al., 2013). This model converged. We then constructed a model without the suspected suppressor and the same random effects structure (i.e., random intercepts and slopes for Participants). The coefficient for EI Perceiving Emotions (interacting with the Lie condition) changed from 0.102 in the model without the suppressor to 0.137 in the model with the suppressor. The two models with and without EI Managing Others’ Emotions were compared, and there was no significant difference in their fit for the data, χ2(2) = 3.32, p = .190; Akaike information criterion (AIC) Model with suppressor = 3,046.8 versus AIC Model without suppressor = 3,046.2. Thus, because the more parsimonious model (i.e., without the suppressor) was not a better fit and produced a smaller coefficient for EI Perceiving Emotions, the model with the suppressor was selected as the final model. Table 4 shows its parameter estimates. 1 All variance inflation factor (VIF) values for the full and final models were less than 2.
Final Detection Model Parameters (n = 114).
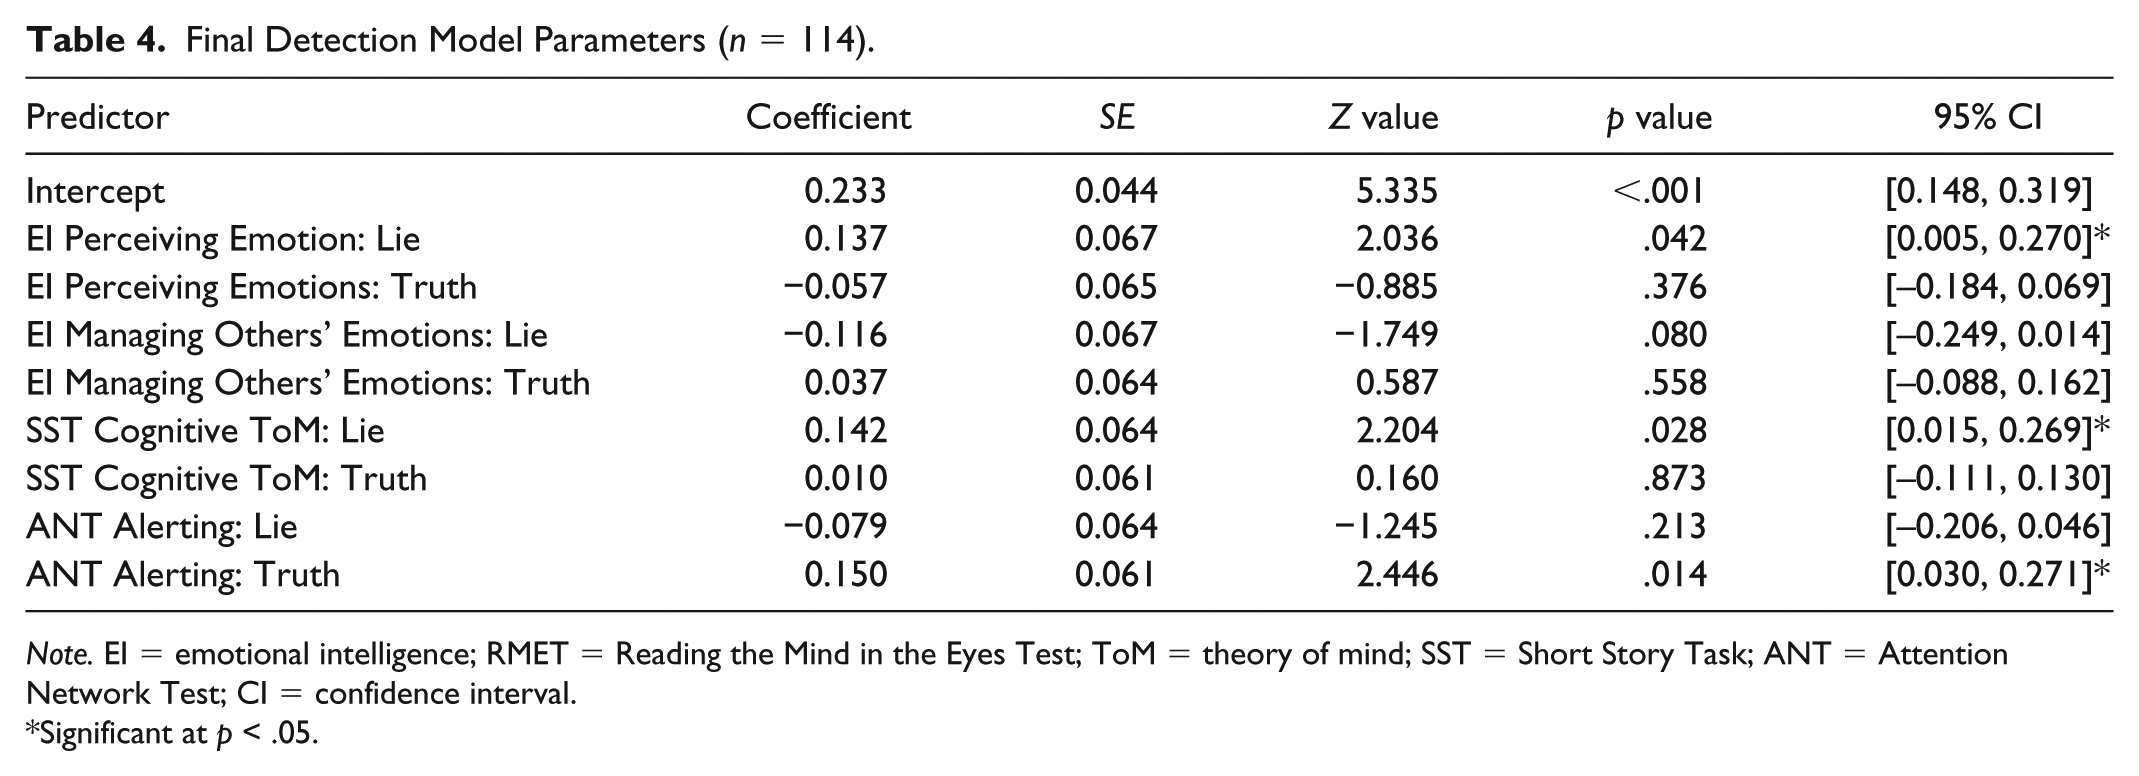
Note. EI = emotional intelligence; RMET = Reading the Mind in the Eyes Test; ToM = theory of mind; SST = Short Story Task; ANT = Attention Network Test; CI = confidence interval.
Significant at p < .05.
A null model containing random intercepts and slopes for Participants was created. The final model was a significantly better fit for the data than the null model, χ2(8) = 19.631, p = .012; AIC final model = 3,046.8 versus AIC null model = 3,050.5.
Discussion
Our exploratory study found evidence across two research questions that was consistent with the Leakage Account over the FTL account in explaining how observers succeed in passive veracity judgments. First, we found a negative relationship between target transparency and observer skill, meaning that, for example, observers who correctly identified less transparent targets tended to be more skillful. This relationship was consistent with the Leakage Account, whereas the FTL account would have been consistent with a lack of a relationship.
Our second main analysis demonstrated that truth and deception detection accuracy are separable because variation in truth versus deception detection accuracy is supported by different individual traits and functions. Our results do not mean that the variables which were unrelated to variation in detection accuracy are necessarily irrelevant to detection; rather, any variation in these other predictors was unrelated to variation in detection accuracy. The evidence that individual differences in EI, ToM, and attention are predictive of variation in accurate veracity judgments is consistent with the Leakage Account (a lack of such a predictive relationship would have been consistent with the FTL Account).
For truths, increasing accuracy was supported by faster attentional alerting speeds. Faster alerting may facilitate efficient and effective perception and processing of multiple cues and, therefore, improve the likelihood of making accurate truth judgments—but why is this not also the case for deception detection? In the case of lying, an observer needs to “diagnose” instances when verbal and nonverbal behaviors are inconsistent with each other or the context or when they seem “false” in some way; thus, it may take only one or two instances for an observer to “falsify” the idea that the target is telling the truth. In contrast, confirmation of truth-telling will be more successful if an observer is able to collect more “evidence” of truth-telling. Less transparent truth-tellers may send weak or “noisy” signals, meaning that observers must be more alert to perceive these. So, while confirming the truth may require an alert observer to collect many clues to truth-telling (leading to the relationship between faster attentional alerting and more accurate truth detection), deception detection may only require one or two falsifying cues; therefore, observers do not necessarily need to possess faster alerting to be successful. This result is consistent with Phillips et al.’s (2007) finding that detecting deception does not require additional attentional resources.
Furthermore, our research suggests that more successful lie detectors are better able to perceive emotions (like Warren et al., 2009) and also reason about others’ motivations, beliefs, and intentions (in contrast to Sylwester et al., 2012). A better ability to perceive emotions may help an observer become aware of a liar’s nongenuine emotional cues and/or detect emotions that suggest deceit, such as guilt. This may inform the reasoning process about the liar’s deceptive intentions, which may include the integration of (inconsistent) affective and cognitive input derived from the liar’s verbal and nonverbal behavior (Wojciechowski et al., 2014). Our results extend the findings of Baker et al. (2013), whose analyses demonstrated that highly emotionally intelligent participants developed considerable sympathy for liars, which negatively affected their ability to accurately categorize liars. Baker et al. concluded that individuals high in EI may not engage in detached reasoning because of a tendency to focus on emotions. While our findings show that better perception of emotion supported deception detection, they also demonstrated that cognitive ToM was key, which aligns with Baker et al.’s supposition that engagement in detached reasoning would be important for identifying liars. Our findings also support the Instrumental Mind-reading Account (Granhag & Hartwig, 2008), which argues for utilizing explicit ToM skills and which has attracted evidence that this results in more accurate veracity judgments during suspect interviews. Contrastingly, variation in affective ToM was unrelated to variation in detection accuracy. A greater ability to perceive and decode emotional mental states may not necessarily help an observer recognize increasingly believable emotional displays in less transparent liars or “noisy” displays in less transparent truth-tellers. Alternatively, the potential conceptual overlap between affective ToM and EI may mean that this was incorporated in the relationship between Perceiving Emotions and deception detection, or that a different measure of affective ToM (e.g., involving moving, rather than static, images; Golan, Baron-Cohen, Hill, & Golan, Baron-Cohen, Hill, & Golan, 2006) may show different results.
In considering the suppression effect, we must reflect upon elements in the construct of Perceiving Emotions which may be suppressed by Managing Others’ Emotions and which are irrelevant to the outcome (Pandey & Elliott, 2010); this is more of a theoretical and measurement consideration than a statistical one. As measured by the AES, Managing Others’ Emotions encompasses using social skills, engaging in social interactions, and displaying empathy; these are also necessary to develop and hone one’s capacity to perceive emotions. Thus, the suppressor effect suggests that it is those aspects of Perceiving Emotions which do not overlap with Managing Others’ Emotions that were critical to deception detection accuracy, that is, the pure recognition and understanding of emotions as independent from additional demands dictated by using social skills, engaging in social interactions, and displaying empathy, as these were not involved in our passive detection task. Where detection involves social interaction (e.g., suspect interviewing), managing others’ emotions may become a significant supporting factor. It is also worth considering why Managing Own Emotions and Utilizing Emotions were not linked to variation in accuracy. Because of the noninteractive nature of the detection task, it may be that an observer’s ability to monitor and manage his or her own emotions was unimportant. Given Baker et al.’s supposition that highly emotionally intelligent people can be gullible to liars, a greater ability to monitor and manage one’s own emotions may become key in interactions (e.g., suspect interviewing). Finally, given the conceptual overlap between cognitive ToM, which involves explicit reasoning, and Utilizing Emotions, which involves emotional problem solving, it may be that cognitive ToM could better account for the variance in deception detection accuracy.
Our results suggest that truth and deception detection are at least partially distinct: There was no overlap in the predictors of truth versus deception detection and no significant relationship (either positive or negative) between truth and deception detection accuracy rates. Future work may achieve clearer conclusions by examining truth and deception detection separately (Levine et al., 1999; Mann et al., 2004). Both are likely complex processes that engage numerous psychological processes, more than could be explored here (e.g., processing paralinguistic cues that accompany spoken language). Indeed, there may be many more traits and abilities that contribute to truth and deception detection, for example, personality variables related to emotional processing such as those of the Dark Triad (i.e. psychopathy, Machiavellianism, and narcissism). Although some research has found no relationship between psychopathy and deception detection (e.g., Peace & Sinclair, 2012), other findings indicate potential moderation effects of sex on primary psychopathy, and also on Machiavellianism and narcissism (e.g., Lyons, Croft, Fairhurst, Varley, & Wilson, 2017), and the ability to detect deception. Furthermore, future research should target constructs that interact with EI, cognitive ToM, and attentional alerting. For example, mood affects discrimination accuracy as well as EI and attention in terms of whether verbal or nonverbal cues are perceived and utilized (Reinhard & Schwarz, 2012). General cognitive ability (as measured through vocabulary ability) may influence both ToM (e.g., Charlton, Barrick, Markus, & Morris, 2009) and EI (e.g., Ferguson & Austin, 2010). Finally, while our research suggests that trait Perceiving Emotions is related to deception detection, future research should investigate the contribution of ability EI, given the equivocal nature of previous findings as well as the limitations of self-report measures such as the AES, in contrast to performance-based ability tests. Although these example potential predictors were individually unmeasured in our study, the inclusion of random effects in the MLMs effectively captures the additional random variance resulting from these sources.
The effort to discover any additional unique predictors of truth and deception detection would be relevant to many areas. First, deception detection is central to many forensic investigations. Second, because people with conditions such as autism and schizophrenia often experience deficits in ToM (Baron-Cohen et al., 2001; Brüne, 2005), EI, and attention (Eack et al., 2013), they would likely have difficulty identifying liars, making them vulnerable to manipulation and harm. Finally, a better understanding of how individuals process truths and lies is applicable to the navigation of serious social situations in relationships, such as a romantic partner engaging in an affair. Furthermore, a key implication is that interventions that directly target traits that contribute to truth and deception detection may also improve truth and deception detection accuracy. Indeed, both trait and ability EI can be developed and improved (Schutte et al., 2013), and Granhag and Hartwig (2008) demonstrated that training in utilizing cognitive ToM led to improved discrimination accuracy. Such training would be applicable to professions where veracity judgments are routinely made (e.g., human resources, parole boards, social work, and investigations of benefit and insurance claims).
One potential limitation is that the majority of participants were female and relatively highly educated. Meta-analytic findings suggest that neither sex nor education levels relate to discrimination accuracy (Aamodt & Custer, 2006), and so it is unlikely that these sample characteristics affected the findings regarding the accuracy. However, there is some evidence that women score higher than men on some measures of EI (Joseph & Newman, 2010; Schutte et al., 1998), and therefore, replication in samples balanced for sex would be useful. Furthermore, two EI subscales (Managing Others’ Emotions and Utilizing Emotions) lacked high reliability, which may reflect the fewer items composing these subscales. As neither subscale predicted truth nor deception detection, this limitation is unlikely to have affected the key findings. However, it is unknown whether these constructs may have been significant predictors if their measurement had been more reliable. Future research should use an EI measure with a higher number of items.
In sum, the Leakage Account and supportive empirical work demonstrate that high-stakes truth-tellers versus liars display differing constellations of intensities and frequencies of verbal and nonverbal signals, and these signals inform the observer’s decision-making process about the target’s veracity. Our results show that improved perception and understanding of these distinctive constellations of signals rely on different traits for truthful versus deceitful contexts. Specifically, the present study demonstrated that truth and deception detection are separable constructs supported by different individual abilities: attentional alerting, and perception of emotion and cognitive ToM, respectively. Replication of these findings and the identification of other key supporting factors would greatly increase our understanding of how humans determine when they are being told the truth and when they are being lied to, and whether these traits can be bettered to improve the ability to identify truth-tellers and liars. After all, as demonstrated by real-world, high-stakes situations such as those in our study, identifying lies and truths can sometimes be a matter of life and death.
Supplemental Material
Stewart_OnlineAppendix – Supplemental material for Deception Detection and Truth Detection Are Dependent on Different Cognitive and Emotional Traits: An Investigation of Emotional Intelligence, Theory of Mind, and Attention
Supplemental material, Stewart_OnlineAppendix for Deception Detection and Truth Detection Are Dependent on Different Cognitive and Emotional Traits: An Investigation of Emotional Intelligence, Theory of Mind, and Attention by Suzanne L. K. Stewart, Clea Wright and Catherine Atherton in Personality and Social Psychology Bulletin
Footnotes
Declaration of Conflicting Interests
The author(s) declared no potential conflicts of interest with respect to the research, authorship, and/or publication of this article.
Funding
The author(s) disclosed receipt of the following financial support for the research, authorship, and/or publication of this article: The work was supported by a grant from the University of Chester to the first and second authors.
Supplemental Material
Supplemental material is available online with this article.
Notes

References
Supplementary Material
Please find the following supplemental material available below.
For Open Access articles published under a Creative Commons License, all supplemental material carries the same license as the article it is associated with.
For non-Open Access articles published, all supplemental material carries a non-exclusive license, and permission requests for re-use of supplemental material or any part of supplemental material shall be sent directly to the copyright owner as specified in the copyright notice associated with the article.
