




Abstract
Global well-being is positively correlated with health. Moreover, studies suggest that health and global well-being predict changes in one another across time. Fewer studies, however, have examined the extent to which health is associated with daily emotional experiences—especially longitudinally. The present study examined the longitudinal associations between health and both global and experiential well-being, assessed 4 times across 3 years. Moreover, we used advanced analyses—random-intercept cross-lag models—which address limitations of traditional cross-lag models. Results revealed health and well-being generally did not prospectively predict changes in one another across 1 year. In contrast, year-to-year changes in health were correlated with simultaneous changes in well-being—with effect sizes being largest for global well-being. These findings suggest that health and well-being change together in processes that unfold relatively quickly. Finally, using traditional cross-lag models, numerous potentially illusory prospective associations between health and well-being emerged, underscoring the importance of using appropriate longitudinal statistical models.
Subjective well-being refers to people’s overall evaluations of the positivity of their lives, as well as the day-to-day balance of their emotions (Diener, 1984). One of the oldest psychological questions—explored even by Hippocrates thousands of years before psychology emerged as a science—is the extent to which physical health and subjective well-being mutually influence one another (Friedman & Kern, 2014). Reflecting this enduring interest, a large body of research has consistently demonstrated associations—both cross-sectional and longitudinal—between people’s health and their global life satisfaction and trait affect (for overviews, see Friedman & Kern, 2014; Krantz & McCeney, 2002; Pressman & Cohen, 2005).
Recently, however, scholars have emphasized that people’s experiential well-being—the emotions they experience on a daily basis—only correlates moderately with global life satisfaction and trait affect (Anusic, Lucas, & Donnellan, 2017; Hudson, Lucas, & Donnellan, 2017; Robinson & Clore, 2002a). This raises the possibility that experiential and global well-being may have different associations with important life outcomes, such as health. Thus, it is critical to study both aspects of well-being (Tay, Chan, & Diener, 2014). To that end, the extent to which health relates to experiential well-being—especially longitudinally—remains poorly understood. The purpose of this study was to fill this gap in the empirical literature.
Health and Global Well-Being
A substantial body of research has examined the associations between health and global well-being (people’s overall evaluations of their life satisfaction and trait positive and negative affect; for example, Diener, Emmons, Larsen, & Griffin, 1985; Watson, Clark, & Tellegen, 1988). Specifically, many studies have converged on the finding that global well-being and health are positively associated with correlations ranging from approximately r = .10 to .50 (Friedman & Kern, 2014; Kööts-Ausmees & Realo, 2015; Pressman & Cohen, 2005; Røysamb, Tambs, Reichborn-Kjennerud, Neale, & Harris, 2003). Moreover, recent research suggests that these associations are evident in more than 30 countries (Kööts-Ausmees & Realo, 2015). Notably, although the correlations are strongest between people’s self-report ratings of their overall health and global well-being, global well-being also correlates with objective health outcomes, including cardiovascular functioning, sleep problems, incidence of various diseases, response to medical treatments, hospitalization rates, and even mortality (e.g., Gana, Broc, Saada, Amieva, & Quintard, 2016; Krantz & McCeney, 2002; Lee et al., 2013; Martín-María et al., 2016; Nes, Røysamb, Reichborn-Kjennerud, Tambs, & Harris, 2005; Pressman & Cohen, 2005).
Although there is considerable empirical evidence that health and well-being are positively correlated—there is far less agreement about why this association exists (Friedman & Kern, 2014). Specifically, scholars have proposed at least three mechanisms. First, part of the association between health and well-being is likely attributable to both variables’ shared variance with common causes. For instance, twin studies suggest that up to 60% of the correlation between health and well-being can be explained by genetics (Nes et al., 2005; Røysamb et al., 2003). Similarly, personality traits may have downstream consequences on both health and well-being, thereby contributing to the correlation between the two (Larsen, 1992; Watson & Pennebaker, 1989). For example, high neuroticism may cause individuals to feel less satisfied with their lives and also exacerbate the perceived or actual incidence and severity of health symptoms. Nevertheless, research suggests that genetics and individual differences do not fully explain the correlations between health and well-being (Larsen, 1992; Nes et al., 2005; Røysamb et al., 2003).
A second mechanism is that health may have a causal impact on well-being (e.g., Diener, Suh, Lucas, & Smith, 1999; Dolan, Peasgood, & White, 2008). Specifically, individuals’ well-being is presumed to reflect some objective characteristics of their lives (Diener, 1984). Thus, health problems—especially ones that are perceived to be severe and/or interfere with ability to function normally—theoretically should be associated with reductions in well-being (Diener et al., 1999). And indeed, longitudinal studies generally converge on the finding that poor health and/or the onset of disability predict subsequent drops in global well-being (e.g., Brief, Butcher, George, & Link, 1993; Gana et al., 2013; Lee et al., 2013; Lucas, 2007).
A final—and more controversial—potential mechanism is that well-being may also impact health (e.g., Diener & Chan, 2011; Krantz & McCeney, 2002; Pressman & Cohen, 2005; Steptoe, Deaton, & Stone, 2015). Specifically, there are at least two processes via which well-being may lead to better health (for an overview, see Krantz & McCeney, 2002; Pressman & Cohen, 2005). First, high well-being may lead individuals to engage in greater health-promoting behaviors (e.g., better sleep, more exercise, greater socializing, healthier diet). In turn, these health-promoting behaviors may facilitate better health outcomes. Thus, well-being may indirectly influence health via lifestyle. Second, positive and negative emotions may also directly facilitate or impede health, respectively, by producing physiological changes that impact cardiovascular and immune system functioning. For example, positive affect may reduce cortisol—a stress hormone thought to inhibit health—and increase prolactin and growth hormones, which are thought to promote health (Pressman & Cohen, 2005).
Notably, although the notion that well-being impacts health enjoys widespread popular appeal (e.g., positive thinking purportedly staves off illnesses; Friedman & Kern, 2014), the empirical evidence is inconclusive. On one hand, several experiments have found that interventions designed to boost well-being also lead to better health (e.g., Burton & King, 2004, 2008; Fredrickson, Cohn, Coffey, Pek, & Finkel, 2008). For example, participants assigned to journal about positive experiences had greater well-being and fewer doctor visits over the subsequent 3 months, as compared with controls (Burton & King, 2004). Similarly, several longitudinal studies have found that well-being predicts subsequent health, including better self-rated health, more favorable response to treatment, and even lower mortality (e.g., Benyamini, Idler, Leventhal, & Leventhal, 2000; Gana et al., 2016; Gandy, Coberley, Pope, & Rula, 2014; Lee et al., 2013).
In contrast, other longitudinal studies have found little evidence that well-being predicts subsequent health—especially once baseline health is controlled (Gana et al., 2013; Liu et al., 2016; Martín-María et al., 2016). Indeed, several scholars have concluded that, at best, there is inconclusive evidence regarding whether well-being has a causal impact on health (Friedman & Kern, 2014)—or, at worst, that any causal associations between health and well-being are likely to be due to health impacting well-being, rather than vice versa (Dolan et al., 2008).
Health and Experiential Well-Being
As alluded above, the vast majority of prior research examining health and well-being has used global measures of well-being—in which participants rate their life satisfaction or trait positive and negative affect (e.g., Diener et al., 1985; Watson et al., 1988). Recently, however, scholars emphasized that well-being can be separated into at least two components: (a) individuals’ global evaluations of their lives and (b) their day-to-day experiences of well-being (e.g., momentary positive and negative affect; Hudson et al., 2017; Kahneman, 1999). Moreover, global and experiential well-being do not perfectly correlate with one another (e.g., Anusic et al., 2017; Hudson, Lucas, & Donnellan, 2016; Robinson & Clore, 2002a). Thus, for example, it is possible for an individual to experience predominantly negative emotions in vivo yet nevertheless globally appraise his or her life positively (e.g., performing demanding albeit meaningful work).
Researchers are divided with respect to whether the divergence between global and experiential measures indicate that global measures are less valid than experiential ones (e.g., Kahneman, 1999; Robinson & Clore, 2002a)—or whether global and experiential measures simply tap somewhat different aspects of well-being (Kim-Prieto, Diener, Tamir, Scollon, & Diener, 2005). With respect to the idea that global measures lack validity, it is possible, for example, that individuals suffering from objectively poor life circumstances use cognitive strategies (e.g., downward comparisons) to form overly positive global evaluations of their well-being that are not accurate summations of the quality of their moment-by-moment emotional experiences. In other words, people may be cognitively motivated to downplay objectively negative circumstances when subjectively evaluating the overall quality of their lives. Such a phenomenon might cause experiential well-being to be a more accurate reflection of people’s actual well-being and thus to correlate more strongly than global well-being with external criteria such as health (Kahneman, 1999).
In contrast, neither lived experiences nor subjective impressions of overall well-being alone may fully capture the overall quality of individuals’ lives. Rather, both types of well-being may provide distinct albeit valid information concerning people’s quality of life. For example, individuals’ construal of events in their lives may be as psychologically consequential as the objective events that transpired (e.g., Davila & Sargent, 2003). Thus, fully understanding well-being may require assessing both experiential and global well-being, and both may uniquely predict external criteria (Kim-Prieto et al., 2005).
Irrespective of this debate, the fact that global and experiential well-being are distinguishable raises the possibility that they may have different associations with important outcomes (Diener & Tay, 2014; Kim-Prieto et al., 2005). For example, individuals with higher income tend to report greater life satisfaction as compared with their poorer peers—but income is unrelated to in vivo happiness (e.g., Hudson, Lucas, Donnellan, & Kushlev, 2016; Kahneman & Deaton, 2010).
As with income, it is important to understand whether both experiential and global well-being are associated with health (e.g., Kim-Prieto et al., 2005; Tay et al., 2014). For example, it may be the case that, as with money, health problems have the potential to impact global evaluations of well-being, but that they have little enduring effect on daily affective experiences (e.g., because people’s emotions eventually adapt to new circumstances), or vice versa. Speaking to this issue, several existing studies have examined the cross-sectional associations between health and experiential well-being—and have generally found that, mirroring global measures, experiential positive affect is correlated with greater health, whereas experiential negative affect is associated with worse health (e.g., Daly, Delaney, Doran, Harmon, & MacLachlan, 2010; Howell & Sweeny, 2016).
To the best of our knowledge, however, few studies have examined the longitudinal associations between experiential well-being and health—and the existing studies have used short timeframes (e.g., Affleck et al., 2000 found that mood and asthma symptoms covaried within persons across several weeks). Thus, there is little information regarding the extent to which health and experienced affect systematically change together across long periods of time and/or prospectively predict variation in one another. The purpose of the present study was to fill this gap in the empirical literature.
Models of Change
Beyond examining the extent to which health might have differential correlations with global and experiential well-being, one major innovation of the present study is that we also analyzed our data using advanced statistical methods—random-intercept cross-lag models (RI-CLMs; Hamaker, Kuiper, & Grasman, 2015)—which address concerns that have been raised about traditional cross-lag models (T-CLMs). More specifically, T-CLMs (e.g., which regress Y at Time 2 onto both X and Y at Time 1) do not cleanly separate within- and between-persons variation in the focal variables. Thus, the prospective paths in T-CLMs may not necessarily capture within-person change in the variables; the cross-lag paths may also tap the time-invariant, between-persons correlation between the variables. RI-CLMs address these issues by explicitly separating within- and between-persons variation in both variables. Thus, RI-CLMs can provide information on the extent to which one variable truly predicts within-person deviations in the other variable (and vice versa) (Hamaker et al., 2015).
Most previous research examining the longitudinal dynamics between health and well-being has used T-CLMs or variants thereof (e.g., regressing YT2 onto XT1 and YT1) (e.g., Gana et al., 2013). Thus, it remains an open question whether the prospective associations between health and well-being found in prior research using T-CLMs will replicate using more advanced RI-CLMs. In the present study, we analyzed our data using both RI-CLMs and T-CLMs. Our findings therefore allowed us to directly contrast RI-CLMs and T-CLMs—and to elucidate whether prior findings prospectively linking health and well-being replicate on a purely within-persons level.
Overview of the Present Study
The present study was a four-wave longitudinal design spanning 3 years. At each wave, participants provided self-report ratings of several indicators of health, as well as their global life satisfaction, global positive affect, and global negative affect. To assess experiential well-being, participants also completed day reconstruction method (DRM; Kahneman, Krueger, Schkade, Schwarz, & Stone, 2004) measures of the positive and negative emotions they had experienced the day prior to each measurement occasion. In contrast to experience sampling methods (ESM; Shiffman, Stone, & Hufford, 2008), which have the potential to be burdensome to participants by repeatedly interrupting their daily schedules, DRM can be administered in standard survey format, and some versions can be completed in as few as 10 to 15 min (Anusic et al., 2017). Unlike ESM, DRM can also be more feasibly included in large-scale national surveys, such as the German Socioeconomic Panel (GSOEP), American Time Use Study, Health and Retirement Study, or Panel Study of Income Dynamics.
In the DRM, participants are first asked to reconstruct their prior day in terms of “episodes” that occurred. Subsequently, participants rate the emotions they experienced during those episodes. Despite entailing retrospective reporting, preliminary evidence suggests that DRM produces similar patterns of findings to ESM (Anusic et al., 2017; Bylsma, Taylor-Clift, & Rottenberg, 2011; Dockray et al., 2010; Kahneman et al., 2004). For example, one recent study found that daily aggregates of DRM and ESM measures of the same emotions correlate r = .76 to .89 (Tweten, Anusic, Lucas, & Donnellan, 2016). Moreover, although researchers frequently collect DRM data for only one single day per measurement occasion, empirical evidence suggests that there is considerable consistency in people’s daily emotional experiences. For example, individuals’ experiential well-being, measured via DRM on two arbitrary days separated by up to 2 years of time, correlate r = .30 to 47 (Hudson et al., 2017). Thus, even a single day’s worth of DRM appears to capture reliable variance in people’s experiential affect.
Collectively, these data were used to test the extent to which (a) health prospectively predicted well-being 1 year later, (b) well-being prospectively predicted health 1 year later, and (c) simultaneous deviations in health and well-being were correlated with one another. What should we expect to find? Studies generally converge on the idea that health predicts subsequent variation in at least global well-being (Brief et al., 1993; Gana et al., 2013; Lucas, 2007). For example, Gana and colleagues (2013) found that self-rated health predicted well-being 2 years later. Thus, at first blush, we might expect to find in our study that health prospectively predicts well-being 1 year later. These prior studies, however, have generally used T-CLMs (or equivalent analyses) to analyze their data—which fail to properly control for between-person variance in health and well-being, and thus can inflate and/or create illusory estimates of the prospective associations (Hamaker et al., 2015). In our study, we used RI-CLMs, which overcome this and other limitations of T-CLMs (Hamaker et al., 2015). These improved analyses, combined with the year-long delay between waves in our study and research suggesting that only recent life events—within the prior 3 months or so—covary with life satisfaction (Suh, Diener, & Fujita, 1996) might lead us to expect to not find prospective associations among the variables in our study. If this is, in fact, the case, any finer-resolution longitudinal associations between health and well-being (e.g., health problems cause immediate reductions in well-being) would be captured in our study as correlated changes between health and well-being.
Method
Preregistration
Prior to any analyses, this project was preregistered on Open Science Framework (OSF; see https://osf.io/hnfn4/). Although we have previously worked with the well-being variables in the 2012-2014 waves of this data set (Hudson, Lucas, & Donnellan, 2016; Hudson et al., 2017; Hudson, Lucas, Donellan, & Kushlev, 2016), other than controlling for self-rated health as a covariate while testing the associations between age and well-being (Hudson, Lucas, & Donnellan, 2016), we did not examine descriptive statistics or correlations for any health variable prior to preregistering this project.
Participants
We analyzed data from participants in the 2012-2015 waves of the Innovation Sample of the GSOEP (Richter & Schupp, 2015; Wagner, Frick, & Schupp, 2007). This sample is an approximately nationally representative subsample of the larger GSOEP study, in which innovative questions are administered. Participants completed DRM measures once annually in 2012-2015. A total of 2,550 unique participants (in 2012: 52% female; ages ranged from 17 to 95, M = 51.79, SD = 18.00) provided at least one wave of data. The respective individual sample sizes for 2012-2015 were 2,303, 1,920, 1,763, and 1,635.
On average, participants provided 2.99 waves of data (SD = 1.26)—with 1,952 participants (77%) providing at least two waves. Missing data can occur both (a) when participants discontinue participation in subsequent waves and (b) when participants enter the study sometime after the first wave. Missing data analyses revealed that people tended to provide more numerous waves of data if they were older (r = .07, 95% confidence interval (CI) = [.03, .11]), reported worse health (r = –.10, 95% CI = [–.14, –.06]), less satisfaction with their health (r = –.07, 95% CI = [–.11, –.03]), or lower levels of daily negative affect (r = –.05, 95% CI = [–.09, –.01]) or global positive affect (r = –.08, 95% CI = [–.12, –.05]). No other study variables were significantly associated with total waves.
Measures
Well-being
Experiential positive and negative affect
At each wave, participants completed DRM measures in which they systematically reconstructed their prior day by reporting all activities that had occurred. Participants were first asked what time they awoke. Afterward, they were queried, “What did you do next?” Participants selected an activity from a predetermined list (e.g., commuting, preparing food, watching TV) and indicated what time the episode began and ended. This procedure was repeated (i.e., participants were asked, “What did you do next?”) until participants had accounted for their entire day—ending with either their bedtime or midnight.
After providing all episodes from the previous day, three episodes were randomly selected for each participant. For each episode, participants rated the extent to which they felt several emotions during the episode: happy, enthusiastic, satisfied, angry, frustrated, sad, worried, and stressed. Each emotion was rated on a scale from 1 (not at all) to 7 (very much). Rating three randomly selected episodes—rather than every episode (e.g., Kahneman et al., 2004)—dramatically reduces the time required to complete the measure, yet nevertheless appears to produce similar findings to full-length DRM assessments (Anusic et al., 2017).
We formed daily composites for each of the eight emotions by averaging the ratings from the three episodes together with equal weighting. For example, we computed a single “daily happiness” composite for each participant at each wave—which was an average of their happiness during each of the three episodes they had rated. Subsequently, because research suggests positive and negative affect are independent (e.g., Watson et al., 1988), we formed separate composites at each time point for experiential positive affect and experiential negative affect. Experiential positive affect was an average of happiness, enthusiasm, and satisfaction (2012: α = .85). Experiential negative affect was an average of anger, frustration, sadness, worry, and stress (2012: α = .87).
Global positive and negative affect
At each wave, participants rated the frequency with which they had generally felt happiness, anger, sadness, and worry over the prior 4 weeks (notably, this is a divergence from the experiential measures, in which participants rated the momentary intensity of each emotion). Each emotion was rated on a scale from 1 (very seldom) to 5 (very often). Although these questions asked about the prior 4 weeks, research suggests that, when asked to summarize emotional experiences over long times (e.g., 1 month), people report their trait-like affect rather than summarizing their actual experiences (Robinson & Clore, 2002b). This is thought to occur because aggregating memories of emotions over extended periods is cognitively demanding (and accurate recollections may not be accessible), and thus, participants rely on semantic (i.e., factual) knowledge about how they generally view themselves when answering such questions (e.g., “I am generally a happy person”). Thus, despite the specific timeframe in the questions, these items tap global affect. We created separate composites for positive and negative affect. We used the happiness question as a single-item indicator of global positive affect at each wave. We averaged together the anger, sadness, and worry items to obtain a measure of global negative affect at each wave (2012: α = .61).
Life satisfaction
Global life satisfaction was assessed at each wave using a single item that read, “We would like to ask you about your satisfaction with your life in general . . . How satisfied are you with your life, all things considered?” This item was rated on a scale that ran from 0 (completely dissatisfied) to 10 (completely satisfied). Research suggests that single-item measures of life satisfaction have comparable validities to multi-item measures (Cheung & Lucas, 2014; Lucas & Donnellan, 2012).
Health
For this project, we analyzed health variables that (a) were included in every wave from 2012-2015 in the GSOEP Innovation Sample and (2) were worded in such a way to be able to capture within-person variation from year to year. 1 All analyzed variables (described below) were preregistered on OSF (see https://osf.io/hnfn4/).
Self-rated health
At each wave, participants rated their overall physical health using a single-item that ranged from 1 (bad) to 5 (very good). Research suggests that, although multi-item health measures tend to correlate more strongly with criteria, single-item measures are nevertheless reliable, valid, and sensitive to within-person variation across time (Macias, Gold, Öngür, Cohen, & Panch, 2015; Wu et al., 2013).
Satisfaction with health
Participants rated their satisfaction with their health each wave using a single-item that ranged from 0 (low) to 10 (high).
Sick days
Each wave, participants indicated how many days they had taken off work sick in the previous year via numeric free response.
Doctor visits
At each time point, participants indicated how many times they had visited a doctor within the previous year via numeric free response.
Typical hours slept
Each wave, participants were asked to indicate via numeric free response how many hours they sleep on a normal weekday.
Hospitalization
Participants indicated at each wave whether they had stayed in a hospital within the previous year using a yes (1) or no (0) scale.
Results
In the following sections, we examine the cross-sectional correlations between health and well-being, the longitudinal associations between health and well-being, and whether using T-CLMs versus RI-CLMs produces different patterns of results.
Correlations Between Well-Being and Health
Table 1 contains latent descriptive statistics and intercorrelations in our focal variables. Specifically, using a structural equation model (SEM), we created latent factors for each variable that captured shared variance across all time points (e.g., DRM positive affect at each year were indicators that loaded onto a single “trait DRM positive affect” latent variable). The means, standard deviations, and correlations in Table 1 are for these latent variables.
Cross-Time Latent Correlations and Descriptive Statistics.
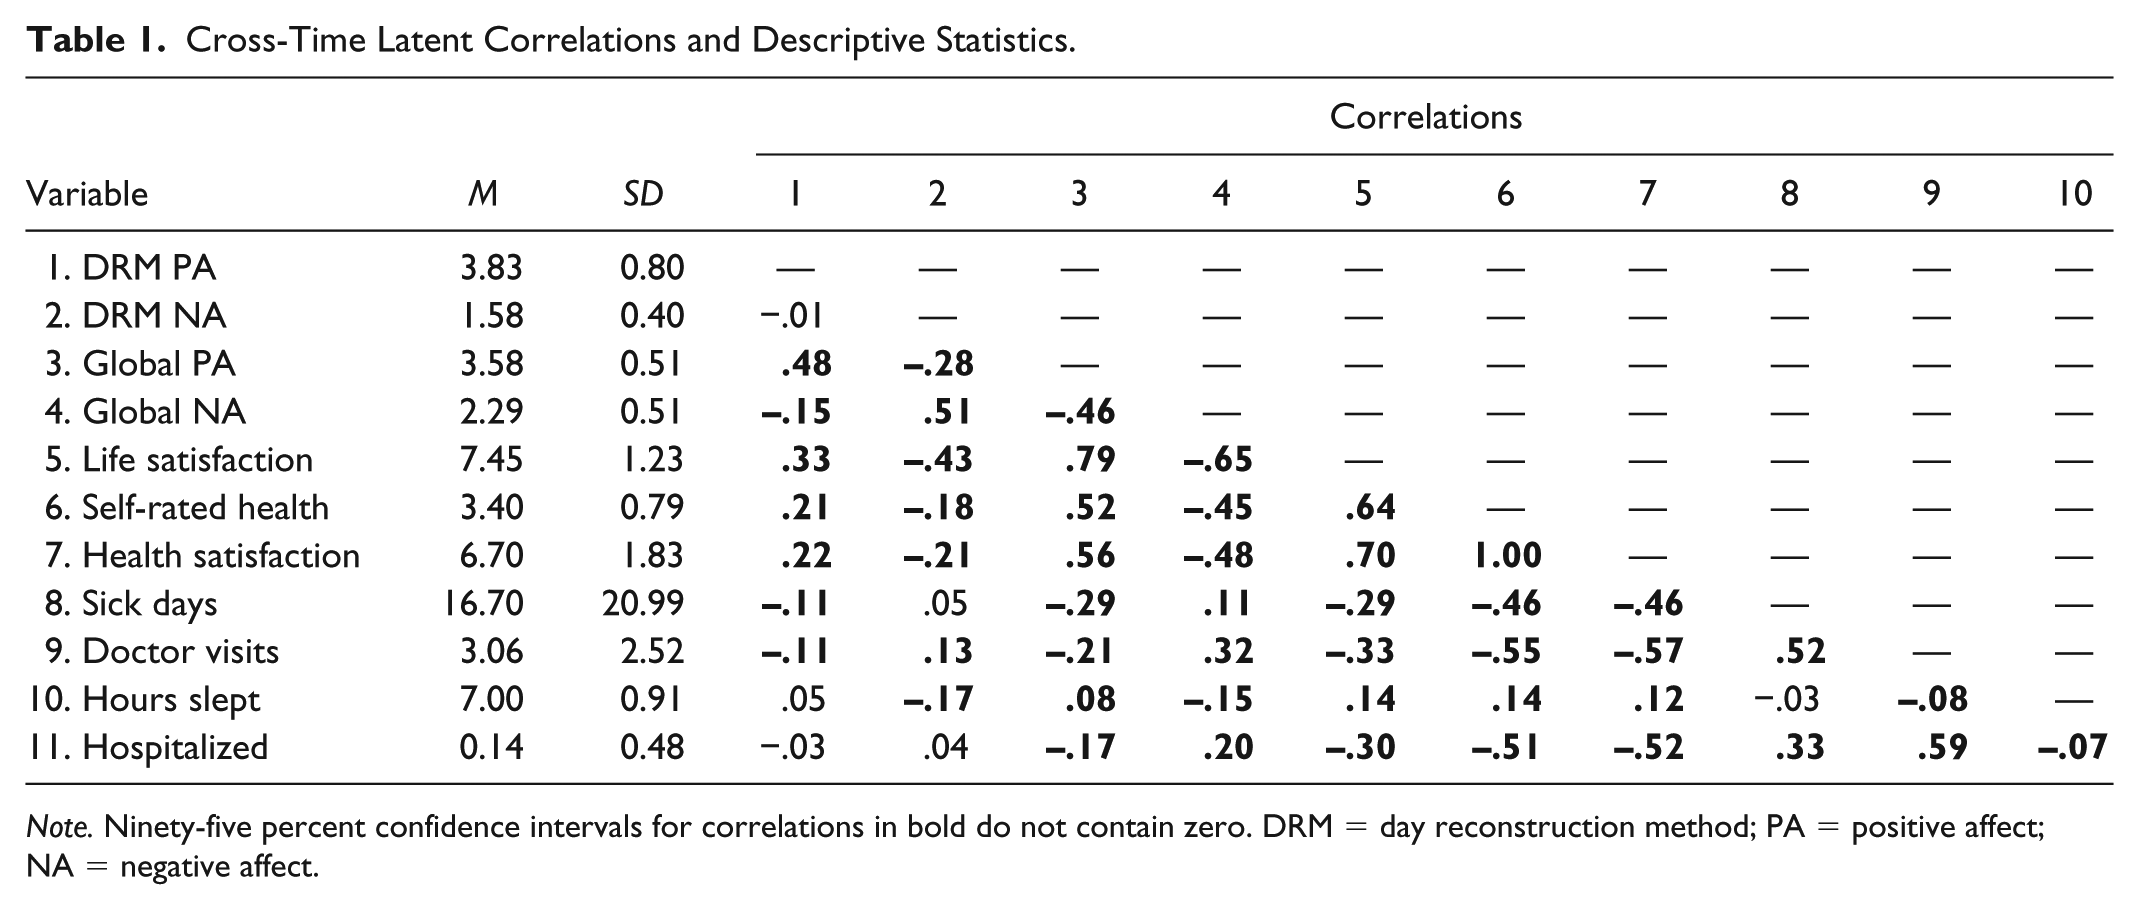
Note. Ninety-five percent confidence intervals for correlations in bold do not contain zero. DRM = day reconstruction method; PA = positive affect; NA = negative affect.
Replicating previous research (e.g., Kööts-Ausmees & Realo, 2015), well-being was generally positively correlated with health (|r|s ranged |r| = .11, 95% CI = [.02, .20] to |r| = .70, 95% CI = [.67, .73]). The only exceptions pertained to experiential affect: experiential negative affect was not related to sick days, experiential positive affect was not associated with hours slept, and neither experiential positive nor negative affect was correlated with hospitalization (|r|s ≤ .05). In general, global well-being had stronger associations with health (average |r| = .33) than did experiential well-being (average latent |r| = .13) (Diener & Tay, 2014; cf. Kahneman, 1999). Finally, also replicating previous research (e.g., Angner, Ray, Saag, & Allison, 2009; Diener et al., 1999), subjective self-ratings of health were more strongly correlated with well-being (average |r| = .42) than were more objective indicators of health (average |r| = .16).
Longitudinal Associations Between Well-Being and Health
Model
We used RI-CLMs (Hamaker et al., 2015) to examine whether (a) well-being prospectively predicted health 1 year later, (b) health prospectively predicted well-being, and (c) within-person changes in well-being from year to year were correlated with simultaneous changes in health. As depicted in Figure 1, in an RI-CLM, the stable between-person variance in each variable across time is isolated using a latent variable. The residuals from these factors then represent within-person changes/deviations from individuals’ “trait” levels of health and well-being. These time-specific deviations are then entered into cross-lagged analyses. This approach helps to distinguish between-person and within-person variance (Hamaker et al., 2015). 2 T-CLMs do not take this step and may therefore provide ambiguous results for understanding longitudinal dynamics.
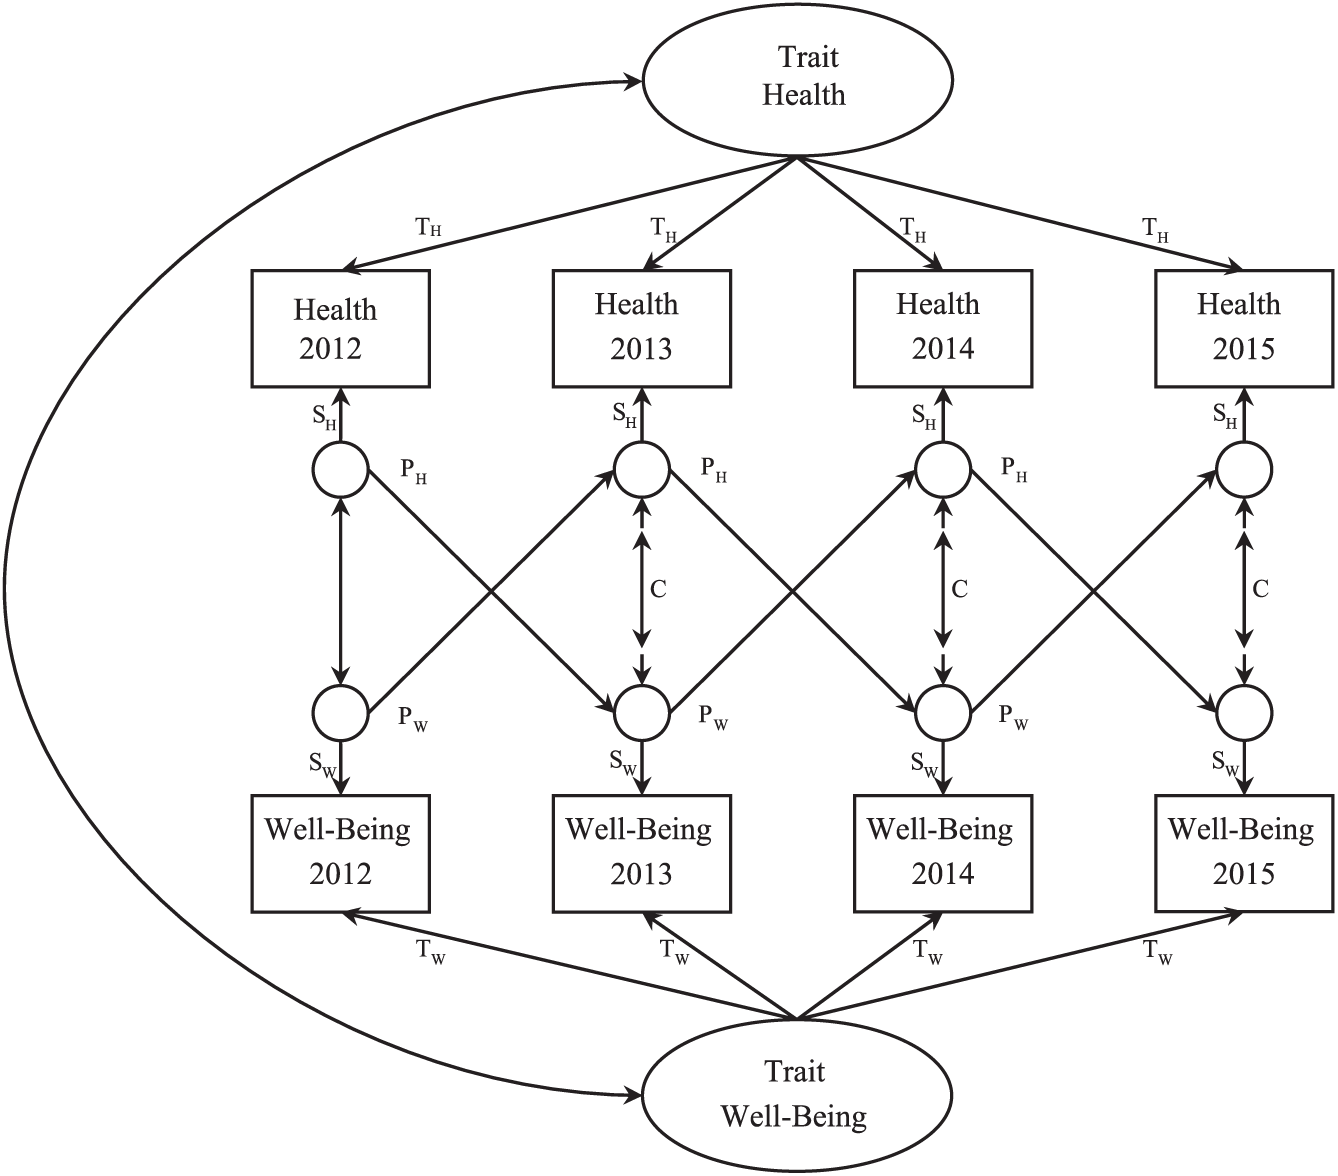
Random-intercept cross-lag structural equation model.
Finally, in terms of model specification, as is illustrated in Figure 1, for parsimony, we constrained all longitudinal dynamics to be equal across time. All reported parameter estimates are standardized.
Stability across time
We first examined the extent to which well-being and health were stable across time. Due to the way our models were specified, the standardized trait loadings (T paths in Figure 1) and state loadings (S paths in Figure 1) can be squared to obtain the percent variance in health and well-being that was trait-like (i.e., stable) versus state-like (i.e., unique at each time point) across the study’s duration. As seen in Table 2, all well-being and health variables were relatively stable over 3 years (see Hudson et al., 2017, for estimates of the trait and state variance in each variable from 2012 to 2014 in this same data set). Specifically, with respect to experiential well-being, 42% (95% CI = [40%, 45%]) of the variance in positive affect and 35% (95% CI = [32%, 37%]) of the variance in negative affect were trait-like across the study’s duration. In contrast, approximately half of the variance in global well-being was trait-like (estimates ranged from 48%, 95% CI = [45%, 50%] [global positive affect] to 56%, 95% CI = [53%, 58%] [life satisfaction]). Thus, global well-being was slightly more stable than experiential well-being in our study. In terms of health measures, latent traits accounted for 61% of the variance in both self-rated health and satisfaction with health (95% CIs = [59%, 64%], [58%, 62%]). Finally, with the exception of hours slept (58% trait variance, 95% CI = [56%, 61%]), objective measures of health were generally less stable over the study’s duration, with only between 21% (95% CI = [18%, 23%]; hospitalization) and 34% (95% CI = [29%, 40%]; sick days) of the variance attributable to stable latent traits.
Trait- and State-Level Variance in Well-Being and Health.
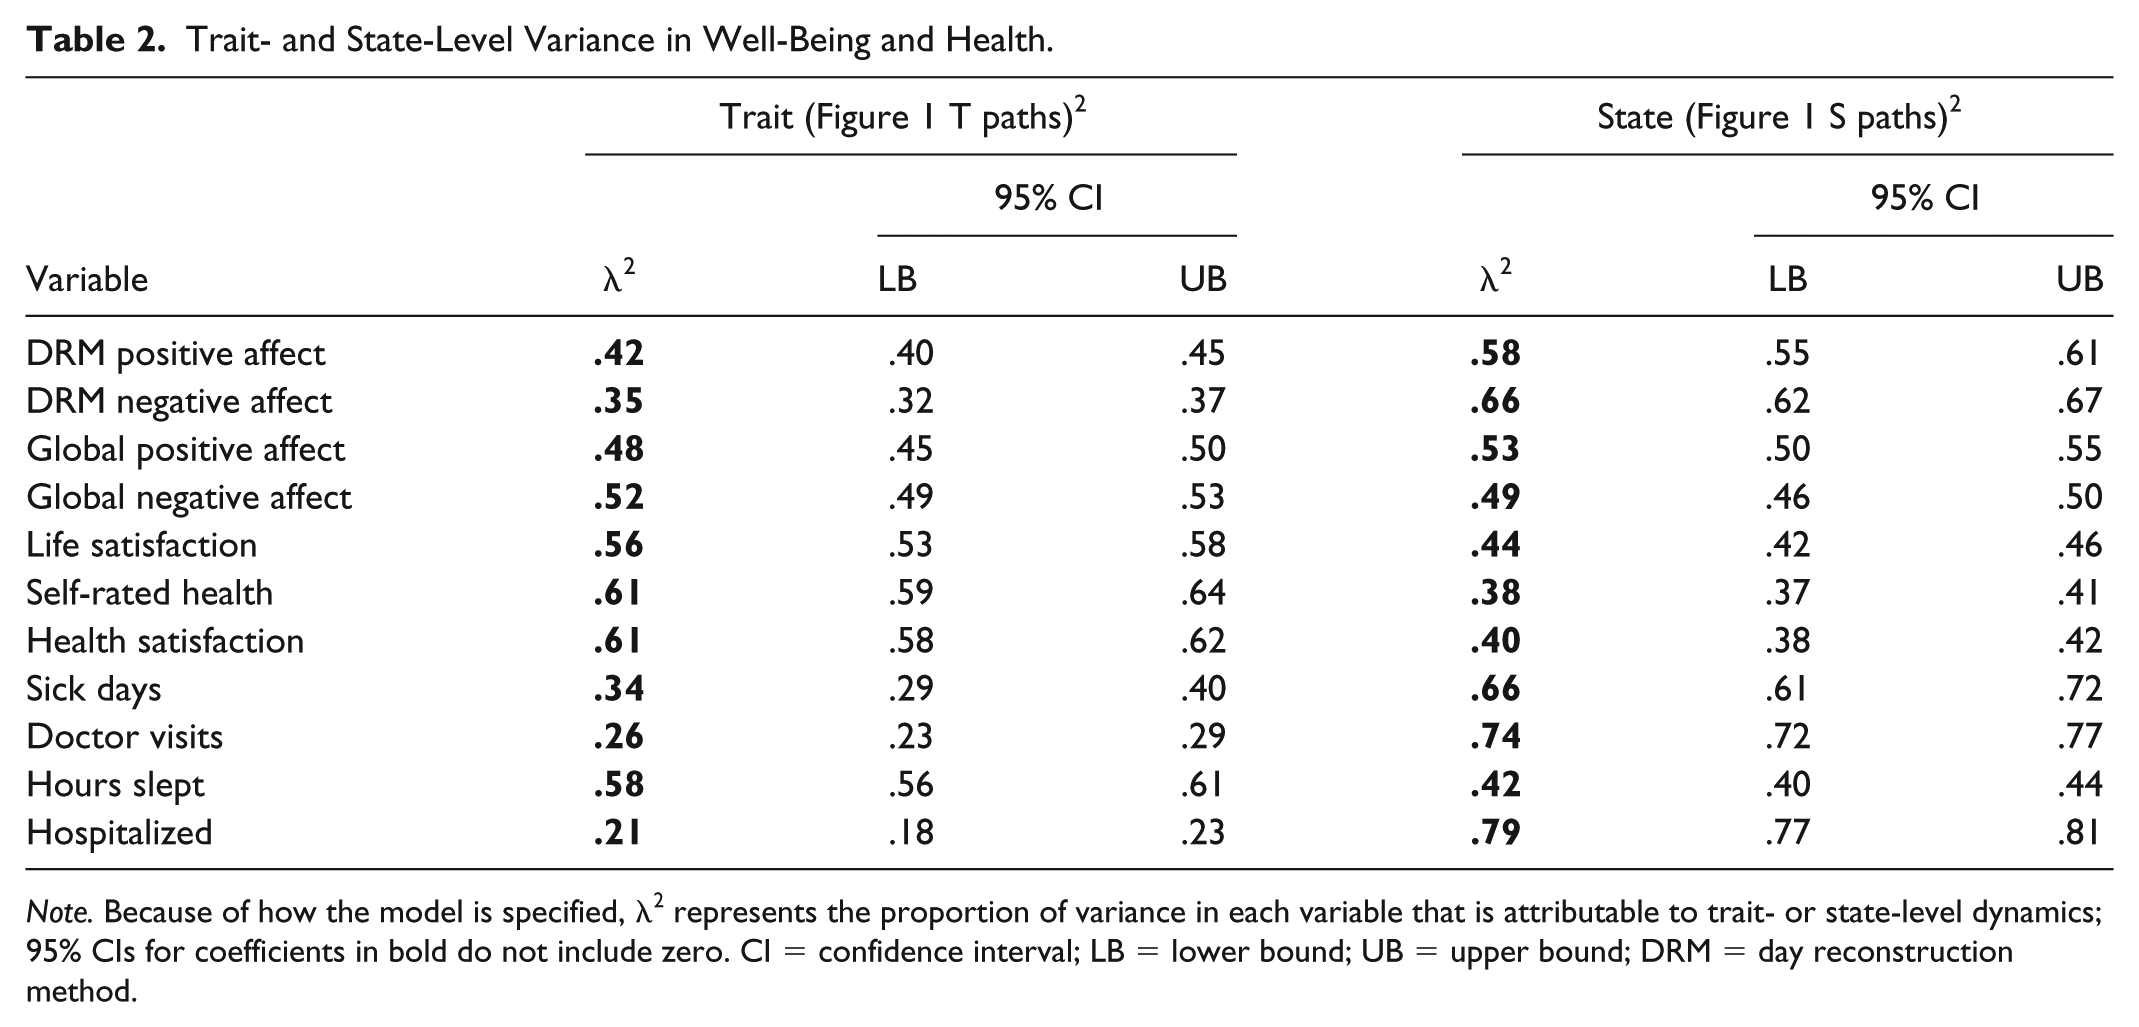
Note. Because of how the model is specified, λ2 represents the proportion of variance in each variable that is attributable to trait- or state-level dynamics; 95% CIs for coefficients in bold do not include zero. CI = confidence interval; LB = lower bound; UB = upper bound; DRM = day reconstruction method.
Prospective effects
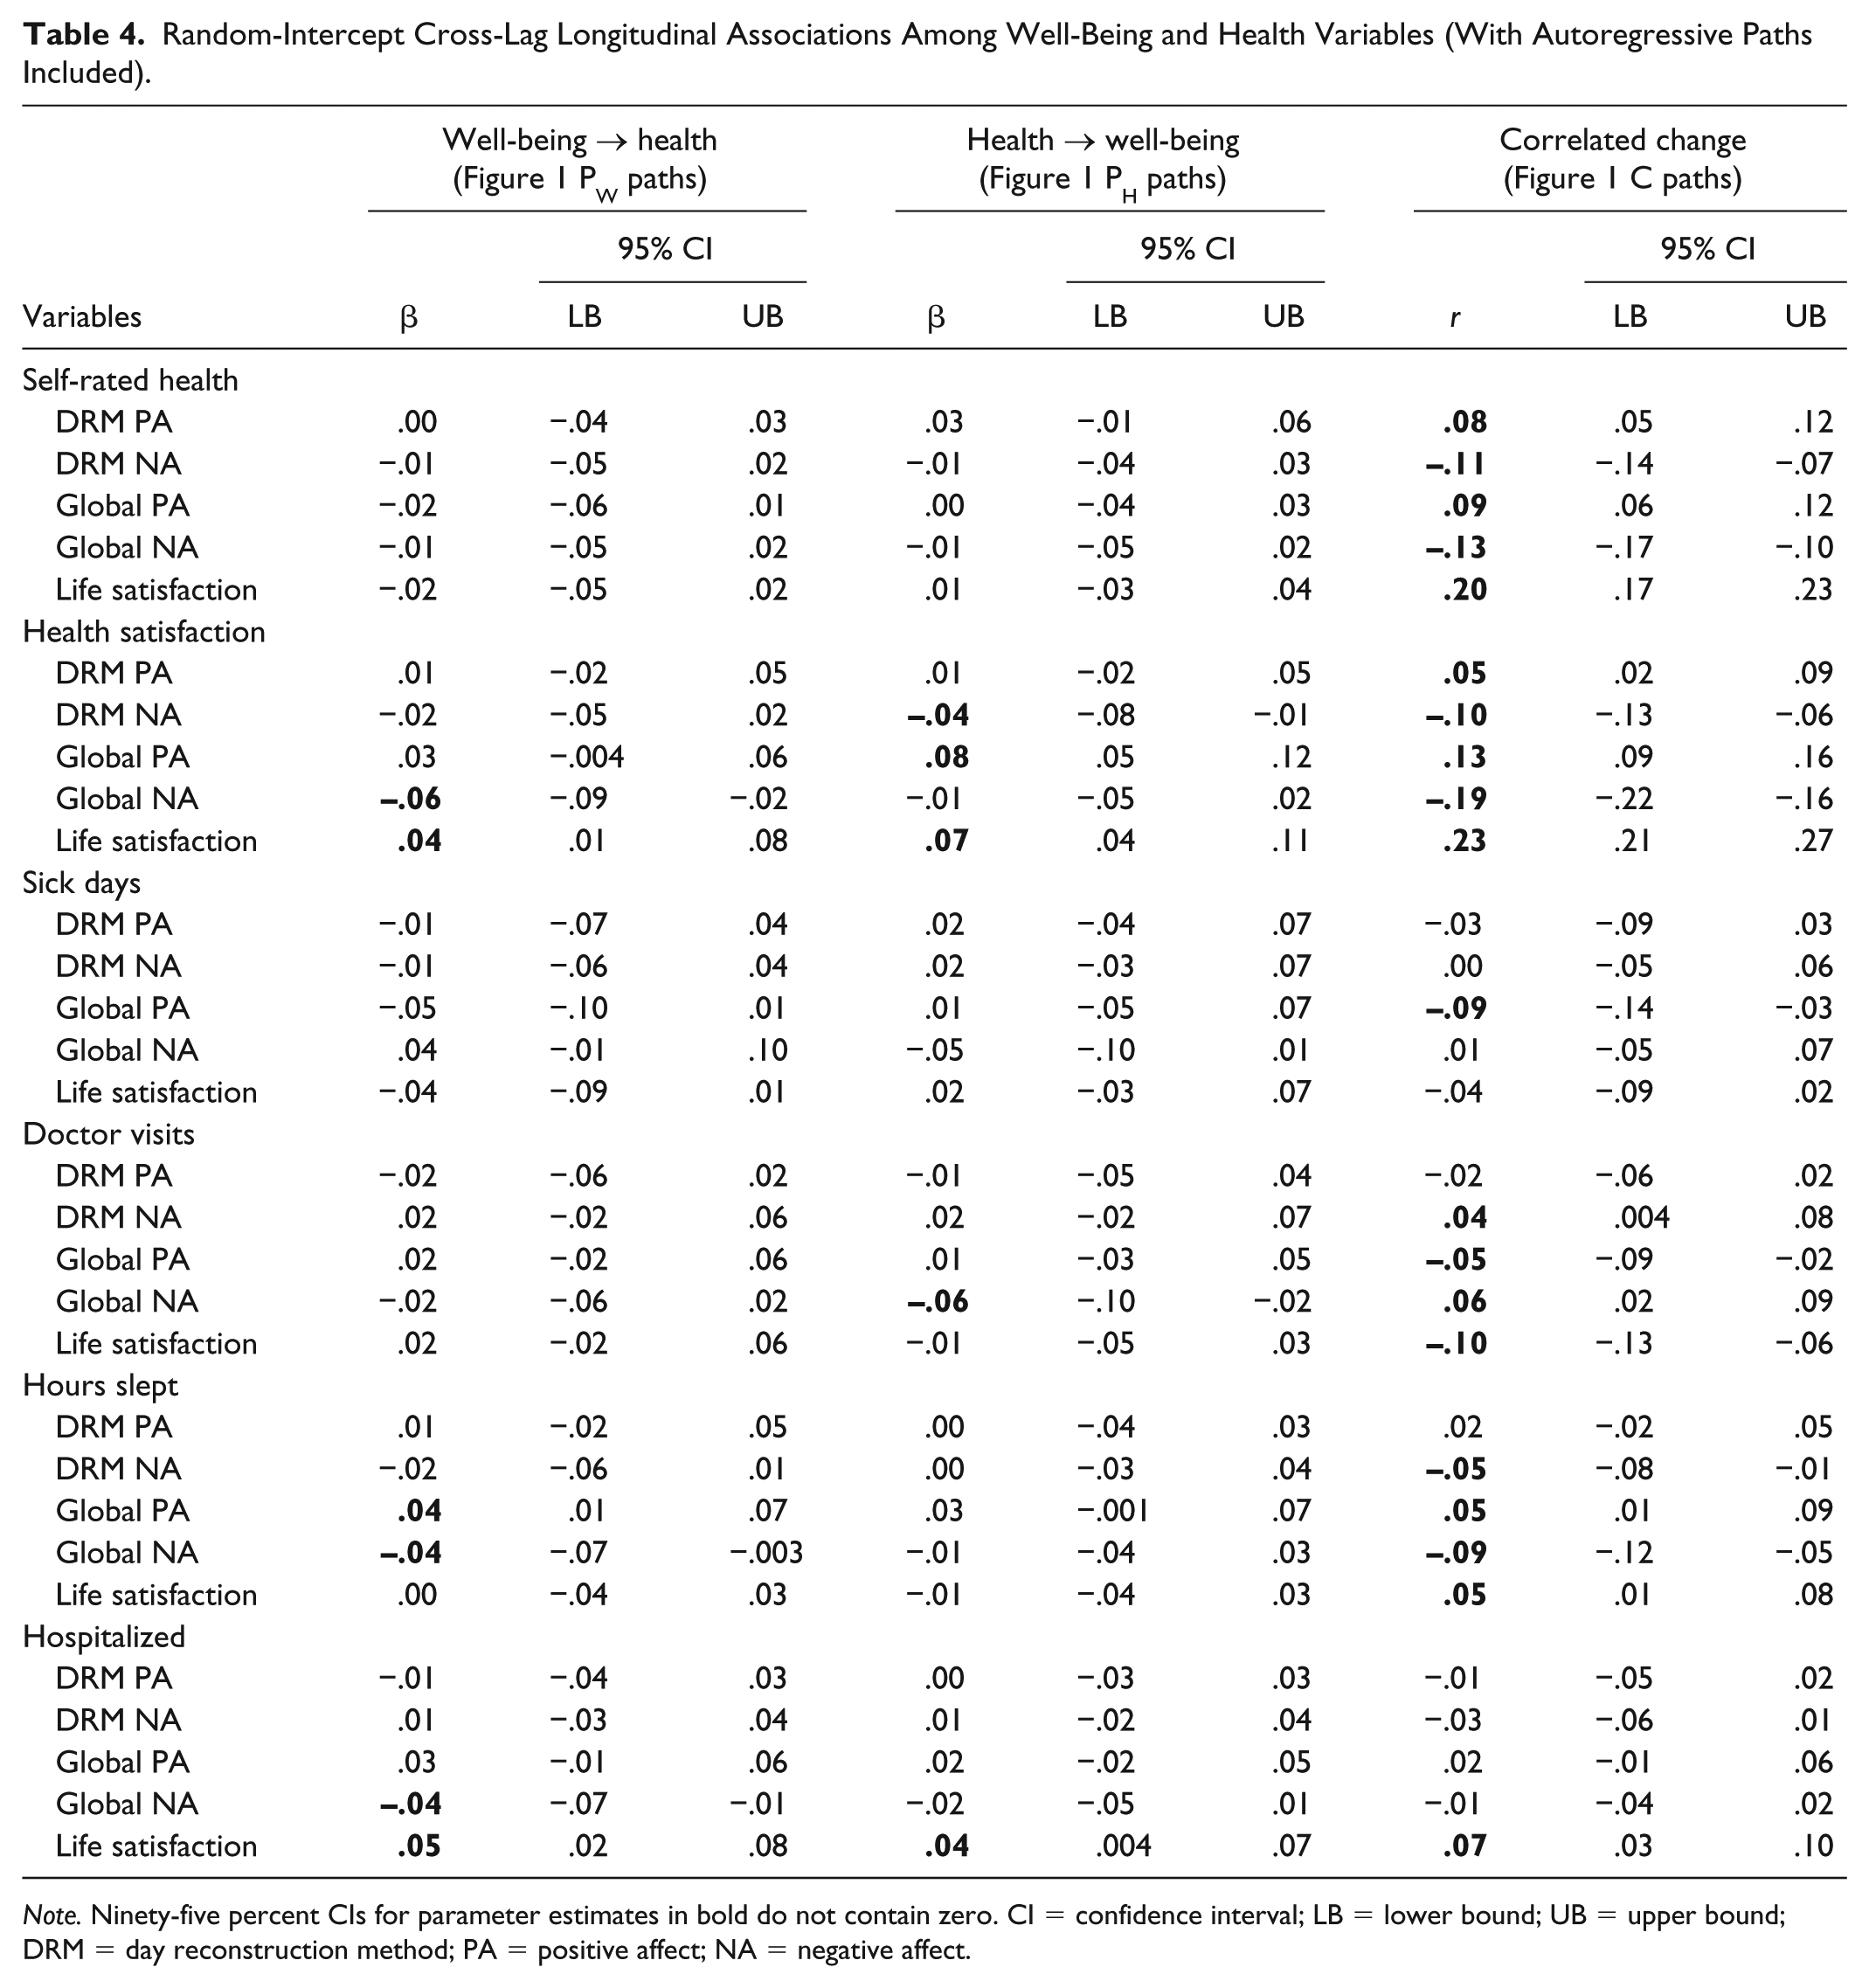
Next, we examined the extent to which well-being and health prospectively predicted one another across time. Table 3 contains the parameter estimates for all longitudinal associations among the health and well-being variables (Table 4 contains the same parameter estimates with auto-regressive paths included in the models). 3 The left-hand column contains the prospective effects of well-being predicting subsequent health 1 year later (PW paths in Figure 1), and the middle column contains the prospective effects of health predicting subsequent well-being (PH paths in Figure 1). In terms of interpretation, the coefficients in the left-hand column, for example, indicate the extent to which within-person deviations in well-being from individuals’ baselines predicted deviations in health (from individuals’ baselines) 1 year later. A positive coefficient would indicate that experiencing higher-than-typical levels of well-being (relative to one’s baseline) predicted greater-than-typical levels of health (relative to one’s baseline) 1 year later.
Random-Intercept Cross-Lag Longitudinal Associations Among Well-Being and Health Variables (Without Autoregressive Paths Included).
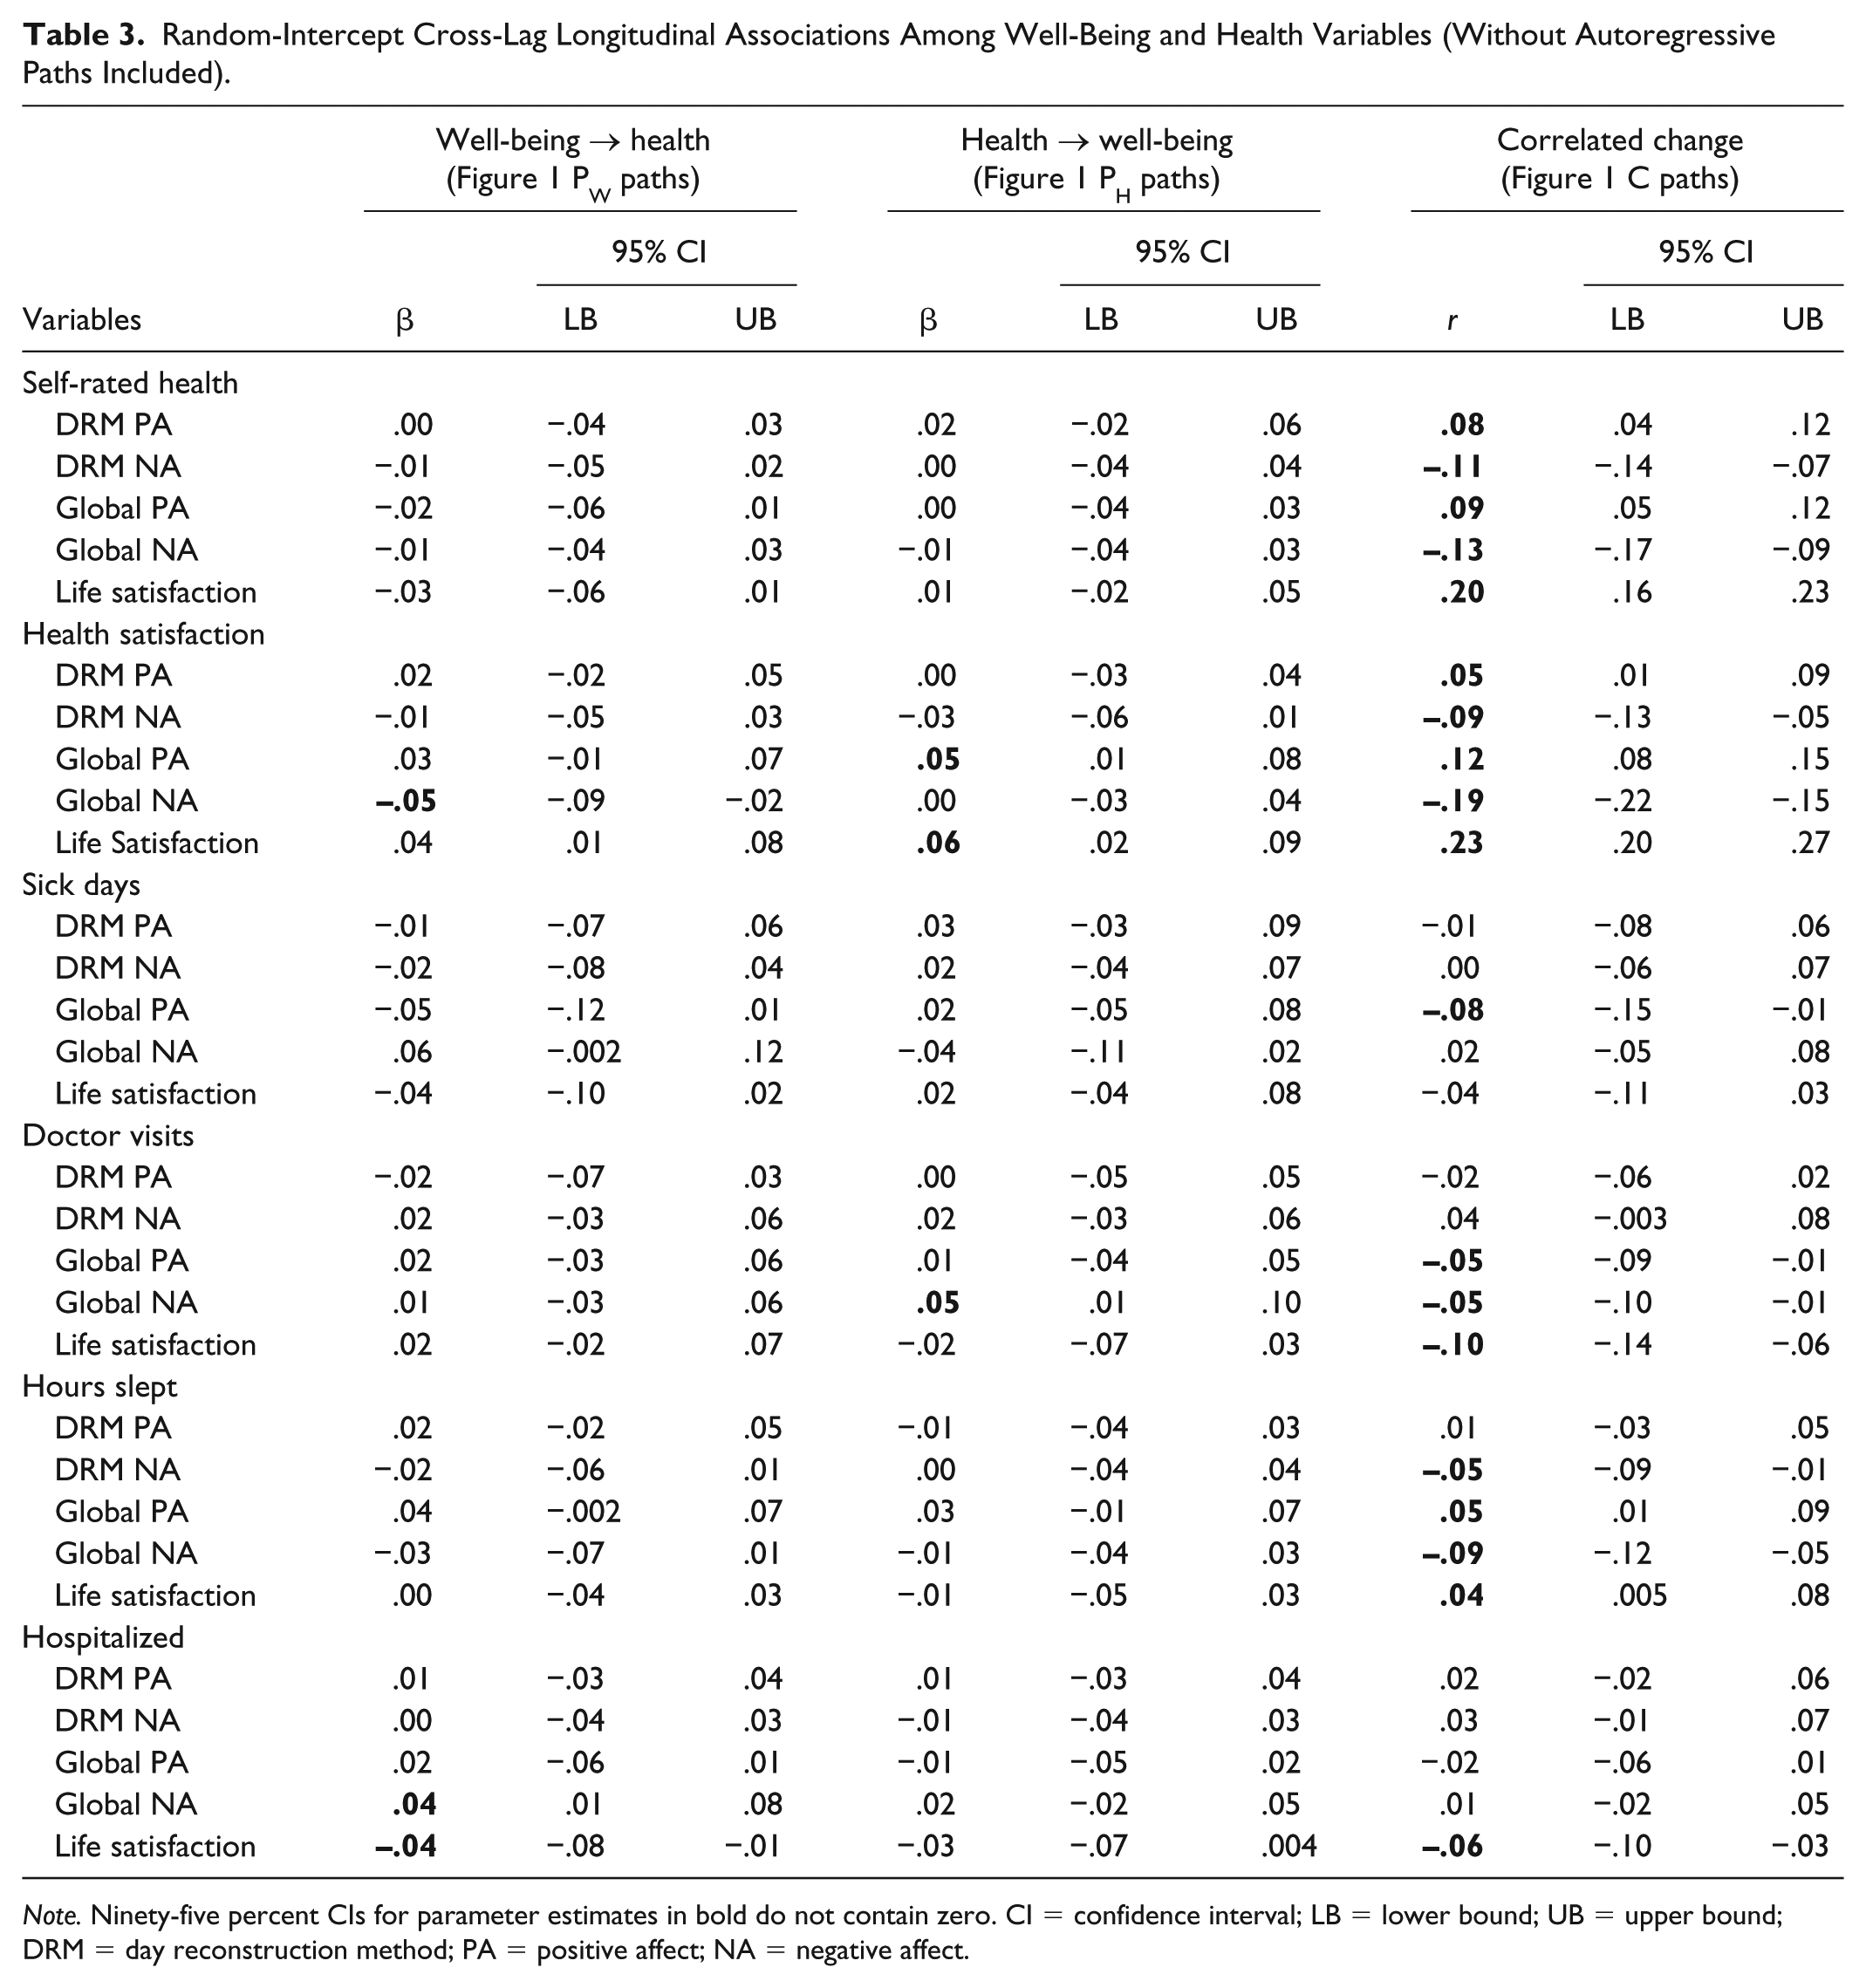
Note. Ninety-five percent CIs for parameter estimates in bold do not contain zero. CI = confidence interval; LB = lower bound; UB = upper bound; DRM = day reconstruction method; PA = positive affect; NA = negative affect.
Random-Intercept Cross-Lag Longitudinal Associations Among Well-Being and Health Variables (With Autoregressive Paths Included).
Note. Ninety-five percent CIs for parameter estimates in bold do not contain zero. CI = confidence interval; LB = lower bound; UB = upper bound; DRM = day reconstruction method; PA = positive affect; NA = negative affect.
Generally, there were few prospective effects. Of the 60 cross-lag paths tested, only six (10%) were significant. Moreover, there was not a discernable pattern to the significant paths. For example, of the health variables, only high health satisfaction predicted increases in global positive affect and life satisfaction (but not any other well-being variable), only more numerous doctor visits predicted greater subsequent negative affect (but no other well-being variables), and no other health variables predicted subsequent changes in any well-being variable. Given the small portion of cross-lag paths that were significant and the lack of systematic patterns in which coefficients were significant, barring direct replication, we are inclined to interpret the few significant cross-lag paths as representing sampling error rather than meaningful effects.
Correlated changes
The right-hand column of Table 3 contains estimates of the correlated changes in health and well-being (C paths in Figure 1). In terms of interpretation, these coefficients represent the within-person correlations between health and well-being. A positive correlation would indicate that, at waves when a person reported greater health, they also tended to report greater well-being.
In contrast to the cross-lag findings, we found numerous, systematic patterns of correlated deviations. Deviations in self-rated health, health satisfaction, and hours slept were associated with simultaneous deviations in all well-being variables (|r|s ranged from r = .04, 95% CI = [.005, .08] to r = .23, 95% CI = [.20, .27]), with the exception that deviations in hours slept were not correlated with changes in experiential positive affect (r = .01, 95% CI = [–.03, .05]). Thus, when people felt healthier, were more satisfied with their health, or were sleeping more, they also reported experiencing higher well-being, universally across all measures.
In contrast, deviations in number of annual sick days were related to reductions in only global positive affect (r = –.08, 95% CI = [–.15, –.01]) and changes in whether one was hospitalized or not within the previous year were related to changes in only life satisfaction (r = –.06, 95% CI = [–.10, –.03]). Finally, increases in number of doctor visits were associated with dampened global affect—lower negative affect and lower positive affect—as well as less life satisfaction (rs ranged from r = –.10, 95% CI = [–.14, –.06] to r = –.05, 95% CI = [–.09, –.01]). 4
T-CLMs
Using RI-CLMs, we found very few prospective associations; health generally did not predict well-being 1 year later or vice versa. This is a point of divergence from previous research, which has found that health and well-being do prospectively predict one another—even up to two full years later (e.g., Gana et al., 2013). One explanation for the discrepancy between our findings and those of prior studies is differences in statistical models used. Specifically, prior studies have often examined temporal dynamics by merely controlling prior scores on the variables of interest (e.g., T-CLMs; YT2 = XT1 + YT1).
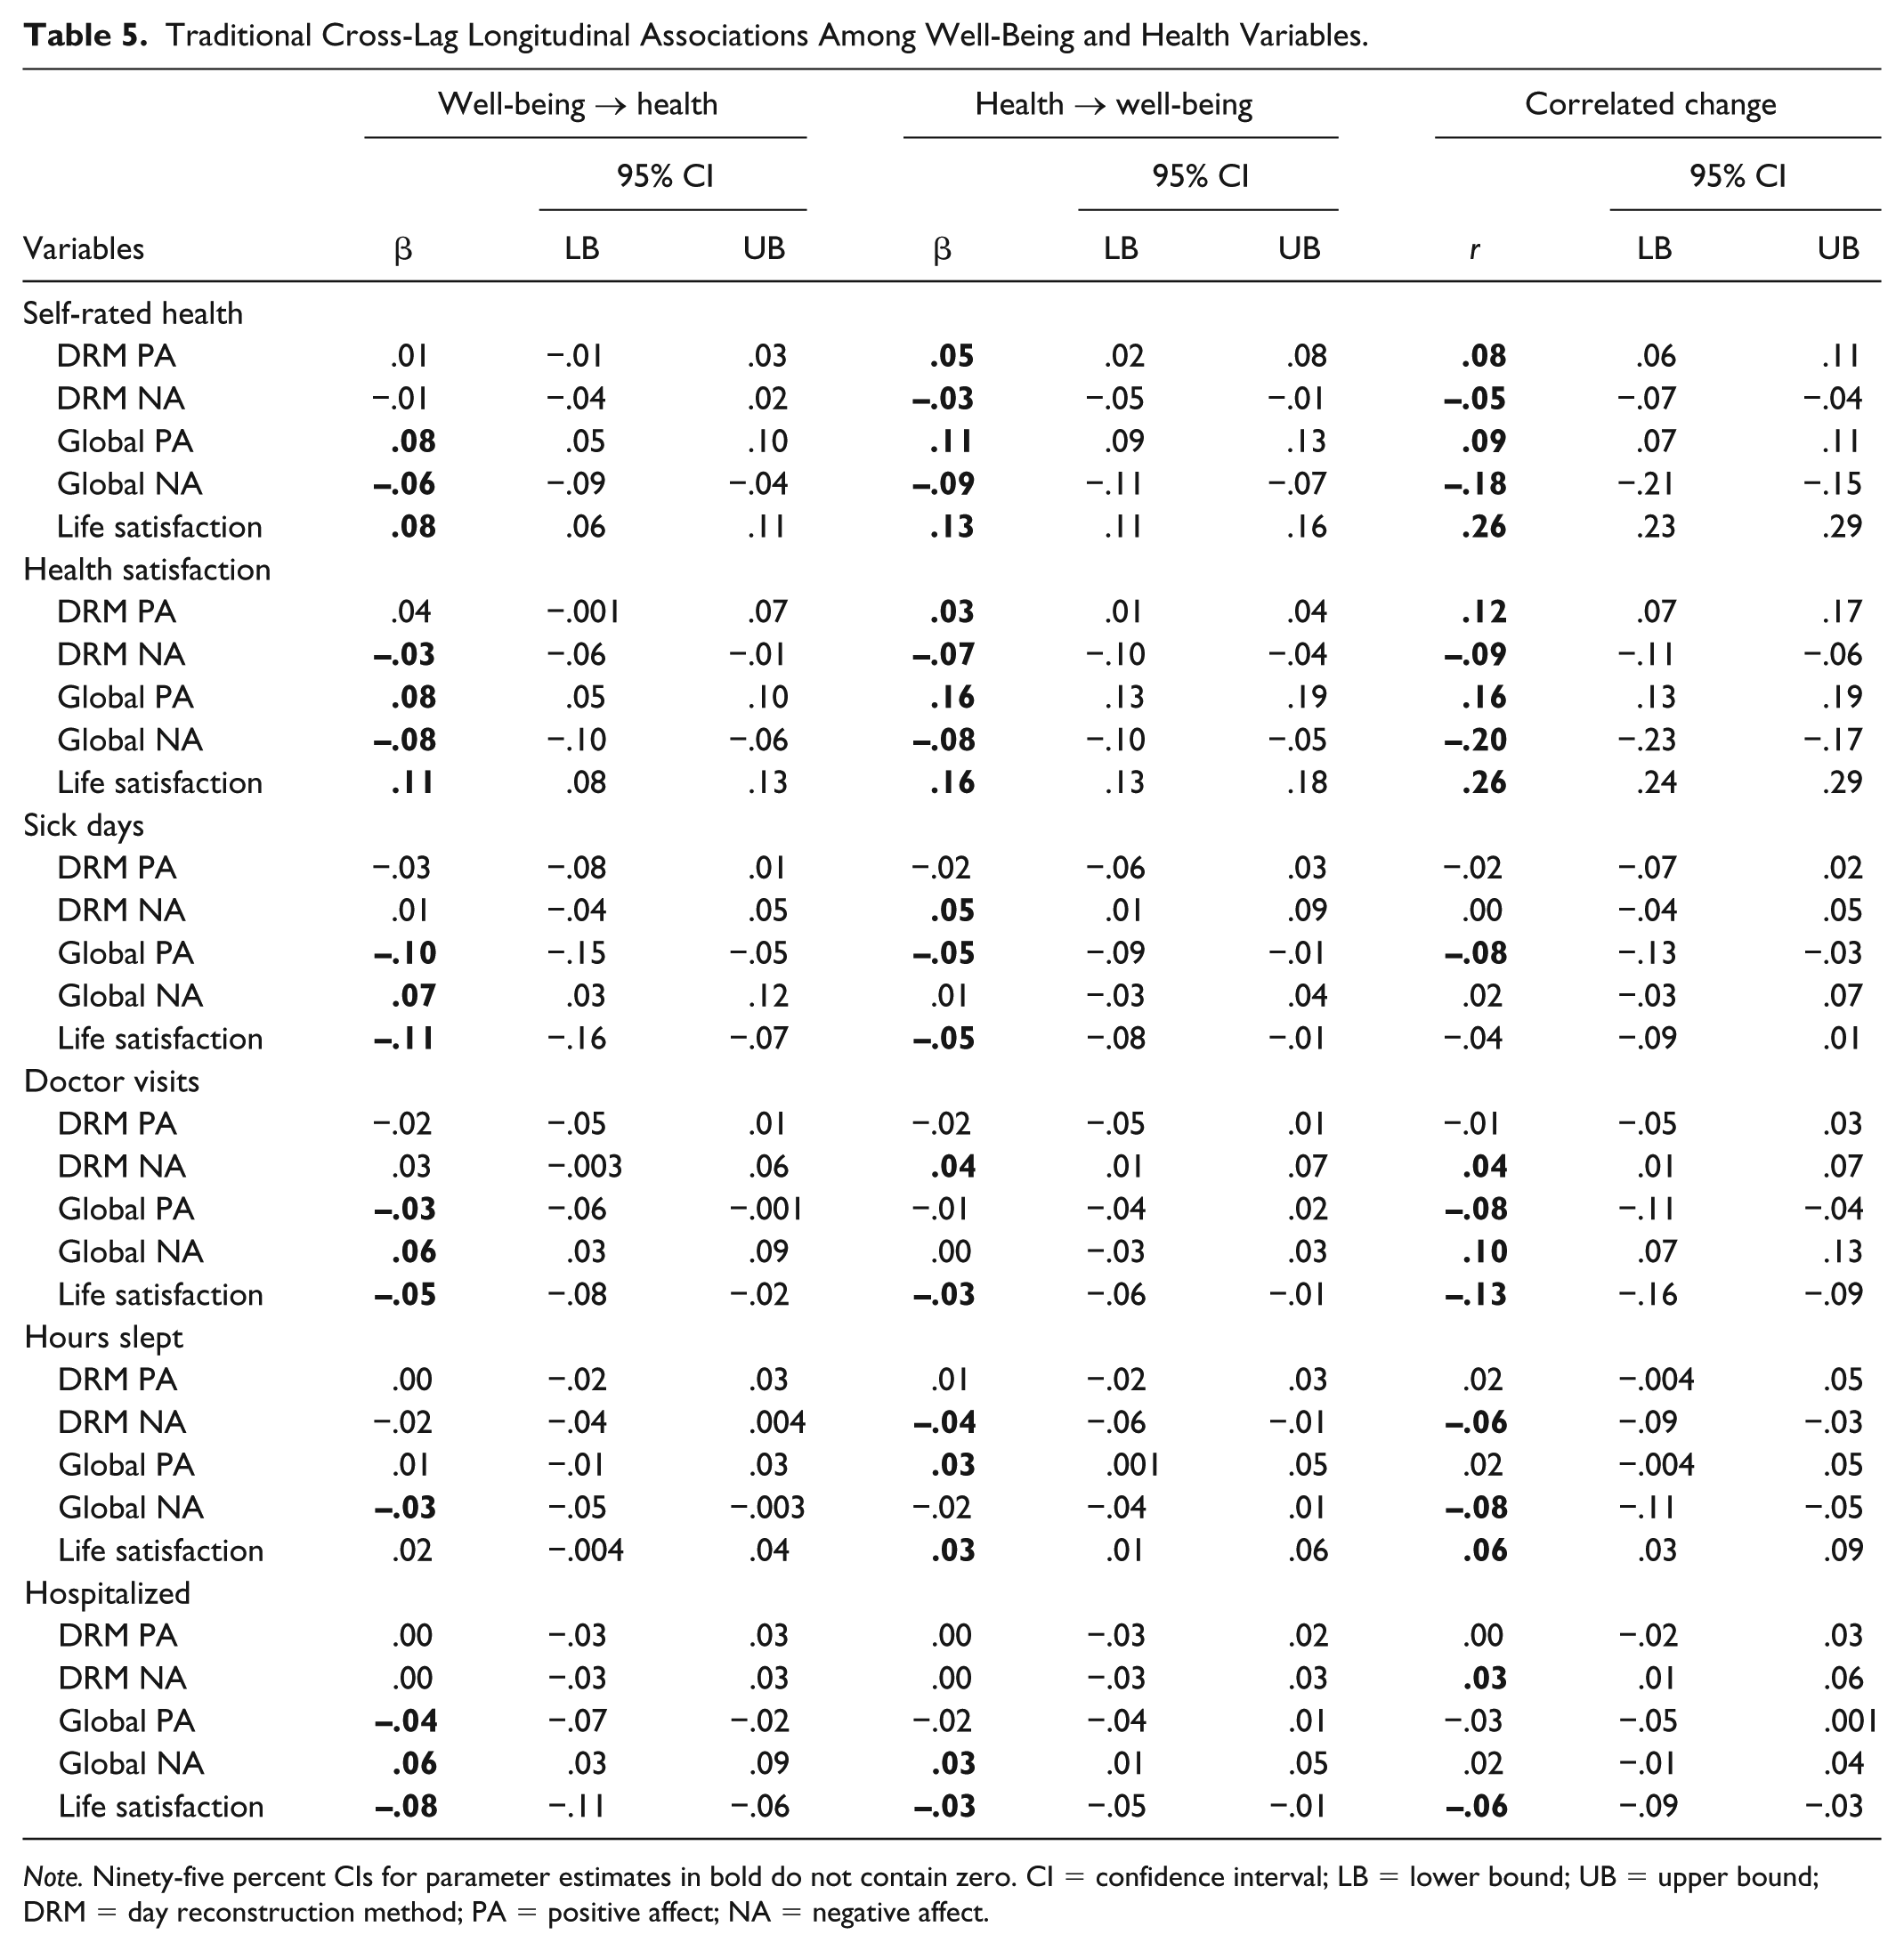
Unlike the RI-CLMs we used, T-CLMs (and equivalent analyses) do not isolate stable between-persons variation across measurement occasions, and can produce cross-lagged associations that may reflect a mixture of between- and within-person variance (Hamaker et al., 2015). In other words, the prospective paths in T-CLMs may not capture true, within-person changes. As a point of comparison, we conducted T-CLMs that did not include latent variables to remove trait variance. 5 And indeed, as can be seen in Table 5, using T-CLMs, we found numerous cross-lag associations. Specifically, we found that subjective indicators of health appeared to significantly prospectively predict all global and experiential well-being variables (average |β| = .09). Objective indicators of health appeared to generally prospectively predict global well-being, but not experiential well-being, with several exceptions (e.g., doctor visits did not consistently predict well-being; hours slept and sick days were not related to global negative affect). Finally, global well-being—but not experiential well-being—appeared to significantly prospectively predict all health variables, with a few exceptions (global positive affect and life satisfaction did not predict hours slept).
Traditional Cross-Lag Longitudinal Associations Among Well-Being and Health Variables.
Note. Ninety-five percent CIs for parameter estimates in bold do not contain zero. CI = confidence interval; LB = lower bound; UB = upper bound; DRM = day reconstruction method; PA = positive affect; NA = negative affect.
In sum, had we used T-CLMs to analyze our data, we might have concluded that there is a nuanced pattern of prospective associations between health and well-being: Worse health (especially subjective indicators) prospectively predicts worse well-being a year later, but only poor global well-being (and not experiential well-being) generally prospectively predicts worse health a year later. Ultimately, however, our RI-CLMs suggest that these apparent prospective effects may be artifacts of not adequately controlling for stable between-persons variation in health and well-being across time (see Table 3).
Discussion
A large body of research has found that global well-being and health are positively associated—both cross-sectionally and longitudinally (e.g., Friedman & Kern, 2014; Kööts-Ausmees & Realo, 2015; Pressman & Cohen, 2005; Røysamb et al., 2003). The present study expanded this literature by also exploring the longitudinal associations between health and experiential well-being (i.e., momentary emotions).
Latent Correlations Between Health and Well-Being
First, we replicated prior findings that health is positively correlated with both global and experiential well-being (e.g., Daly et al., 2010; Howell & Sweeny, 2016; Kööts-Ausmees & Realo, 2015). Importantly, these correlations were generally larger for global well-being. This was true even for objective health measures (e.g., the correlations between global affect and sick days or doctor visits were up to 2-3 times larger than the same correlations between health and experiential affect). The fact that even objective indictors of health were more strongly related to global well-being than experiential well-being may require researchers to temper claims that global measures of well-being are less valid than experiential ones (Kahneman, 1999; Robinson & Clore, 2002a; see Diener & Tay, 2014). Indeed, if anything, our data suggest that global well-being measures are more strongly related to health than are experiential measures. This phenomenon may occur because different aspects of peoples’ lives have idiosyncratic “weights” in contributing to their well-being (e.g., some individuals may predominantly feel negative affect [e.g., while working] but nevertheless have high well-being because they have primarily positive experiences in valued domains [e.g., family]). Global reports of well-being may capture individuals’ unique perceptions of their lives in a way that is not possible with more “objective” experiential measures. Ultimately, these or other processes may create a situation in which omitting global measures in favor of experiential ones (e.g., Kahneman, 1999; Kahneman et al., 2004) reduces scholars’ abilities to predict consequential outcomes.
Finally, also replicating previous research, subjective ratings of health were more strongly correlated with well-being than were more objective health indicators (Angner et al., 2009; Diener et al., 1999). This pattern may indicate that individuals’ self-reported health captures a more integrated, comprehensive, and holistic view of their health than can be reasonably attained via objective measures (e.g., Idler & Benyamini, 1997). Alternatively, it may be the case that individuals’ perceptions of their health are more relevant to their well-being than are their objective circumstances (e.g., people who are able to successfully psychologically downplay the importance of poor health may mitigate its impact on their well-being; Diener et al., 1999).
Longitudinal Associations Between Health and Well-Being
Next, we investigated the extent to which health and well-being changed together across 3 years. Specifically, we used RI-CLMs (Hamaker et al., 2015) to examine the extent to which (a) health prospectively predicted changes in well-being 1 year later, (b) well-being prospectively predicted changes in health, and (c) changes in health from year to year were correlated with simultaneous changes in well-being.
In our study, changes in health generally did not predict subsequent changes in well-being 1 year later, and vice versa. In contrast, we did find that within-person changes in health from year to year were generally correlated with simultaneous changes in well-being. For example, on waves when individuals reported greater self-rated health, more satisfaction with their health, fewer doctor visits, or greater hours slept, they also tended to report greater life satisfaction. These findings suggest that health and well-being systematically change together across time, and this may indicate that they are dynamically linked (e.g., both are influenced by common causes and/or they mutually influence one another). However, our findings do not constrain inferences about causal priority.
Importantly, the pattern of correlated changes in our study was similar to the cross-sectional latent correlations. Specifically, the correlated changes were generally stronger for global measures of well-being than for experiential measures. For example, changes in global well-being were related to simultaneous changes in five of the six health measures. In contrast, changes in experiential well-being were only correlated with changes in half of the health measures—and changes in experiential well-being were generally unrelated to changes in objective health measures. As with the trait analyses, these findings seem to contradict the notion that global measures of well-being are less valid than experiential ones—and may actually indicate that global well-being may be more sensitive than experiential well-being to variation in individuals’ objective circumstances (Diener & Tay, 2014; Kim-Prieto et al., 2005). Finally, also similar to the latent analyses, the correlated changes were larger for subjective measures of health (e.g., self-rated health), as compared with more objective indicators of health (e.g., number of sick days) (Angner et al., 2009; Diener et al., 1999).
The fact that we found correlated changes between health and well-being in our study—but not prospective associations—may not be particularly surprising. Specifically, the measurement occasions in our study were separated by a year, and previous research suggests that only recent events (e.g., within approximately 3 months) tend to covary with well-being (Suh et al., 1996). Indeed, intuitively it would seem surprising if a brief snapshot of a person’s health predicted changes in their well-being (or vice versa) that were large and enduring enough to be detected a full year later. In contrast, finer-resolution longitudinal dynamics (e.g., health causing nearly immediate changes in well-being) would have been captured in our study as correlated changes. Thus, our findings are consistent with the idea that health and well-being are dynamically linked—but the longitudinal transactions likely occur relatively quickly (i.e., over a timespan of days, weeks, or months, rather than years; Suh et al., 1996). Our study provides valuable information about longer term dynamics between health and well-being. Multiple future studies will likely need to use varying longitudinal timeframes (e.g., days, weeks, months) to fully understand the speed with which changes in health may predict subsequent changes in well-being (and vice versa).
How, then, can our results be reconciled with previous findings that health and well-being do prospectively predict variation in one another across years? (e.g., Benyamini et al., 2000; Gana et al., 2013; Gandy et al., 2014) For example, Gana and colleagues (2013) found that health measures prospectively predicted well-being two full years later. One likely explanation for the discrepancy between our findings and those of prior studies is differences in the statistical models used. Specifically, most prior studies examining longitudinal associations between health and well-being have used traditionally specified cross-lag models (or equivalent analyses; for example, YT2 = XT1 + YT1).
These types of models are drawing increased critical attention (e.g., Hamaker et al., 2015). One key concern is that such models can conflate stable between-persons variance with within-persons change, creating the appearance of prospective associations that may simply reflect that two constructs correlate on the between-person level. Thus, it is possible that previous studies found significant prospective associations between health and well-being—whereas we did not—because those prior studies used T-CLMs. To illustrate this point, we entered our data into T-CLMs—and indeed, we found numerous prospective associations. Especially subjective ratings of health appeared to prospectively predict well-being 1 year later, and especially global ratings of well-being appeared to prospectively predict health 1 year later.
These cross-lagged analyses illustrate that, had we used T-CLMs only, we might have been tempted to conclude that there is a nuanced pattern of longitudinal associations between health and well-being. Ultimately, however, as our primary, preregistered RI-CLM analyses demonstrated, these apparent prospective effects are likely artifacts of not controlling stable between-persons variation in the variables.
Implications, Limitations, and Future Directions
The largest implication of our study is that health and well-being are dynamically linked across time. This may suggest that well-being and health mutually impact one another (e.g., Diener & Chan, 2011; Diener et al., 1999; Pressman & Cohen, 2005; Steptoe et al., 2015)—or at the very least that they share common causes that produce systematic covariation across time. That said, one feature of our study that is both a strength and limitation is the long delay between waves. On one hand, our study allowed us to examine how health and well-being jointly covary over extended periods of time. On the other hand, presumably due to the long delay between waves, we were able to detect only simultaneous correlated changes in health and well-being—and not prospective effects. Although our studies provide valuable information on how longer term processes unfold, future studies should endeavor to measure health and well-being using finer temporal resolutions (e.g., monthly) to more effectively tease apart whether changes in health proceed changes in well-being and/or vice versa.
A second implication of our study is that global well-being appears to be both more temporally stable and more strongly related to health variables than does experiential well-being (Diener & Tay, 2014; cf. Kahneman, 1999). Indeed, as compared with experiential measures, global ratings of well-being were universally more strongly correlated with health—including objective measures. This may suggest that the methodological costs to administering experiential measures (e.g., greater time required) may not entail benefits beyond what can be attained from shorter, simpler global questionnaires.
That said, one limitation of our study is that we used DRM instead of ESM. Although prior research suggests that DRM and ESM, once aggregated, correlate near the bounds of their reliabilities (e.g., Bylsma et al., 2011; Tweten et al., 2016), we cannot rule out the possibility that ESM might correlate more strongly with health than does DRM. Future research might test this possibility.
Relatedly, the use of any sort of experiential measure—whether DRM or ESM—across only 1 day may not be reliable enough to capture stable variance in people’s emotions. Research suggests that a surprisingly high portion of the variance in DRM reports of a single day (e.g., 30%-50%) is stable across even 2 years (Hudson et al., 2017). Nevertheless, aggregating greater amounts of DRM/ESM data may increase the reliability of the measure and improve its criterion validities. That being said, similar logic could be applied to global measures as well: Aggregating more global data may also improve its reliability and validities. Thus, future longitudinal research might consider collecting global and experiential measures across several consecutive days at each time point.
One final implication of our study is that choice of statistical methods is important when studying longitudinal processes. Specifically, statistical models that examine prospective associations by merely controlling prior scores on the variables (e.g., T-CLMs) have the potential to conflate between-persons and within-persons effects (Hamaker et al., 2015). Underscoring this point, our primary analyses, which controlled for stable individual differences, found little evidence for prospective associations among health and well-being over the span of 1 year. In contrast, when we subjected our data to T-CLMs, we found numerous prospective associations between health and well-being. These analyses suggest it is critical for researchers to carefully consider whether their statistical models appropriately operationalize the processes under investigation.
Conclusion
One of the oldest questions in psychology is the extent to which health and well-being are linked. Our study adds to the large existing body of literature demonstrating that well-being—both global evaluations of overall well-being and actual affective experiences—are correlated with health. Moreover, our study suggests that both global and experiential well-being jointly change with health across time. Collectively, our findings underscore that both global well-being and subjective reports of health are valuable measures for psychologists to use in future studies.
Supplemental Material
Hudson_OnlineAppendix – Supplemental material for Healthier and Happier? A 3-Year Longitudinal Investigation of the Prospective Associations and Concurrent Changes in Health and Experiential Well-Being
Supplemental material, Hudson_OnlineAppendix for Healthier and Happier? A 3-Year Longitudinal Investigation of the Prospective Associations and Concurrent Changes in Health and Experiential Well-Being by Nathan W. Hudson, Richard E. Lucas and M. Brent Donnellan in Personality and Social Psychology Bulletin
Footnotes
Appendix
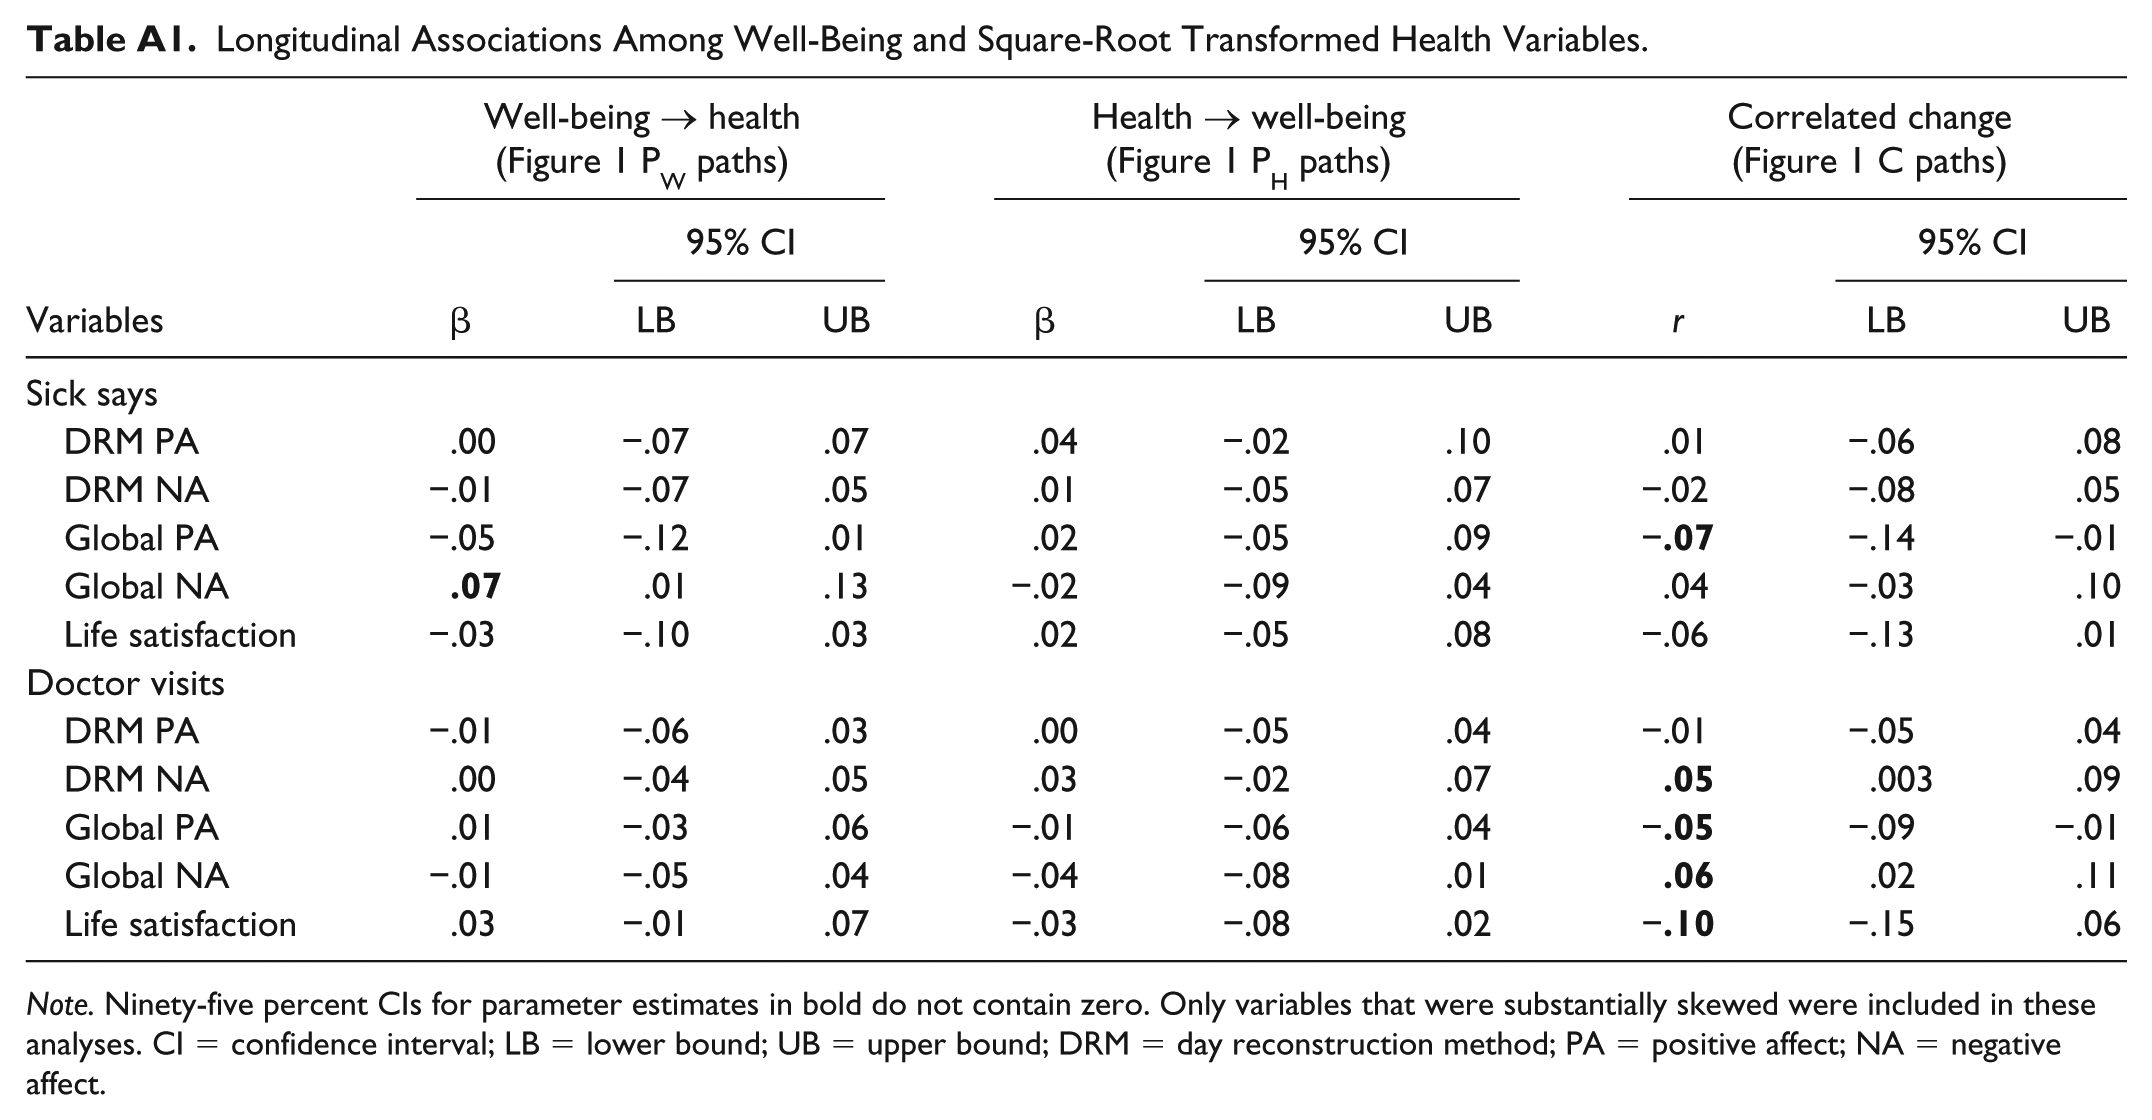
Longitudinal Associations Among Well-Being and Square-Root Transformed Health Variables.
| Variables | Well-being → health (Figure 1 PW paths) |
Health → well-being (Figure 1 PH paths) |
Correlated change (Figure 1 C paths) |
||||||
|---|---|---|---|---|---|---|---|---|---|
| β | 95% CI |
β | 95% CI |
r | 95% CI |
||||
| LB | UB | LB | UB | LB | UB | ||||
| Sick says | |||||||||
| DRM PA | .00 | −.07 | .07 | .04 | −.02 | .10 | .01 | −.06 | .08 |
| DRM NA | −.01 | −.07 | .05 | .01 | −.05 | .07 | −.02 | −.08 | .05 |
| Global PA | −.05 | −.12 | .01 | .02 | −.05 | .09 | − |
−.14 | −.01 |
| Global NA |
|
.01 | .13 | −.02 | −.09 | .04 | .04 | −.03 | .10 |
| Life satisfaction | −.03 | −.10 | .03 | .02 | −.05 | .08 | −.06 | −.13 | .01 |
| Doctor visits | |||||||||
| DRM PA | −.01 | −.06 | .03 | .00 | −.05 | .04 | −.01 | −.05 | .04 |
| DRM NA | .00 | −.04 | .05 | .03 | −.02 | .07 |
|
.003 | .09 |
| Global PA | .01 | −.03 | .06 | −.01 | −.06 | .04 | − |
−.09 | −.01 |
| Global NA | −.01 | −.05 | .04 | −.04 | −.08 | .01 |
|
.02 | .11 |
| Life satisfaction | .03 | −.01 | .07 | −.03 | −.08 | .02 | − |
−.15 | .06 |
Note. Ninety-five percent CIs for parameter estimates in bold do not contain zero. Only variables that were substantially skewed were included in these analyses. CI = confidence interval; LB = lower bound; UB = upper bound; DRM = day reconstruction method; PA = positive affect; NA = negative affect.
Declaration of Conflicting Interests
The author(s) declared no potential conflicts of interest with respect to the research, authorship, and/or publication of this article.
Funding
The author(s) disclosed receipt of the following financial support for the research, authorship, and/or publication of this article: This research was supported by a grant from the National Institutes of Health National Institute of Aging (AG040715).
Notes
Supplemental Material
Supplemental material is available online with this article.

References
Supplementary Material
Please find the following supplemental material available below.
For Open Access articles published under a Creative Commons License, all supplemental material carries the same license as the article it is associated with.
For non-Open Access articles published, all supplemental material carries a non-exclusive license, and permission requests for re-use of supplemental material or any part of supplemental material shall be sent directly to the copyright owner as specified in the copyright notice associated with the article.
