




Abstract
Traditionally, statistical power was viewed as relevant to research planning but not evaluation of completed research. However, following discussions of high false finding rates (FFRs) associated with low statistical power, the assumed level of statistical power has become a key criterion for research acceptability. Yet, the links between power and false findings are not as straightforward as described. Assumptions underlying FFR calculations do not reflect research realities in personality and social psychology. Even granting the assumptions, the FFR calculations identify important limitations to any general influences of statistical power. Limits for statistical power in inflating false findings can also be illustrated through the use of FFR calculations to (a) update beliefs about the null or alternative hypothesis and (b) assess the relative support for the null versus alternative hypothesis when evaluating a set of studies. Taken together, statistical power should be de-emphasized in comparison to current uses in research evaluation.
Keywords
Evaluating research stands as one of the most important activities undertaken in personality and social psychology. Some criteria commonly used to evaluate research have remained reasonably consistent over time. For example, experiments continue to have internal validity advantages over observational studies (Fabrigar et al., 2020). Yet, the uses of other criteria have changed substantially in recent years. In this article, we closely examine how statistical power is used to evaluate research in social and personality psychology. In particular, we examine shifts over time in the use of statistical power. We conclude that recent practices overemphasize statistical power in research evaluation because a primary argument for use of power—low power increasing the proportion of “findings” (i.e., rejections of the null hypothesis) that are false—falls short in three important ways. First, the assumptions underlying calculations of false finding rates (FFRs) diverge greatly from the research reality. Second, the calculations that form the basis of the false finding argument do not support strong or general influences of statistical power. Finally, research evaluation that better reflects the research and publication realities as well as the rationale underlying previous uses of power actually further undermine the use of power to evaluate individual studies.
Statistical Power
In traditional null hypothesis significance testing (NHST), statistical power is the probability over repeated samples of correctly rejecting a false null hypothesis. In NHST, one starts with an effect of interest, such as a difference in means across two experimental conditions. The observed difference serves as an estimate of the effect in the population and is scaled by observed variation across participants as an estimate of the standard error of that effect (i.e., the standard deviation of the sampling distribution associated with the effect of interest). When an obtained test statistic is sufficiently extreme (in comparison to the expected values calculated under the null), the researcher regards a population with an effect value of zero as unlikely to have produced the obtained value based on sampling variation alone. Of course, it is possible that a rejection of the null hypothesis represented a Type I error, in which the population effect is actually zero, although the rate of such errors can be controlled in advance (the α rate—typically .05).
Recently, the research community has used statistical power to infer how likely the results of a given study are to be replicated in future research (cf. Eich, 2014; Lindsay, 2015; Vazire, 2016). Many reason that low power increases the incidence of false findings that, by their very nature, are unlikely to replicate (e.g., Button et al., 2013; Giner-Sorolla et al., 2019; Pashler & Harris, 2012). Increasing power has then been proposed as a way to reduce false findings and increase replication rates. Taken together, power has developed into a criterion to indicate that a result is “credible.” In our experience, except in extreme cases, the use of presumed levels of power to infer a result’s credibility seemed much less common 30 or even 20 years ago. Evaluating any such tendencies requires consideration of how statistical power was traditionally used, how it tends to be used now, and the reasons for shifts over time.
These shifts have corresponded with the rise in concerns about replication rates and the veracity of evidence supporting effects in the literature. Replication and evidentiary bases of claims are tied up in how manuscripts are constructed and evaluated. Manuscripts have also changed over the last 20 to 30 years in terms of the number of studies typically included. Statistical power is most often addressed in the context of a single study using a particular experimental design and statistical test. Yet, the majority of manuscripts processed and published at top journals in personality and social psychology typically consist of more than one study (e.g., Flake et al., 2017, noted that the average article in the Journal of Personality and Social Psychology presented just over 4 studies). Therefore, it would seem important to examine how concerns about the power of single studies fit within the broader evaluation of study sets.
In subsequent sections, we review traditional uses of power and compare them with current uses. Next, we evaluate the extent to which the stated reasons for these shifts have a compelling conceptual basis. We then examine how the same FFR calculations frequently used to justify calls for increased power have different implications when used to examine the accumulation of evidence across studies or evaluation of sets of studies.
Traditional Use of Statistical Power
Considerations of statistical power go beyond the machinery of statistical testing per se. Testing a null hypothesis does not require specifying the size of a possible effect. Yet, any calculation of statistical power requires specification of a population effect size (or a set of possible sizes if considering power curves rather than a single estimate of power; Cohen, 1988). Once the relevant values are assumed, the proportion of samples expected to fail to reject the null hypothesis is labeled as the Type II error rate (β), and the calculated power value reflects the proportion over an infinite number of samples that would exceed the critical value for rejecting the null hypothesis (a value of 1 − β).
Traditionally, power was treated as part of study design. Power was used to assess whether a given study design was feasible given resource constraints. Power was also used to ensure that a given study (e.g., proposed in a grant application or for a thesis or dissertation) would put the researcher in a position to make a claim of presence or absence of an effect after the study was complete. This perspective represented a somewhat impoverished view of statistical power (which is for a proportion of outcomes across an infinite number of samples, not for a single study). As methodological work has shown, there is a lot of uncertainty in the power calculated for a given procedure (Pek et al., in press; Pek & Park, 2019). Uncertainty could stem from sampling variability when based on obtained effect size estimates from one (Yuan & Maxwell, 2005) or more (McShane et al., 2020) studies or other sources, such as lack of close corroborative evidence.
Jacob Cohen, the primary advocate of consideration of statistical power, was clear, however, in describing power as relevant to pre-data-collection study planning but not to post-data-collection study evaluation. For example, Cohen (1973) noted that a previous review of power by Brewer (1972) had fallen short by treating low power as casting doubt on the validity of what otherwise would be a proper rejection of H0 based on research data. That is, Cohen (1973, p. 227) noted that, “power analysis is a powerful, in fact the only rational, guide to planning the relevant details of the research. But once data are gathered and analyzed, it recedes into the background.”
Statistical Power and FFRs
The treatment of statistical power changed when researchers started to link low statistical power to high rates of “false findings” in the literature. The FFR refers to the ratio of Type I errors to the total number of rejections:
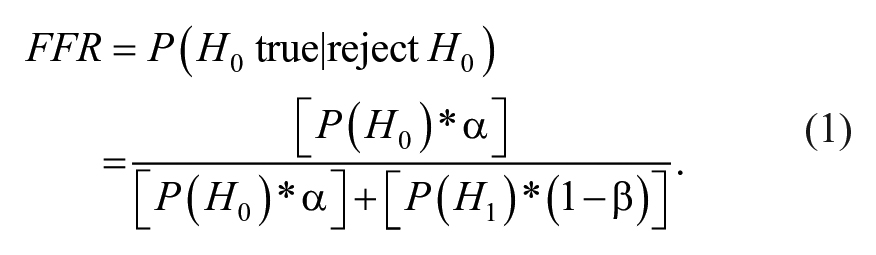
The FFR formula uses not only alpha and power values but also a prior probability that the null hypothesis is true [P(H0)] and the prior probability that the alternative hypothesis is true [P(H1)] (in NHST, the null and alternative hypotheses are treated as complements; for the current discussion, the prior probability of the alternative hypothesis might represent a probability of the true result falling in the predicted direction, whereas the prior probability of the null could represent the probability of a population effect of zero or falling in the opposite—unexpected—direction). As one can see in Equation 1, all else being equal, if power increases, the denominator will be larger, which would reduce the overall FFR. In practice, if designs associated with low power generally enhance the likelihood of false rejections appearing in the literature, then perhaps researchers could justify using perceptions of power to determine whether they can trust the results of studies using that design. As we describe in the following sections, however, there is little reason to believe that there are general associations between low statistical power and a high FFR.
Perhaps ironically, this notion began to take hold in psychology following an influential article by Cohen (1994) focused on the potential differences between rejecting a null hypothesis (e.g., because of a low p value) and making inferences about the status of the null hypothesis given that rejection. The former is a consideration of the null hypothesis as a potential explanation for the data that were obtained, where a low p value (i.e., P[data | true H0]) suggests that the null hypothesis is not a good account of the data. The latter is a consideration of the status of the null hypothesis in light of the data (i.e., P[H0 true | reject H0]). As shown in Equation 1, this consideration involves the prior probability of the null (and alternative) hypothesis as well as alpha and power. To illustrate the potential difference between a p value and the potential truth or falsity of the null hypothesis given the data, Cohen (1994) used a screening analogy. In his scenario, the null hypothesis (that a person is “normal”) had a prior probability of .98 and an alternative hypothesis (that a person has schizophrenia) had a prior probability of .02. Assuming that a test for schizophrenia correctly identifies .97 of people without schizophrenia (α = .03) and .95 of people with schizophrenia (β = .05), Cohen noted that even with a positive test for schizophrenia (similar to a rejected null hypothesis), the probability that the person does not have schizophrenia remains higher than .6. The generalization of this was to suggest that, in the context of these prior probabilities, given a significant result, the probability that the result was false (i.e., that the null hypothesis remains true) was substantially higher than the alpha level.
The impact of this screening analogy was not immediate, and a number of aspects of Cohen’s (1994) scenario and conclusions about NHST were criticized (e.g., see Cortina & Dunlap, 1997; Hagen, 1997; for a comprehensive review, see Nickerson, 2000). Yet, the screening analogy formed a foundation for examinations of how frequent false findings might be in published research. These false findings have also been discussed as contributing to disappointing replication rates in psychology and other disciplines (e.g., Button et al., 2013; Christley, 2010; Ioannidis, 2005; Pashler & Harris, 2012).
High-profile claims such as “most published research findings are false” (Ioannidis, 2005) rest on this screening analogy and treat each study as independent and occurring in parallel to every other study in the analysis (rather than building on one another). The studies represent the field in general, with the simplifying assumptions that all studies have the same power and alpha, even when they address different research questions. For example, Pashler and Harris (2012) suggested that false findings might be frequent in the literature. That is, assuming a prior probability of .1 for an effect being true and a power of .35, the proportion of significant results that are false is .56 (see also Button & Munafὸ, 2017; Christley, 2010). By increasing power to .8 in the same scenario, the proportion of significant results that are false drops to .36. In the following years, editors began advocating the use of statistical power to identify “sufficient” sample sizes (e.g., Cooper, 2016; Kawakami, 2015; Kitayama, 2017; Lindsay, 2015; Vazire, 2016; see also Funder et al., 2013). Some journals also revised submission guidelines to emphasize the importance of power analysis (e.g., Journal of Experimental Psychology: General and Personality and Social Psychology Bulletin). In our experience, reviewers and editors also began to use such rationales to criticize findings as too likely to be false if a study used a design that might have low power. For manuscripts to be publishable, they required additional studies perceived as likely to have “high power” (typically .8).
Such conclusions might initially seem reasonable, although they diverge somewhat from Cohen’s (1994) original conclusions. For example, he did not offer increased power as a solution. Indeed, in his screening example to illustrate the difference between the alpha rate and the probability of a true null given the rejected hypothesis, he had used a power value of .95. Instead, Cohen (1994) concluded that researchers would have to rely on consistency of results across studies (i.e., on replication) to determine which effects are real and which are not.
Literature-Wide False Finding Calculations: Theoretical Assumptions
Calculating literature-wide FFRs depends on several specific assumptions that have not been fully articulated or justified. Yet, violations of the assumptions would undermine the use of FFR calculations to justify the use of statistical power as a key criterion for research evaluation. Indeed, several assumptions often seem likely to be violated, sometimes substantially, in manuscripts submitted to personality and social psychology outlets.
Most FFR discussions focus on exploratory research with high prior probabilities of a true null hypothesis (e.g., Button & Munafὸ, 2017; Pashler & Harris, 2012). 1 For example, consider a .90 prior probability of a true null and 1,000 studies each conducted with designs possessing a power of .8. One would expect 80 of the 100 true effects to be identified through correct rejections of the null hypothesis, but 45 of the 900 null effects would also be identified through incorrection rejections (Type I errors). Among the rejections of the null hypothesis, the FFR would then be 45/(45+80) or .36. In other words, 36% of the statistical rejections of the null hypothesis would be false findings. If, instead, the studies used designs associated with a power of .2, one would expect only 20 of the 100 true effects to be identified alongside the same 45 incorrect rejections, expanding the FFR to .69.
It is important to note that FFR calculations applied to literatures are hypothetical and theoretical. The screening analogy itself might be based on observed (frequentist) probabilities such as rates of positive versus negative tests and actual rates of disease in the population. However, there is no such equivalent in personality and social psychology (Stroebe, 2016), so the probabilities have to represent (Bayesian or subjective) beliefs. Therefore, any assumed prior probabilities (e.g., [P(H0)]) and any calculated posterior probabilities (e.g., [P(H0 true| reject H0)]) remain hypothetical. A key question then becomes how applicable the calculated rates are to the published literature or to submitted manuscripts in personality and social psychology. The answer to that question would require consideration of how assumptions in the calculations relate to research realities in the field. The following sections address a number of the key assumptions.
Independence of Studies and Phenomena
A simplifying assumption in FFR calculations is that each study is independent of all others (Ioannidis, 2005). This assumption has received insufficient attention, especially regarding how research accumulates over time. When considering the individual parts of the FFR formula, one might think that it should not matter whether the independent studies address the same phenomenon or not. However, there is a further crucial assumption implicit in the FFR calculations. They use the prior probabilities of the null versus alternative hypothesis, but they do not address the accumulation of studies examining each type of effect. It seems quite likely that true effects would accumulate more follow-up studies than false rejections. After all, true effects would be much more likely to replicate, even with modest statistical power, compared to the false rejections. If so, however, then the rates of the actual accumulated studies would be markedly different from those portrayed in FFR calculations.
Consider the earlier scenario with a prior probability of the null of .90, where 1,000 studies would include examination of 900 null effects and 100 true effects. Such numbers make sense only if each hypothesis receives a single test (or an equal number of tests per hypothesis when examining false versus true effects). But that assumption seems unlikely to hold in actual research. When initial effects are identified, it is typical for researchers to conduct follow-up research. If later studies fail to produce consistent results with at least some reaching significance, the initial significant results might never be submitted for publication. Even if each significant result was submitted, it is highly likely that true effects would prompt a larger number of follow-up studies and a larger number of submitted studies over time than would the false effects. If, for example, true effects result in 2 to 4 times more studies per hypothesis than false effects, then the relative proportions of effects used in the theoretical FFR calculations would be far off. Instead of 100 studies of true effects out of 1,000 when the prior probability of a true effect is .1, it might be more like 200 to 400 studies of true effects. If so, then even granting all other assumptions and using the scenario with a probability of an effect being .10 and power being .20, instead of an FFR of .69, it might fall between .27 and .50. Modest power of .35 with the same prior probability would result in an FFR between and .18 and .36 instead of .56. With higher probabilities of the effect being true, the impact of more follow-up studies of true effects would further reduce the FFR.
Publishing Individual Versus Sets of Studies
When relating FFR calculations to published results, a straightforward translation of such rates would be possible if every study that produces significant results is published as a single-study article. Of course, that does not at all parallel the personality and social psychology literature. Perhaps multi-study articles would be one indication that a larger number of follow-up studies is likely to accumulate for true effects. Yet, the collection of studies into sets would also have other implications.
Consider sets of studies from the “false finding” category. In such sets, each direction of effect would be equally likely. However, sets of studies that produce directionally inconsistent results are especially unlikely to be published. 2 It would also seem unlikely for single-study papers to be published over time if the same lab (or even different labs) were to sometimes produce one direction of effect and sometimes the opposite direction of effect without any resolution of when each effect is supposed to occur. In contrast, consider sets of studies from the “true finding” category. Such sets would tend to include a larger proportion of rejections that lie in the same direction across studies. Even data that do not reach significance would be heavily slanted in the direction of the true effect rather than equally spread across directions (Fabrigar & Wegener, 2016). In fact, added significant studies in a set should also enhance the likelihood that the documented effect is true rather than false (Moonesinghe et al., 2007). Thus, the general practice of publishing sets of studies instead of individual studies would further separate the realities of the literature in personality and social psychology from that portrayed by FFR calculations. 3
High Prior Probabilities of True Null Hypotheses
Calculations used to demonstrate links between statistical power and FFRs generally specify high prior probabilities of a true null hypothesis (or, by complement, low prior probabilities of a true effect). When prior probabilities reflect obtained probabilities, such as incidence of disease in a population, such probabilities represent frequentist probabilities as would the posterior probabilities that would come from those calculations (cf. Ioannidis, 2005). In the personality and social psychology literature, however, there is no basis on which to determine such prior probabilities. Instead, the prior probabilities must reflect beliefs about hypothesis truth or falsity (and are therefore considered Bayesian prior probabilities). Thus, attempting to apply FFR logic to the personality and social psychology literature requires one to step outside the typical frequentist approach to statistics. Acknowledging that fact might make researchers using frequentist tools a bit uncomfortable, as a frequentist approach generally treats the data as the data (whatever they show), whereas a Bayesian approach allows a strong prior probability to shift interpretation and potentially even overwhelm the new data.
Perhaps just as importantly, the examples that receive the most attention in FFR discussions also diverge from the setup of commonly used statistical tests and from beliefs about the empirical realities common in the methodological literature. Generally, the null hypothesis in NHST is a point hypothesis and cannot have a probability (i.e., an area under the curve specified by a distribution). This point value (with probability of zero) could be taken to undermine the very notion of calculating FFRs, at least by those who are using NHST. A zero probability of the null might also generally match reality. Consistent with this idea, Tukey (1991, p. 100) noted that “All we know about the world teaches us that the effect of A and B are always different—in some decimal place—for any A and B.” That is, even if one had population values of the mean under conditions A and B, the population means would never be identical in reality. The challenge for researchers is that they start out with no information about the direction in which the difference in population means will fall. Rather, “what we should be answering first is ‘Can we tell the direction in which the effects of A differ from the effects of B?’ In other words, can we be confident about the direction from A to B? Is it ‘up,’ ‘down’ or ‘uncertain’?” (Tukey, 1991; p. 100). Building on such notions, Jones and Tukey (2000) suggested an alternative version of the significance test in which there is no concept of Type I error because the null is never true. 4
Aside from characterizing some research as exploratory and, therefore, associated with a high prior probability of the null hypothesis, discussions of FFRs have generally not explained what prior probabilities would be reasonable in practice. However, there is quite a distance between the theoretical assumptions in many FFR calculations (e.g., .90 prior probability of the null hypothesis) and the reality of a point null hypothesis with a probability of zero! From the Jones and Tukey (2000) perspective, perhaps a researcher might begin with an “uninformed” (exploratory) notion of each direction of effect having a .50 probability (i.e., either direction being equally likely). As existing theory and data accumulate to suggest that one side is more probable, however, the prior probability of an effect in that direction should only increase. A primary point of the introduction in research articles is to make the case that the predicted effect should be viewed as more plausible than the alternative based on previous data and theory (Schaller, 2016; Stroebe, 2016). Thus, one might view the introduction as arguing that the prior probability of a particular effect should be considered as higher than the Jones and Tukey (exploratory) default of .50. To be sure, there are settings in which little previous data or theory exist, and there are others in which many theoretically unrelated measures are taken (similar to the genetics research addressed by Ioannidis, 2005). Moreover, some population effects might be so small as to functionally approximate zero. One might consider higher prior probabilities of the null hypothesis for such settings (or, in Jones and Tukey terms, the direction of the effect remains completely uncertain). Yet, even in such settings, it remains unclear whether a .90 prior probability of the null hypothesis makes sense in practice (and surely not as a blanket assumption across research settings). Unless similarly high prior probabilities of the null hypothesis can be justified, however, claims about the central role of power in explaining low replication rates and its likelihood of serving as a critical solution to that problem rest on shaky ground.
Characterizing Effects of Statistical Power on the FFR
Even if one continued to assume that the FFR calculations hold in reality, the calculations suggest that the impact of statistical power is more limited than often acknowledged. Previous discussions of FFRs are generally written as if statistical power has broad and substantial impact on FFR values, with little explicit acknowledgment of the conditional nature of power’s influences. Yet, the calculated impact of power depends a lot on the assumed prior probability of the effect, and the impact of statistical power is rather weak across much of the range of plausible prior probabilities. Influences of increased power are also far from constant across different levels of baseline power.
Figure 1 presents a graphical depiction of the relation between statistical power (X-axis) and the FFR (Y-axis) at different levels of the assumed prior probability of an effect. There are relatively strong influences of statistical power when the assumed prior probability of the effect is .10 (the solid black line). For example, when the assumed study designs are associated with a statistical power of .2, the FFR is a dramatic .69. If the study designs were instead associated with a statistical power of .8, the FFR would drop substantially to .36. However, the relation between power and the FFR becomes much weaker as the assumed prior probability of the effect increases. Consider a prior probability of .5 (the dotted line, which might conceptually relate to the Jones & Tukey case of uncertainty between one direction of effect and the other). Consistent with the strong influences of the prior probabilities, when statistical power of the study designs is .20, the FFR is only .20, and increasing power to .80 only reduces the FFR to .06 (i.e., a drop of .14 compared to the drop of .33 when the prior probability of the effect was assumed to be .1). The impact of statistical power is even less when the assumed prior probability of the effect is .75 (the dotted and dashed line). That is, increasing the statistical power of the study designs from .2 to .8 only reduces the FFR from .08 to .02.
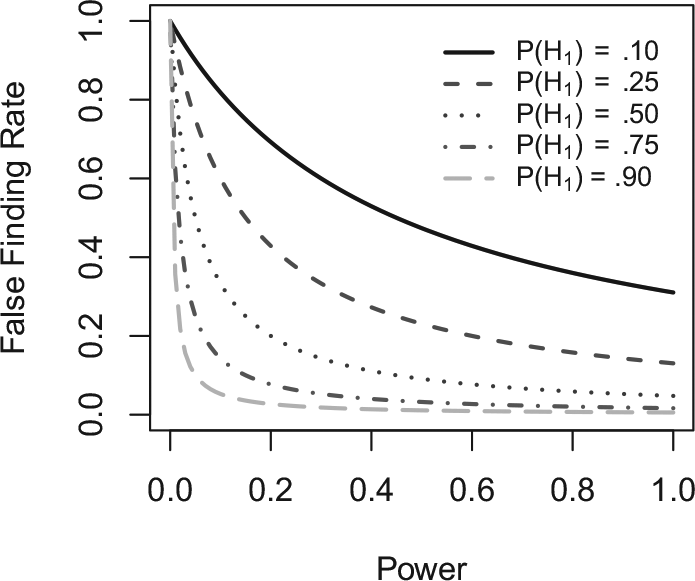
False finding rate (FFR) as a function of power and P(H1) for α = .05.
Discussions linking power to FFR generally say little about this dependency and also fail to point out that the relation has a substantial nonlinear component, with most of the drop in FFR due to shifts from low to moderate power. Indeed, the benefit of increasing power is always greater when moving from power of .2 to power of .5 than it is moving from power of .5 to power of .8, but all of the drops in the FFR with increasing power also get smaller as the prior probability of the effect increases. As noted earlier, on the thick black line (with a .1 prior probability of a true effect), .2 power leads to an FFR of .69. That drops to .47 when power is increased to .5, and it further drops to .36 when power is .8. The effects of increased power are still greater when increasing from low to moderate levels than when increasing from moderate to high levels, but all the effects reduce as the prior probability of a true effect increases. That is, with a prior probability of the effect of .50 (the dotted line), shifting from power of .20 to power of .50 decreases FFR from .20 to .09. The shift from .50 power to .80 power only decreases the FFR from .09 to .06. With a prior probability of the effect of .75 (the black dotted and dashed line), again, most of the reduction in FFR appears at low levels of power. Shifting from power of .20 to power of .50 decreases FFR from .08 to .03. The shift from .50 power to .80 power only decreases the FFR from .03 to .02. Thus, the benefits of increasing power are far from general, even across different levels of statistical power itself.
Taken together, even granting the assumptions underlying the theoretical FFR calculations, the calculations themselves do not justify claims of strong and general influences of statistical power on the rate of false findings. Rather, the calculations identify a number of limits to any such conclusions. First, impacts of statistical power are dwarfed by influences of the assumed prior probabilities of the effects of interest. Thus, the FFR is dramatically reduced when examining effects that build on previous theory and data (therefore having higher prior probabilities of the effect being true) than when examining effects with little or no previous relevant theory and data (see also Schaller, 2016). Second, the impact of power is greatly weakened as the prior probability of the effect approaches and exceeds .50. A prior probability equaling that of a coin flip does not seem unreasonable in many cases, especially when dealing with contexts where previous data and theory serve to justify the plausibility of the hypothesized effect. Third, any impact of power occurs mostly from the increase in power from low to moderate levels. The impact of increases in power from moderate to high levels is much smaller and comparatively negligible if the prior probability of the effect is .5 or greater. Thus, the costs that might be typically involved in increasing power (e.g., by increasing the number of participants) provide much less benefit for avoiding potential false findings when examining questions where the prior probability of a true effect is near or above .5. Also, such costs provide very little benefit in terms of reducing FFRs when increasing power from moderate to high levels.
FFRs When Evaluating Research Programs
When evaluating a multi-study research program, the research community has few tools for thinking about the role of power other than to consider the potential power of each individual study. Yet, on some level, the power of individual studies should be irrelevant to the strength of the “signal” in the study set as a whole. For example, 10 studies of 100 participants each using the same materials and design should provide no more or less compelling evidence than a single study of 1,000 subjects using the same materials and design. This should be true even if the single study of 1,000 participants would use a design with “high power,” whereas the design used in each of the 10 studies would be individually “underpowered.” This type of consideration points toward greater use of some kind of integrative data analysis (Curran & Hussong, 2009) or meta-analysis (Braver et al., 2014; Fabrigar & Wegener, 2016; McShane & Böckenholt, 2017) in multistudy articles and less attention to the individual studies per se.
In our own experiences with the peer review process, however, reviewers and editors continue to focus on individual studies rather than the set as a whole. Therefore, one might profitably ask how considerations of statistical power and the FFR would influence people’s assessments of study sets. For example, in the worst scenario presented by Pashler and Harris (2012), the FFR was .56. Notwithstanding the ways in which reality might diverge from the calculation assumptions, what is one to do with such an FFR when evaluating a set of, say, four studies? If the studies all test the same hypothesis, there would be little reason to argue that 100% of these tests belong to the “true null” category. In fact, of all the studies conducted in literature, it is much more likely that true rather than false findings would be the ones reproduced in sets. One need not use such reasoning to evaluate the set of studies, however. Instead, one might use the same setup as the FFR calculations (Equation 1) but examine the updates in beliefs that would accompany evidence accumulation across studies.
Updating Beliefs Across Studies
Even holding an initial belief that the prior probability of a true null hypothesis is high, taking this more Bayesian approach would also provide a means to consider how that belief should be updated longitudinally across studies. This application of the FFR formula could represent a more realistic depiction of how research is conducted and ultimately reported in a multistudy article. Instead of the FFR, in this scenario, the calculated probability depicted in Equation 2 would be the posterior probability of the null hypothesis being true, given a statistical rejection (see also Hagen, 1997, comments on Cohen, 1994):
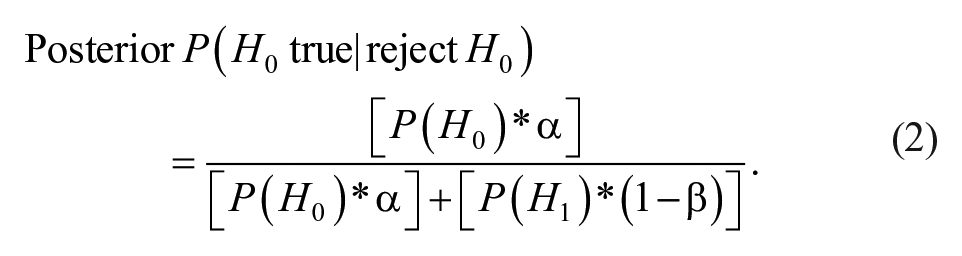
Here, however, the rejections across studies would presumably lie in a predicted direction that is consistent across studies. Therefore, we use an alpha value of .025 to represent that one consistent tail. In Table 1, we list prior probabilities of a true null hypothesis and of statistical power that parallel many FFR discussions. However, we list the updated (posterior) beliefs as well, following a first study, a second study, and a third study (using the prior study’s posterior belief as the prior probability for the next study; see also the Online Supplement).
Posterior Probability of a True Null Given Rejection of the Null [P(H0| Reject H0)] Across Three Studies Given Initial Prior Probability of a True Null [P(H0)] and Assumed Statistical Power.

Even with very high initial beliefs that the null is true, an initial rejection of the null hypothesis lowers posterior beliefs to or below the .50 level at which FFR concerns for follow-up research (and influences of statistical power) are substantially reduced (see Figure 1). Including a second or third directionally consistent study, posterior beliefs would be almost unanimously rejecting of the null hypothesis. An observant reader might protest that some of these calculations make assumptions that rival the implausibility of the FFR calculations because with relatively low levels of power, it is unlikely that one would achieve three significant results in a row (Ioannidis & Trikalinos, 2007). More generally, readers could be concerned that there might have been additional studies in which the results did not reach significance. Including those studies in calculations that update beliefs across studies would often result in similarly low posterior probabilities for the null hypothesis. Yet, perhaps reflecting the single-study emphasis on statistical training, we find that many people are poor at evaluating the implications of added studies that do not reach statistical significance. Meta-analytically, the inclusion of such studies would often actually strengthen evidence of the effect (see Braver et al., 2014; Fabrigar & Wegener, 2016). Yet, many people tend to view such studies as necessarily weakening such evidence. Thus, they might benefit from additional tools to help them evaluate sets of studies involving both significant and nonsignificant results.
Support in Multistudy Sets
In general, we support the use of integrative data analysis or meta-analysis as ways to emphasize the strength of evidence across studies (e.g., Fabrigar & Wegener, 2016; Wallace et al., 2020). Such uses do not directly address evaluators’ perceptions of power related to the design(s) used in individual studies, however. To do that more directly, we provide an additional tool here that builds directly on the calculations used for FFR considerations and longitudinal belief updating. In particular, we created an R Shiny Application (https://seeing-statistics.shinyapps.io/StudySetEvidence/) that takes as input the total number of studies conducted (1-30), Type I error rate (α) for each study (default of .025 to depict directionally consistent rejections across studies), power for each study, and the assumed prior probability of H0. The output includes the probability of rejecting the null for each number of studies from 0 to the total number of conducted studies (a) if H0 is true and (b) if H1 is true. Incorporating the prior probability of H0, the application also creates as primary output an Odds of Support for H1 over H0 in the form of a Bayes Factor (BF10—on the third graphic), where typical criteria could be used (Kass & Raftery, 1995). For comparison, there is also an Odds of Support for H0 over H1 (i.e., BF01—on the bottom graphic). Figure 2 presents the output for a situation in which 12 studies have been conducted, each with a presumed power of .4 and a prior probability of H0 of .50.
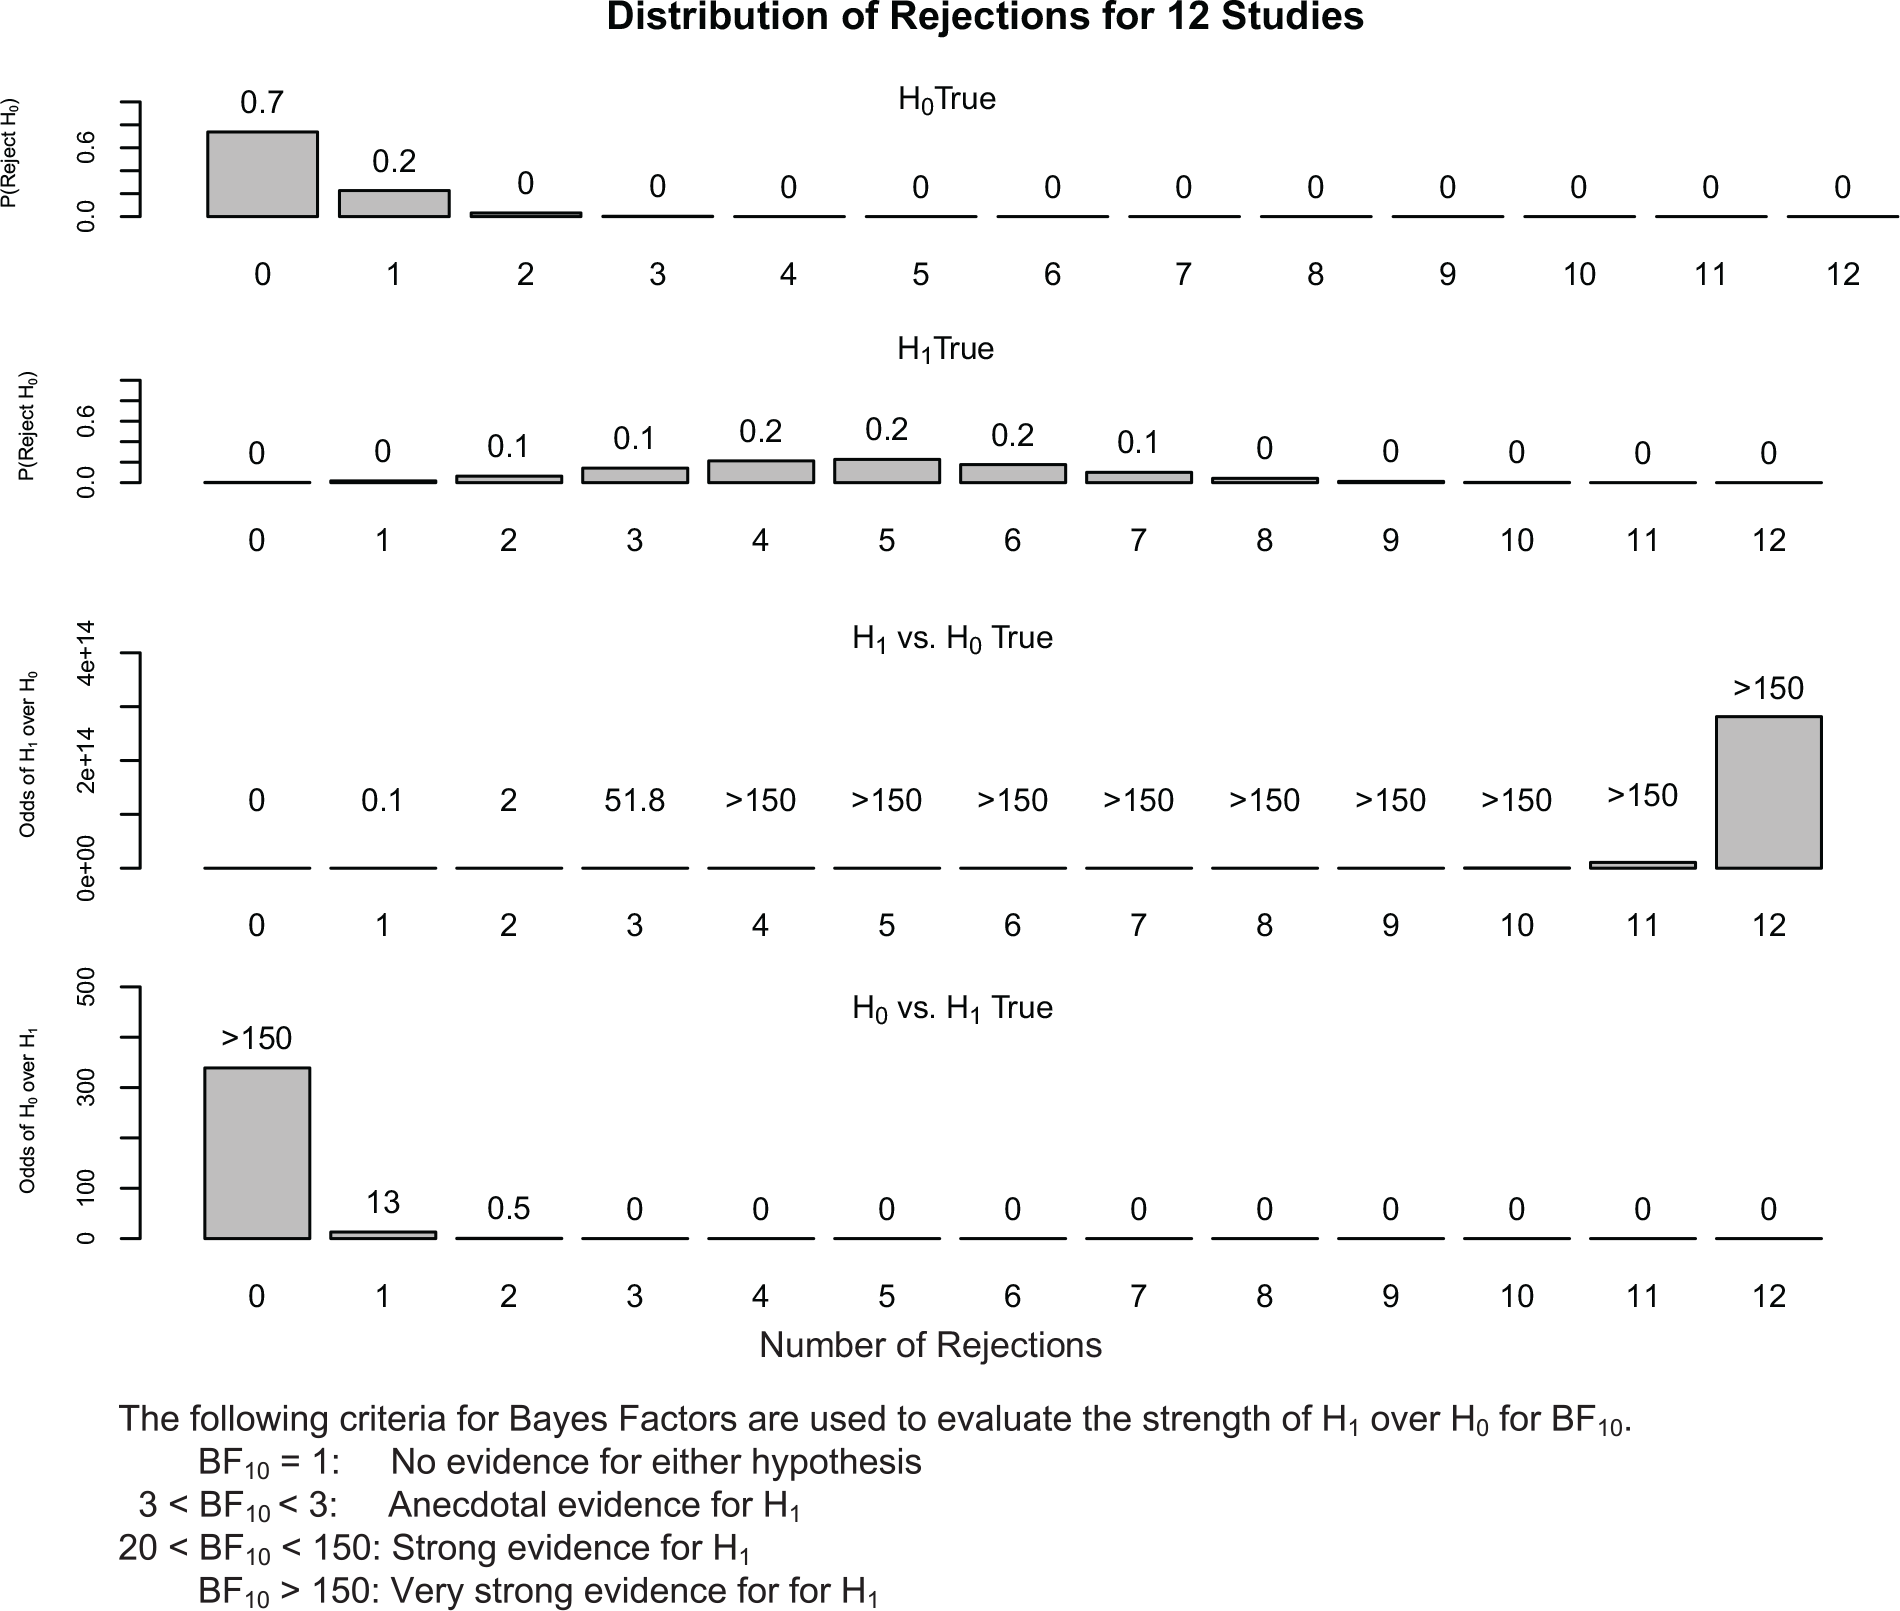
Probabilities of rejecting H0 across studies and resulting support for H1 versus H0.
If H0 is true, the most likely outcome would be 0 rejections of the null hypothesis across the 12 studies, but if H1 is true the most expected outcome would be for 5 of the 12 studies to reach significance. After incorporating a prior probability of H0 of .50 in this example, anecdotal evidence for the effect would be produced with as low as two significant studies, and strong evidence would be produced with three significant studies. Very strong evidence would be produced by four or more significant studies. For comparison, obtaining only one significant study would represent positive evidence for H0, and zero significant studies would represent very strong evidence for H0.
With the ability to specify different numbers of studies, levels of power, and prior probabilities of the null (versus alternative) hypothesis being true, perhaps the tool can also serve a pedagogical role. Researchers might better appreciate how different proportions of significant results (even those that fall far below 100% across studies) can nonetheless represent compelling evidence against the null hypothesis (and in support of a predicted effect). Lack of ability to evaluate one’s assumptions regarding sets of studies might lie at the root of many problematic research practices. Researchers might engage in such practices because any perceived weakness in results is overextrapolated. If the field adopted more sensible approaches to evaluating study sets, it would likely decrease incentives for questionable practices and help researchers to consider statistical power in a deeper way than the current (largely unmodified) heuristics linking power to potentially false findings.
Implications for Research Evaluation
The notion of false findings has captured the attention of researchers as a way to potentially explain disappointing rates of replication. Identified links between statistical power and FFRs have resulted in power taking on a central role as a proposed solution to the replication problem and, by extension, as an indicator of result credibility. Yet, closer examination suggests that the bases for such uses of power are considerably less compelling than is typically acknowledged. This exercise was not conceived as a criticism of the concept of statistical power per se. Studies with high power are certainly not bad (so long as attempts to increase power do not come at the cost of other sources of validity; see Fabrigar et al., 2020). Indeed, statistical power, such as that stemming from large samples, has benefits (e.g., more precise parameter estimates, fewer improper solutions when fitting complex models, etc.). However, assertions that low power is a major source of false findings, that such false findings are the foundation of poor replication rates, or that increased power of individual (original) studies will substantially reduce replication problems are not well grounded conceptually or empirically. Traditionally, figures like Cohen viewed statistical power as useful for study design but not for evaluating the credibility of completed studies. The use of power as a criterion for study credibility increased following FFR calculations suggesting that low power can be associated with high rates of false findings. However, arguments based on the theoretical FFR calculations are difficult to justify because they rest on a number of questionable assumptions. By extension, relating assumed levels of power in original research to replication rates remains questionable to the degree that such arguments rest on assumptions of more false findings created by low levels of power.
Challenges When Using FFR-Based Arguments
There is little justification for directly using the presumed level of statistical power to question whether study results might represent “false findings” (i.e., Type I errors). Using power in such unqualified ways reflects neither the realities of research publication in personality and social psychology nor the conclusions that would follow from the calculations linking prior probabilities and power to the FFR. Let us first consider what the FFR calculations would say if one treated all assumptions underlying those calculations as accurately reflecting research realities. The calculations would not justify “main effect” claims linking statistical power to false findings. Rather, strong links between the assumed level of power and the proportion of findings that are false only occur when there is (i.e., is conditioned on) a high prior probability of the null hypothesis being true. When the prior probability of a true null is ≤.5, the theoretical link between power and false findings is actually quite weak (see Figure 1). Also, across different assumed prior probabilities, most of the theoretical impact of increased power in reducing FFRs occurs in shifting power from low to moderate levels. Increasing power from moderate to high levels has comparatively little impact on the rate of false findings. This pattern is especially clear when the assumed prior probability of the null hypothesis is .5 or lower but is also present at higher assumed prior probabilities. Thus, from the standpoint of FFRs at least, the argument could be made to increase power from low to moderate levels if there is a concern that power is low (e.g., .2). However, based on those same calculations, increasing from moderate to high levels (e.g., from .5 to .8) provides little additional benefit in reducing the FFR. When taken together, then, the theoretical calculations provide little justification for unqualified claims linking low statistical power to the prevalence of false findings in the literature.
More qualified claims could potentially be made if compelling rationale existed for assuming particular levels of existing prior probabilities or baseline levels of power. For example, if a study includes many measures of potential outcomes with little theoretical rationale or previous data supporting particular hypotheses, it could be reasonable to assume a high value for the prior probability of the null hypothesis being true. As Figure 1 shows, the high prior probability alone would suggest a high FFR, but that high prior probability might also allow for use of any presumptions of low power to also color one’s perceptions of the likely FFR. However, with few measures of potential outcomes, strong theoretical rationale for the hypotheses, and prior related empirical support, there is little justification from the FFR calculations to link statistical power with the FFR.
For FFR calculations to directly reflect false finding pervasiveness, researchers must also believe that the prior probabilities can be directly applied to an equal likelihood of all studies being conducted. Yet, it seems highly likely that the greater likelihood of replication of true effects would result in a greater accumulation of studies pursuing true effects relative to that of studies examining initial false findings. The FFR calculations do not take this into account. They also do not address how general FFR proportions would relate to the resulting sets of studies that tend to be packaged into empirical papers. Even relatively high FFR values, such as .5, do not provide a strong basis for classifying 100% of significant studies in a given set as representing Type I errors.
Alternative bases for evaluating sets of studies
When evaluating a research program or multistudy manuscript, the same FFR calculations (Equation 2) can be applied longitudinally to update initial beliefs in the prior probabilities. This type of approach better reflects the scientific process as evidence accumulates across studies and is eventually packaged into an article (when the accumulation of evidence is perceived as compelling). In such cases, even if starting with belief in a high prior probability of the null hypothesis being true, it often would not take many significant studies to make a true null hypothesis seem highly unlikely (see Table 1). This is true even when the presumed statistical power of each study is not high. Even when initial results conflict with past data and theory and one might be tempted to hypothesize after results are known (Kerr, 1998), the first one to two studies would update prior probabilities into a range where false findings in the follow-up studies become unlikely according to the theoretical FFR calculations (and where the same calculations reflect low probability of a true null hypothesis given the data).
Of course, the lower the level of statistical power for each study, the more likely it will be that a set of studies would include some that fail to reach traditional levels of significance (and large sets of studies would often include some non-significant studies even if power is relatively high). Nonetheless, a set of studies in which multiple studies reach significance in a particular direction with few or no studies reaching significance in the opposite direction can form strong evidence for the direction of the population effect. This is true even when the set includes a number of studies that do not reach significance in either direction (although nonsignificant studies also tend to slant toward the direction of the population effect). We used a binomial distribution of counts of significant versus nonsignificant results to illustrate this fact. The tool depicted in Figure 2 allowed us to directly include information about the presumed prior probabilities and the power of the design(s) used in the studies. Its use could help researchers to test their own assumptions about how many significant results in a set is necessary to constitute strong evidence in support of the predicted effects (or against the null hypothesis). Gaining a deeper understanding of the necessary patterns could help researchers to more reasonably evaluate the evidence presented by sets of significant and nonsignificant studies. When such sets do not reflect selective reporting, the power of individual studies should be viewed as less relevant than the signal in the set (that can be documented by integrative data analyses or meta-analyses).
Refinements in research evaluation
It might be tempting to seek a single, seemingly objective number to use in evaluating research. Recently, research evaluation has crept toward statistical power playing that role. The recent emphasis on power has been heavily based on links between power and literature-wide false findings identified through FFR calculations (i.e., calculations that treat each study as independent and occurring in parallel to every other study in the analysis). However, such FFR calculations are based on strong assumptions that are unlikely to be met in practice. Even if one assumes that the assumptions hold, the calculations themselves do not support a general and strong influence of statistical power on the FFR. Using similar calculations to examine longitudinal belief updating or to evaluate the strength of evidence across a set of studies each suggests less of a role for statistical power. Each approach also lessens concerns about sets of studies being likely to introduce false findings into the psychological literature. We do not claim that the belief updating or study set analyses should simply be inserted in the place of power calculations, although the longitudinal and study set analyses rely on assumptions that are less likely to be violated in practice. Rather, we believe that the recent overemphasis on statistical power should be replaced by a broader approach in which statistical and conceptual forms of validity are considered together (Fabrigar et al., 2020; Finkel et al., 2017).
If reviewers, editors, or commentators wish to critique research based on links between statistical power and false findings, they will have to confront the likely assumption violations, such as studies accumulating at different rates for true versus false initial findings. More generally, they must construct a compelling argument that necessary conditions in the FFR calculations hold in the context addressed by the research being evaluated. If compelling arguments linking the FFR calculations to the particular research context cannot be made, then the potential for false findings should not form the basis of one’s research evaluation in that situation.
Study sets are likely to include studies that fail to reach significance, especially early in a research program’s trajectory. Yet, the study set could strongly support the effect and conflict with null or opposite effects even when each study in the set has only moderate power and, therefore, only a portion of the studies individually reach significance. It can only help our science for researchers to better understand the variability in results that would be expected across studies when examining a true effect (see also Hedges & Schauer, 2019; Kenny & Judd, 2019; Stanley & Spence, 2014). Researchers have sought to reduce that variability by increasing power (especially by increasing sample size). However, doing so also has potential costs. Putting more research resources into any one study naturally constricts the number of studies that can be conducted (with possible negative consequences for construct validity). Making larger scale data collection feasible can also require sacrifices in other dimensions, such as moves to online data collection restricting the types of manipulations and measures that can be used (see also Anderson et al., 2019; Fabrigar et al., 2020). A focus on “highly powered” (large sample) designs also places greater “pressure for success” on those studies. If a grant supports a single large study instead of multiple smaller studies, for example, the entire “success” or “failure” of that grant rests on the results of that one study. The motives that presumably underlie researchers’ uses of questionable research practices (Simmons et al., 2011) are only likely to be enhanced in such settings. When a program of research consists of multiple smaller studies, however, the pressure for any one of them to “succeed” is lessened, especially if reviewers and editors are open to compelling empirical cases that include both significant and nonsignificant studies.
The current discussion might also prompt more careful consideration of the potential prior probabilities of the null and alternative hypotheses. In doing so, evaluators might consider the strength of related theory and past evidence related to the effect of interest, any previous data and theory linking the employed operationalizations to the construct(s) of interest, and the extent to which previous data and theory might suggest limits of the effect depending on psychological characteristics of the study participants or context in which the study is undertaken (see also Schaller, 2016). Of course, when expanding considerations to include theory, links between operations and constructs, and potential facilitating versus limiting conditions, one has implicitly expanded considerations to forms of validity other than statistical conclusion validity (see Fabrigar et al., 2020; Finkel et al., 2017). In research evaluation, statistical issues are neither separate nor preeminent over other validity-related considerations. The issues are intertwined and often inseparable.
Many pleas for attention to statistical power have not been direct calls to use perceived levels of power to evaluate completed research. Like many of those commentators, we continue to see value in the prestudy exercise of statistical power calculations for the purposes of considering alternative designs, manipulations, measures, and tests. Problems with overuse of power arise when (a) the prestudy concept of power is used retrospectively to evaluate completed research and (b) when attention to individual study power distracts from the evidence in the set of studies as a whole. A fuller understanding of these issues can only help to improve the quality of research evaluation moving forward.
Supplemental Material
sj-docx-1-psp-10.1177_01461672211030811 – Supplemental material for Evaluating Research in Personality and Social Psychology: Considerations of Statistical Power and Concerns About False Findings
Supplemental material, sj-docx-1-psp-10.1177_01461672211030811 for Evaluating Research in Personality and Social Psychology: Considerations of Statistical Power and Concerns About False Findings by Duane T. Wegener, Leandre R. Fabrigar, Jolynn Pek and Kathryn Hoisington-Shaw in Personality and Social Psychology Bulletin
Footnotes
Declaration of Conflicting Interests
The author(s) declared no potential conflicts of interest with respect to the research, authorship, and/or publication of this article.
Funding
The author(s) received no financial support for the research, authorship, and/or publication of this article.

Supplemental Material
Supplemental material is available online with this article.
Notes
References
Supplementary Material
Please find the following supplemental material available below.
For Open Access articles published under a Creative Commons License, all supplemental material carries the same license as the article it is associated with.
For non-Open Access articles published, all supplemental material carries a non-exclusive license, and permission requests for re-use of supplemental material or any part of supplemental material shall be sent directly to the copyright owner as specified in the copyright notice associated with the article.
