
Abstract
The 2024 U.S. presidential election seemed to have the potential to profoundly impact the national economy, financial markets, and geopolitics. Did Donald Trump’s re-election influence Americans’ psychology as well? We conducted a 7-wave longitudinal survey tracking N = 623 Americans (36% male, Mage = 45.05 years (SDage = 22.97) from 3 weeks before the election to 16 weeks after. As the election results came in, Democratic supporters reported a decrease in well-being, optimism and personal control, lower institutional trust, higher cynicism, more experiences of disrespect, and a stronger conspiracy mentality—changes that persisted up to 4 months post-election. In contrast, Republican supporters experienced changes in the opposite direction, effectively reversing the previously observed liberal advantage in institutional trust and diminishing the liberal–conservative gap in other psychological outcomes. These results challenge the notion of inherent psychological differences between liberals and conservatives, highlighting how such differences can shift depending on which party holds power.
Introduction
The 2024 U.S. presidential election seemed to have the potential to profoundly impact the national economy, financial markets, and geopolitics. Did Donald Trump’s re-election influence Americans’ psychology as well and, if so, in what ways? Press reports of rising depression, anxiety, and distress among liberal Americans were deemed comparable to the 9/11 attack shock (Campanile, 2025). Can a presidential election evince such psychological consequences? Could it predict enduring changes in psychological outcomes, such as beliefs about the self, society, and the world? Existing empirical studies on well-being after electoral wins and losses show mixed findings, with some studies pointing to negative well-being consequences among partisan losers, 1 whereas other studies suggesting that people’s well-being barely changes in response to election results (Dolan et al., 2008; Lench et al., 2019; Simchon et al., 2020).
We conducted a 7-wave longitudinal survey tracking an ideologically balanced sample (quota sample with 50% Democrat and 50% Republican supporters) of Americans across the 2024 U.S. presidential election, from 3 weeks before the election to 16 weeks after. We tested both short- and long-lived changes in a broad set of psychological outcomes, including affective reactions, life satisfaction, meaning in life, and what one believes about the self (self-views: self-esteem, optimism, control beliefs) as well as how one thinks about society and the people in it (worldviews: cynicism, conspiracy beliefs, institutional trust, experiences of disrespect in social interactions).
Psychological Well-Being in the Election Context
With rising partisanship and political polarization (Iyengar et al., 2019; Reiljan, 2020), it is easy to imagine how one’s party win or loss can impact party supporters’ psychology. Social identity and self-categorization theories suggest that belonging to a group can shape one’s psychology by integrating group membership into a sense of self (Tajfel et al., 1971; Turner & Reynolds, 2012). Hence, a group's political defeat or victory can be experienced as personal setbacks or triumphs, impacting well-being at the individual level. Furthermore, partisan winners and losers likely anticipate beneficial or adverse policy changes, contributing to changes in well-being.
Despite these theoretical considerations, empirical studies comparing the well-being gap in partisan winners and losers have produced mixed, sometimes contradictory, findings. For example, one study in Japan (Tsutsui et al., 2010) and two longitudinal studies in the Netherlands and United Kingdom (Dolan et al., 2008; Toshkov & Mazepus, 2023) found no significant changes in happiness, affect, or life satisfaction among partisan winners and losers following national elections. In contrast, following the 2016 U.S. election, studies reported increases in depression-related searches, antidepressant use, and poor mental health days in Democratic-leaning states (Simchon et al., 2020; Yan et al., 2021). Self-report data also showed lower life satisfaction and affective well-being among partisan losers after United States, South Korean, and Japanese elections (Cha et al., 2024; Kinari et al., 2019; Lench et al., 2019; Pinto et al., 2021).
Besides somewhat mixed findings, most research on election outcomes and well-being focuses only on hedonic aspects, overlooking eudaemonic well-being like meaning in life. Losing may reduce meaning by undermining perceived significance (Martela & Steger, 2016), yet adversity can also foster meaning-making and personal growth (Park, 2010). Negative events may prompt reflection and understanding, possibly increasing both the search for and experience of meaning among partisan losers (Vohs et al., 2019).
Given that the same event can decrease hedonic but increase eudaemonic well-being (Tran et al., 2025), we adopted a comprehensive view of well-being, examining partisans’ trajectories in life satisfaction, positive and negative affect, as well as the presence and search for meaning in life across a pivotal and highly consequential election.
Beyond Psychological Well-Being: Self-Views and World-Views in the Election Context
High-profile election outcomes might have broad psychological effects that extend beyond well-being, affecting how individuals view themselves and the society they live in. Yet, in the realm of political events, worldviews, such as cynicism, institutional trust, and conspiracy beliefs have been seen as causal factors shaping people’s political views and behaviors (e.g., voting; Jolley et al., 2022), while the potential of political events to serve as catalysts for changes in these variables remains largely unexplored. We therefore adopted a broad perspective on personality, focusing on the mid-level units of personality (Buss & Cantor, 1989; McAdams & Pals, 2006): self-views (self-esteem, optimism, and personal control beliefs) and societal views (cynicism, perceptions of disrespect, conspiracy beliefs, and institutional trust).
Electoral Outcomes and Views of the Self
Aligning with the losing (vs. winning) party could trigger shifts in self-views in several ways. First, a loser identity might spill over on how people see themselves, lowering their self-esteem (Miller, 2009). Second, observing one’s preferred party lose may lower optimism by worsening views of one’s own future. Third, electoral outcomes might result in changes in personal control beliefs (Lachman, 2006). An electoral loss signifies that one’s hopes—and potentially the corresponding efforts, such as casting a vote—have not materialized, leading to a diminished sense of personal agency and the perception of being subject to the will of others, including political adversaries. Note that while there is correlational evidence of a negative association between identification with the winning or losing party and self-views (self-esteem [Oc et al., 2018], optimism [Toshkov & Mazepus, 2023], and control beliefs [Greenaway, 2023]), studies tracking changes in self-views from before to after the election are lacking.
Electoral Outcomes and Views of the Society
Besides affecting self-views, an electoral loss (vs. win) might change how people view and experience their immediate social world. An electoral loss can signal that one’s political preferences are incongruent with the dominant public consensus, which might give rise to feelings of alienation and distrust. In an election context, a recent Chilian study found that partisan losers reported a weaker belief in one’s citizens’ trustworthiness and integrity than partisan winners (Bargsted & González-Ide, 2024). Becoming a partisan loser might also shape how one experiences social interactions. For example, Donald Trump’s (2016) election was associated with heightened perceptions of discrimination among underrepresented minorities who were at the receiving end of the new government’s hostile rhetoric (Garrison et al., 2018; Gorzig & Rho, 2022; Roche & Jacobson, 2019).
Drawing from these literatures, we tested whether support of the eventual election winner and loser in the 2024 U.S. presidential election was associated with shifts in how people viewed and experienced their social world. Specifically, we investigated the effect of an electoral loss (vs. win) on two indicators of sociopolitical worldviews: institutional trust, defined as the confidence that people place in institutions, such as democracy, media, and the government (Spadaro et al., 2020), and conspiracy mentality, defined as the tendency to interpret political decisions and other events as resulting from secret, malevolent plots orchestrated by political elites (Bruder et al., 2013; Douglas et al., 2017). We measured two indicators of broader views on human nature and social experiences: cynicism, defined as a worldview characterized by a deep-seated assumption that people are inherently egoistic and that their actions are primarily driven by self-interest (Stavrova & Ehlebracht, 2016), and experiences of disrespect, defined as the perception of being denied the dignity one deserves simply by virtue of being human (Stavrova et al., 2020).
Asymmetric Effects and Psychological Adaptation
Do losses loom larger than gains when it comes to electoral outcomes? In other words, do partisan losers experience larger psychological changes in response to election results than partisan winners? Also, if electoral outcomes affect people’s psychology, are such changes long-lasting or do they dissipate quickly?
A large literature demonstrates that negative experiences exert a bigger impact on psychological states than positive experiences of equal intensity (Baumeister et al., 2001). Another influential behavior account, prospect theory, similarly expects larger changes to occur as a result of losses rather than gains (Kahneman & Tversky, 1979), a prediction that could potentially be extended to election outcomes.
Another question is the duration of psychological changes in response to election outcomes. Two influential accounts suggest that reactions—at least affective ones—to electoral losses and wins might not be particularly enduring. Both the model of hedonic adaptation (Diener et al., 1999; Suh et al., 1996) and the set-point theory of well-being (Lykken & Tellegen, 1996) propose that people tend to revert to their baseline level of well-being following positive or negative events. At the same time, a strong body of research tracking well-being (mostly life satisfaction and affect) among thousands of people for years before and after important life events (i.e., divorce, unemployment, parenthood) revealed that while adaptation does happen, it is often not complete, varies in time course, and may depend on the life event one experiences (Lucas, 2007a, 2007b; Lucas et al., 2004).
Together, these theories suggest that the effect of election outcomes is likely asymmetric, such that partisan losers will experience a stronger change in psychological reactions to the election outcomes than partisan winners. This change might be rather short-lived, followed by a return to the pre-election levels. Testing these predictions requires longitudinal data tracking the same individuals across the election cycle, from before to after the election—though such studies are rare.
The Present Research
The present research tracked pre–post changes from before and after the 2024 U.S. presidential election, studying a broad set of psychological outcomes, including affective, cognitive, and eudaemonic aspects of well-being, beliefs about the self (self-views: self-esteem, optimism, control beliefs) and beliefs about the society (worldviews: cynicism, conspiracy beliefs, institutional trust, experiences of disrespect in communal interactions). We conducted a 7-wave longitudinal survey of a politically balanced U.S. sample (50% Democrat, 50% Republican) from 3 weeks before to 16 weeks after the election. This design allowed us to test whether the election outcome had asymmetric effects, impacting partisan losers more than partisan winners, and identify the timing of the potential adaptation with respect to both hedonic outcomes as well as broader dimensions of well-being, beliefs about the self, the society, and the world.
Transparency and Openness
The data collection has been preregistered (https://osf.io/hs5fj/overview, https://osf.io/y78h9/overview, https://aspredicted.org/7vx7-cndq.pdf, https://aspredicted.org/8v3k-5f8y.pdf). The research questions and the analysis plan have been preregistered separately: https://osf.io/g2ncy/overview. We did not deviate from our preregistered plans, with one exception concerning the analytic strategy. (More details are provided below.) The data, study materials, and analyses scripts are available at https://osf.io/edvrc/overview. We report how we determined our sample size, all data exclusions (if any), all manipulations, and all measures in the study. The study has received ethics approval from the Ethics Review Board of the University of Lübeck.
Method
Participants
Participants were U.S. residents older than 18 years recruited on Prolific. For Wave 1 (3 weeks before the election), we requested 750 participants using a quota sampling method based on political affiliation (50% Democrat, 50% Republican) and, as per preregistration, only invited the participants who had not voted yet. 2
Our sample size was based on budget considerations. We conducted an effect size sensitivity analysis to identify the smallest effect size that our sample could reliably detect with 80% power and α = .05 (two-tailed; Giner-Sorolla et al., 2019). We focused on the main effect size of interest for this research: the effect of the electoral loss versus win, expressed as the difference between the pre-election slope for Democratic and Republican supporters (i.e., pre-event linear term × partisan status interaction). We performed individual sensitivity analyses for each outcome variable, using 1,000 simulations with the SIMR package (Green & MacLeod, 2016). We examined a range of effect sizes, beginning with the one observed in the current data and increasing them incrementally until achieving 80% power. The results showed that, depending on the outcome variable, the smallest detectable difference between pre-event slopes for Democratic and Republican was |.15|. An overview of the smallest detectable effect sizes for each outcome variable is shown in SOM.
At wave 1, N = 747 completed the survey. And N = 515 completed the final wave (Wave 7), constituting a 69% retention rate. Stayers did not significantly differ from drop-outs in voting behavior, political ideology, or other sociodemographics (with the exception of age: dropouts were slightly younger; see Supplemental Table S11). As per the preregistration, we excluded one participant who failed the attention check (“To monitor data quality, please select the middle of the scale here”) and nine participants who provided inconsistent information on their gender and ethnicity between wave 1 and wave 2. Wave 3 participants (N = 632; 85% of wave 1) completed measures of voting behavior and whether they voted for the Democratic or Republican candidate (which would become the indicator of winning vs. losing partisan support). As these measures are central for our main analyses, N = 623 constituted our main analytic sample. Of those, 36% were male, Mage was 45.05 years (SD = 22.97), 72% were White/Caucasian, 15% were Black/African American, and the remaining participants were Hispanic, Asian, Native American, other, or preferred not to say. Most participants had an undergraduate (40%) or a high school degree (26%), 13% were currently attending college, and 15% had a Master’s degree. Most participants (70%) were full- or part-time employed, 11% were unemployed, and the rest were students, housekeepers, or other. Participants’ average yearly household income was between $50,000 and $74,999. The sample consisted almost entirely of voters, as 96% of participants indicated that they voted in the election. Of those, 49% voted for Donald Trump, 45% voted for Kamala Harris, 2% voted for a third candidate, and 4% did not provide an answer.
Procedure
The study comprised 7 measurement points, starting 3 weeks before the election (October 15, 2024) and ending 1 month after inauguration (February 20, 2025), covering about 20 weeks in total. An overview of measurement points and respective sample sizes are presented in Figure 1. All wave 1 participants were invited to take part in each of the following waves. At each wave, participants were given 1 week to complete it, with the exception of wave 2. Participants were invited to wave 2 on the election day (November 5) after the polls closed, based on their recorded state of residence and corresponding time zones. This was to ensure that any participant who voted on the day of the election has voted by the time they received the invitation. The wave 2 survey was closed once the election was called early November 6 and the wave 3 survey was launched 4 hr later.
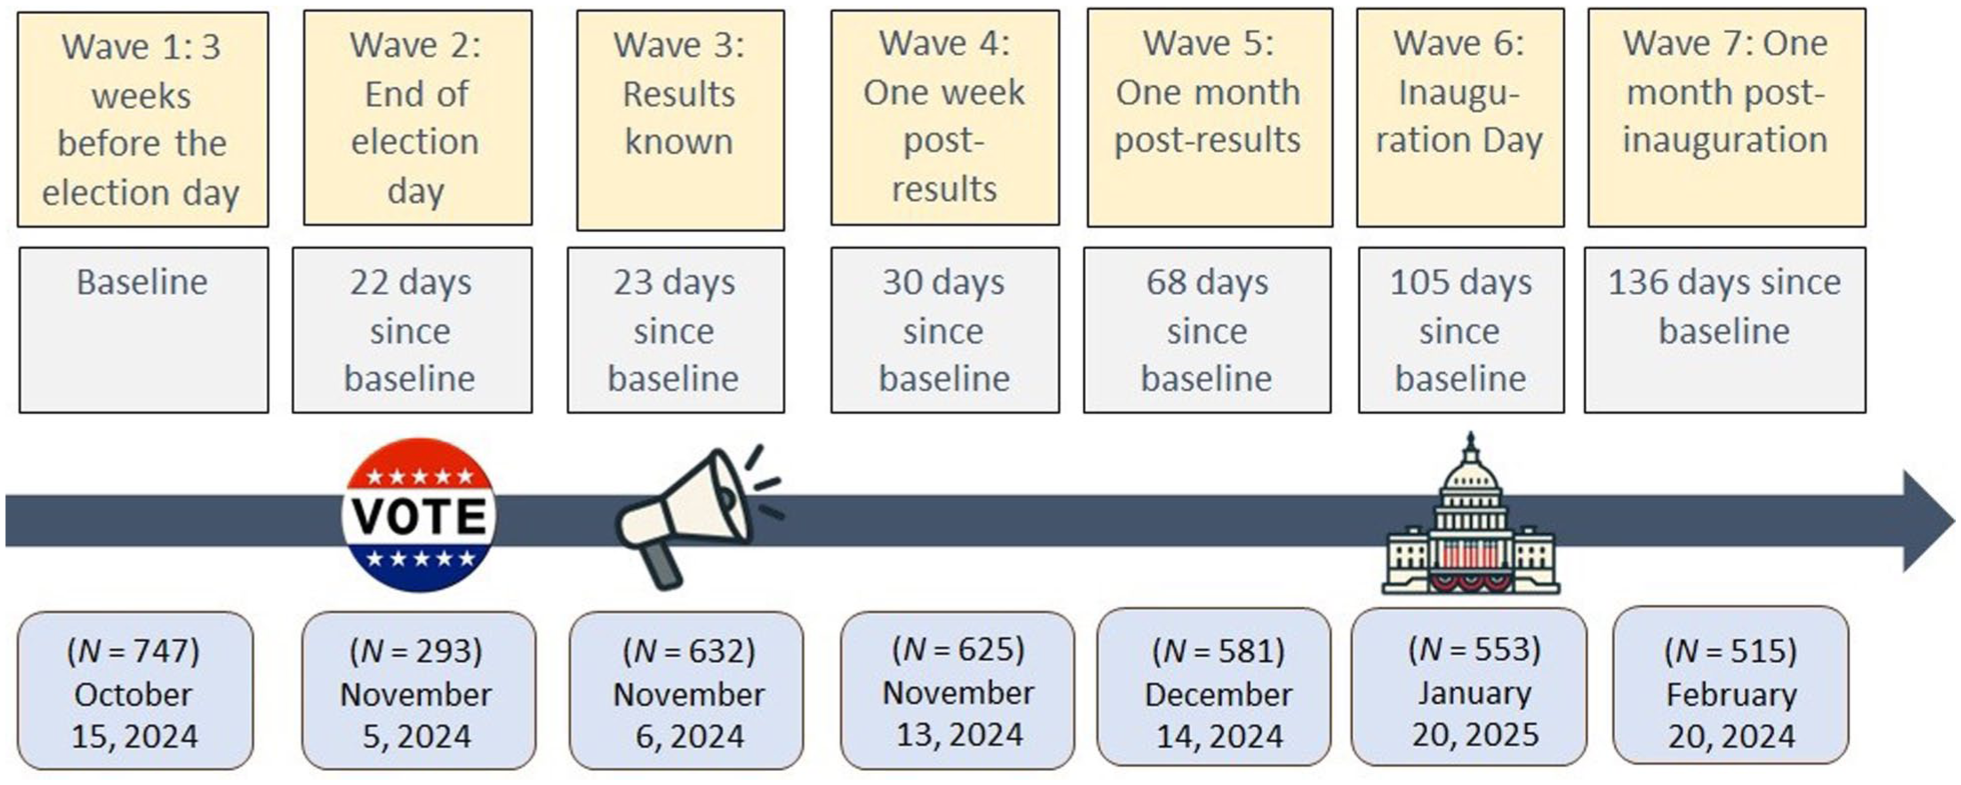
Study design and sample size.
Measures
In each wave, participants completed the same measures. Participants were asked to take a moment to think about their life and indicate their agreement with a battery of statements. The measures included: (a) psychological well-being: life satisfaction (Cheung & Lucas, 2014), and the search and presence of meaning in life (Steger et al., 2006), positive and negative emotions; (b) self-views: self-esteem (Robins et al., 2001), optimism, and personal control (two items from Lachman & Weaver, 1998); and (c) views and experiences of the world: cynicism (Rosenberg, 1957; Stavrova & Ehlebracht, 2016), experiences of disrespect (Stavrova et al., 2020), conspiracy mentality (Bruder et al., 2013), and institutional trust (Spadaro et al., 2020). Item wording, response options, and reliabilities are summarized in Table 1.
Overview of Psychological Outcome Measures.
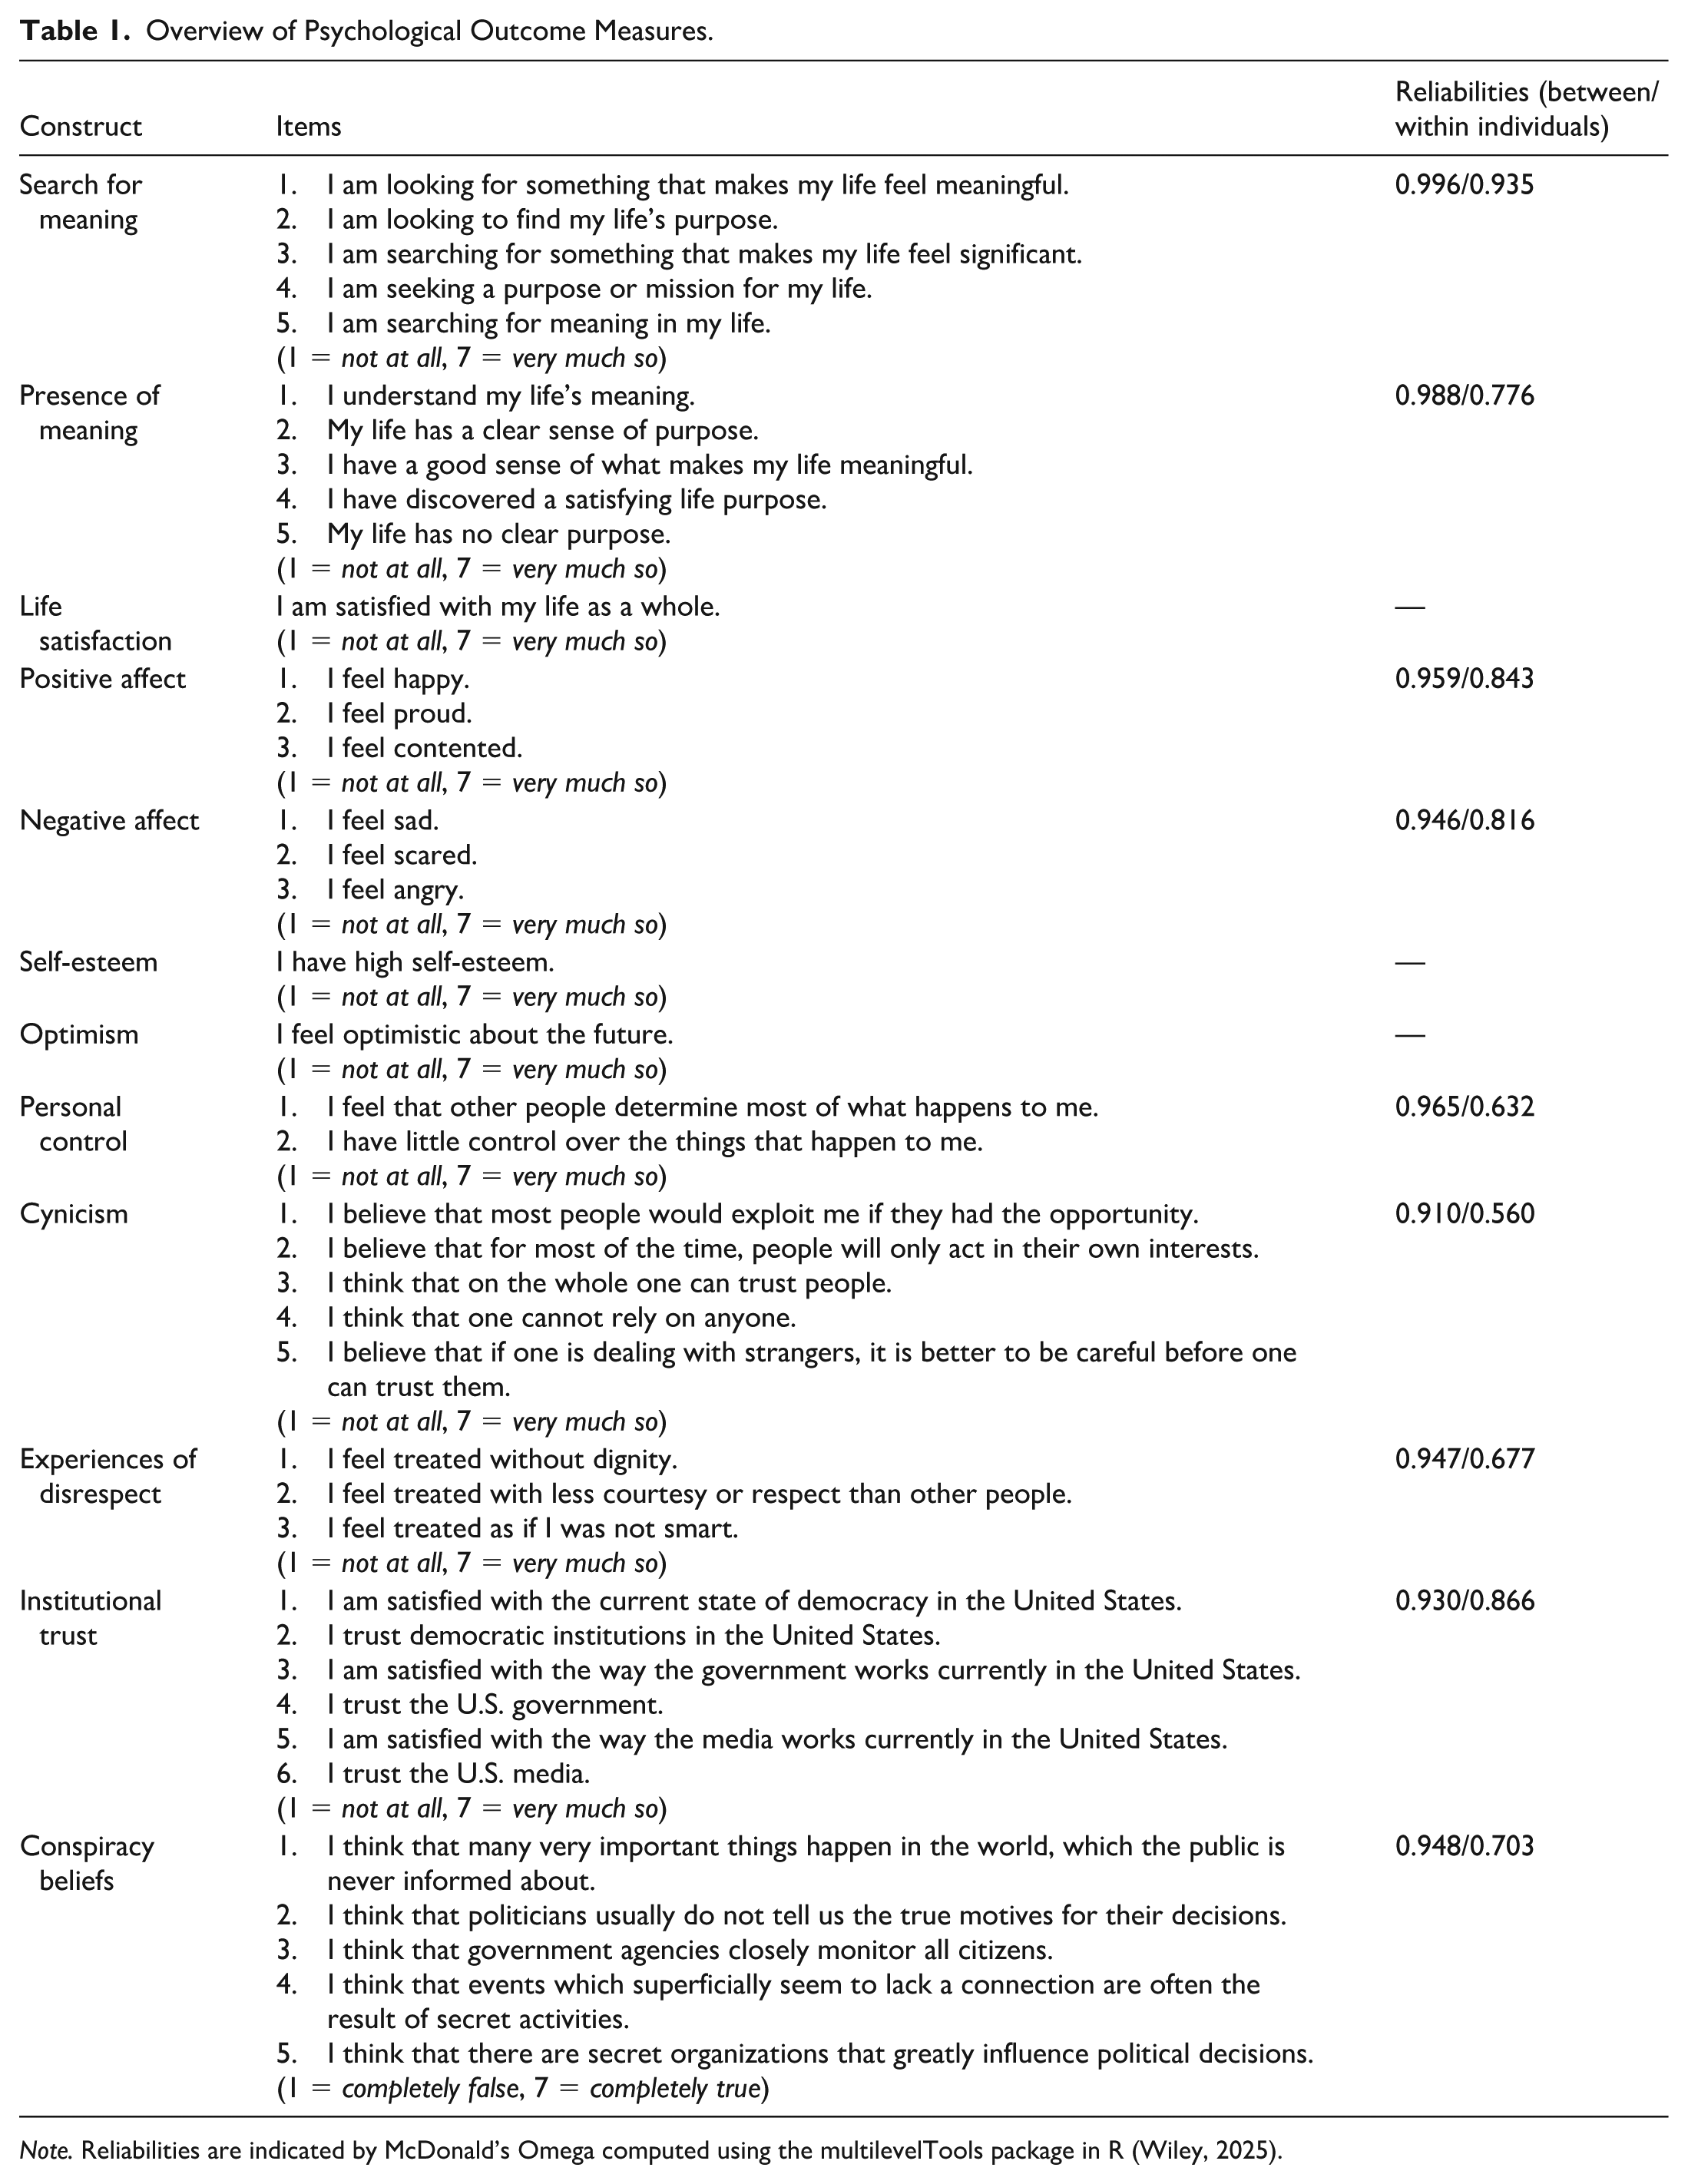
Note. Reliabilities are indicated by McDonald’s Omega computed using the multilevelTools package in R (Wiley, 2025).
We operationalized partisan loser versus winner status using two measures: voting behavior and political ideology. At wave 2 (Election day) and wave 3 (after election results announcement), participants indicated whether they had voted (yes vs. no) and, if yes, which presidential candidate they voted for: Harris, Trump, or a third-party candidate. We used participants’ wave 3 responses due to a higher participation rate in this wave. Participants’ partisan status variable was coded based on whether the respondent supported the winning or the losing candidate: 0.5 = supported the winning candidate (voted for Trump), −0.5 = supported the losing candidate (voted for Harris or a third-party candidate 3 ). This measure was only available for participants who had voted (96% of the sample).
To measure political ideology, we used the following item: “How would you describe yourself politically? (1 = extremely liberal, 10 = extremely conservative)” (included in wave 1) that was available for all participants (both voters and non-voters). Higher values on this variable indicate a stronger support for the winning candidate. As the results using either one of these indicators of partisan winner versus loser status were nearly identical, in the main text, we report the results of the analyses using the voting behavior in detail and briefly summarize the results of the analyses using political ideology.
At the end, participants provided basic sociodemographic information (only at wave 1 and wave 2). The study included further measures that were not intended to be used in the present project, as indicated in the preregistration (https://osf.io/g2ncy/?view_only=4b162a3d1d8a477489b9aab273bfec9c). These measures are listed in the study materials on the project’s osf page.
Analytic Strategy
We sought to determine whether there was a significant change in psychological outcome variables from baseline to immediately after election results were announced, as well as in the follow-up months, depending on partisan winner versus loser status. We adopted a discontinuous time modeling approach from the literature on the effects of life events on well-being and personality development (Denissen et al., 2018; Stavrova et al., 2023). In that, we deviated from the preregistered analyses plans that specified segmented regression. Both approaches allow for partitioning time into segments (e.g., before vs. after the event, with a break-point at the time of the event) and provide estimates of separate slopes for each time segment. In discontinuous time modeling, the break-point (i.e., the timing of the event of interest—here, the election results being announced) is user-specified, while in segmented regression it is determined by the data. We decided in favor of discontinuous time modeling because the timing of the event of interest was known (wave 3, when the election was called) and because we realized that segmented regression was not suitable for estimating breakpoints while simultaneously accounting for the multilevel data structure and modeling interaction effects.
We estimated the effect of learning about the election results—the event that determined participants’ partisan winner versus loser status—on psychological outcomes, including the trajectory leading up to the event (anticipatory effect) and the trajectory following it (adaptation effect), depending on whether participants supported the winning candidate or a losing candidate. Since the data have a nested structure with measurement waves nested within persons, we included random intercepts for participants. Following the request of the editorial team, we additionally included random slopes for time variables. 4 While the survey invitations were sent at fixed times to all participants, there were slight differences in the exact timing of participants’ participation (with the exception of wave 2, participants were given 1 week to respond—see section “Procedure”). Therefore, we measured time in days since the baseline.
The models included the following slopes of time:
Pre-event trend (anticipatory effect): A time variable with negative values on all waves before the election results were called (e.g., wave 1, 22 days before the event = −22; wave 1, 21 days before the event = −21) and 0 on the wave when the event happened (wave 3) and all the following waves. The coefficient of this variable captures the linear change in the outcomes leading up to the event.
Post-event trend (adaptation effect): A time variable with a value of 0 on all waves preceding the event and positive values on the waves following the event (e.g., day of the event = 1, second day after the event = 2, 1 week after the event = 8). The coefficient of this variable reflects the linear change in the outcomes following the event.
For ease of interpretation, these time indicator variables were rescaled such that their coefficients indicate a predicted change in the psychological outcome per month (rather than per day).
As we were interested in the trajectories of participants who supported winning or losing candidates, the models included the interaction between these two time indicators (pre-event and post-event trends, uncentered, as both included a “natural” zero point) and partisan winner versus loser status (0.5 = support for the winning candidate/partisan winner, −0.5 = support for a losing candidate/partisan loser). For each outcome, we tested two models: Model 1 regressed the outcome on the two time indicators, partisan winner versus loser status and the respective interactions. To account for potential nonlinear developmental trends following the event (note that the relatively small number of time points before the event does not allow for estimates of nonlinear effects), in addition to the post-event linear trend, Model 2 included a quadratic post-event trend and the respective interactions with partisan winner versus loser status. For each outcome, we compared the model fit for Models 1 and 2 using the chi-square test and report the results of the best-fitting model.
To determine whether the adaptation was complete (i.e., participants returned to their baseline pre-event level) versus whether the election had a long-lasting effect, we additionally conducted a pointed pairwise comparison by comparing responses at wave 1 (pre-election baseline) to wave 7 (16 weeks after the election was called) among partisan losers and winners. For that, we regressed each outcome on wave (specified as a categorial variable), partisan loser versus winner status, and interactions between the two. We report the contrasts between wave 1 and wave 7, separately for partisan losers and winners. Furthermore, when the plotted trajectories suggested an earlier adjustment (before wave 7), we also tested additional contrasts (e.g., between wave 1 and this earlier time point). In case of multiple contrast tests, we used a Bonferroni adjustment.
Results
Descriptive Statistics
Table 2 presents zero-order correlations among the variables at key waves: wave 1 (baseline), wave 3 (election called), and wave 7 (end of observation period: 16 weeks post-election). At pre-election baseline, partisan winners (supporters of the Republican candidate) scored higher on the key indicators of well-being than partisan losers (supporters of the Democratic or other candidates): they reported more positive affect, less negative affect, higher life satisfaction, and higher presence (but not search) of meaning in life. This gap increased markedly at wave 3 (after results announcement) but showed a moderate decline by wave 7 (end of the observation period): for example, while the correlation between partisan winner (vs. loser) status and negative affect was relative weak before the election (r = −.13), it strengthened considerably immediately after the election (r = −.64) and then moderated to r = −.40 by 16 weeks post-election (wave 7).
Means, Standard Deviations, and Correlations With Confidence Intervals.
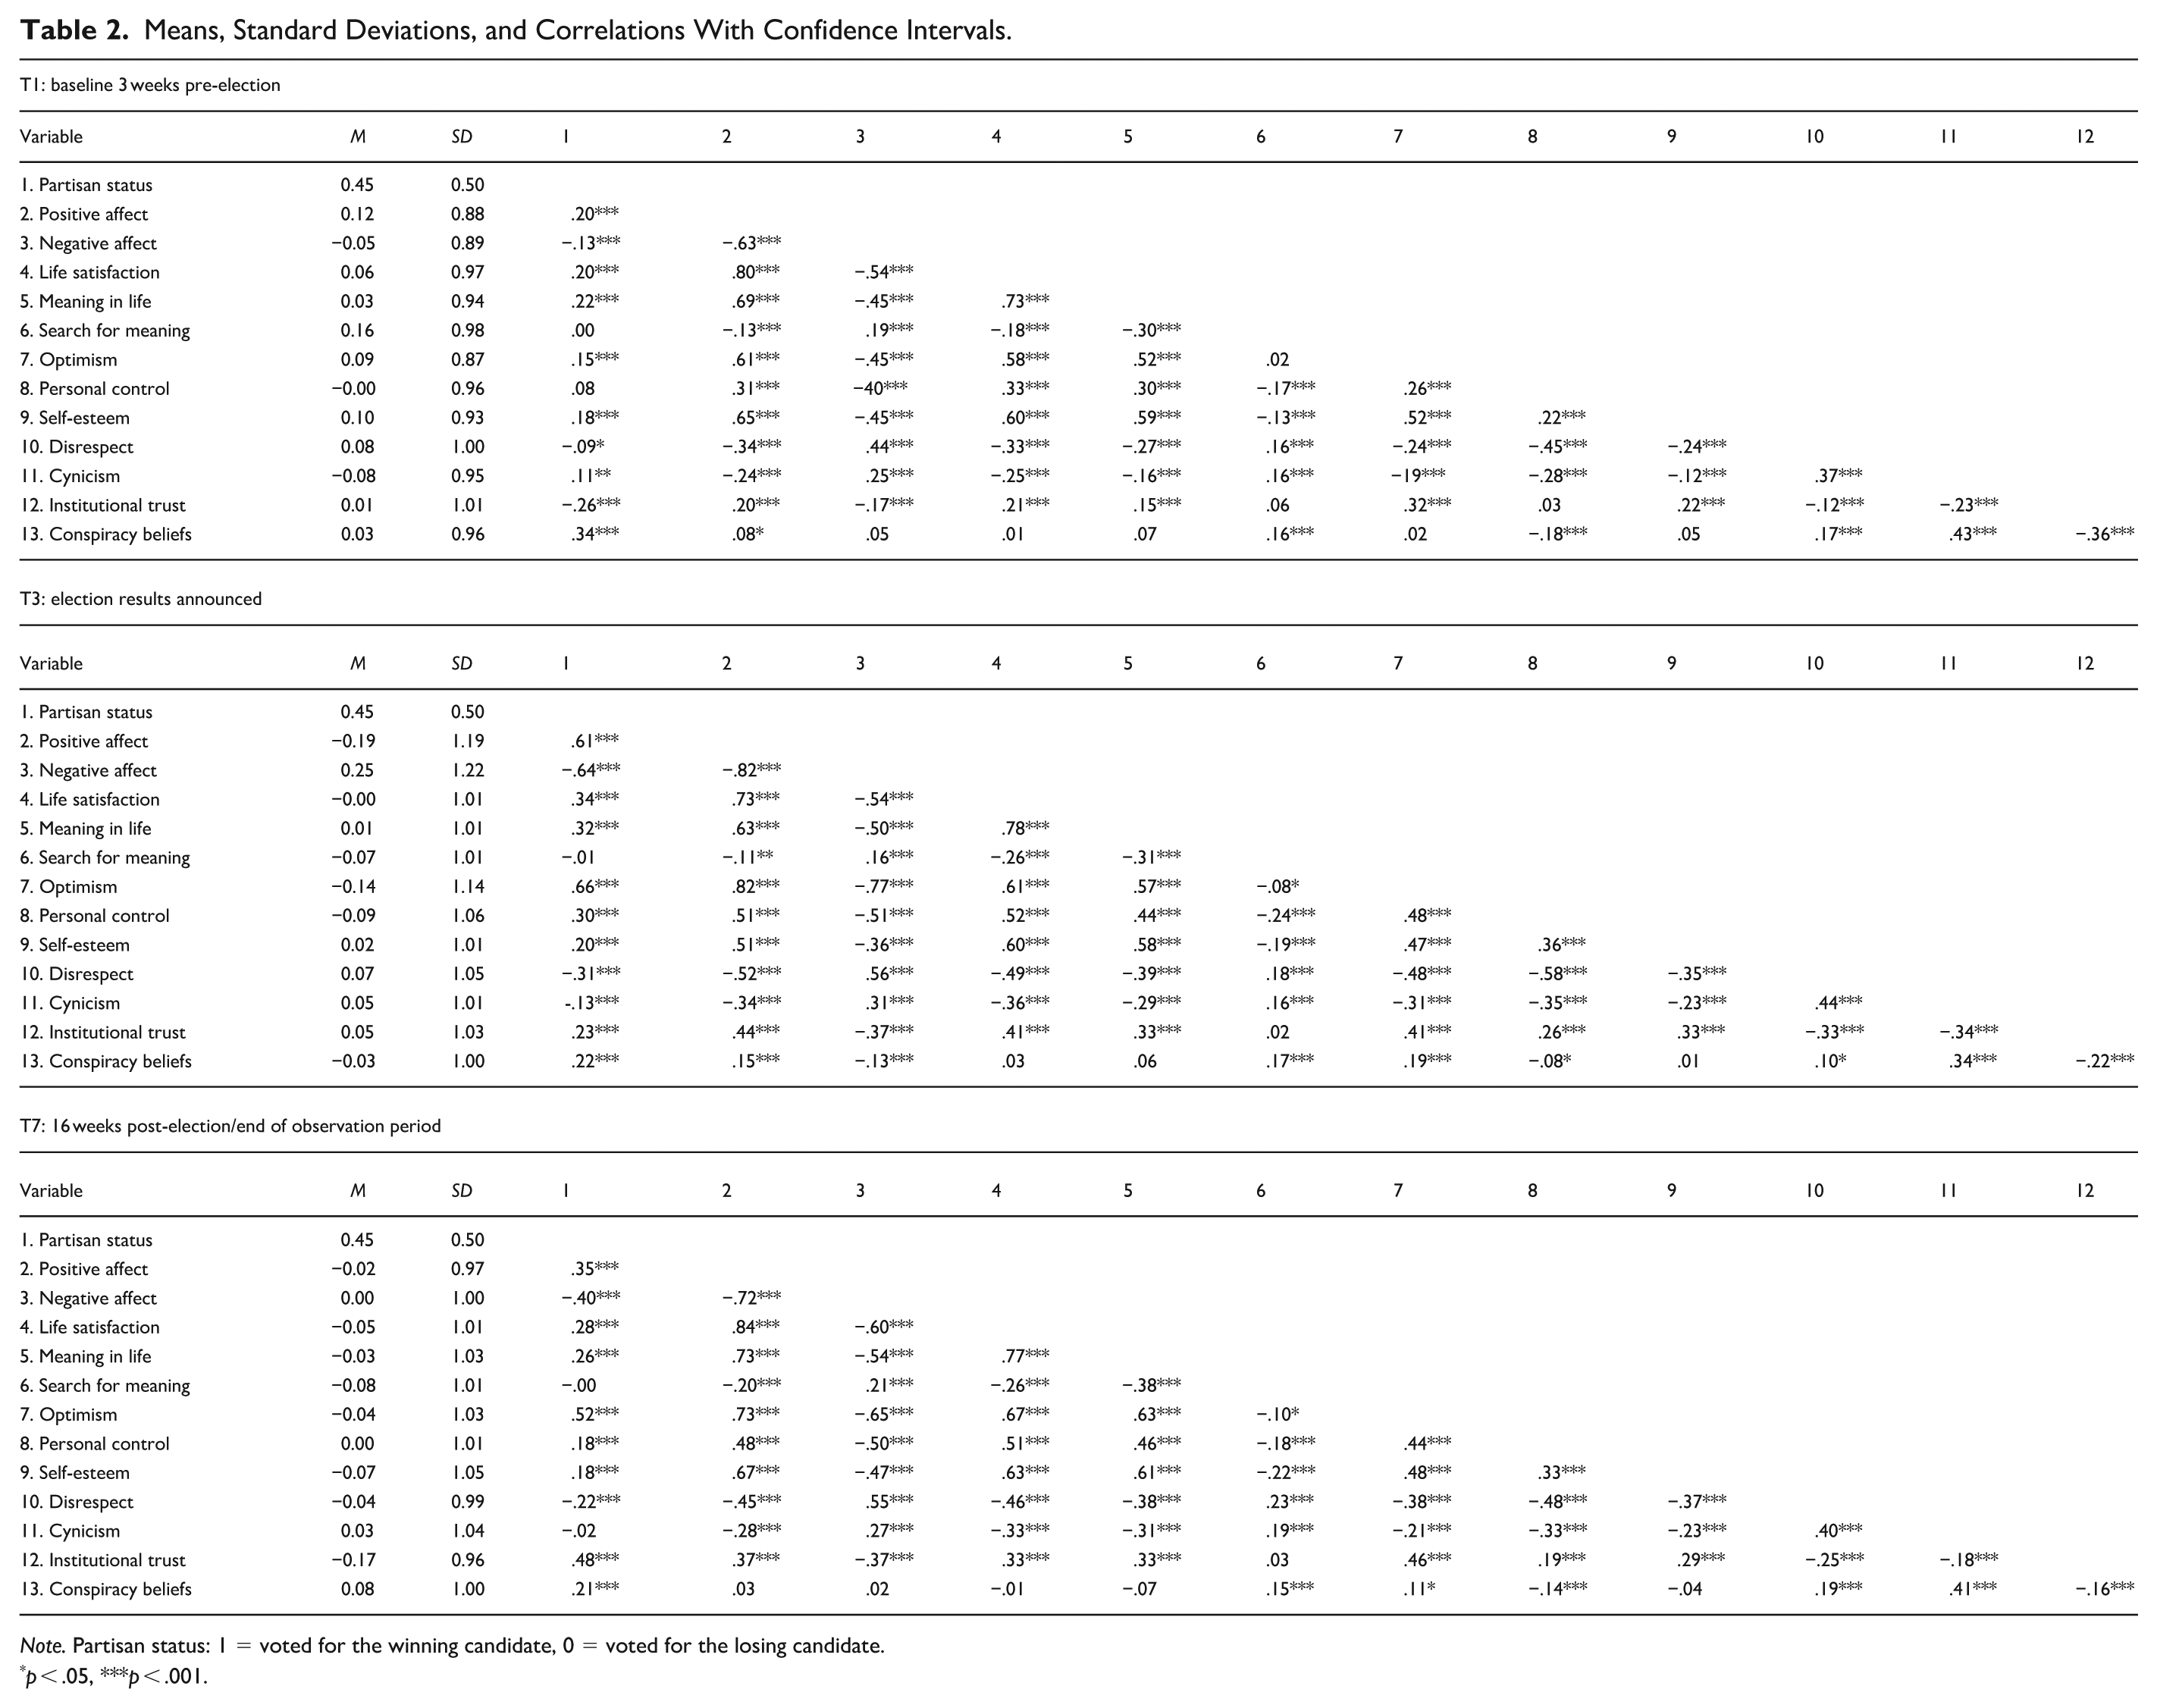
Note. Partisan status: 1 = voted for the winning candidate, 0 = voted for the losing candidate.
p < .05, ***p < .001.
We observed a similar pattern for indicators of self-views. At pre-election baseline, Republican voters (i.e., future partisan winners) reported slightly higher self-esteem and optimism (but not personal control) than Democratic and third-party voters (i.e., future partisan losers). Immediately after the election results became public, the gap in optimism and personal control between these two groups increased approximately fourfold (with Republican voters reporting more control and optimism) and slightly narrowed by wave 7. The gap in self-esteem stayed relatively constant across the transition to the new administration.
In terms of social views and experiences, Republican voters already (prior to the election) reported slightly lower levels of disrespectful experiences than Democratic and third-party voters—a difference that doubled by the time the election results were announced (wave 3). Despite feeling less disrespected by others, Republican voters reported higher degrees of cynicism than Democratic and third-party voters pre-election. This gap reversed in the aftermath of the election outcome announcement (wave 3) such that Democratic and third-party voters reported greater cynicism than Republicans, and disappeared in the 16 weeks thereafter (wave 7).
Similarly, the gap in institutional trust, with Democratic and third-party voters showing higher levels pre-election than Republican supporters, reversed at wave 3 and continued to widen in the following weeks, such that at wave 7 Republican voters showed a substantially higher institutional trust than Democratic and third-party voters (r = .48 at wave 7 vs. r = −.26 at wave 1). This change however did not translate into a respective change in conspiracy mentality: Republican voters nevertheless showed higher conspiracy beliefs than Democratic and third-party voters throughout the election, although this gap diminished somewhat after the election results were announced (from r = .34 to r = .22).
Discontinuous Time Modeling
Tables 3 to 7 present the results of the best fitting model for each outcome. For all outcomes except for life satisfaction and conspiracy mentality, the model including the nonlinear post-event term showed better fit. The outcome variables were standardized before analyses so that the coefficients can be interpreted as predicted change in outcome variables in standard deviations.
Discontinuous Change Models, Well-Being Outcomes: Positive Affect, Negative Affect, and Life Satisfaction.
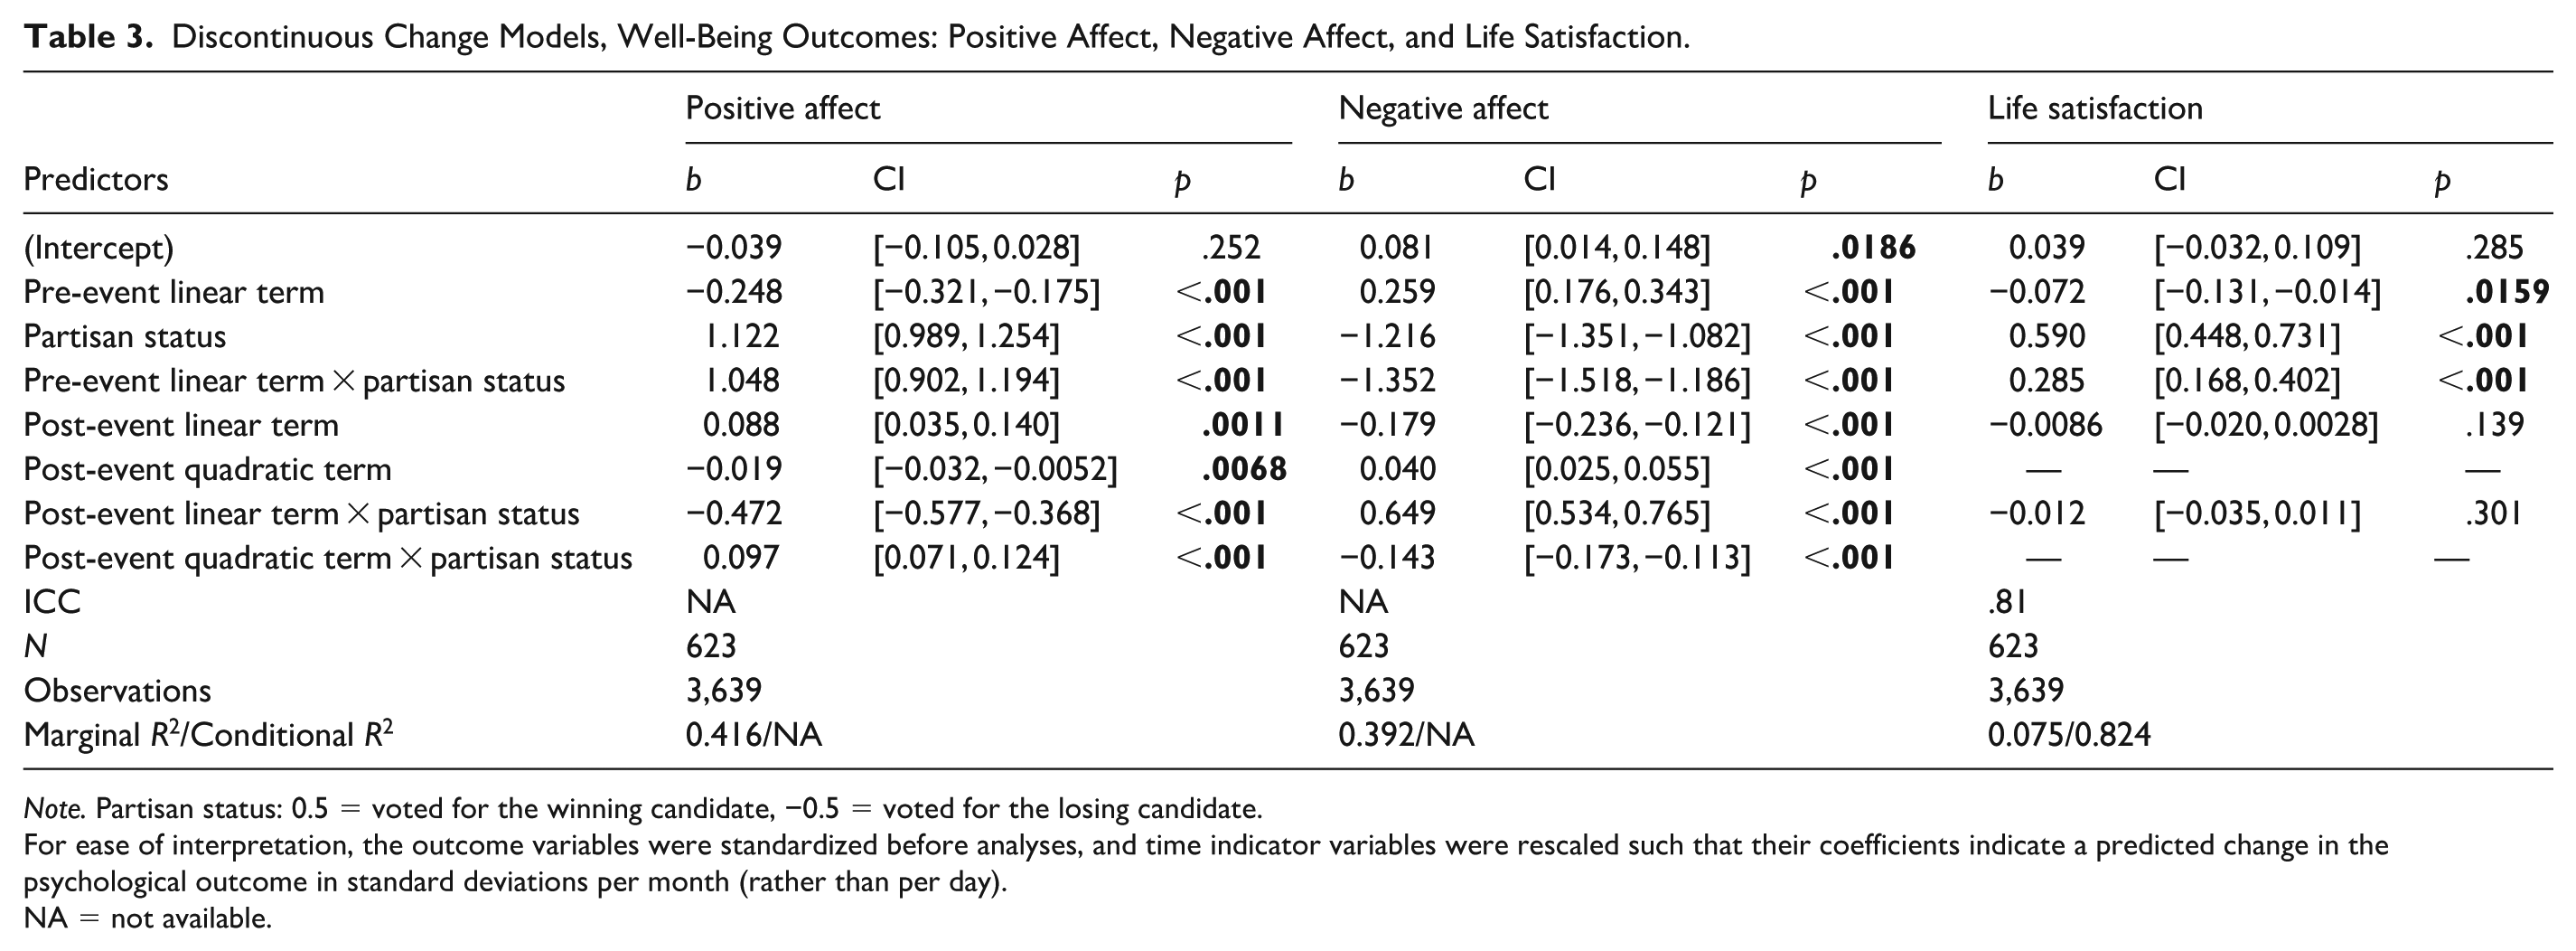
Note. Partisan status: 0.5 = voted for the winning candidate, −0.5 = voted for the losing candidate.
For ease of interpretation, the outcome variables were standardized before analyses, and time indicator variables were rescaled such that their coefficients indicate a predicted change in the psychological outcome in standard deviations per month (rather than per day).
NA = not available.
Discontinuous Change Models, Well-Being Outcomes: Meaning Presence and Meaning Search.
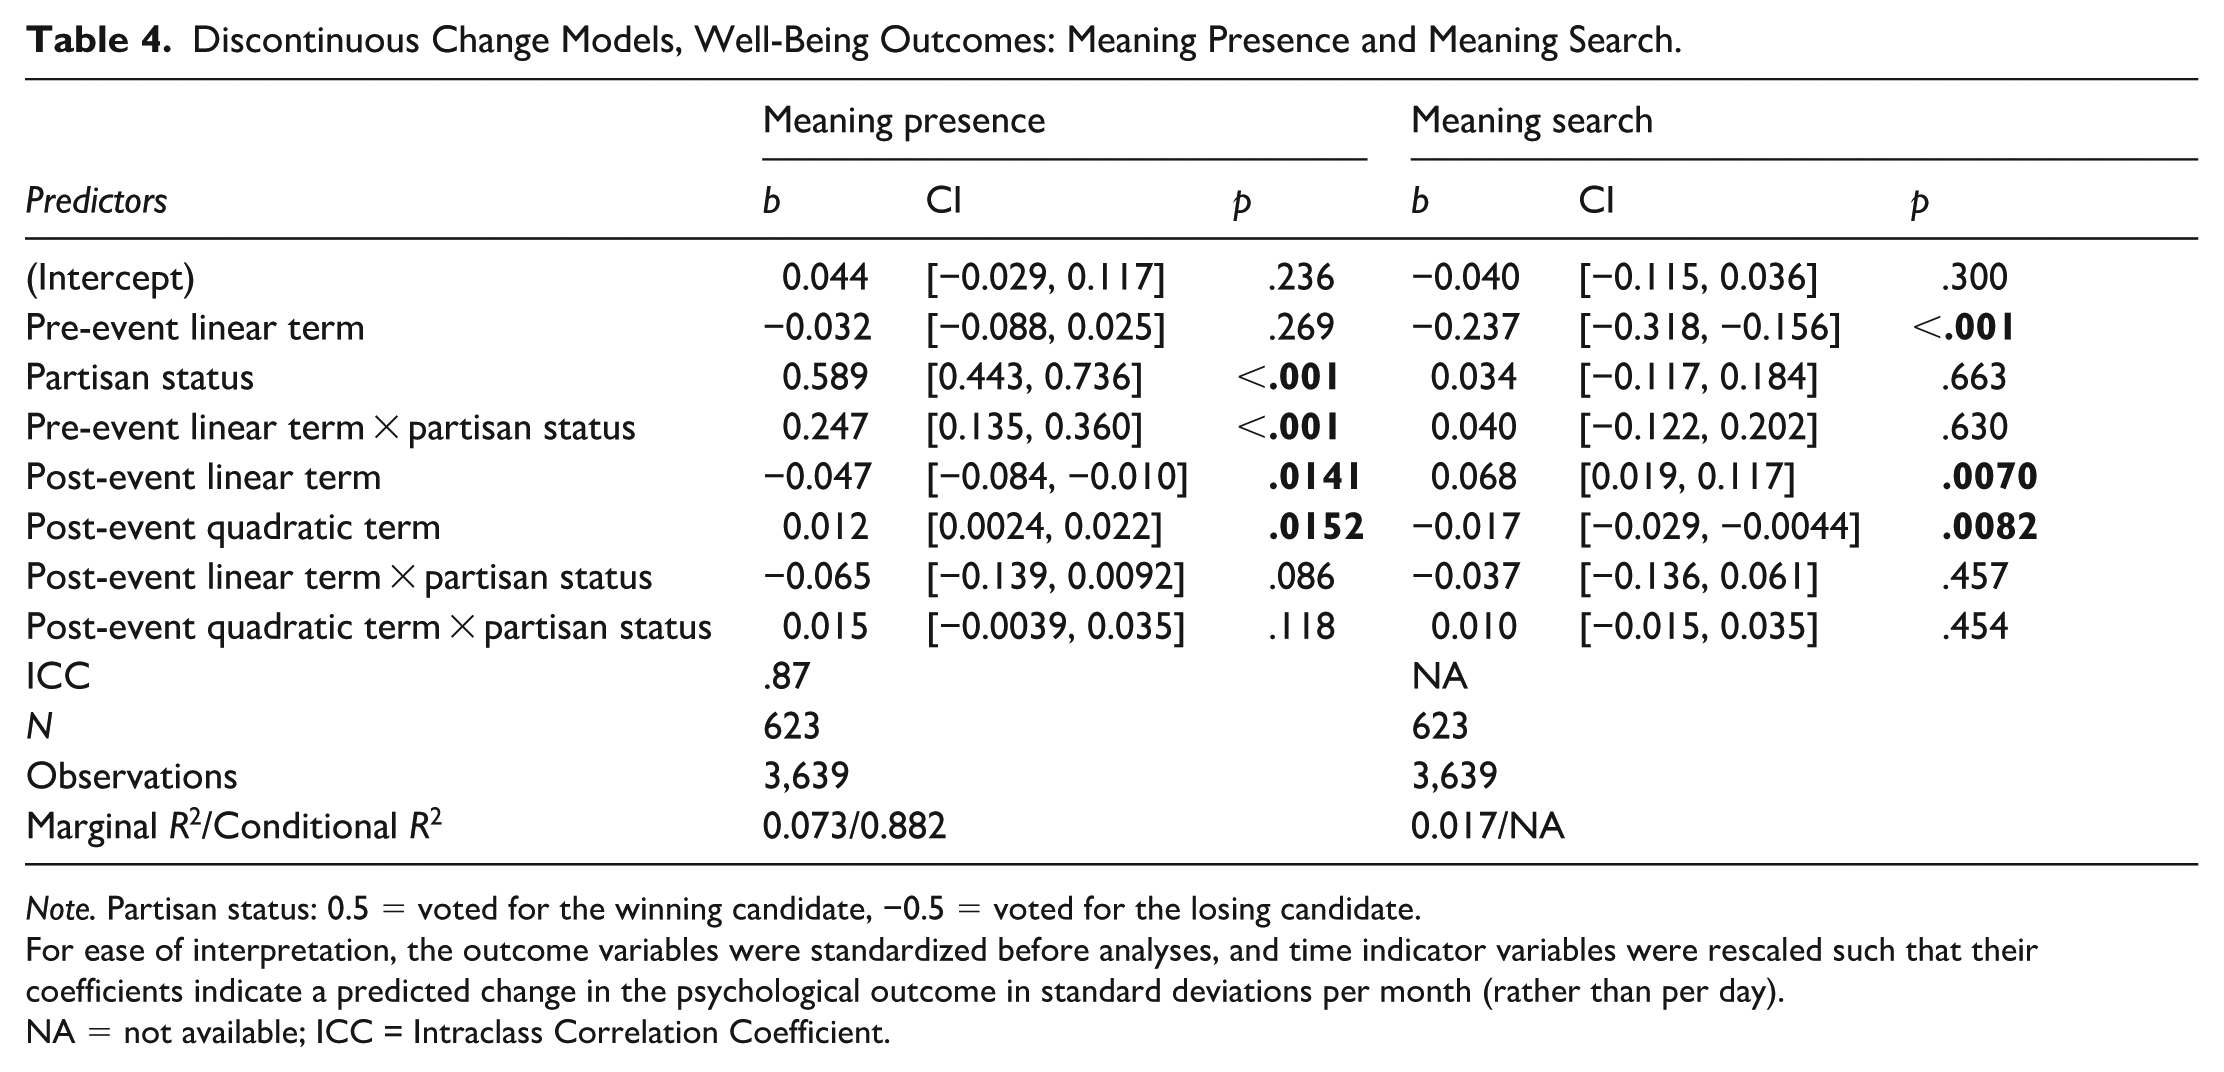
Note. Partisan status: 0.5 = voted for the winning candidate, −0.5 = voted for the losing candidate.
For ease of interpretation, the outcome variables were standardized before analyses, and time indicator variables were rescaled such that their coefficients indicate a predicted change in the psychological outcome in standard deviations per month (rather than per day).
NA = not available; ICC = Intraclass Correlation Coefficient.
Discontinuous Change Models, Self-Views.
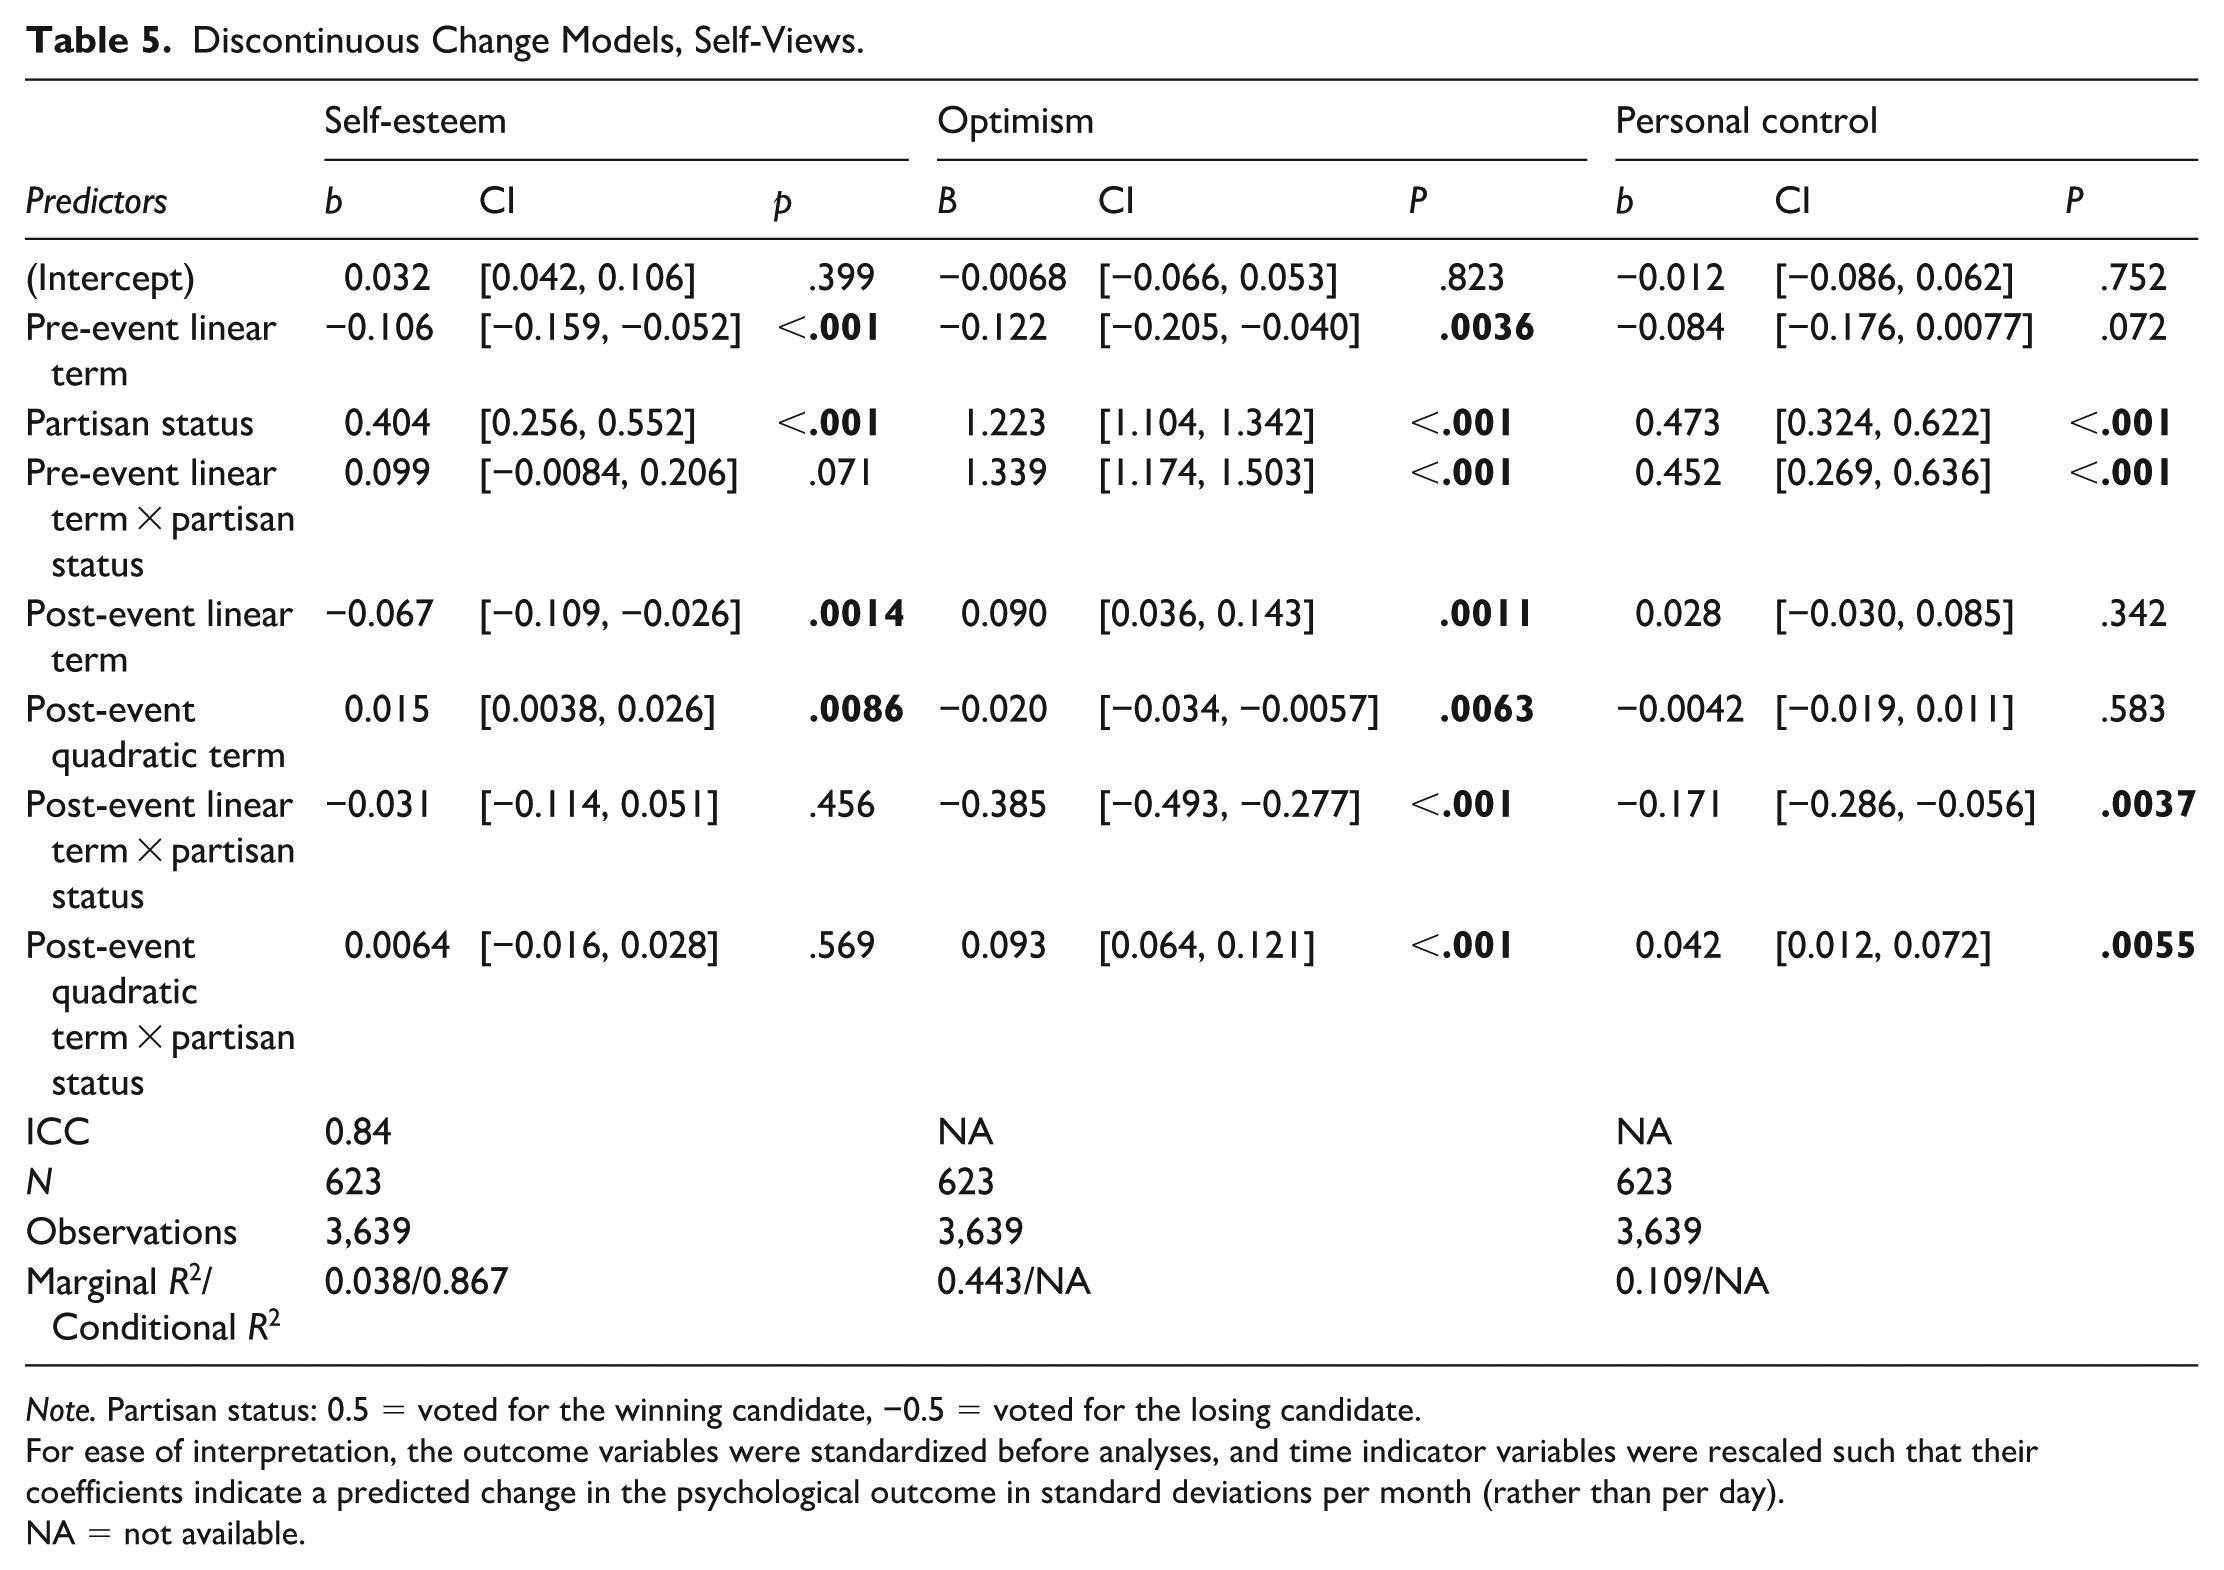
Note. Partisan status: 0.5 = voted for the winning candidate, −0.5 = voted for the losing candidate.
For ease of interpretation, the outcome variables were standardized before analyses, and time indicator variables were rescaled such that their coefficients indicate a predicted change in the psychological outcome in standard deviations per month (rather than per day).
NA = not available.
Discontinuous Change Models, Worldviews: Disrespect and Cynicism.
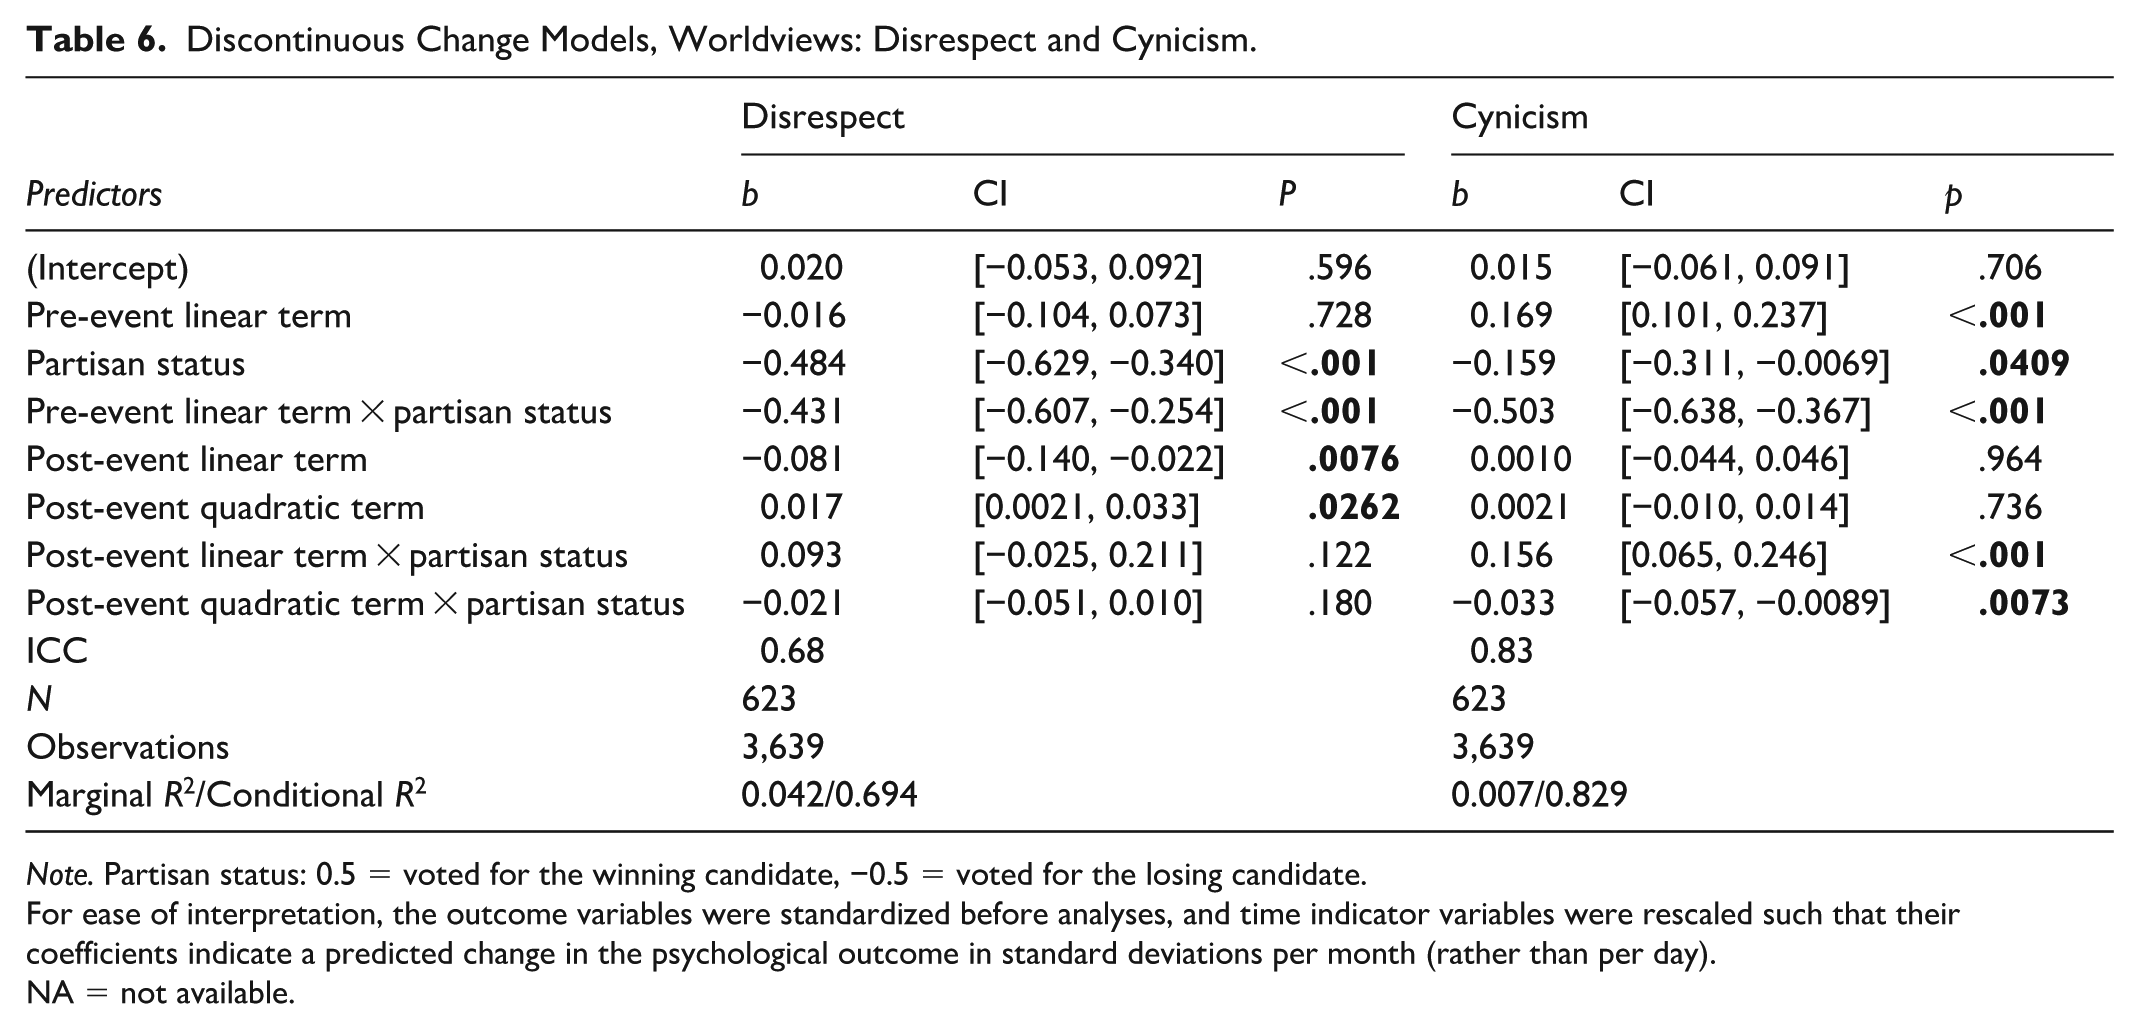
Note. Partisan status: 0.5 = voted for the winning candidate, −0.5 = voted for the losing candidate.
For ease of interpretation, the outcome variables were standardized before analyses, and time indicator variables were rescaled such that their coefficients indicate a predicted change in the psychological outcome in standard deviations per month (rather than per day).
NA = not available.
Discontinuous Change Models, Worldviews: Institutional Trust and Conspiracy Mentality.
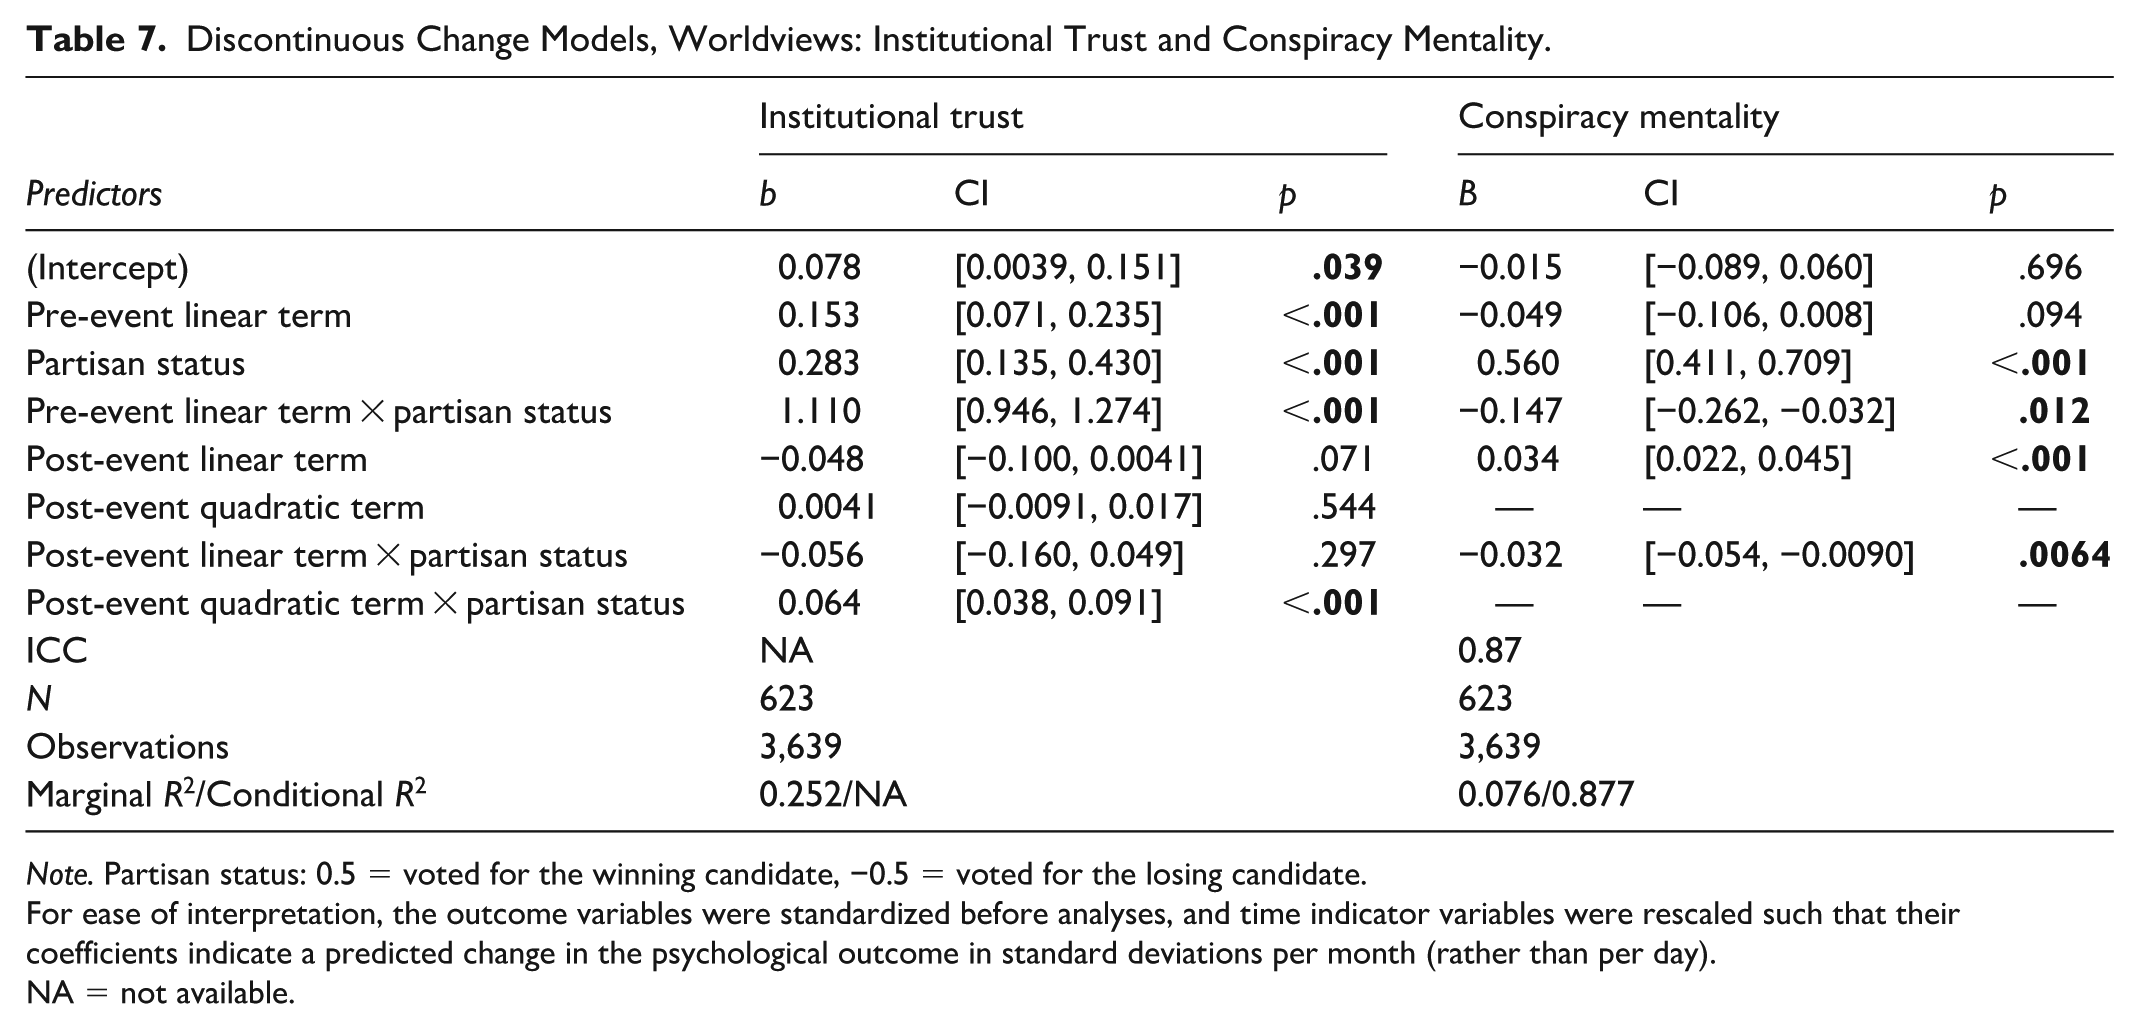
Note. Partisan status: 0.5 = voted for the winning candidate, −0.5 = voted for the losing candidate.
For ease of interpretation, the outcome variables were standardized before analyses, and time indicator variables were rescaled such that their coefficients indicate a predicted change in the psychological outcome in standard deviations per month (rather than per day).
NA = not available.
For 10 out of 12 outcomes (exceptions: self-esteem and meaning search), we observed significant interactions between partisan status and pre-event slope (10 outcomes), post-event slope (7 outcomes), or both (7 outcomes), suggesting that partisan losers and winners differed in their pre-event trajectories and/or showed distinct patterns of adaptation post-event. Figure 2 plots the outcome trajectories across the election for partisan losers and winners.
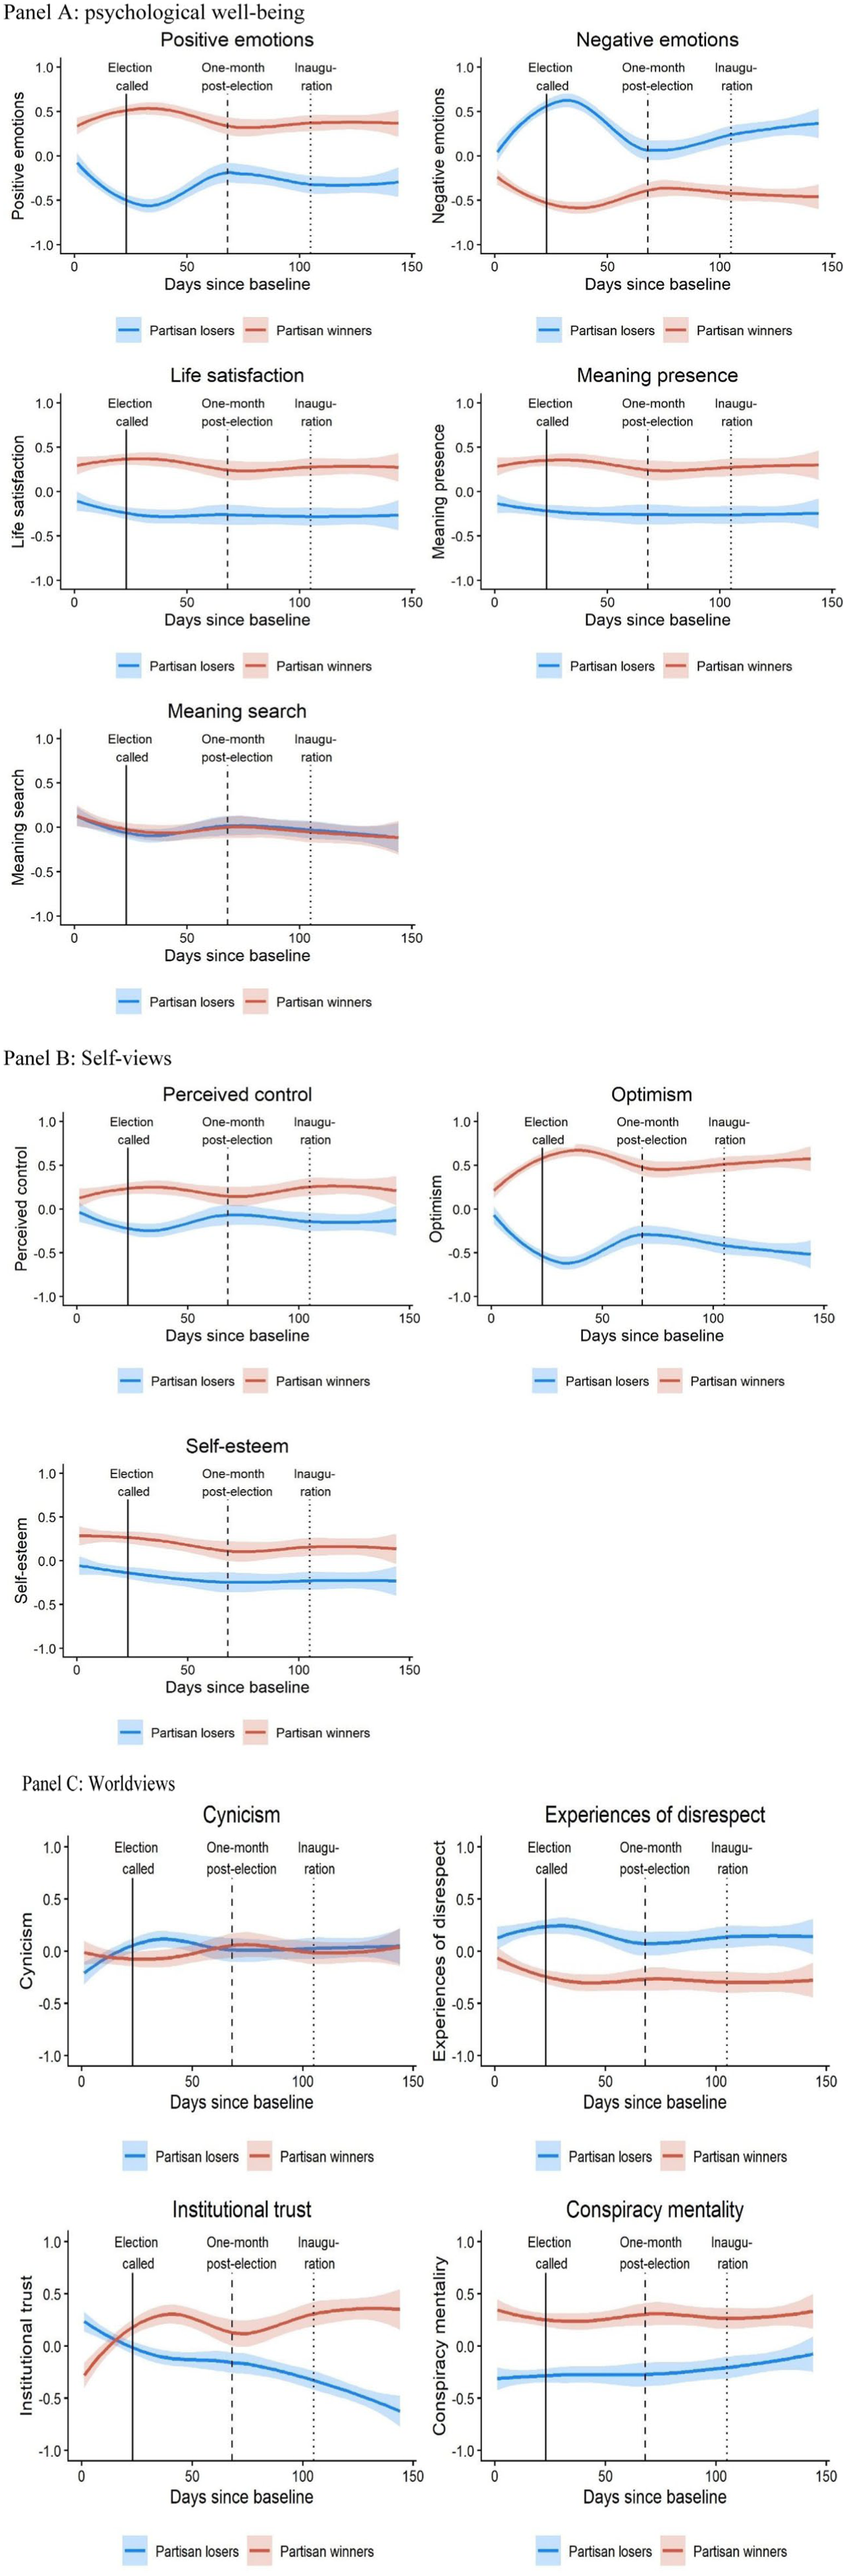
Psychological outcome trajectories before and after the election results announcement for Republican (partisan winners) versus Democratic and third-party (partisan losers) voters.
Next, we focus on the outcomes that showed significant interactions between partisan status and time trends and describe the pre- and post-event trajectories for partisan winners and losers separately. The respective statistics can be found in Table 8 that reports the coefficients of the pre-election slopes and a contrast between wave 1 and wave 7 separately for partisan losers and winners. In the cases where we conducted additional contrasts, we report the respective coefficients directly in the text. In Supplemental Material, we briefly describe the trajectories of the two outcomes (self-esteem and meaning search) that did not differ between partisan losers and winners.
Simple Slope Analysis and Contrasts.
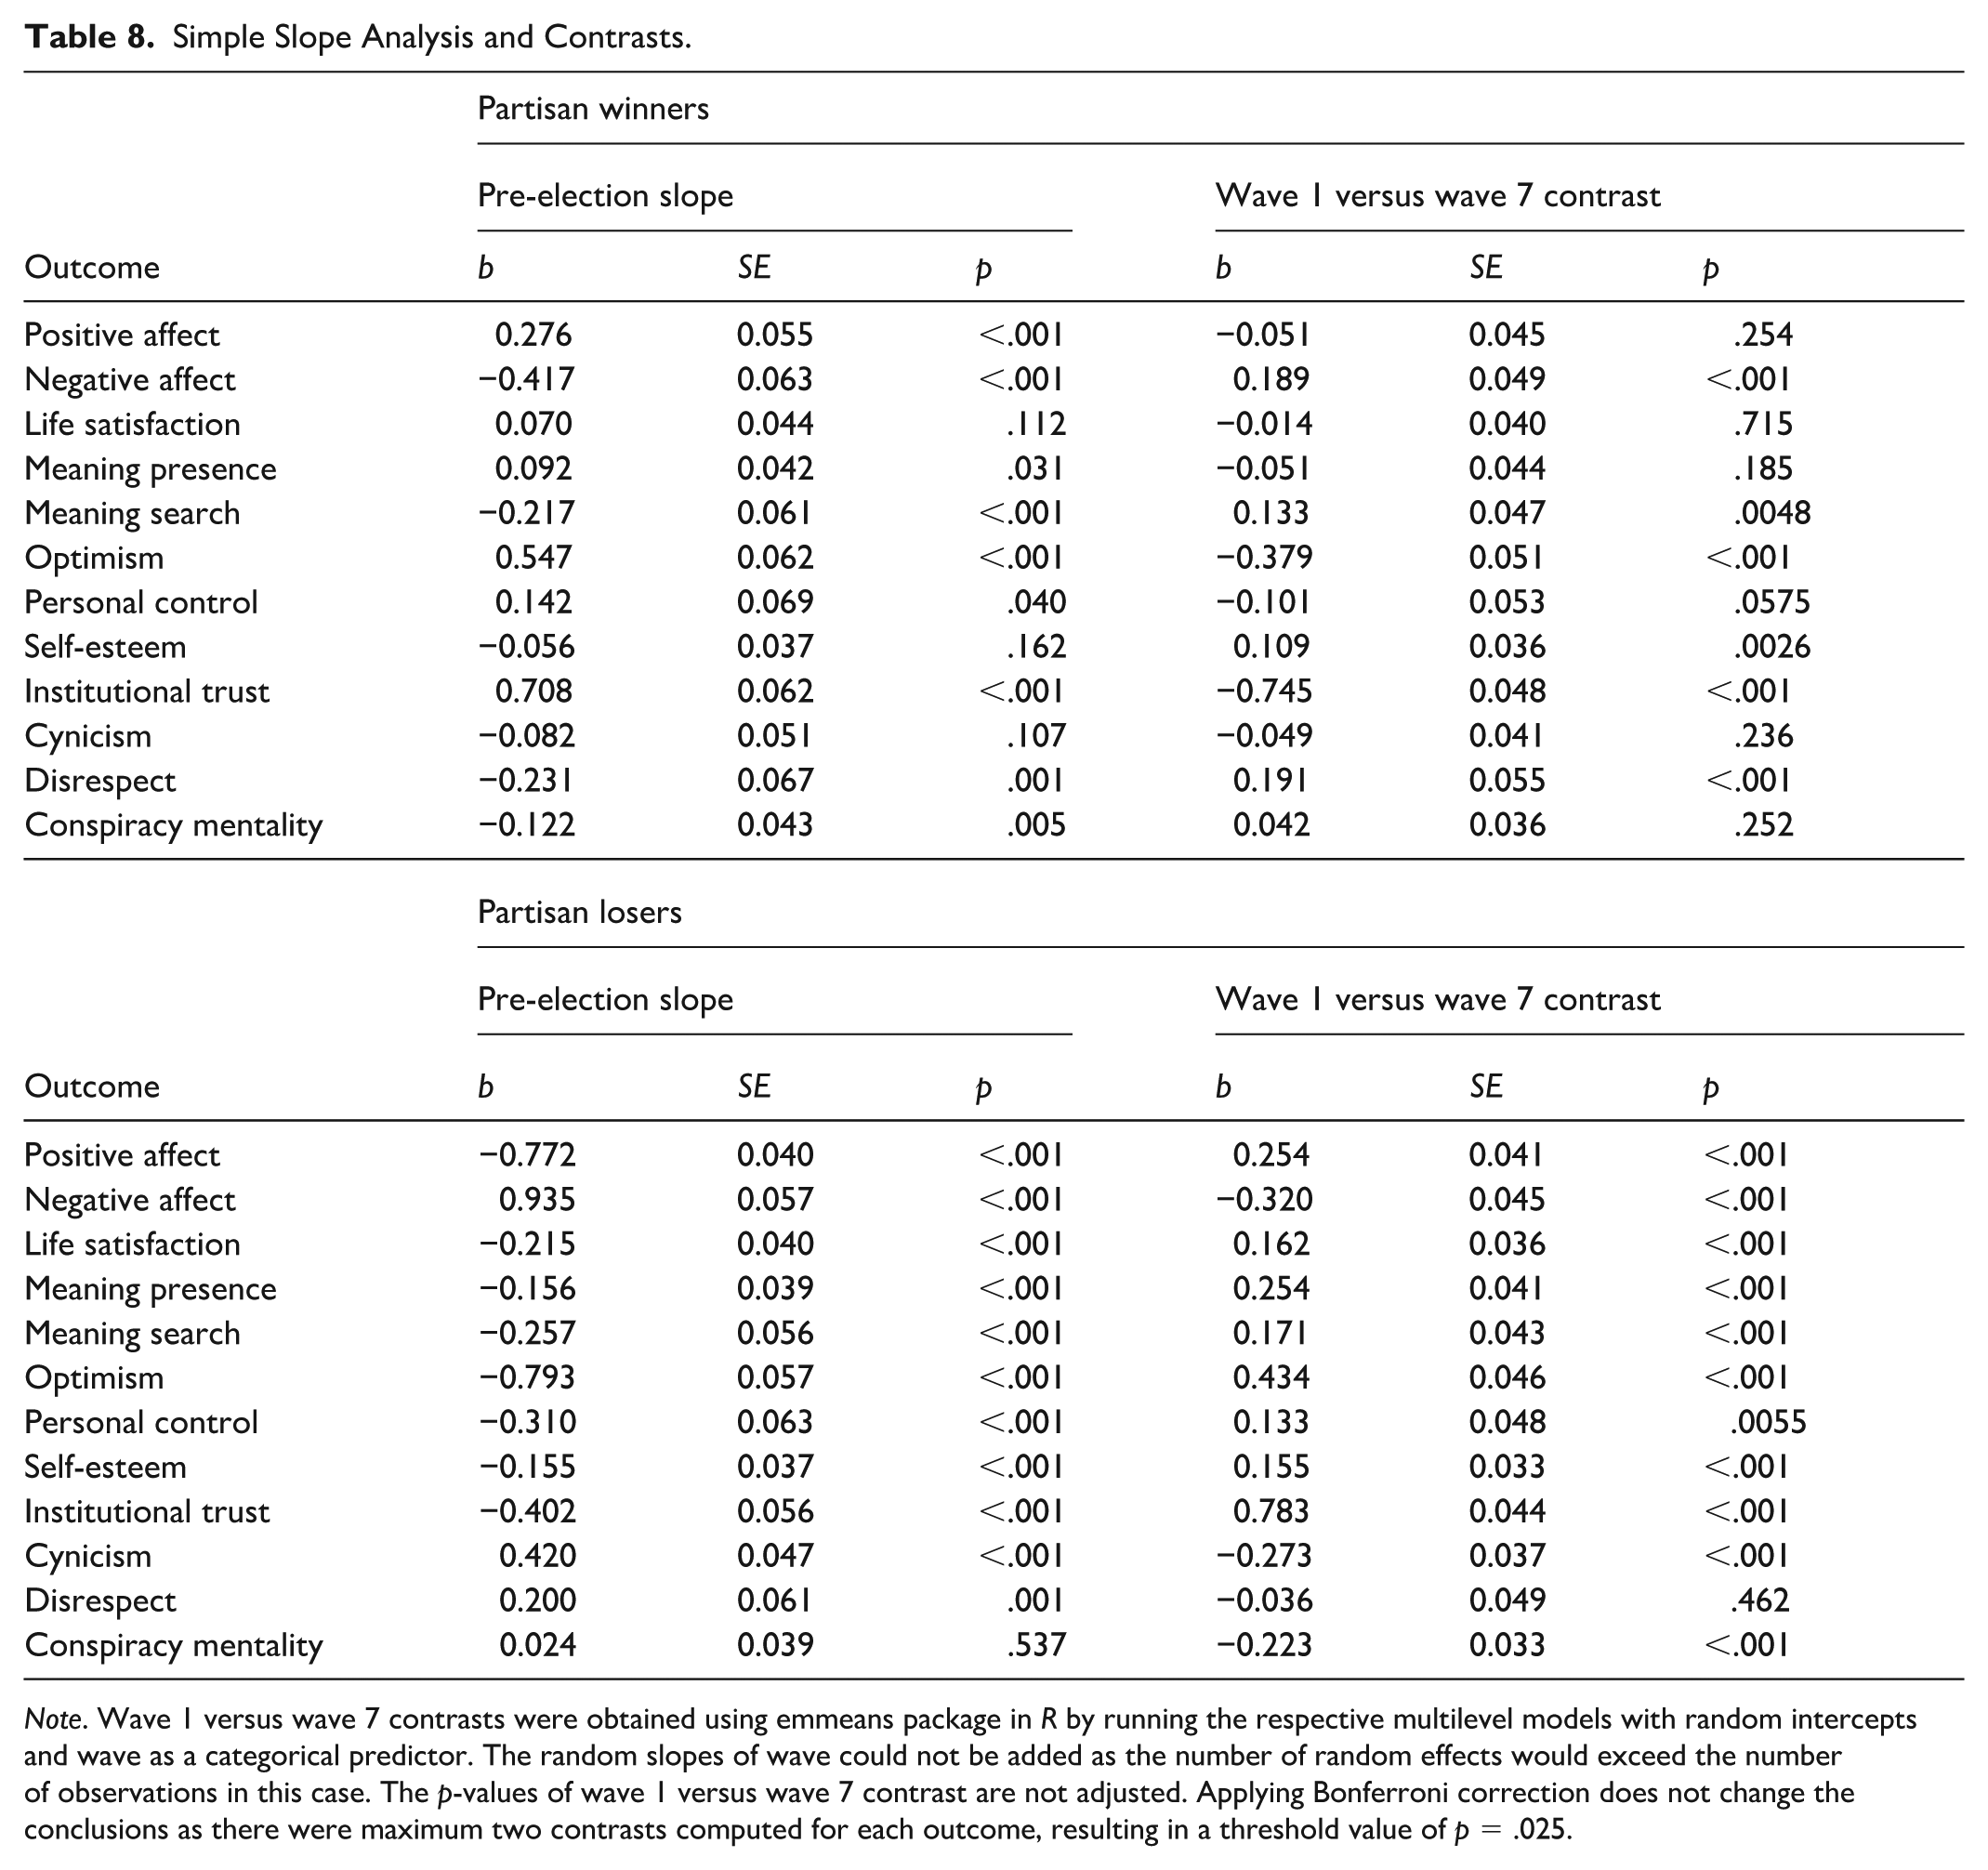
Note. Wave 1 versus wave 7 contrasts were obtained using emmeans package in R by running the respective multilevel models with random intercepts and wave as a categorical predictor. The random slopes of wave could not be added as the number of random effects would exceed the number of observations in this case. The p-values of wave 1 versus wave 7 contrast are not adjusted. Applying Bonferroni correction does not change the conclusions as there were maximum two contrasts computed for each outcome, resulting in a threshold value of p = .025.
Partisan Losers
Partisan losers experienced a decrease in positive affect, life satisfaction, and meaning in life after the election was called and never recovered their pre-election well-being. Specifically, for life satisfaction and meaning in life, the low values were sustained until the end of the observation period, showing no signs of return to pre-election level at all. For positive affect, after a dramatic drop following the election results being announced, partisan losers experienced a partial recovery through wave 5 (1 month after the election; wave 3–wave 5 contrast: b = −0.632, p < .001) but failed to bounce back to their pre-election level, showing lower positive affect even 4 months after the election.
Similar trends were observed for optimism and personal control. We observed a decrease in optimism and personal control upon learning the electoral outcome, a slight recovery in the subsequent month (wave 3–wave 5 contrasts: b = −0.522, p < .001 and b = −0.283, p < .001, respectively), but no return to pre-election levels. An adaptation effect did not take place for institutional trust either: the initial decrease in institutional trust continued throughout the observation period, accumulating in a large overall drop by the end of the observation period relative to pre-election level.
Learning the election results was also accompanied by an increase in negative outcomes. Among partisan losers, negative affect sky-rocketed after the election, which was followed by a brief return to baseline 1 month later (wave 3–wave 5 contrast: b = 0.850, p < .001), and a quick rise through wave 7, showing no signs of adjustment at the end of the nearly 4-month post-election observation period. The increase in negative affect among partisan losers was accompanied by a rising trend in cynicism preceding the release of the election results, which remained elevated in the following 16 weeks, as well as an increase in experiences of disrespect, which however returned to their pre-election level eventually.
For conspiracy mentality, partisan losers’ near-term reaction to their loss seemed not to involve conspiratorial thinking, a pattern that changed as time went by: partisan losers experienced a continuous increase in conspiracy mentality starting the months after the election was called (i.e., from wave 3 through wave 7), resulting in a significantly higher level of conspiracy beliefs 16 weeks following the election relative to 3 weeks prior.
In sum, as the election results came in, partisan losers experienced a decrease in well-being, worsening self-views (optimism and personal control), as well as a deterioration in the views of the world, involving lower institutional trust, higher cynicism, perceptions of being disrespected, and a stronger endorsement of conspiracy mentality, none of which (with the exception of disrespect) returned to their pre-election level throughout the 16 weeks post-election.
Partisan Winners
Once the election outcomes were announced, partisan winners reported an increase in positive affect, life satisfaction, and meaning in life. After that, these outcomes exhibited a steady decline over the ensuing months, returning to their pre-election levels approximately 1 month later (wave 1–wave 5 contrast: b = −.021, p = .621, b = 0.178, p = .640, b = 0.0026, p = .940, respectively), and staying stable after that. Similarly, following the announcement of election results, partisan winners experienced an increase in optimism and personal control, followed by a subsequent decline in the following months (wave 3–wave 5 contrasts: b = 0.208, p < .001 and b = 0.123, p = .016, respectively), after which personal control returned to its baseline level while optimism stayed elevated.
Learning about the election results was associated with more positive worldviews in partisan winners as well. They rose in institutional trust dramatically upon learning the election outcome. This initial spike was followed by a small decrease around wave 5 (1 month post-election; wave 3–wave 5 contrast: b = 0.176, p < .001) and a further increase in the following weeks until the end of the observation time, resulting in substantially higher level of institutional trust 16 weeks post-election relative to 3 weeks before the election. As a result, at wave 7, Democratic and third-party supporters (i.e., partisan losers) reported substantially lower institutional trust than Republican supporters, reversing the gap observed at the pre-election baseline where Republican supporters reported significantly less institutional trust (consistent with the cross-sectional correlation results, see Table 2).
An increase in positive outcomes for partisan winners following the election results announcement was accompanied by a decrease in negative outcomes. For negative affect, partisan winners experienced a decline from pre-election baseline to the week of results announcement, then rose slightly 1 month later (wave 3–wave 5 contrast: b = −0.264, p < .001), although their negative affect levels remained below pre-election baseline until the observation period ended.
Furthermore, for partisan winners, the election was associated with shifting away from a dim view of the world and society. Specifically, the release of the election results was associated with a decrease in perceived disrespect, which was sustained in the ensuing 16 weeks, as well as a decline in conspiracy mentality from pre-election baseline to the week following the election outcome being revealed (wave 3). This pattern, however, was followed by a return to the pre-election level of conspiracy beliefs.
Although partisan winners’ cynicism did not change in the week after the ballots were tallied, we observed a slight upward trend afterwards through wave 5 (wave 3–wave 5 contrast: b = −0.153, p < .001), which however did not persist until the end of the observation period. Notably, the opposing cynicism trends in partisan losers and winners resulted in a closing of the pre-election gap in cynicism. Whereas prior to the election Republican voters were more cynical than Democratic and third-party voters, at 16 weeks post-election cynicism among Democratic and third-party voters’ exceeded Republican voters (consistent with the correlation results, see Table 2).
In sum, as the election results came in, partisan winners reported an increase in well-being, personal control, optimism, and more positive views of the world, involving higher institutional trust, lower cynicism, less experiences of disrespect, and a decline in conspiracy mentality. With the exception of institutional trust, negative affect, optimism, and disrespect, which either exhibited a sustained increase or a partial return toward baseline without full recovery, most of the other changes showed a pattern of reverting to their pre-election baseline over time, pointing at rather shorter-term effects in partisan winners.
Political Ideology as an Indicator of Partisan Loser versus Winner Status
In the above analyses, partisan winner versus loser status was operationalized in terms of voting behavior. We repeated the main analyses using a measure of political ideology (1 = extremely liberal, 10 = extremely conservative) as an alternative operationalization of partisan winner versus loser status (instead of voting behavior). Political ideology and partisan winner (vs. loser) status were strongly related to each other (r = .80, p < .001). Analyses using political ideology instead of partisan winner (vs. loser) status provided nearly identical results. The model coefficients are reported in Supplemental Material and trajectories of psychological outcomes across the election for liberal and conservative participants are depicted in Figure 3.
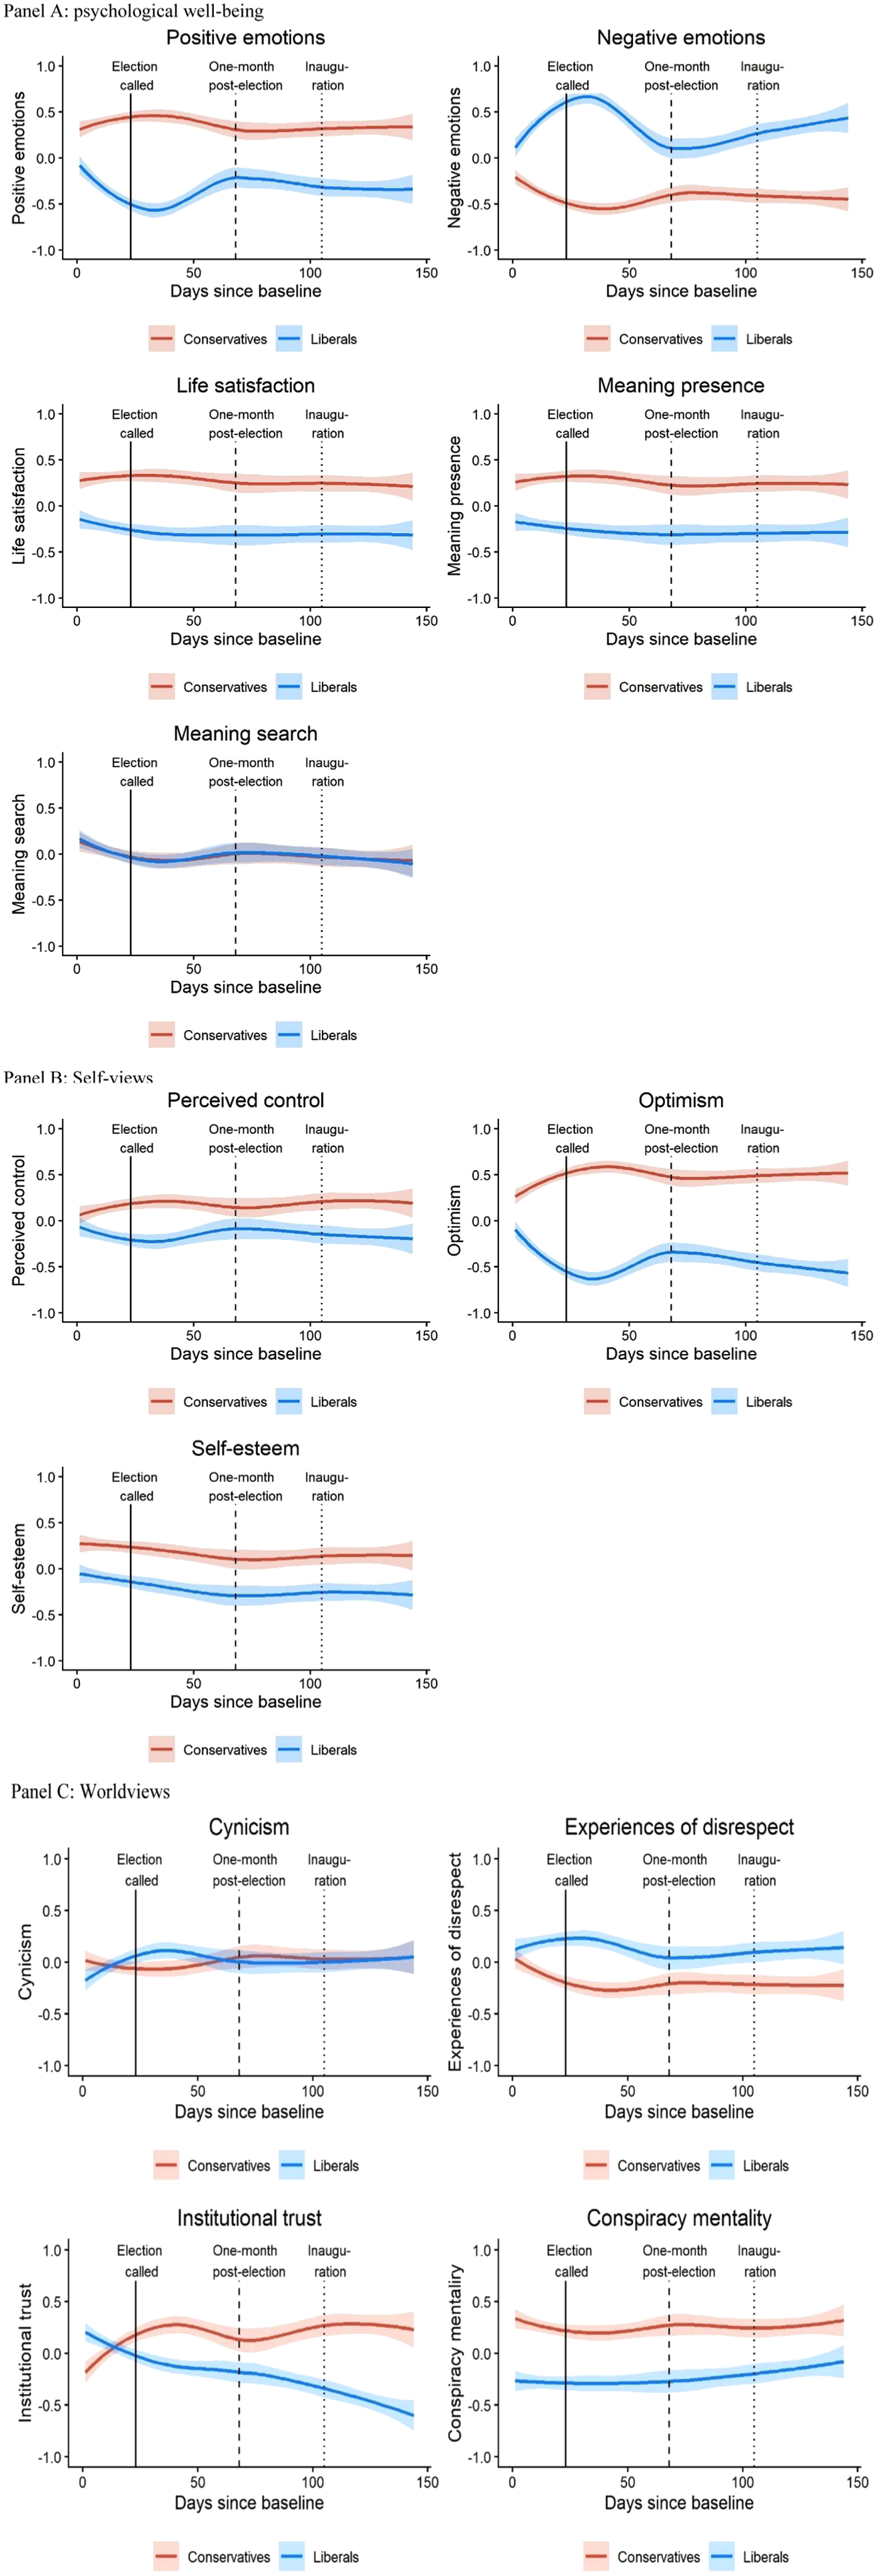
Psychological outcome trajectories before and after the election results announcement as a function of political ideology.
Discussion
How do major national and global events affect people’s well-being? While the research on personality and individual differences has been prolific in documenting the developmental trajectories of personality associated with specific life events (e.g., divorce, unemployment; Bleidorn et al., 2018; Bühler et al., 2024; Denissen et al., 2018; Luhmann et al., 2012), psychological reactions to national or global events are understudied (Wundrack et al., 2021). We examined changes in psychological outcomes during one of 2024’s most significant political events—the re-election of Donald Trump as U.S. President—that has had a profound impact on both national and global politics to date.
Extending prior research on psychological impact of elections (e.g., Gilbert et al., 1998; Lench et al., 2019; Simchon et al., 2020), we tracked changes in well-being and mid-level units of personality (Buss & Cantor, 1989), namely beliefs about the self, society, and the world. We tracked over 700 Americans from 3 weeks before the election to 16 weeks after, with 7 strategically timed assessments, including those immediately following major election milestones, such as the results announcement.
Our results suggest that partisan winners and losers reacted differently to the election results. Upon learning the election outcomes, partisan winners (i.e., Trump voters) reported an increase in well-being, personal control, and optimism, and adopted a more positive view of the world and the society, as reflected in higher institutional trust, lower cynicism, less experiences of disrespect, and a decline in conspiracy mentality. In contrast, partisan losers (i.e., Harris and third-party voters) reported declines in well-being, more negative self-views (optimism and personal control), and worsening views and experiences of the world and the society: lower institutional trust, higher cynicism, more experiences of disrespect, and a stronger endorsement of conspiracy mentality. It is noteworthy that the election was associated with very pronounced changes. For example, the partisan loser–winner gap in affect following the election result announcement reached over one standard deviation, which corresponds to a strong effect in classic effect size taxonomies (corresponding to Cohen’s d = 1).
Theoretical and Empirical Contributions
Our research connects two research areas in psychology that had relatively little cross-talk so far: political science and specifically, the literature on psychological reactions to political elections (Craig et al., 2006; Sinclair et al., 2018), and personality psychology (Bleidorn et al., 2018; Denissen et al., 2018; Roberts & Wood, 2006).
Our findings have clearly demonstrated that both partisan losers and winners showed marked affective reactions to the election, helping to resolve inconsistencies in previous research (Dolan et al., 2008; Lench et al., 2019; Simchon et al., 2020). In addition, we showed that the election was associated with changes in further domains of personality encompassing views of the self and of the world—representing a contribution to the science of personality change. Personality change has been primarily studied in the context of personal life events, such as divorce or job loss. However, national or global events can also serve as powerful catalysts for change. Nevertheless, with the exception of studies on trauma and post-traumatic growth as a reaction to collective events (e.g., hurricanes and earthquakes; Infurna & Jayawickreme, 2019), studies examining personality change in response to collective events are rare, with few exceptions in the context of Big Five changes following terrorist attacks (Damian et al., 2021) and COVID-19 pandemic (Sutin et al., 2020). Among these, none address political events. Here, we contribute to personality development by showing that an electoral process that resulted in one’s favored candidate losing (vs. winning) was associated with broader changes in personality than just well-being.
Our results further advance the studies of political science and personality by offering a more nuanced perspective on the psychological reactions to elections. First, in contrast to the predominant view of the election effect being relatively short-lived and often dissipating within days or a few weeks (Lench et al., 2019; Pinto et al., 2021; Simchon et al., 2020), well-being reactions in our study were more long-lasting, potentially due to the 2024 election being particularly polarized and high-stake (Pradipta et al., 2023; Ting, 2024). Second, the election-related differences in well-being appeared to be asymmetric, with larger changes in well-being reported by partisan losers than by partisan winners, consistent with bad being stronger than good (Baumeister et al., 2001). However, the pattern differed for other outcomes, particularly institutional trust, for which both losers and winners reported substantial shifts. What is more, for some measures (e.g., perceived disrespect), partisan winners exhibited a more pronounced and sustained decrease, whereas partisan losers did not show a comparable sustained increase. This pattern of findings provides nuance to how the negativity bias takes shape in human psychology.
Third, the adaptation patterns did not only depend on partisan winner versus loser status but also differed across the different outcomes we studied. Specifically, worldview changes lasted longer than well-being or self-view changes: Partisan winners sustained the lower levels of experienced disrespect and continued raising in institutional trust throughout the 16 weeks of the post-election observation, while partisan losers sustained the elevated level of conspiracy beliefs and kept on losing institutional trust in the 16 weeks post-election.
Why were changes in well-being more short-lived than changes in worldviews? It is possible that changes in institutional trust were maintained due to the announcement of radical policy shifts by the incoming administration, reinforcing a sense of validation among partisan winners while also provoking a sense of threat among partisan losers, with the net effect being increasing institutional trust among winners and decreasing trust among losers. Furthermore, while the mere learning of the election outcome might affect individuals’ experiences and views of the world, such as experiences of disrespect and a cynical worldview (e.g., with Democratic and third-party voters feeling disrespected by the mere fact of Donald Trump being elected), it is also possible that these longer-lasting shifts are due to individuals experiencing changes in their social environment post-election. Partisan losers may have begun to encounter more frequent disrespect in daily life, reinforcing a more cynical view of human nature, whereas partisan winners may have experienced the opposite.
Relatedly, in addition to the mere effect of losing, psychological changes in Democratic supporters could be driven by anticipation of targeted policy changes aimed at undermining their rights and social standing (e.g., policies directed at weakening women’s rights and the rights of minority groups, many of whom supported the losing candidate). Consequently, it remains an open question to what extent the observed developmental patterns can be explained by partisan losers’ apprehension about confronting a new political reality in which they may be disadvantaged, as opposed to the effects of a contaminated social identity. Establishing the generalizability of the present findings to other—less life changing—elections might help address this question.
Since the observed psychological trajectories across the election were not only limited to Trump versus Harris/third-party voters but also appeared among individuals identifying as liberal or conservative, our findings also inform the literature on the role of political ideology in psychological differences. Consistent with existing studies on political ideology and well-being, conservative people reported higher well-being than liberals in our sample. While various explanations have been offered for the liberal–conservative happiness gap, including the idea that conservatives are more likely than liberals to endorse system-justifying beliefs (Napier & Jost, 2008) as well as evidence suggesting that conservative-identifying individuals may possess more adaptive personality traits (Schlenker et al., 2012), our results support shared reality and person–environment fit explanations (Stavrova et al., 2013). According to these ideas, well-being is enhanced in environments where people’s beliefs and identities are widely shared and supported (Gebauer et al., 2017; Stavrova, 2015). Indeed, in prior research, conservatives’ edge in happiness was stronger at times where the conservative ideology was more versus less dominant in the country (Stavrova & Luhmann, 2016). Consistent with this theoretical perspective, we showed that learning about winning the election was associated with a stronger well-being advantage of conservative individuals.
Our findings also contribute to the ongoing debate in political science regarding the gap in institutional and social trust between conservatives and liberals (Farrer & Zingher, 2019; Hansen et al., 2019; Quaranta & Martini, 2025). Voters of conservative parties typically report lower institutional trust and a stronger distrust of people in general, a finding often attributed to differences in sociodemographic characteristics or policy-related attitudes, such as anti-immigrant sentiment (Berning & Ziller, 2017; Heller et al., 2022; Vasilopoulou & Halikiopoulou, 2024). Here, we showed that following Trump’s re-election, the liberal–conservative gap in institutional trust reversed, rendering conservative supporters more (rather than less) trustful of the democratic institutions. Similarly, while conservatives reported higher cynicism than liberals before the election, this difference reversed after the election results came in and disappeared 16 weeks thereafter. These patterns suggest that conservatives’ distrust, toward both institutions and human nature, may stem more from a sense of political underrepresentation than from underlying psychological or other differences between the two groups, as previously assumed. This distrust dissipates when the political leadership aligns more closely with their views.
Limitations and Future Directions
Our results showed that for most outcome measures, partisan losers did not return to their pre-election levels within the 4 months following the election. It is possible that a longer observation window is needed to document the adaptation effects. Another limitation pertains to the composition of our sample. Even though this was not intended by our study design, the overwhelming majority of our participants (96%) did vote in the election, suggesting that our findings are mostly restricted to individuals who do not only passively but also actively supported their preferred presidential candidate. Prior research suggests that such an active support might make a difference to psychological reactions to electoral losses and wins. For example, while Kim et al. (2022) documented a decrease in conspiracy mentality following Biden’s win in the 2020 election, this effect was restricted to Democratic supporters who did vote in the election. Thus, our focus on voters could have potentially inflated the effects, making it important for future studies to observe the trajectories of psychological reactions to election outcomes among both voters and non-voters.
Last, alternative accounts of the changes we observed in the psychological outcomes of partisan winners and losers cannot be ruled out due to observational, non-experimental methods used here. The status of partisan loser versus winner was not randomly determined and was aligned with political ideology, such that it remains unknown whether supporting the winning versus losing party alone or only in combination with the political ideology, leads to the observed changes. Relatedly, this work does not speak to the processes underlying the observed personality change in partisan winners and losers. According to several theoretical accounts of personality change (Roberts & Wood, 2006; Wrzus & Roberts, 2017), changes in social roles, identities, and environments (typically triggered by events) lead to changes in everyday personality-congruent behaviors which further accumulate and result in the respective changes at the trait level. We suspect that similar processes explain the patterns of changes in our results. For example, electoral losses might taint one’s identity resulting in lower well-being, portend the advent of adverse policy changes, or result in changes in one’s immediate environment due to a new dominant ideology.
Conclusions
Bridging the research in political psychology of elections and the field of personality development, we have shown that election outcomes are associated with relatively long-lasting changes in people’s well-being, self-views, and worldviews. For most outcomes, the impact of losing the election outweighed the impact of winning, with partisan losers showing lasting changes not only in well-being but also in how they experienced and perceived the world and society—effects that persisted for several months after the election.
Supplemental Material
sj-docx-1-psp-10.1177_01461672251412506 – Supplemental material for Trajectories of Psychological Outcomes During the 2024 U.S. Presidential Election
Supplemental material, sj-docx-1-psp-10.1177_01461672251412506 for Trajectories of Psychological Outcomes During the 2024 U.S. Presidential Election by Olga Stavrova, Dongning Ren, Sangmin Kim and Kathleen D. Vohs in Personality and Social Psychology Bulletin
Footnotes
Funding
The authors received no financial support for the research, authorship, and/or publication of this article.
Declaration of Conflicting Interests
The authors declared no potential conflicts of interest with respect to the research, authorship, and/or publication of this article.
Supplemental material
Supplemental material is available online with this article.
Notes
References
Supplementary Material
Please find the following supplemental material available below.
For Open Access articles published under a Creative Commons License, all supplemental material carries the same license as the article it is associated with.
For non-Open Access articles published, all supplemental material carries a non-exclusive license, and permission requests for re-use of supplemental material or any part of supplemental material shall be sent directly to the copyright owner as specified in the copyright notice associated with the article.