



Abstract
Growing reliance on complex constructed response items has generated considerable interest in automated scoring solutions. Many of these solutions are described in the literature; however, relatively few studies have been published that compare automated scoring strategies. Here, comparisons are made among five strategies for machine-scoring examinee performances of computer-based case simulations, a complex item format used to assess physicians’ patient-management skills as part of the Step 3 United States Medical Licensing Examination. These strategies utilize expert judgments to obtain various (a) case-specific or (b) generic scoring algorithms. The various compromises between efficiency, validity, and reliability that characterize each scoring approach are described and compared.
Concurrent growth in computer-based testing and the use of complex constructed response item formats has generated considerable interest in automated scoring of complex examinee performance data. Many researchers have described efforts to automate scoring of essays (Attali & Powers, 2009; Burnstein & Chodorow, 2002; Martinez & Bennett, 1992; Page, 1994), architectural design tasks (Bejar & Braun, 1999), and patient care (Margolis & Clauser, 2006), and in many cases, they have found that computer-based scores closely resemble scores from expert judges (Powers, Burstein, Chodorow, Fowles, & Kukich, 2002; Shermis, Koch, Page, Keith, & Harrington, 2002). Continuing—and in some ways extending—this line of inquiry, this article describes and compares various competing strategies for scoring complex performance data and evaluating their relative success.
Background
Until recently, innovative and complex performance assessments were almost exclusively scored by human raters; however, human judgments can be unreliable and inconsistent—contaminated by raters’ individual biases and errors (e.g., Braun & Wainer, 1989; Engelhard, 1994, 1996; Guilford, 1936; Hartog & Rhodes, 1936). Moreover, as performance assessments have increased in complexity, so too have the costs and challenges associated with their development and maintenance, which has created further incentives to score examinee performances efficiently (e.g., Attali & Burstein, 2006). These concerns have led many testing organizations to pursue automated scoring solutions, particularly for use with large-scale tests, where efficiencies are scalable and the use of human raters can become impractical.
The best automated scoring procedure is one that successfully balances the (sometimes competing) goals of validity, reliability, and efficiency for a given measurement problem; however, in practice, balancing these objectives can be challenging. Indeed, while the published literature describes many different approaches to automated scoring (Bennett & Bejar, 1998; Clauser, Kane, & Swanson, 2002; Yang, Buckendahl, Juszkiewicz, & Bhola, 2002), most performance assessments are unique enough to cast doubt on the generalizability of much of the findings from one specific program to another (essay scoring being a notable exception—perhaps explaining why this area has received the most attention from researchers). As a result, while the literature provides an invaluable service by introducing and describing various scoring procedures, it often remains up to each testing program to evaluate the relative performance of each approach for its particular measurement problem.
Most performance assessments are unique enough that the problem of generalizability is not likely to go away; however, automated scoring procedures typically can be broken into a series of discrete steps, and some of these steps may generalize better than others. To this end, it is convenient to describe most automated scoring as comprising two broad steps: (a) Performance data are converted into a vector of values that describes the presence, absence, or extent to which certain relevant features can be found within a response, and (b) these values are combined in some way to produce a summative performance score. For example, an essay is a free-text response that can be described by some number of positive textual entailment relations (Dagan, Glickman, & Magnini, 2006) wherein the presence or absence of each relation may be denoted 0 or 1, thereby yielding a vector of dichotomous feature values. These values can then be combined, perhaps as a weighted sum, to produce a summative score for the entire essay. 1
While strategies for producing vectors of feature values may depend a great deal on the given performance activity (and thus may not generalize well across exam programs), once such a vector is obtained, the more general problem of aggregating the feature values to produce a single summative performance-level score is common to a much broader range of performance assessments. For this reason, the focus of this article is not on converting relevant response features into a vector of feature values, but rather on various strategies for aggregating feature values into scores that summarize an examinee’s success at a given performance activity. These procedures are designed to efficiently approximate the scores that might otherwise have been provided by human raters, but producing these algorithms is often resource intensive. When each algorithm is used to score a large number of examinee performances, the low marginal expense of scoring additional examinees makes these approaches attractive, but minimizing the expense would be attractive as well. Algorithms that are less costly to develop would lower the expense of scoring and make automated scoring applicable to smaller scale testing programs. One way to improve the efficiency of development of these procedures would be to simplify them.
Before going into further detail about this study, a program of research highly relevant to this work deserves comment. Attali, Bridgeman, and Trapani (2010) compared generic and prompt-specific scoring models for e-rater, an automated essay-scoring engine. Using agreement with human ratings and correlations with other available scores as the evaluation criteria, their findings showed only modest differences between the scoring models, which suggests that for some applications, generic models may be used in place of question-(or task)-specific algorithms.
In this article, too, generic and task-specific scoring approaches are considered, and their relative performance using similar criteria is evaluated. The present study compares five different strategies for summarizing examinee performance data from the computer-based case simulations (CCSs) component of the Step 3 United States Medical Licensing Examination (USMLE®); three of these are generic and two are case-specific. These are described in greater detail in the following, but first, a short description of the CCS performance assessment is provided to aid the reader in understanding the complexity and nuances of this examination.
CCSs require examinees to manage a virtual patient in a computer-simulated patient-care environment. The full examination comprises 12 computer-simulated clinical cases and takes about 5 hr to complete. The format of this examination has been described in detail elsewhere (Margolis & Clauser, 2006). Briefly, examinees are presented with a clinical scenario involving a patient in need of medical care (see Figure 1). Examinees can freely navigate the simulation interface to review the patient’s history, request a physical examination, and order tests, treatments, and consultations. The interactive computer environment allows examinees to review results of the ordered tests and receive periodic updates about the patient’s condition. The examinee is also responsible for changing the patient’s location and advancing the case through simulated time. When case management is completed, the system produces a comprehensive record of the actions taken by the examinee along with the simulated time at which each action occurred, which can then be scored (see Figure 2).

Graphic interface for computer case simulation assessment.
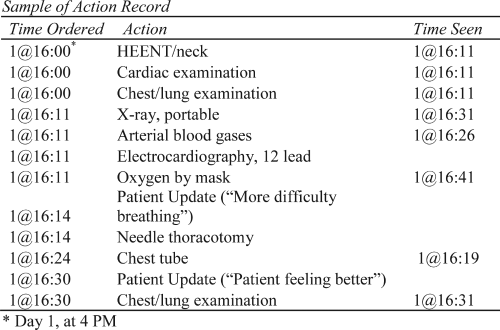
Sample of action record.
There are thousands of computer-recognized actions an examinee can take at any time during a simulated clinical case, and each one is classified into 1 of 15 action categories: most harmful, harmful, least harmful, neutral, least beneficial, beneficial, and nine detailed categories of most beneficial actions based on their type (treatment, diagnosis, or monitoring) and the importance of their timing and sequence during the course of the simulated treatment. Specifying these classification rules is a two-step process. First, trained physicians review all the possible procedures, tests, medications, and other actions that may be ordered by examinees during the test. These thousands of actions may include, for example, ordering intravenous fluids, prescribing medication or scheduling surgery. The actions are then assessed for their impact on a healthy individual and classified into one of four action categories based on the extent to which they may be harmful: most harmful, harmful, least harmful, or neutral. These expert judgments—made without regard for any specific clinical scenario—comprise a generic rule set intended to capture harmful and irrelevant examinee behaviors. Next, experts identify a subset of plausible actions that are specific to each clinical case. For these actions, the extent to which each is harmful or beneficial is determined—taking into account each case’s specific clinical scenario. As mentioned, most beneficial actions are further classified into 1 of 9 categories based on their type, timing, and sequence. For example, in a case of pneumonia, one of the most beneficial actions an examinee can take is ordering an appropriate antibiotic (type of action). It is important that the antibiotic is taken as soon as possible (timing of action), and only after a culture and sensitivity test is completed (sequence of action).
Once the case-specific rules are identified, they are combined with the generic rules to create the final rubrics. Such rubrics can then be used to classify each observed examinee action into 1 of the 15 action categories for each case. All within-category actions are considered equivalent (by design); thus, summing the number of actions per category yields a vector of 15 polytomous action category scores. After excluding the neutral category and any category for which no actions were observed in the pretest sample, a case-specific vector of 14 or fewer action category scores remains that describes a single examinee performance on a single case.
Producing category scores for the CCS is a complex and interesting problem that certainly merits its own study; however, as suggested earlier, this step in the automated scoring process is somewhat specific to this exam’s performance activity and thus may have limited generalizability. For that reason, this step—despite routinely undergoing refinements and enhancements in practice—is treated as a fixed condition for this study. Here, the focus is on how to summarize these category score vectors into a single case score.
Five Strategies for Producing Case Scores From Action Category Scores
Selecting an automated scoring procedure requires balancing validity, reliability, and efficiency objectives. While the validity and reliability associated with different strategies for producing case-specific examinee scores are expected to vary, these qualities will not be known until a given strategy is applied. For this reason, validity and reliability cannot be explicitly manipulated as study conditions—they can only be compared as outcomes. In contrast, the efficiency of a given scoring strategy can be known in advance. Thus, by design, the five strategies investigated in this study differed with respect to efficiency.
Given unlimited resources, case scores could be obtained using expert human raters. Of course, resources are not unlimited, and like many performance assessments, the time and expense associated with human scoring is impractical operationally for large-scale performance assessments. Automated scoring offers a potentially more efficient alternative, but building the automated scoring infrastructure often relies on the same sorts of expert human judgments used for human scoring—only fewer. Such is the case here, wherein three of the five strategies investigated utilized holistic ratings of examinee performances made by practicing and teaching physician raters trained for this purpose. (As discussed later in greater detail, these ratings also served as a validity criterion when comparing strategies.) Differences in efficiency among these three methods were due to their reliance on differing numbers of such ratings. Of the remaining two strategies, neither used expert ratings of examinee performances and one went even further, ignoring some of the substantive distinctions between action categories that were specified in the rubric (which, if deemed unnecessary, could make rubric development less resource intensive). Thus, in summary, the efficiency of each strategy depended on the extent to which its respective automated scoring infrastructure relied on expert human judgment.
Despite these differences, the basic approach to producing case-specific examinee scores was the same across all five strategies: Use a given case’s action category scores to produce a weighted sum. The differences across strategies were manifest in the values of the weights that were used and—as mentioned—the efficiency with which they were obtained. The least efficient strategies studied—the three that used expert ratings about specific examinee performances—involved estimating weights using regression, and the most efficient used a priori weights. Regression coefficients were estimated for each case’s action categories using the expert ratings as the dependent variable. The a priori weights were based on the extent to which an action category was designated beneficial or harmful in the rubric (as in Attali & Burstein, 2006). From least to most efficient, the strategies were as follows:
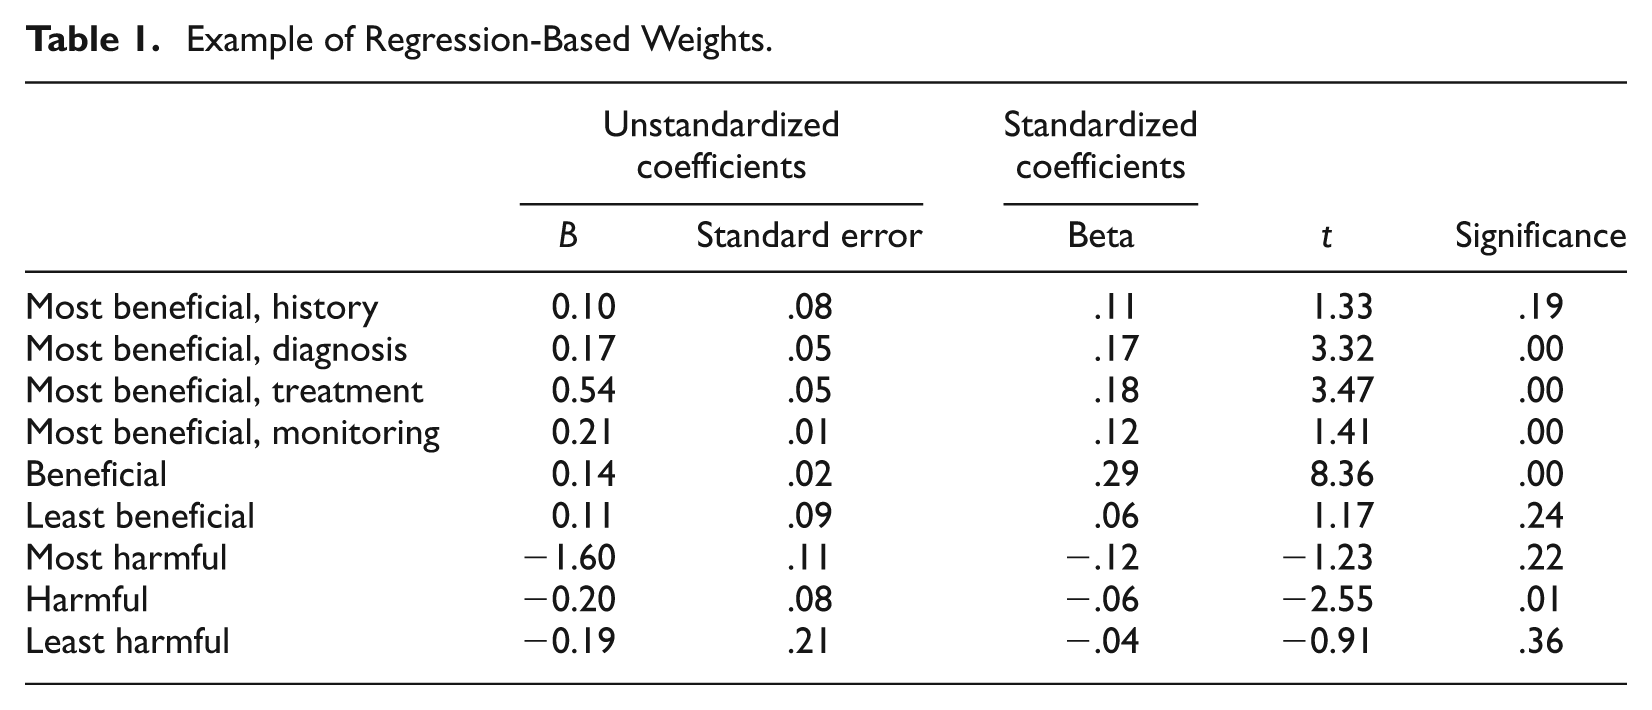
Regression weights. For each case, holistic expert ratings for a random sample of 230 to 250 examinee performances were regressed onto the associated matrix of action category scores. Regression weights for each of the action categories were taken as action category weights for producing a weighted composite for each examinee on each case. See Table 1 for an example.
Small sample regression weights. Like the regression weights strategy, expert ratings of examinee performances were again regressed onto the action category scores for each case; however, to reduce resources demands, only 80 to 100 ratings per case were used. Furthermore, to minimize the loss of information due to the smaller samples, a focused rather than random sample of performances was selected based on a cluster-analytic procedure. This procedure involved first grouping distinct examinee performance patterns into clusters, then randomly sampling from each cluster.
Mean regression weights. Case-specific regression weights were obtained using the method described earlier as Strategy 1. After standardizing, weights were averaged across cases to yield generic action category weights. The resulting generic weights were then applied to each case’s standardized action category scores. While this strategy uses the same number of expert ratings as Strategy 1, the advantage of this approach is that generic weights can then be applied to future cases without further analyses or data collection, making it potentially much more efficient.
Stratified weights. Action category weights of 1, 2, and 3 were applied to the least beneficial, beneficial, and most beneficial action category scores, respectively. Likewise, weights of −1, −2, and −3 were applied to the least harmful, harmful, and most harmful action category scores, respectively.
Unit weights. All beneficial action category scores were given a weight of 1, and all harmful action category scores were given a weight of −1. Note that while neither this strategy nor the previous one uses expert ratings of examinee performance data, this strategy potentially simplifies rubric development.
Example of Regression-Based Weights.
As will be apparent in the following, when presenting and discussing the results, there are some benefits to grouping the strategies into two general categories. Note, however, that these categories are not based on whether regression weights or a priori weights were used. Instead, the distinction that corresponds most closely to the various outcomes is whether the weights were case-specific (regression weights and small sample regression weights) or generic (mean regression weights, stratified weights, and unit weights).
Method
Two independent datasets were used in this study. Both included the same 18 clinical cases; however, the first sample contained six cases for each examinee, while the data in the second sample contained only one case per examinee. Each dataset provides different evidence by which to evaluate the relative merits of the five strategies.
Data and Evaluation Criteria: Dataset I
A current operational test form for the CCS component of the Step 3 USMLE® comprises 12 cases. For this research, examinees were identified who had completed 6 cases in common. Three such sets of 6 cases, which were balanced for content, were identified from the operational pool. For the 3 sets, random samples of N = 739, N = 771, and N = 767 examinees were selected. All examinees were first-time Step 3 USMLE® test takers from the same annual cohort.
Dataset I was used to estimate set reliability (coefficient alpha) for each six-case set and for each case score strategy. In addition, examinee case scores were summed across cases, and correlations between the resultant total scores and the examinees’ respective ability estimate for the multiple-choice component of the examination were calculated.
Data and Evaluation Criteria: Dataset II
The second dataset comprised random samples of 230 to 250 examinee performances each for the 18 cases investigated in this study. Holistic ratings were collected for each examinee performance from three to five content experts who were practicing and teaching physicians. These ratings were then averaged within each examinee case performance to reduce the impact or rater error. As noted in the previous section, the resultant mean ratings were then used for two purposes: (a) They were used as the dependent variable for the regression models described earlier, and (b) they were used as a validity criterion to evaluate the relative success of the five weighting strategies. For each weighting strategy, case-specific correlations between the case scores and these mean expert ratings were calculated, and the relative strength of each strategy’s correlations was compared.
Note that because mean expert ratings were used both in the regressions and in the correlations, cross validation is necessary so that over-fit does not unfairly advantage the regression methods. This was accomplished by calculating correlations for the regression-based strategies using case scores based on boot-strap cross-validation weights as follows. Ten random performances were excluded from each replication, the regression model was fit using the remaining sample, and the resultant weights were used to produce summary scores for the 10 excluded performances. For example, suppose a data set for a given case has 240 performances. Ten of these performances—selected at random—were excluded, and the remaining 230 were used to estimate the regression model. The resultant weights were then used to produce case scores (weighted sums) for the initial 10 performances that were excluded from the regression. This process is repeated 23 more times until every performance has a predicted score. This way, the predicted case score for each performance is based on a set of regression weights that were estimated using an independent sample.
Results
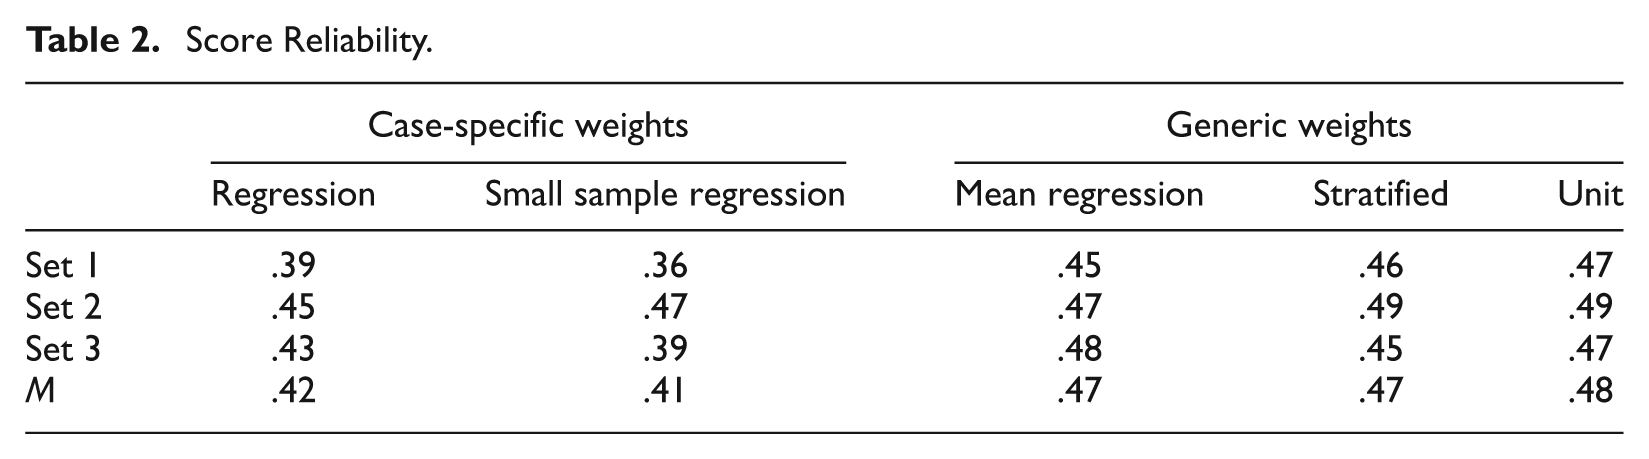
Table 2 reports the reliability estimates for each of the three 6-case sets and each of the five weighting strategies investigated in this study. Dataset I with random samples of N = 739, N = 771, and N = 767 examinees for the three 6-case sets was used to compute reliability estimates. As often happens with complex performance assessments, score reliability—while based on only 6 cases—was extremely modest, ranging from 0.36 using the small sample regression weights on Set 1 to 0.49 using the stratified, and unit and a priori weights on Set 2. The case-specific weights (regression and small sample regression) led to the lowest reliabilities.
Score Reliability.
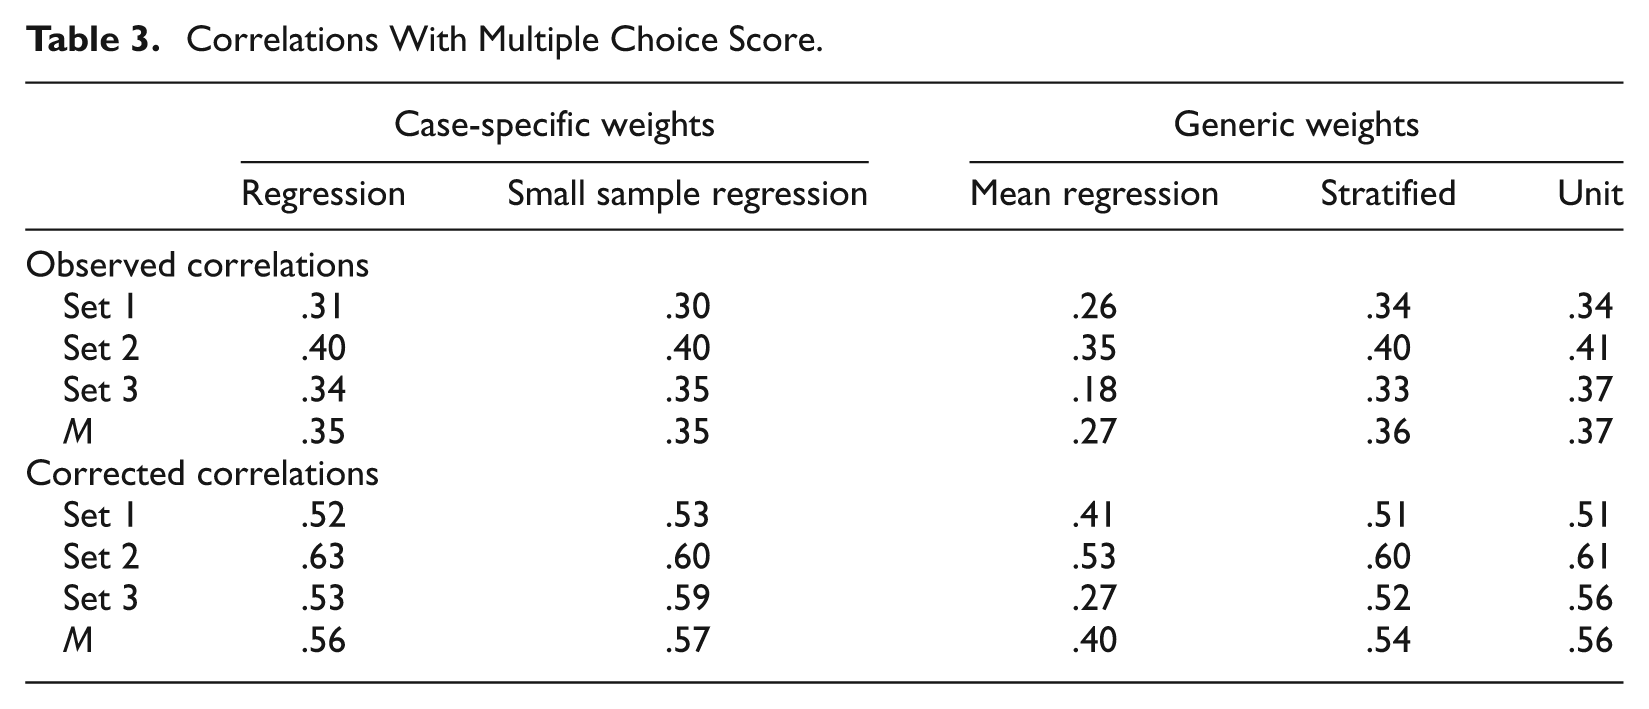
Correlations between the sum of each examinee’s six case scores and their respective score on the multiple-choice portion of the Step 3 USMLE® examination were computed using Dataset I (see Table 3). Both the observed and corrected correlations using the mean regression weights were lowest, ranging from .18 to .35 and from .27 to .53, respectively. The remaining four strategies produced highly similar observed and corrected correlations on average, which ranged from .30 to .41 and .51 to .63, respectively.
Correlations With Multiple Choice Score.
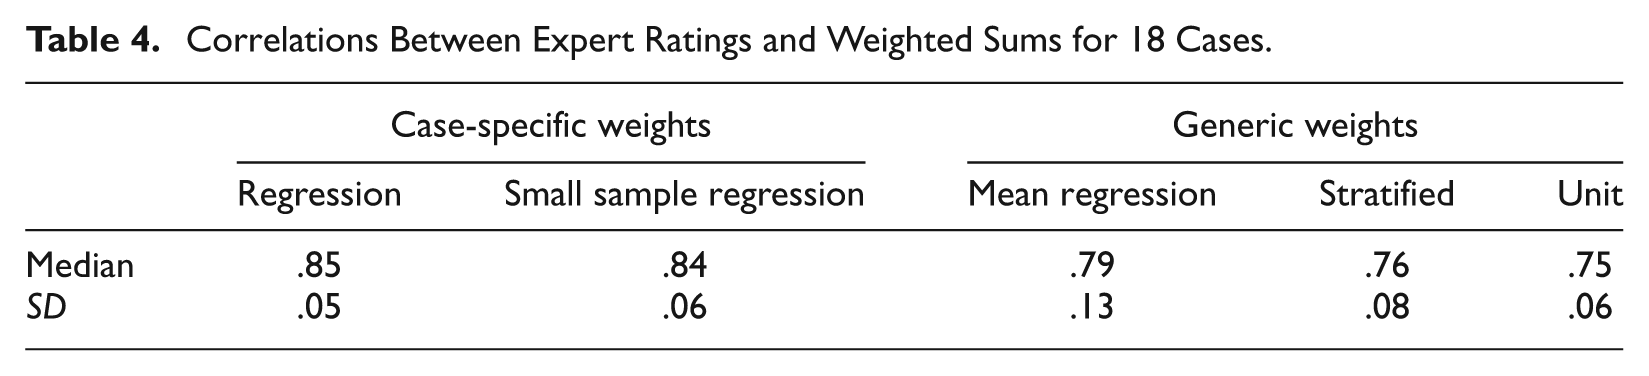
Turning to the Dataset II, Table 4 shows the correlations between expert ratings and the case scores based on the five weighting strategies. Because distributions of correlations across cases were skewed, median correlations are reported along with standard deviations. Here, using case-specific weights (regression and small sample regression) led to the highest correlations with expert ratings: Median correlations were between .85 and .84 for the case-specific methods versus .64, .76, and .75 for the mean regression weights, stratified weights, and unit weights methods, respectively.
Correlations Between Expert Ratings and Weighted Sums for 18 Cases.
Discussion
As noted, reliability was not only modest overall, but it was also lowest when case-specific weights (regression and small sample regression) were used. The lower reliability for case-specific scoring methods suggests that some—perhaps a great deal—of examinee behavior across cases cannot be explained by a single trait. It could be, for instance, that familiarity with a given clinical problem contributes to success on a given case but is due more to chance exposure during an examinee’s training than to proficiency at clinical management in general. Generic weights do somewhat better; however, the nearly identical reliabilities for the stratified and unit weights suggest that these gains may reflect construct-irrelevant behaviors such as propensity to take action rather than more reliable measurements of the trait of interest. That is, gains in reliability may come at the expense of validity—a notion that is supported by the correlations between automated case scores and expert ratings.
Using case-specific weights consistently approximates expert ratings better than using generic weights. This is perhaps regrettable given the practical advantages of generic weights (e.g., reduced work needed to develop weights, reduced time needed between pretesting and operational use of new cases, no sample dependencies or special data collection efforts needed in the case of the stratified and unit weights). Nevertheless, the approximately .1 difference in correlations between the generic and case-specific weights is substantial.
This apparent advantage of using case-specific regression weights over generic unit weights is somewhat in contrast to Wainer’s (1976) equal weights theorem, which postulates that when a linear model is used for predicting scores, differences between using unit weights and optimal weights are small under certain conditions. It is far from clear, however, whether this discrepancy is due to the failure of the data of this study to conform precisely to Wainer’s somewhat narrow constraints or shortcomings of the original formulation of his theorem (see Grove, 2008, for a review of these issues). Perhaps more importantly, the observed differences in correlations—while deemed important here—were not enormous. Moreover, regardless of what weighting strategy was used, median correlations between case scores and expert rater scores were .75 or greater—indeed, even the unit weight strategy yielded a median correlation of .75. Thus, while the decline in correlations may be too great to justify using generic weights in this case, it does suggest that (a) the effort involved in identifying and quantifying the relevant components of the performance may be more important than the subtleties of how these components are aggregated and (b) despite its importance, the authors’ particular rubric may be unnecessarily detailed. This suggests that testing programs may benefit from thoughtfully balancing resources between these activities.
Although it is perhaps desirable to compare both observed and true correlations between the expert ratings and the automated case scores, without a fully crossed design, this is not possible. However, correlations between case scores and multiple-choice scores were obtained using Dataset I. Multiple-choice scores are not the ideal criterion because the two components of the exam are intended to measure related but different proficiencies. Nevertheless, because there is little reason to believe that the multiple-choice component would be sensitive to any of the same construct-irrelevant sources of variance contaminating the case scores, such correlations can still provide some useful information. Observed correlations obtained using the case-specific regression weights were nearly identical to those obtained using the generic stratified and unit weights—despite the lower reliabilities observed with the case-specific weights. This explains why the true (corrected) correlations with multiple-choice scores were equal or better using the case-specific weights. This result would appear to support the hypothesis offered above that the a priori weights may achieve higher reliability by measuring consistent but construct-irrelevant aspects of examinee performance.
Overall, the results of this research suggest two things. First, while not more reliable, case-specific weights appear to yield more valid case scores than do generic weights. Moreover, even when using case-specific weights, opportunities for efficiency gains may exist, such as collecting expert ratings on a focused sample of examinee performances as was done with the small sample regression strategy. Second, despite the important differences that were observed, the reasonably strong correlations between the case scores and the expert ratings for all five strategies suggest that given finite resources, some performance assessments may benefit from devoting more resources to rubric development than to estimating action category weights.
Footnotes
Declaration of Conflicting Interests
The authors declared no potential conflicts of interest with respect to the research, authorship, and/or publication of this article.
Funding
The authors received no financial support for the research, authorship, and/or publication of this article.