




Abstract
The development of the kernel equating (KE) method enhanced the theory of observed-score equating. In KE, discrete test score distributions are converted into continuous distributions through the use of a Gaussian kernel. Traditionally, the optimal bandwidth for a Gaussian kernel was obtained by minimizing a penalty function. In this article, an alternative bandwidth-selection approach for KE was adopted that uses cross-validation (CV) techniques. The method is illustrated through simulations that were conducted with 188 conditions by varying three factors known to influence equating results; these include sample sizes, score distributions, and methods that involve both equating and bandwidth-selection methods. Four equating procedures were considered: traditional equipercentile equating, which uses linear interpolation to make the test distributions continuous; KE with penalty functions; and KE with two newly proposed CV methods. The results were evaluated based on four criteria: bias in continuizing the distributions (i.e., the difference between the estimated and underlying score distributions), the standard error of equating (SEE), the difference between equated scores, and percent relative error (PRE). Overall, the results demonstrate that KE with the two CV methods outperformed the others—the estimated density functions were less biased and the SEEs and PREs were smaller. Equating differences between the different methods were produced, although they were not large. In addition, the bias issues surrounding kernel methods on sample sizes and the shapes of the distributions were addressed and discussed.
Keywords
Equating is the statistical process through which the test scores of examinees taking different test forms of the same assessment are made comparable to each other. Observed-score test equating is widely applicable in many operational programs because it is easier to implement and explain to the users than other methods (Kolen & Brennan, 2004; von Davier, Holland, & Thayer, 2004).
Basically, the process behind observed-score equating methods is to find a transformation of the observed scores on one test form to the observed scores on another test form for a given population of examinees (Kolen, 2006). This mapping may or may not be linear. Nonlinear transformations are usually obtained by finding an observed score on one test form that has the same percentile rank as a score on another test form. However, in the real world, such a transformation is rarely possible because the observed-score distribution on a given test form is discrete. As a solution, the observed-score equating methods approximate the discrete-score distributions with continuous distributions, and then equate with these continuous distributions (Livingston, 1993). By making the distributions continuous, it becomes possible to find a score at a given percentile in the continuous distribution. For example, in the traditional equipercentile method, the density of the distribution is spread over ±0.5 at each discrete-score point using a uniform distribution but presents the problem that the resulting continuized distribution functions are piecewise-linear functions and, therefore, results in equating functions that are not differentiable everywhere.
von Davier et al. (2004) introduced an alternative way to continuize a discrete test score distribution through the use of a Gaussian kernel function. An appealing feature of the kernel method of test equating is that it integrates separate equating techniques (e.g., smoothing of samples, distribution estimation, etc.) into a new unified framework (von Davier, 2011). The development of the kernel equating (KE) method has drawn attention from both theorists and practitioners because it enhances the theory of observed-score equating (Kolen, 2006).
The current study proposes the use of cross-validation (CV) techniques to obtain an optimal value for the bandwidth parameter in kernel density estimation. While the use of the CV method has numerous applications, the goal of this study is to apply it to the Gaussian KE. Specifically, here we are proposing an alternative bandwidth-selection method to compare with the penalty functions used by von Davier et al. (2004) for equating test scores.
Introduction to KE
The test equating process developed by von Davier et al. (2004) can be summarized into five steps. The first step is pre-smoothing. In this step, various statistical models (e.g., a log-linear model) can be used to estimate score distribution for the population from which test data are collected. The second step is to find the estimated score probabilities using the design-function transformations. The next step is continuization. von Davier et al. (2004) proposed the use of a standardized Gaussian kernel (and a penalty function) to continuize the discrete-score distribution. The fourth step is to perform equipercentile equating by using the continuous distributions from the previous step. Finally, given the kernel continuization method under the unified observed-score equating framework, a general formula for estimating the standard error of equating (SEE) is derived, which can be applied to all equating designs. The current article focuses on the third step in the framework—continuization and a proposed alternative bandwidth-selection method to compare with the penalty functions used by von Davier et al. (2004). In addition, the performance of an adjusted/scaled Gaussian kernel was examined and compared with an unadjusted kernel.
Previous Research on KE
Although KE has been recognized by researchers for successfully integrating all of the techniques necessary for observed-score equating into a new framework, questions have been raised regarding the application of this method. First, the continuization of a discrete distribution plays a dominant role in KE theory, so whether or not the choice of bandwidth derived from a penalty function(s) is optimal, is raised as a key question (Kolen, 2006; van der Linden, 2006). Specifically, in KE, the bandwidth for the density function is obtained by minimizing the penalty function:

where

and

where j is the score point, xj is the score value at the jth score point, hX is the bandwidth parameter,
Second, in the continuization step, the kernel form is modified to preserve the first two moments of the discrete-score distribution. However, the effects of such modification on the choice of bandwidth have not been fully studied (Kolen, 2006; van der Linden, 2006). The current assumption is that the optimal bandwidth comes from a kernel that guarantees that the first two moments of the continuous distribution will be the same as the first two moments of the discrete distributions. According to von Davier et al. (2004), the Gaussian kernel smoothing function of the distribution of X has a density function

where j is the score point, hX is the bandwidth parameter,

and

where x represents a score value, xj is the score value at the jth score point, and ux and
There is woefully a lack of research examining the performance of KE regarding the choice of bandwidth and the modification of the kernel form, as described above. Although some articles have covered these topics in recent years, none of them fully addressed how the choices on bandwidth and kernel form influenced equating results in terms of the bias in score distribution, SEE, equating bias, and equated score differences.
Studies have shown that the Gaussian kernel used in KE almost always performs better than the uniform kernel used in the traditional equipercentile method in terms of both bias and error (when the first part of the penalty function is used). In addition, when the second penalty function is added, KE performs better than the traditional method in terms of SEEs and in many cases, in terms of bias. All in all, the literature shows that the KE is a better choice than the traditional equating method that uses an unscaled uniform kernel (Godfrey, 2007; Lee & von Davier, 2011; Ricker & von Davier, 2007; von Davier et al., 2006). Moreover, the unscaled uniform kernel does not preserve the variance of the original distribution, and therefore, it results in continuous distributions that are biased (Holland & Thayer, 1989; von Davier, 2013; von Davier et al., 2004).
Mao, Ankenmann, and von Davier (2009) conducted a comprehensive study to investigate the SEE for KE on real data. Various factors that could impact the SEE were included. Results showed that more accurate SEEs were obtained from tests with larger sample sizes, when larger bandwidths were applied to data, or when data were smoothed with lower degree log-linear models. The limitation listed in the article was that the focus was on the SEE as a criterion of success to evaluate the performance of KE. The bias on the estimated score distribution during the continuization step was not investigated as the true distributions were unavailable. In addition, the study analyzed only the KE method, so the conclusion lacked generalizability regarding the choices of equating methods.
Cid and von Davier (2009) focused on outliers at the extreme scores in the score distributions under the assumption that kernel methods are subject to boundary bias. The authors generated one symmetric and four skewed distributions simulating different proportions of extreme scores in each. Adaptive kernel density estimation was applied as a comparison with Gaussian kernel density estimation in KE. They concluded that the outliers in the boundaries did not lead to significant differences in terms of SEEs, and the use of adaptive kernels made the estimated density functions smoother at the end points. However, no criteria were provided for the evaluation of the bias of the estimated density functions either from adaptive or Gaussian kernel estimation methods. The only reference criterion was traditional equipercentile equating. In addition, the consequences of equating (i.e., the differences in equated test scores between different methods) were not addressed. Finally, the article only focused on extreme scores.
A Proposed Optimization Method for Continuization: CV
To estimate optimal bandwidth, an error criterion, such as a penalty function, needs to be established first, and then an appropriate bandwidth-selection method should be chosen to minimize it. Numerous algorithms have been proposed in the past. One category of these algorithms is defined as “solve-the-equation plug-in” methods. These methods iterate the estimation process by using numerical routines (e.g., Newton–Raphson method) until the bandwidth estimate converges. Some examples are the Park and Marron (1987) plug-in; the Sheather and Jones (1991) plug-in; and the Hall, Sheather, Jones, and Marron (1991) plug-in. von Davier et al. (2004) also used this method to estimate the kernel density function, in particular for calculating the linear equating.
The other category is CV based, which involves partitioning a dataset into subsets, performing the analysis on one subset, and validating the analysis on the other subset. Multiple rounds of CV are performed using different partitions to reduce variability. For example, the pseudo-likelihood CV method (Habbema, Hermans, & van den Broek, 1974) was aimed at maximizing a pseudo-likelihood function established by a density function to get optimal bandwidth. Least-square CV (Bowman, 1984; Rudemo, 1982) was proved to be an unbiased CV method. This method is commonly used because it is asymptotically optimal under very weak conditions (Hall, 1983; Stone, 1984). Chiu (1991) improved this method to avoid the sample variation problem, which limits the stability of traditional least-square CV. Smoothed CV (Hall, Marron, & Park, 1992) has been presented as the best method, but it imposes limitations on the estimated density function, which can only be applied to pre-smoothed data. The proposed CV method in this article belongs to this category. The difference between the proposed method and traditional methods is that the goal of the new method is to maximize a Poisson-likelihood function to obtain the optimal bandwidth.
The literature indicates that there is no clear answer on which bandwidth-selection method is the best. The choice of bandwidth-selection methods depends on the density function that is estimated. A new optimization method, CV, is being proposed for the continuization step in KE and addresses the two questions raised before. First, regarding the choice of an optimal bandwidth, the CV method obtains the optimal bandwidth by maximizing a Poisson-likelihood function established through CV between two subsamples. Because we know that the score distribution is a discrete probability distribution, we can use the Poisson distribution to establish the likelihood function, and therefore, the different Poisson errors associated with the score frequencies at different score points can be taken into account when estimating optimal bandwidth, which is different from an optimization approach in continuization by applying penalty functions (von Davier et al., 2004). Second, CV with and without the adjustment of the moments on the kernel form were compared to show the necessity of preserving the moments of data in the continuization step.
The steps for obtaining the optimal bandwidth from the CV method follow:
Step 1. Split one sample into two random subsamples.
Step 2. Use one subsample to compute a set of Gaussian kernel densities.

where j is the score point,

where x represents a score point, xj is the score value at the jth score point, and h is the bandwidth. At this step, as the unknown parameter is h, a range of h (e.g., 0.01-5 with an increment of 0.01) is set up. Correspondingly, there will be a density value at each score point for each given h.
Step 3. Because frequency is a number of counts which follow a Poisson distribution, the CV process can be implemented through the Poisson probability function below:

The density value at each score point from a given h from the subsample 1 in Step 2 is plugged in as λ, and k is the frequency at each point obtained from the subsample 2.
Step 4. For each h at each score point, there is a Poisson probability value. The likelihood function is formed by multiplying the probability values at all score points. For computational convenience, the natural logarithm of the likelihood is taken. The h that corresponds to the largest likelihood is the “optimal” one. Note that to avoid the effects from different splits of the sample into two subsamples, Steps 1 through 4 were replicated 1,000 times and the median h value was taken as the final “optimal” bandwidth.
Method
The purpose of the simulation study was to compare the performance of KE using penalty functions in continuization and KE with the newly proposed CV methods, with two different test forms, with and without the first two moments adjusted. In addition, the traditional equipercentile equating method was included for comparative purposes.
Data
Without a loss of generalizability, equal sample sizes for both test forms were simulated under a random-groups design. The score range of each test form was between 0 and 20. Other than equating methods, the shapes of score distributions and the sample sizes were also considered as factors, which could affect the choice of optimal bandwidth and the equating results. The simulated data were generated from a beta distribution, which was used as the true/population distribution. In particular, symmetrical (a = 5, b = 5), positively skewed (a = 2, b = 5), negatively skewed (a = 5, b = 2), and mixture (combination of a = 25, b = 15 and a = 15, b = 25) distributions were generated as the true population distributions, and 500 pairs of random samples with sample sizes of n = 200 and n = 2,000 were generated per test form. These sample sizes and shapes are representatives of those seen in testing practice. Moreover, to focus on the kernel density estimation in the continuization step, the pre-smoothing step from the KE framework was not applied to this study.
Procedure
A FORTRAN program was developed to conduct the CV procedure, density function estimation, and equating. The KE procedure that applies penalty functions to continuization and traditional equipercentile equating were implemented through computer programs by Wang (2005) and Hanson (2005), respectively. There were 128 conditions (4 methods × 16 pairs of score distributions on two test forms × 2 sample sizes) analyzed. In addition, in the bias-by-sample study, 60 additional conditions (4 methods × 3 score distributions × 5 sample sizes) were added to produce the bias-by-sample plot for each distribution. For each condition, 500 replications were conducted.
Criteria
Bias in the distributions and SEE were adopted as the two primary criteria to investigate the two sources of error in equating: systematic error and random error. To assess bias at each score point, the mean of 500 replications of the differences between the estimated and true densities was calculated:

where xi is the score point,

where

Other than the two criteria mentioned earlier, we used the percent relative error (PRE; von Davier et al., 2004) to evaluate bias in equating functions by comparing the moments of the distributions on the original test form and the equated scores of the new test form. Details on PRE definition are given in the supplementary file.
The equating difference (EDIFF) was added to judge the consequence of method differences. It was computed by taking the mean over 500 replications of the absolute difference between the two equated scores from a pair of methods (

Results
The major findings are summarized in the order of the evaluation criteria: bias, SEE, PRE, and the EDIFF. Note that if any two plots from positively and negatively skewed distributions have symmetric patterns, only the former is displayed. Different degrees of skewness are not of interest in this article. The descriptive statistics of the bandwidths from each kernel method are reported in the supplementary file.
Bias
In Figure 1, the true density functions for the three score distributions (symmetric, skewed, and mixture distributions) obtained from the beta distribution are displayed.

True score distributions.
Figure 2 displays the bias between the “true” distribution (simulated) and the estimated density function based on the four methods with different sample sizes and score distribution shapes. Note that even for the smallest sample size of 200, the bias is extremely small; no more than 0.02 at each score point.
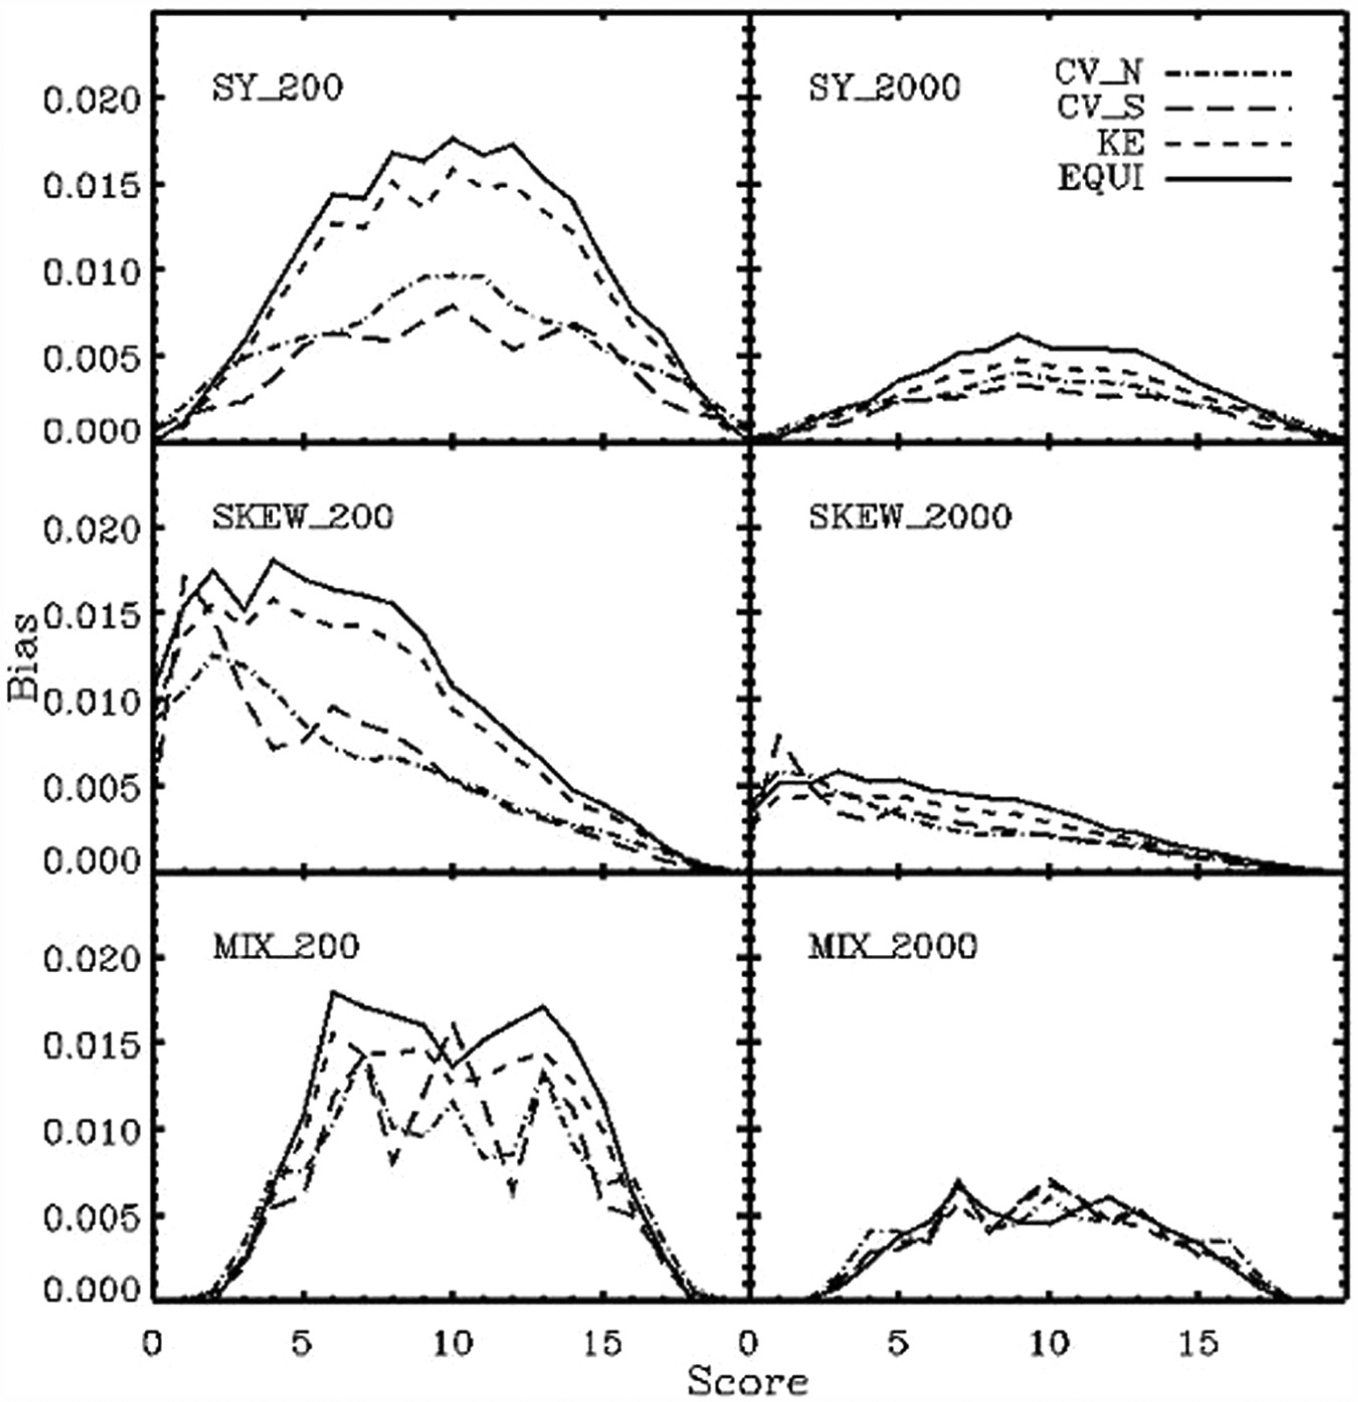
Bias for each distribution for sample sizes 200 and 2,000.
The plots indicate that as sample size increases from 200 to 2,000, the bias decreases for all four methods, regardless of the shapes of the score distributions. It shows that KE with CV consistently produces the lowest bias as compared with other methods, for all score points except those at the extremes, where there are few data. This pattern is common for all equating methods (Cid & von Davier, 2009). Finally, when the score distribution is symmetrical, KE with CV with the adjustment of the first two moments performs better than that without the adjustment. The two CV methods show a similar overall bias when the distributions are asymmetrical, although the patterns are different at different score points.
Figure 3 further explores the relationship between bias and sample size with different score distributions. In Figure 3, we summarize the information from Figure 2 into three bias-by-sample graphs for the three score distributions, so in each distribution, biases at all score points are aggregated by method and sample size. We concluded that when the sample size increases, the bias decreases for all four methods in all three score distributions; and that the performance of the four methods differs when score distributions are different. In a symmetric distribution (SY), KE with CV with the consistent adjustment of the first two moments has the lowest amount of bias. KE with CV without moment adjustment shows less bias than KE with penalty functions with sample sizes that are smaller than 2,000. The traditional equipercentile method has the largest amount of bias in all sample sizes. With a skewed distribution, the two CV methods show less bias than does traditional KE with penalty functions when the sample size is smaller than 2,000. The traditional equipercentile method still has the most bias for all of the sample sizes. In a mixture distribution, the traditional equipercentile method produces less bias when the sample size is larger than 2,000; again, the amount of bias is very small.

Bias as a function of sample sizes.
Standard Errors of Equating
The SEEs for each condition are reported in Figure 4. As the sample size increases, the SEE decreases for all conditions and the differences between the methods are reduced. KE with the two CV methods show similar SEEs, which are smaller than those of KE with penalty functions. Finally, all three kernel methods show smaller SEEs than the equipercentile method for all score points except for the extreme scores, where the two kinds of equating methods are not directly comparable because of the artificial treatment of the equated extreme scores in the traditional equipercentile equating. Therefore, the SEE over 500 replications is very small at those score points. However, within the framework of KE, because a Gaussian kernel is used for the continuization and the score scale is extended from negative infinity to positive infinity, there will almost always be variability at the extreme scores, so the SEEs can be large at those points.
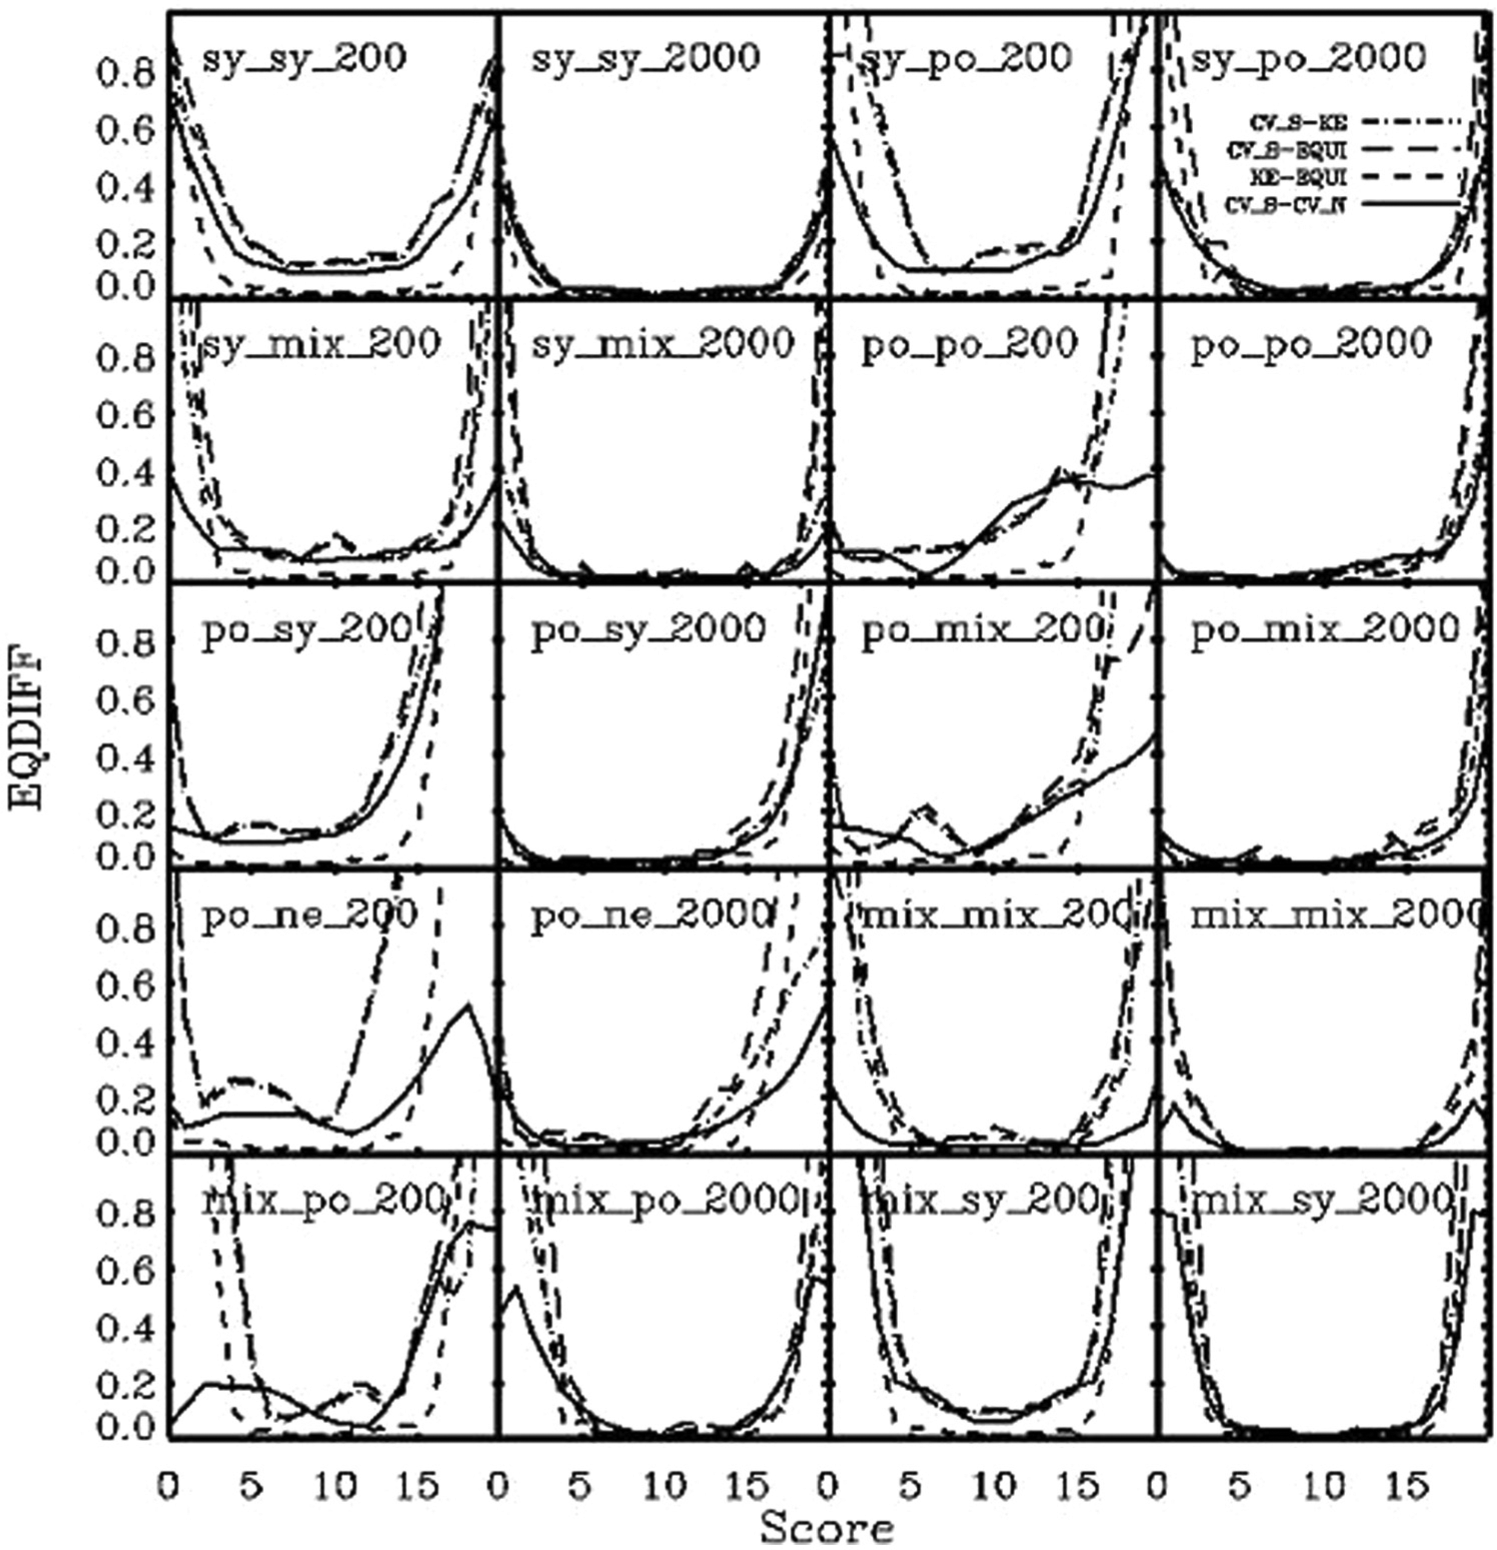
SEE for sample sizes of 200 and 2,000.
PRE
Detailed discussions on PRE results can be found in the supplementary file. In summary, all kernel methods produced similar PREs, although CV methods in general had slightly smaller values.
EDIFF
In Figure 5, we display the EDIFF at each equated score between methods. The results indicate that as the sample size increases, the EDIFF decreases. The two CV methods produced different equated scores in comparison with each other and to other methods. The difference between KE with penalty functions and the traditional equipercentile equating is consistently the smallest under all conditions. Finally, EDIFF between methods is smaller than “a difference that matters” (Dorans & Feigenbaum, 1994), which in this case is of half a point. However, at the extreme ends of test scores, the EDIFF can be more than one score point, but as mentioned before, such differences are due to the artificial treatment of equated extreme scores in the traditional equipercentile equating, which is not the focus of the article.
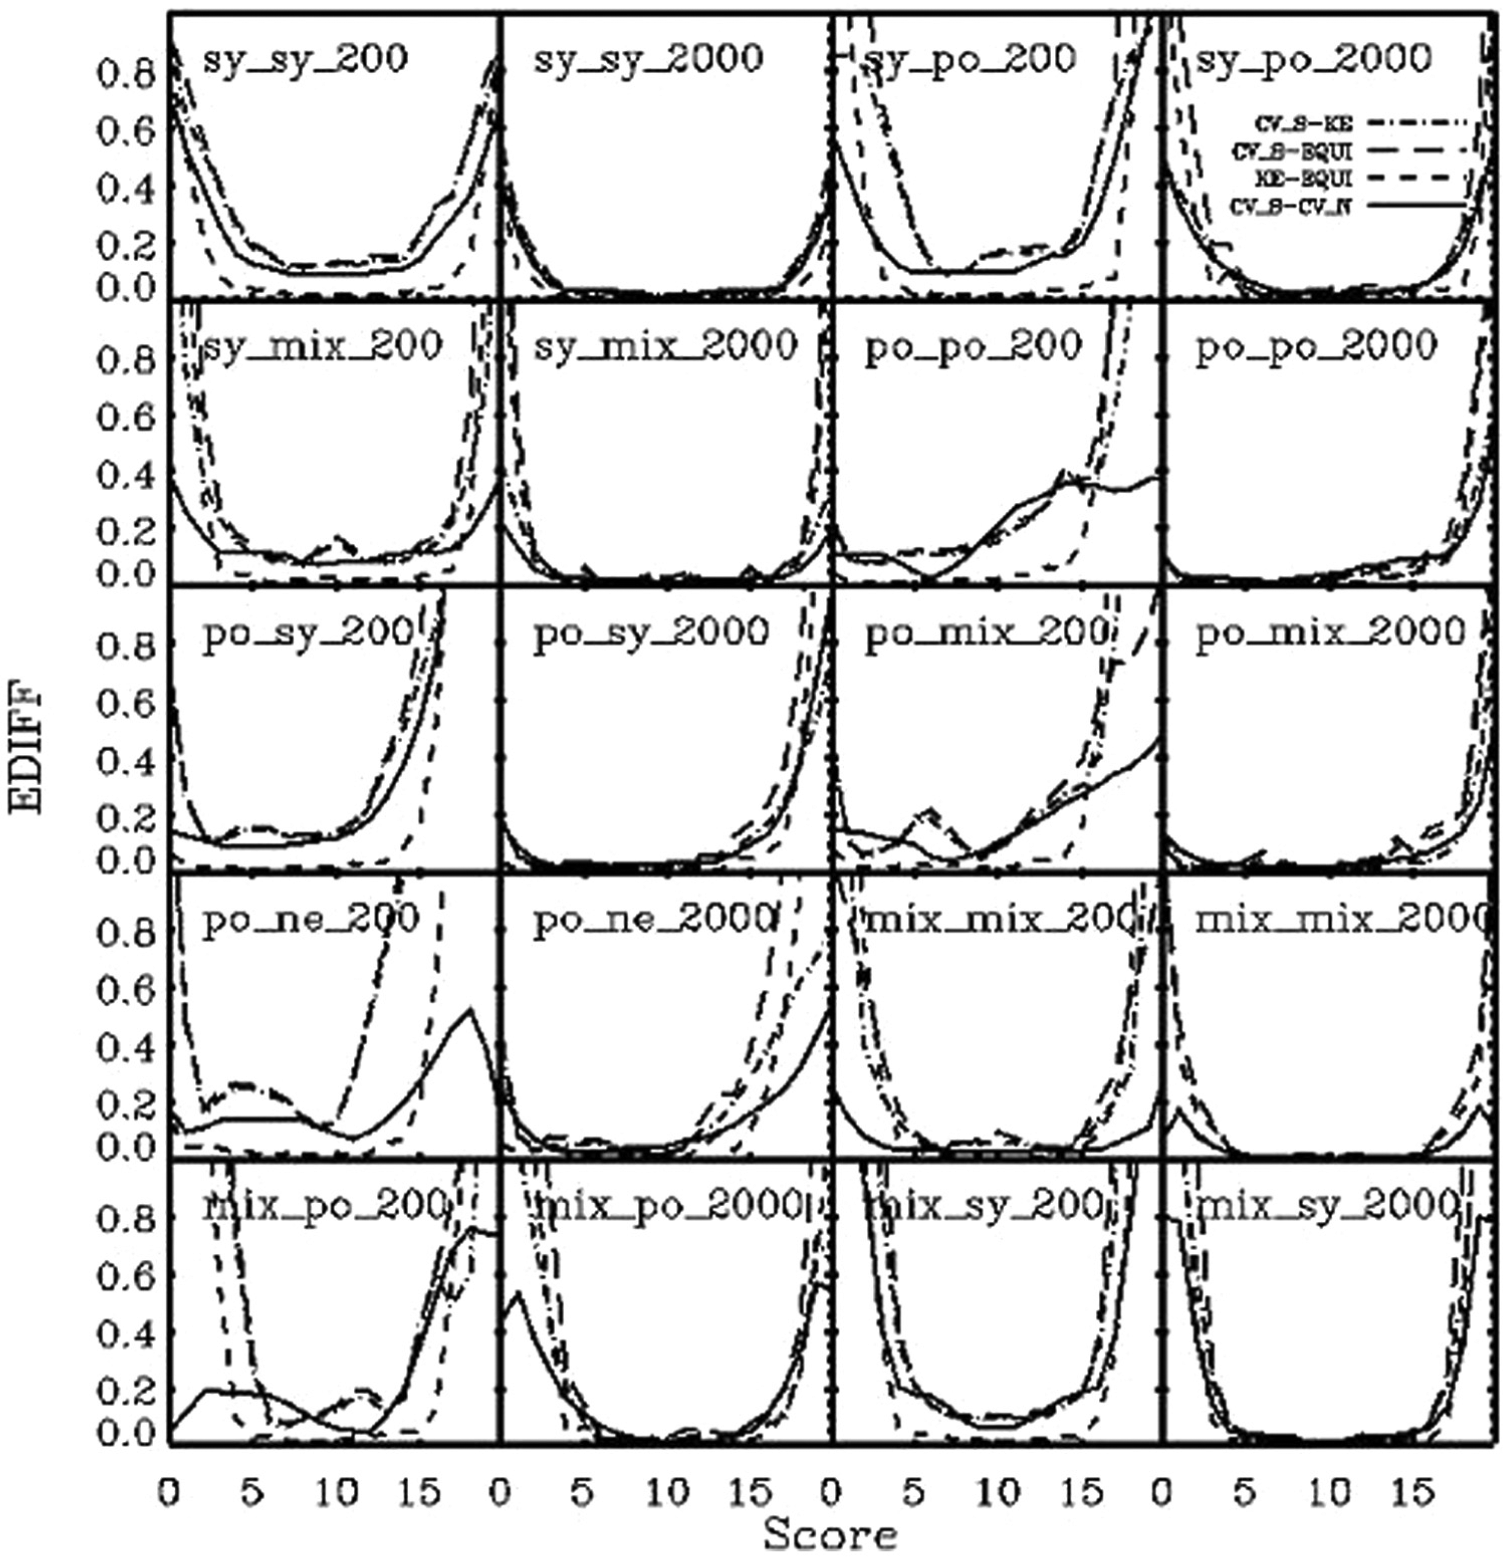
EDIFF between methods for sample sizes of 200 and 2,000.
Discussion and Conclusion
A newly proposed method, CV, was examined in this study as an alternative bandwidth-selection method of continuization under KE. It differs from the use of penalty functions mainly in that it takes into account the Poisson probabilistic meaning of the data to estimate the optimal bandwidth. In addition, when the score distribution is symmetric, CV with the preservation of the first two moments of data yields the most accurate estimated density function.
The purpose of the study was also to investigate the performance of KE with CV by comparing it with other methods—KE with penalty functions and the traditional equipercentile equating in the context of random-groups design. In the simulations, the new method outperformed the others by producing lower bias and a smaller SEE. Consequently, the low bias affects the equated scores, and thus creates EDIFF between the new methods and the previous equating methods (for most of the scores).
The findings from the study of the bias in the estimated densities indicate that the amount of bias is influenced by sample size. As the sample size increases, the bias decreases. It is also influenced by the shape of the score distribution. The bias from SYs is smaller than that from asymmetrical distributions. A third factor that impacts the bias is the method used to continuize the distributions. Given the methods compared in the study, in SYs, KE with CV with an adjustment of the first two moments is better than without an adjustment. As the sample size greatly increases and when the score distribution is bimodal, the traditional equipercentile method appears to be slightly better than the kernel methods, and although there is bias, it is very small and without any practical consequences. Overall, the conclusion is that under the KE framework, KE with CV is slightly better than KE with penalty functions in producing an unbiased density estimation. However, in large sample sizes this bias would have a very trivial amount of influence on the SEEs and equated scores, as illustrated in Figures 4 and 5 where the differences between them were very small for a sample size of 2,000. The findings of the SEE study highlight that the same factors that impact bias also influence the SEEs.
PRE is a measure of bias in equating functions. As the number of moments increases, the PRE values increase. CV methods in general had slightly smaller values than KE with penalty functions. As for the EDIFF in equated scores, the differences are smallest between KE with penalty functions and the traditional equipercentile equating among all of the comparisons. Note that EDIFFs are very small for most score points (not including extremes) between the different methods.
Although the proposed method is promising, there are still issues that need to be addressed in future research. An analytic method needs to be derived that computes the SEE in KE with CV. The current study employs a bootstrap method to calculate the SEE because the analytic method in KE with CV has yet to be developed. This should be considered a part of development plan for KE with CV. Second, it would be desirable to investigate the performance of KE with CV under other equating designs besides a random-groups design, such as a nonequivalent-groups-with-anchor-test (NEAT) design, which is commonly used in many testing programs. Finally, in the current study, pre-smoothing is not considered. In traditional equipercentile equating, the literature has documented the advantages of pre-smoothing on reducing random errors, especially for small sample sizes (Hanson, Zeng, & Colton, 1994; Kolen, 1984, 1991). It would be worthwhile to add a pre-smoothing process in KE with CV for future research.
Footnotes
Acknowledgements
The authors are grateful to Ms. René Lawless for her editorial suggestions.
Authors’ Note
The opinions expressed in this article are those of the authors and not necessarily of Educational Testing Service.
Declaration of Conflicting Interests
The author(s) declared no potential conflicts of interest with respect to the research, authorship, and/or publication of this article.
Funding
The author(s) received no financial support for the research, authorship, and/or publication of this article.

References
Supplementary Material
Please find the following supplemental material available below.
For Open Access articles published under a Creative Commons License, all supplemental material carries the same license as the article it is associated with.
For non-Open Access articles published, all supplemental material carries a non-exclusive license, and permission requests for re-use of supplemental material or any part of supplemental material shall be sent directly to the copyright owner as specified in the copyright notice associated with the article.
