Previous research has considered sequential item response theory (SIRT) models for circumstances where examinees are allowed at least one opportunity to correctly answer questions. Research suggests that employing answer-until-correct assessment frameworks with partial feedback can promote student learning and improve score precision. This article describes SIRT models for cases when test takers are allowed a finite number of repeated attempts on items. An overview of SIRT models is provided and the Rasch SIRT is discussed as a special case. Three applications are presented using assessment data from a calculus-based probability theory course. The first application estimates a Rasch SIRT model using marginal maximum likelihood and Markov chain Monte Carlo procedures and students with higher latent variable scores tend to have more knowledge and are better able to retrieve that knowledge in fewer attempts. The second application uses R to estimate growth-curve SIRT models that account for individual differences in content knowledge and recovery/retrieval rates. The third application is a multidimensional SIRT model that estimates an attempt-specific latent proficiency variable. The implications of SIRT models and answer-until-correct assessment frameworks are discussed for researchers, psychometricians, and test developers.
The increasing administration of assessments in a computerized environment provides opportunities to measure latent traits with greater precision. Traditionally, student assessments consisted of examinees submitting a single response to a succession of questions, but a significant body of educational research has also studied the implications of allowing examinees multiple attempts on items (e.g., answer-until-correct test administrations; Pressey, 1926). Course management systems and existing assessment technology enable educators to easily collect additional data related to student assessments, such as response times and the number of tries students require before submitting a correct answer. There are a variety of potential benefits associated with allowing students repeated attempts on items. For instance, providing examinees multiple attempts could reduce test anxiety (e.g., Attali & Powers, 2010; DiBattista & Gosse, 2006) and subsequent feedback (or “knowledge of results” as coined in prior literature) can promote learning (e.g., Epstein, Epstein, & Brosvic, 2001; Hanna, 1976; Plowman & Stroud, 1942; Prestwood, 1979; readers are directed to Balch, 1964, and Kluger & DeNisi, 1996, for reviews of the learning benefits of feedback during testing).
The study of repeated attempts has been of interest for psychomotor tasks and for cognitive tasks. Prior applications involving repeated attempts data have some methodological limitations for cognitive applications. Prior psychomotor research (Looney & Spray, 1992; Looney, Spray, & Castelli, 1996; Spray, 1990) employed a sequential Rasch model where the probability of success on a task was treated as independent and constant (i.e., invariant) over repeated attempts. The assumption of identical probabilities of success over attempts is unlikely to be met for cognitive assessments where receiving feedback about an incorrect response can help students correct mistakes in high-stakes testing settings or in classroom assessment situations where students may be allowed to use other materials (e.g., books, notes, or videos) to supplement their content knowledge levels.
Furthermore, prior educational research using the answer-until-correct assessment framework (e.g., Attali & Powers, 2010; Hanna, 1975, 1977) analyzed observed scores by assigning partial credit based on the attempt a correct response is first recorded. If denotes the maximum number of attempts allowed, the answer-until-correct score is if the first correct response was recorded on attempt . There are conditions where observed scores are more reliable than IRT estimates (Culpepper, 2013); however, Hemker et al. (2001) demonstrate that continuation ratio IRT models do not satisfy monotonicity of the likelihood ratio and stochastic ordering of based on the observed score. Consequently, rankings based on observed polytomous scores are not reflective of rankings based on the latent variable and subsequent analyses of observed scores to test hypotheses about latent achievement is subject to inaccuracies.
In contrast, Attali (2011) and Muñiz and Menéndez (2011) employed polytomous IRT models to analyze repeated attempts on cognitive items where an incorrect response on all attempts earned a score of zero and a correct response on the first attempt was assigned the largest ordered category score. The graded response model (GRM) is able to adjust for item difficulty from attempt to attempt, but the application of the GRM to sequential data has at least two drawbacks. First, employing a polytomous IRT model to analyze repeated attempts results in misspecification error (Akkermans, 2000) unless the GRM is employed with an extreme value distribution for the probability of a success (Bechger & Akkermans, 2001). Second, a routine application of a polytomous IRT model does not capitalize on the nature of the repeated attempts from the perspective of discrete-time survival analysis (Albert & Chib, 2001). For instance, a routine application of the GRM cannot account for potential individual differences in success rates over repeated attempts. That is, some individuals may be able to retrieve information with less feedback (i.e., in fewer attempts). For instance, consider two students who have the same latent achievement , but Student A has better retrieval (or recovery) skills than Student B. We expect Students A and B to have similar performances on the first attempt, but Student A has a higher value of and, as shown in this article, will likely require fewer repeated attempts to report a correct answer.
The purpose of this article is to provide readers with an overview of SIRT models and to present several applications using item responses from classroom assessments. The first section introduces SIRT models for the case where test takers are provided chances to correctly answer each item and provides an overview of the Rasch SIRT model. The second section presents three applications of the SIRT model with data from a calculus-based probability theory course. The first application estimates a SIRT model that includes attempt-specific parameters to account for the fact that responses may have different probabilities of success over repeated attempts. The second application introduces an additional subject random effect that captures individual differences in retrieval/recovery skills, whereas the third application is a multidimensional SIRT model that estimates an attempt-specific latent proficiency variable for subjects. The final section discusses the implications of SIRT models for educational testing and research, provides concluding remarks, and offers directions for future research. The Online Appendix includes discussion regarding Rasch SIRT item response and information functions and a goodness of fit index, in addition to supporting tables and results from a simulation study that shows that incorrectly assuming the probability of success is identical over attempts systematically biases item difficulty parameters.
SIRT Model for M Repeated Attempts
The following discussion presents an overview of prior results pertaining to SIRT models (e.g., Akkermans, 2000; Tutz, 1990). Let be the number of attempts individual ( = 1 to ) requires to submit a correct answer on item ( = 1 to ) and let denote the maximum number of attempts afforded to test takers to correctly answer item . Let be a sequence of Bernoulli trials that equal zero or one depending on whether examinee correctly answers item on attempt . For instance, if the maximum number of attempts is and examinee recorded a correct response on item on the second attempt where “” denotes missing responses following a correct response and an incorrect response on all four attempts yields .
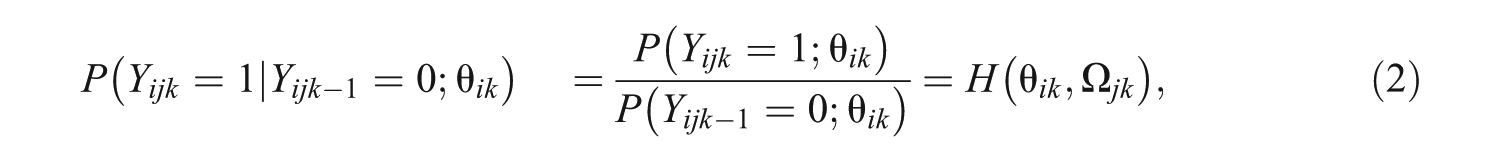
The sequential nature of the answer-until-correct framework implies that the s are dependent observations. For instance, the conditional probabilities of an incorrect response on attempt given responses on attempt for all are
where is the level of subject ’s latent trait on attempt . Consequently, the probabilities of correct and incorrect responses for attempt given failure at is
where are parameters for item on attempt , and is an arbitrary cumulative distribution function.
Note that attempt invariance is satisfied whenever the subject and item parameters are constant over attempts such that for all . Responses to cognitive exams likely violate attempt invariance because the cognitive processes that underlie answers to items are unlike tossing a coin independently. Items become easier if increases over attempts or if item difficulty parameters decline over attempts. For example, items may be easier in cases where students are allowed to supplement their levels by using other notes or resources or when there are a finite number of strategies that students are able to successively eliminate:
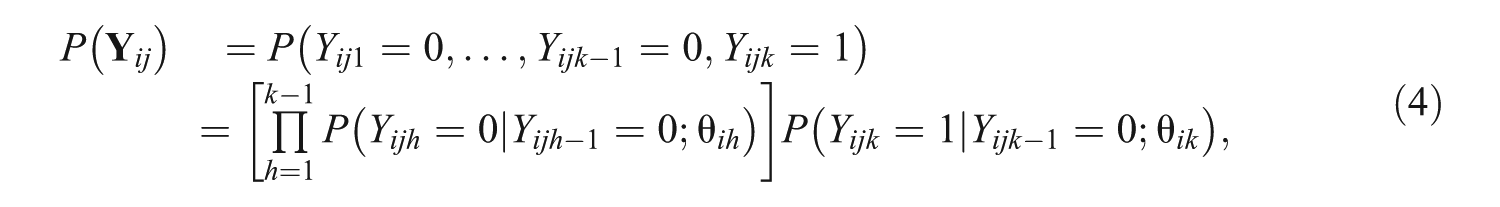
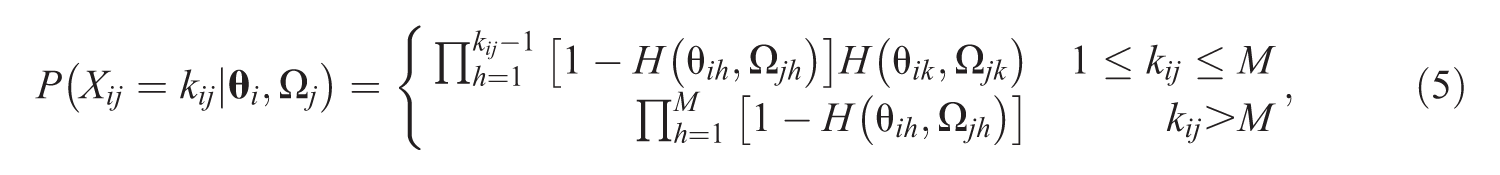
where . Let , where is a function that indicates the number of attempts subject uses before recording a correct response on item . The probability mass function for is
where and are subject latent traits and item parameters, respectively, for each attempt . The model in Equation 5 is an example of Type I censoring (Bartholomew, 1963) where some students will not record a correct response by the attempt (i.e., ). In fact, Equation 5 shows that the probability of an incorrect response on all attempts is .
Parameter Estimation
The likelihood of observing a sample of n test takers’ attempts to J items is
where is an by matrix recording the number of responses required by each individual on the items, is an by dimensional matrix of attempt-specific latent traits, and is a matrix of item parameters.
There are several strategies for estimating the parameters in Equation 6. For instance, item and attempt parameters can be estimated via marginal maximum likelihood (MML) by integrating over . In fact, this article reports results from three applications that employ MML to estimate the parameters in Equation 6 with existing nonlinear multilevel modeling functions in R (e.g., the glmer function in the lme4 package; Bates, Maechler, Bolker, & Walker, 2014).
Alternatively, a Bayesian strategy can be implemented to estimate the item and person parameters by specifying priors for and . Albert and Chib (2001) developed a MCMC algorithm using augmented variables to estimate parameters of the Rasch SIRT model described in the next subsection. The first application estimated the Rasch SIRT model with attempt invariant person parameters (i.e., for all ) using MCMC to simulate values from parameter posteriors with priors of and for item locations.
Demonstration of the Rasch SIRT Model
The purpose of this subsection is to demonstrate the SIRT model by discussing the most simple Rasch SIRT model. For the Rasch SIRT model, is defined as a logistic function with attempt invariant examinee parameters (i.e., for all ) and attempt-specific locations or thresholds defined as
where is the difficulty parameter for item and is an attempt parameter that is constant over items. captures the general tendency of items to become easier or more difficult over attempts. In fact, and for all whenever the probability of success is unrelated to the number of attempts required to achieve a correct response. Stated differently, let and (where is an dimensional vector of zeros) occurs when attempt invariance is satisfied for the Rasch SIRT. A monotonically increasing sequence of implies that test takers are more likely to correctly answer items with each additional attempt. For example, can be expected to be monotonically increasing in cases where students are allowed to supplement their levels by using other notes or resources or in situations where there are a finite number of strategies that students are able to successively eliminate. Moreover, can take on other patterns depending on the test setting. For instance, high-stakes examinations could be characterized by a sequence that initially increases as examinees search for the correct strategy and sharply declines for latter attempts once the strategy set has been exhausted.
The probability that individual correctly answers item on attempt ( = 1 to ) given an incorrect response on attempt is
where . The Rasch SIRT probability mass function for the number of attempts made by examinee on item given the parameters is
where if the correct response occurs within the attempts (i.e., if ) and zero if the correct response occurs on a later response (i.e., ). Note that for the Rasch SIRT model that can be interpreted as a measure of student content knowledge and the ability to retrieve that knowledge, because students with higher values will be able to answer more difficult problems with fewer attempts.
SIRT Applications
This section presents three applications using data from students enrolled in a calculus-based probability theory course. Students completed homework assignments using an online course management system and were provided a maximum of opportunities to submit a correct response to items assessing knowledge of probability. Note that the course assessment data were a low-stakes assessment in that students were allowed to supplement their first-attempt content knowledge with other course materials, so we can expect that students’ evolve over time in ways that may be less likely in high-stakes testing. The first application reports results from a Rasch SIRT model described earlier, whereas the second application fit a model where students’ latent traits change linearly over attempts. The third application presents a multidimensional SIRT model that estimates a subject latent proficiency variable for each attempt. Examples of R code using MML with simulated data are included as an Online Appendix.
Application 1: Rasch SIRT Model
The Online Appendix presents the item parameters using MML (via the “glmer” function in the lme4 R package) and a Bayesian MCMC approach with normal priors for person and item parameters and an uninformative prior for attempt parameters as discussed above. Furthermore, parameter values were drawn from the posterior distributions using a Gibbs sampling strategy with a slice sampler (Neal, 2003). The estimated posterior mean and variance of was estimated as and . Furthermore, the items tended to be relatively easier and located in the lower portion of the latent distribution (i.e., ) with some variation as evinced by . The estimated MML and MCMC item difficulty parameter estimates were similar and within sampling error with a correlation of 0.9998.
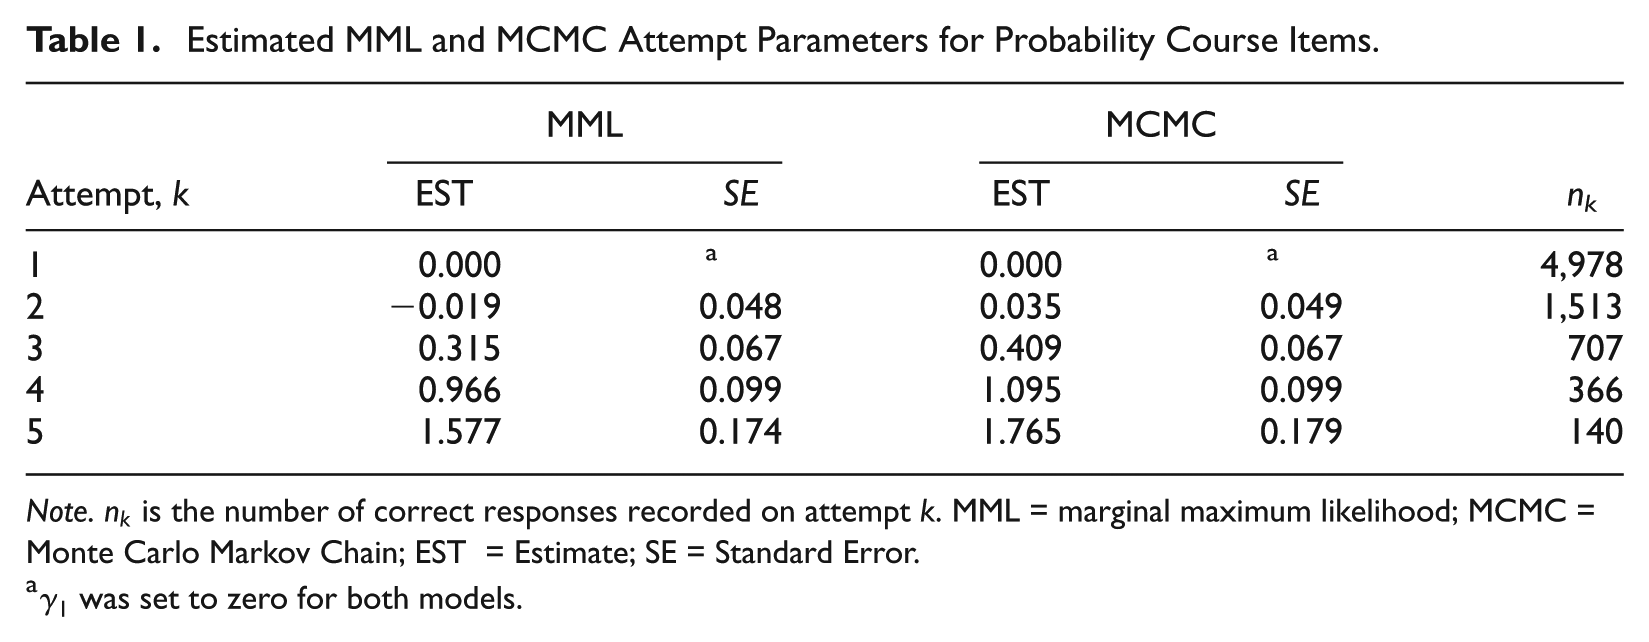
Table 1 reports the MML and MCMC estimates for the five attempt parameters. The posterior means for the second- through fifth-attempt parameters were 0.04, 0.41, 1.09, and 1.77, respectively. The evidence in Table 1 suggests that the third-, fourth-, and fifth-attempt parameters differed from zero at the 5% level. One implication is that students’ responses on the first two attempts exhibited a similar probability of a correct response. The monotonically increasing pattern of for Attempts 3, 4, and 5 provides evidence that students were more likely to submit a correct answer with each subsequent attempt, which is consistent with the fact that students were able to supplement their levels with other materials.
Estimated MML and MCMC Attempt Parameters for Probability Course Items.
Note. is the number of correct responses recorded on attempt . MML = marginal maximum likelihood; MCMC = Monte Carlo Markov Chain; EST = Estimate; SE = Standard Error.
was set to zero for both models.
Application 2: Two-Dimensional, Growth-Curve SIRT Model
The Rasch SIRT model assumes attempt invariance for person parameters. Students could change with each attempt and one way to account for a dynamic is to introduce a latent variable that accounts for individual differences in retrieval/recovery rates. For example, students enrolled in the probability theory course were allowed repeated attempts at homework problems and could make use of additional materials to supplement their first-attempt content knowledge. In this instance, we can expect students’ latent variables to change over attempts. The growth-curve SIRT model discussed in this subsection can be used by researchers to test hypotheses concerning the influence of educational interventions on student content knowledge by evaluating the extent to which evolves over attempts.
The application in this section considers two models for . The first model specifies a linear relationship between and :
where , is an attempt invariant indicator of content knowledge (i.e., an intercept when = 0) and captures the amount of growth or recovery student tends to make over repeated attempts across all items. Students with larger values are expected to retrieve information in fewer attempts.
The second model is a piecewise linear model. In particular, the results in Table 1 provided evidence that, in aggregate, students’ first two attempts satisfied attempt invariance, which implies that it could be more appropriate to model a trajectory for that constrains and allows the remaining to increase linearly. That is, the second model is defined as
where for and otherwise. for the second model is interpreted as the rate of recovery/retrieval that students make following two incorrect attempts. The interpretation for Equation 11 is consistent with students’ assessment experience where they use content knowledge on the first two attempts and, after two incorrect answers, retrieve the correct answer by either correcting mistakes or supplementing their content knowledge with class materials.
It is important to make a few observations about Equations 10 and 11. First, the Rasch SIRT bundles and into one latent variable, whereas Equations 10 and 11 parse these latent variables, because it is possible that students differ in content knowledge and the ability to retrieve knowledge or recover from an incorrect response. Second, Equations 10 and 11 include linear functions of the attempt number (i.e., ) to model , but it is important to note that higher order polynomials or nonlinear functions of could be specified to describe the change in over attempts. One alternative explored in the next section is to allow students to have different (i.e., one for each attempt).
The two-dimensional SIRT models with and in Equations 10 and 11 were estimated using the glmer function of the lme4 package (e.g., see De Boeck & Partchev, 2012). The Akaike information criterion (AIC) and Bayesian information criterion (BIC) fit indices for the Rasch SIRT equaled 15,397 and 15,635, respectively, and were larger than the fit indices for both growth-curve SIRT models, which provides evidence that allowing for individual differences in over attempts provided a better fit than including attempt-specific parameters that adjust for changes in item difficulty. As noted earlier, the improvement in fit of the two-dimensional models was expected given that the assessment was low-stakes in nature and students supplemented their levels. AIC and BIC indices also provided evidence that the piecewise linear model in Equation 11 provided a better fit than the linear model in Equation 10. The AIC and the BIC for the linear model were 15,115 and 15,345, respectively, and the fit indices for the piecewise linear model were 15,063 and 15,294, respectively. Consequently, the remainder of this subsection describes the results from the second model.
The estimated means and variance–covariance matrix for and in the piecewise linear model were
The individual differences in the first- and second-attempt latent trait (i.e., ) had a mean of zero and shows that the estimated standard deviation of was 0.486. The estimated expected value of equaled 0.489, which provides evidence that tended to increase, on average, by 0.489 following incorrect answers on the first and second attempts (i.e., about a standard deviation increase on the scale, on average, for each attempt). Furthermore, shows evidence of individual differences in recovery/retrieval following two incorrect answers with a standard deviation for equal to 0.26.
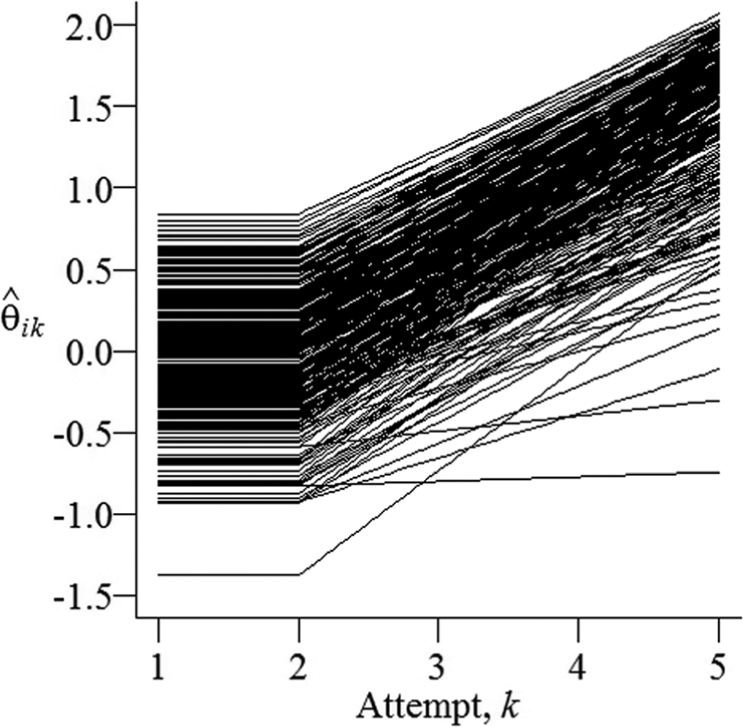
Figure 1 presents a plot of across attempts and shows increasing trends in for and a modest fanning pattern where variability in declines for larger numbers of attempts. Figure 1 provides an indication of the estimated distribution of for different values of . Figure 1 shows for most students, which is consistent with the fact that most students submitted a correct response by the fifth attempt. For instance, Figure 1 illustrates that some students with (i.e., one standard deviation below the mean) have approaching 1.0 (i.e., roughly two standard deviations above the first- and second-attempt mean). That is, students with lower values were able to supplement their first- and second-attempt content knowledge with other materials and their fifth-attempt content knowledge levels resembled that of other students with values that were two standard deviations above the mean. provides evidence of a small negative correlation between and equal to −0.206, which suggests that some students with larger first- and second-attempt latent traits (i.e., ) tended to have (or require) smaller retrieval rates to eventually correctly answer questions.
Piecewise linear plots of by attempt number, , for an application of the multidimensional SIRT model to classroom assessment data.
Application 3: Saturated Multidimensional SIRT Model
The third application considers a saturated multidimensional model that estimates subject latent proficiency variables for each attempt, . The R glmer function was employed to incorporate attempt-specific random effects, in addition to item and attempt fixed effects. The saturated multidimensional model provided a better fit in comparison with the aforementioned models as indicated by AIC and BIC values of 14,058 and 14,401, respectively. The estimated means and variance–covariance matrix for are reported below:
provides evidence that increased in a pattern similar to the piecewise model where and . also provides evidence regarding the variability and interrelationships among the . The variance of tended to increase with attempts, and there was evidence that the correlations decayed over attempts. For instance, the correlations between and , and and were .096 and .037, which provides evidence that the first-fourth-and fifth-attempt proficiency levels were nearly independent given that students were free to supplement their first-attempt content knowledge. Note the large variance for (i.e., 3.669) is likely attributed to the fact that relatively fewer students needed five attempts to record a correct answer. Table 1 shows that 97.3% of correct responses were recorded prior to the fifth response. A more parsimonious model may be preferred to avoid over-fitting the data, and additional research is needed.
Discussion
This article demonstrated the utility of the SIRT model for cognitive assessments. This section highlights the contributions of this study to the literature, describes benefits of the SIRT framework, and offers directions for future research.
First, there is a long-standing area of educational research concerned with documenting the learning benefits associated with the answer-until-correct framework. Prior educational research on the benefits of providing students and test takers feedback suffered from methodological limitations related to analyzing total scores or using misspecified polytomous IRT models. This article demonstrates how researchers can use SIRT models with open-source statistical software to estimate models that differ in complexity and/or the number of latent variables. The first application presented an example of the Rasch SIRT model where attempt-specific parameters were introduced as a strategy to account for changes in the probability of success over repeated attempts. The second application demonstrated how researchers can model changes in the latent trait over repeated attempts by parsing the latent domain into a first-attempt content knowledge trait and a recovery/retrieval trait. The third application demonstrated a fully saturated multidimensional SIRT model with attempt-specific latent variables.
Second, researchers in the cognitive sciences could benefit from the SIRT models described in this article. Recent cognitive psychological research has examined the benefits of retrieval-based activities on student learning and the model developed in this article can be a useful tool for such inquiries. For example, experimental studies in cognitive psychology have renewed interest in the benefits of feedback during assessments by demonstrating that students who practice retrieving knowledge on multiple-choice items outperform those who employ elaborative studying and concept mapping in terms of overall comprehension and the ability to make inferences (Grimaldi & Karpicke, 2012; Karpicke & Blunt, 2011; Karpicke & Grimaldi, 2012). Additional research has documented the value of feedback regarding errors students make when practicing retrieval-based activities (Huelser & Metcalfe, 2012), which implies that there may be additional educational value in providing students repeated attempts to correctly answer a question. The SIRT models can be used to assess students’ content knowledge and their ability to retrieve that information and cognitive psychology research could benefit from using SIRT models to test additional scientific hypotheses.
Similarly, SIRT models can be used by applied researchers to evaluate and quantify the benefits of educational interventions. For instance, the two-dimensional SIRT model demonstrated how researchers can parse performance on assessments into first-attempt content knowledge (i.e., ) and repeated attempt recovery and/or retrieval rates (i.e., ). Many evaluations and research studies assess the influence of experimental educational interventions on student content knowledge and neglect recovery/retrieval rates. Models similar to the two-dimensional SIRT in this article can be used to broaden the outcomes of interest by enabling researchers to examine the effects of treatments on content knowledge and recovery/retrieval rates.
There are both psychometric and behavioral extensions of this study for future research. For the latter, additional research should examine the nature of the test-taking experience under repeated attempts. There is some evidence that students do not perceive the value of retrieval-based experiences even though such experiences improve learning and future test performance (Huelser & Metcalfe, 2012), so more research is needed in this area. For instance, under what circumstances does providing examinees the opportunity for more than one attempt abate or reduce test anxiety? What are students’ affective responses about their exam performance if they are allowed additional attempts? Additional research is needed to understand which SIRT models are most appropriate for high-stakes testing scenarios where test takers are unable to supplement their level.
Future psychometric endeavors could also explore the implications of allowing repeated attempts for other contexts and models. For instance, the SIRT models estimated in this study assumed constant item discrimination, which is a requirement for estimating the parameters using generalized nonlinear multilevel models. Future research should consider applications that allow for heterogeneous item discrimination and guessing parameters.
In conclusion, this study was initiated in response to emerging trends in educational assessment where examinations are increasingly computerized. This article documented the psychometric value of implementing the answer-until-correct testing format and offers researchers, psychometricians, and test developers alternatives for designing and scoring technology-based assessments.
Footnotes
Acknowledgements
This article benefited from the comments and suggestions of Jeffrey Douglas, Hua-Hua Chang, Daniel Bolt, and two anonymous reviewers.
Declaration of Conflicting Interests
The author(s) declared no potential conflicts of interest with respect to the research, authorship, and/or publication of this article.
Funding
The author(s) received no financial support for the research, authorship, and/or publication of this article.
References
1.
AkkermansW. (1999). Polytomous item scores and Guttman dependence. British Journal of Mathematical and Statistical Psychology, 52, 39-61.
2.
AkkermansW. (2000). Modelling sequentially scored item responses. British Journal of Mathematical and Statistical Psychology, 53, 83-98.
3.
AlbertJ.ChibS. (2001). Sequential ordinal modeling with applications to survival data. Biometrics, 57, 829-836.
4.
AttaliY. (2011). Immediate feedback and opportunity to revise answers: Application of a graded response IRT model. Applied Psychological Measurement, 35, 472-479.
5.
AttaliY.PowersD. (2010). Immediate feedback and opportunity to revise answers to open-ended questions. Educational and Psychological Measurement, 70, 22-35.
6.
BalchJ. (1964). The influence of the evaluating instrument on students’ learning. American Educational Research Journal, 1, 169-182.
7.
BartholomewD. (1963). The sampling distribution of an estimate arising in life testing. Technometrics, 5, 361-374.
BechgerT. M.AkkermansW. (2001). A note on the equivalence of the graded response model and the sequential model. Psychometrika, 66, 461-463.
10.
Ben-SimonA.BudescuD. V.NevoB. (1997). A comparative study of measures of partial knowledge in multiple-choice tests. Applied Psychological Measurement, 21, 65-88.
11.
BöckenholtU. (2012a). The cognitive-miser response model: Testing for intuitive and deliberate reasoning. Psychometrika, 77, 388-399.
12.
BöckenholtU. (2012b). Modeling multiple response processes in judgment and choice. Psychological Methods, 17, 665-678.
13.
CulpepperS. A. (2013). The reliability and precision of total scores and IRT estimates as a function of polytomous IRT parameters and latent trait distribution. Applied Psychological Measurement, 37, 201-225.
14.
De BoeckP.PartchevI. (2012). IRTrees: Tree-based item response models of the GLMM family. Journal of Statistical Software, 48, 1-28.
15.
DiBattistaD.GosseL. (2006). Test anxiety and the immediate feedback assessment technique. The Journal of Experimental Education, 74, 311-328.
16.
EpsteinM. L.EpsteinB. B.BrosvicG. M. (2001). Immediate feedback during academic testing. Psychological Reports, 88, 889-894.
17.
FischerG. H. (1995). Some neglected problems in IRT. Psychometrika, 60, 459-487.
18.
FraryR. B. (1980). The effect of misinformation, partial information, and guessing on expected multiple-choice test item scores. Applied Psychological Measurement, 4, 79-90.
19.
FraryR. B. (1989). Partial-credit scoring methods for multiple-choice tests. Applied Measurement in Education, 2, 79-96.
20.
GlasC.DagohoyA. V. T. (2007). A person fit test for IRT models for polytomous items. Psychometrika, 72, 159-180.
21.
GlasC.HendrawanI. (2005). Testing linear models for ability parameters in item response models. Multivariate Behavioral Research, 40, 25-51.
22.
GlasC.PimentelJ. L. (2008). Modeling nonignorable missing data in speeded tests. Educational and Psychological Measurement, 68, 907-922.
23.
GrimaldiP.KarpickeJ. (2012). When and why do retrieval attempts enhance subsequent encoding?Memory & Cognition, 40, 505-513.
24.
HannaG. S. (1975). Incremental reliability and validity of multiple-choice tests with an answer-until-correct procedure. Journal of Educational Measurement, 12, 175-178.
25.
HannaG. S. (1976). Effects of total and partial feedback in multiple-choice testing upon learning. The Journal of Educational Research, 69, 202-205.
26.
HannaG. S. (1977). A study of reliability and validity effects of total and partial immediate feedback in multiple-choice testing. Journal of Educational Measurement, 14, 1-7.
27.
HemkerB. T.van der ArkL. A.SijtsmaK. (2001). On measurement properties of continuation ratio models. Psychometrika, 66, 487-506.
28.
HoskensM.De BoeckP. (1997). A parametric model for local dependence among test items. Psychological Methods, 2, 261-277.
29.
HuelserB.MetcalfeJ. (2012). Making related errors facilitates learning, but learners do not know it. Memory & Cognition, 40, 514-527.
30.
IpE. H. (2002). Locally dependent latent trait model and the Dutch identity revisited. Psychometrika, 67, 367-386.
31.
IpE. H. (2010). Empirically indistinguishable multidimensional IRT and locally dependent unidimensional item response models. British Journal of Mathematical and Statistical Psychology, 63, 395-416.
32.
KaneM.MoloneyJ. (1978). The effect of guessing on item reliability under answer-until-correct scoring. Applied Psychological Measurement, 2, 41-49.
33.
KarpickeJ.BluntJ. (2011). Retrieval practice produces more learning than elaborative studying with concept mapping. Science, 331, 772-775.
34.
KarpickeJ.GrimaldiP. (2012). Retrieval-based learning: A perspective for enhancing meaningful learning. Educational Psychology Review, 24, 401-418.
35.
KlugerA. N.DeNisiA. (1996). The effects of feedback interventions on performance: A historical review, a meta-analysis, and a preliminary feedback intervention theory. Psychological Bulletin, 119, 254-284.
36.
LooneyM.SprayJ. (1992). Effects of violating local independence on IRT parameter estimation for the binomial trials model. Research Quarterly for Exercise and Sport, 63, 356-359.
37.
LooneyM.SprayJ.CastelliD. (1996). The task difficulty of free throw shooting for males and females. Research Quarterly for Exercise and Sport, 67, 265-271.
38.
MuñizJ.MenéndezF. (2011). The answer-until-correct item format revisited. Methodology: European Journal of Research Methods for the Behavioral and Social Sciences, 7, 103-110.
39.
NealR. (2003). Slice sampling. The Annals of Statistics, 31, 705-741.
40.
PlowmanL.StroudJ. B. (1942). Effect of informing pupils of the correctness of their responses to objective test questions. The Journal of Educational Research, 36, 16-20.
41.
PresseyS. (1926). A simple apparatus which gives tests and scores—And teaches. School and Society, 23, 373-376.
42.
PrestwoodJ. S. (1979). Knowledge of results and the proportion of positive feedback on tests of ability. Applied Psychological Measurement, 3, 155-160.
43.
SprayJ. (1990). One-parameter item response theory models for psychomotor tests involving repeated, independent attempts. Research Quarterly for Exercise and Sport, 61, 162-168.
44.
te MarveldeJ. M.GlasC. A.Van LandeghemG.Van DammeJ. (2006). Application of multidimensional item response theory models to longitudinal data. Educational and Psychological Measurement, 66, 5-34.
45.
TuerlinckxF.De BoeckP. (1999). Distinguishing constant and dimension-dependent interaction: A simulation study. Applied Psychological Measurement, 23, 299-307.
46.
TutzG. (1990). Sequential item response models with an ordered response. British Journal of Mathematical and Statistical Psychology, 43, 39-55.
47.
van der LindenW. J.JeonM. (2012). Modeling answer changes on test items. Journal of Educational and Behavioral Statistics, 37, 180-199.
48.
VergutsT.De BoeckP. (2000). A Rasch model for detecting learning while solving an intelligence test. Applied Psychological Measurement, 24, 151-162.
49.
VerhelstN. D.GlasC. A. (1993). A dynamic generalization of the Rasch model. Psychometrika, 58, 395-415.
50.
WilcoxR. R. (1981). Solving measurement problems with an answer-until-correct scoring procedure. Applied Psychological Measurement, 5, 399-414.
51.
WilcoxR. R. (1982a). A closed sequential procedure for answer-until-correct tests. The Journal of Experimental Education, 50, 219-222.
52.
WilcoxR. R. (1982b). Some new results on an answer-until-correct scoring procedure. Journal of Educational Measurement, 19, 67-74.