
Abstract
Selection of an appropriate item response model is critical in the measurement of latent examinee ability. The one-, two-, and three-parameter logistic (1PL, 2PL, and 3PL) models are nested, and as such can be compared using likelihood ratio (LR) tests. The null hypothesis in the LR test for selection among the 2PL and 3PL models sets the guessing parameters to their lower bound of 0. This violates one of the assumptions of the LR test and renders the usual
Item response models provide a means for measuring the latent ability of each examinee on a set of test items. The estimate of an examinee’s ability depends on both the examinee’s responses to the set of items and on the properties of these items, as characterized by the statistical parameters used in the selected item response model. The most commonly used unidimensional item response theory (IRT) models for dichotomously scored items include the one-parameter logistic (1PL) model, the two-parameter logistic (2PL) model, and the three-parameter logistic (3PL) model (e.g., Hambleton, Swaminathan, & Rogers, 1991; Lord, 1980; Lord & Novick, 1968). For researchers and analysts intending to measure examinee latent traits, selection of an appropriate item response model is critical, the goal being to find the simplest model that adequately explains the observed item responses (i.e., the most parsimonious model). When maximum-likelihood estimation is used, the likelihood ratio (LR) test can be used to select the most parsimonious among the 1PL, 2PL, and 3PL item response models as they form a series of nested models (Waller, 1981). In this article, the statistical properties of the LR test for model selection in unidimensional IRT models are investigated.
The authors of the present study begin by defining the IRT models of interest and illustrating their hierarchical nature. Next, the authors discuss how the LR testing procedure fits into an overall assessment of model-data fit in the IRT framework. They then describe how LR tests involving the 3PL model violate one of the assumptions underlying the test, a fact that has gone unrecognized in the IRT literature. Next, several simulation studies illustrating the impact of ignoring the assumptions violation on the Type I error rate and power of LR tests comparing the 2PL and 3PL models are presented. Then, a method of accounting for these nonstandard conditions is recommended when conducting these tests in practice, which is illustrated in an analysis of data from a statewide mathematics test. Finally, some discussion of the results with an emphasis on the potential consequences of ignoring the boundary issue when using LR tests to select an IRT model is provided.
The 1PL, 2PL, and 3PL Item Response Models
In the 3PL model, the probability that examinee i answers item j correctly for i = 1, . . . , N and j = 1, . . . , n is given as follows:

where
A common approach to estimating the parameters in these IRT models is marginal maximum-likelihood (MML) estimation (see, for example, Bock & Aitkin, 1981). The popular IRT software programs BILOG-MG (Zimowski, Muraki, Mislevy, & Bock, 1996) and MULTILOG (Thissen, 1991) both implement MML estimation of item parameters when no prior distributions are specified, and by default calculate Bayesian estimates of the latent ability parameters.
IRT Model Fit Evaluation
In evaluating the goodness of fit of a statistical model to sample data, a distinction can be made between assessing absolute model fit and assessing relative model fit. Absolute model fit is concerned with how closely responses predicted by the model align with the responses that were observed, whereas relative model fit is concerned with the selection of the model that best fits a data set efficiently from a set of candidate models. Several methods for evaluating the absolute fit of IRT models have been proposed. Many of these techniques are inference based (e.g., Andersen, 1973; Bock, 1972; Glas, 1999; Orlando & Thissen, 2000; Yen, 1981, 1984). Others have proposed methods incorporating graphical techniques and the examination of residuals in assessing the absolute fit of IRT models (see, for example, Hambleton, Swaminathan, & Rogers, 1991).
In evaluating relative model fit, the goal is to find the simplest model in a set of candidate models that adequately explains the observed responses. The Akaike Information Criterion (AIC; Akaike, 1974) and the Bayesian Information Criterion (BIC; Schwarz, 1978) are two measures of relative fit that account for model complexity in their selection of the best fitting model, but are not inferential procedures. However, statistical significance tests do exist for measures of relative fit when the competing models are nested, as is the case for the 1PL, 2PL, and 3PL models. One such statistical significance test is the LR test, which is the focus of this article. See Kang and Cohen (2007) for a comparison of the performance of various measures of relative model fit, including AIC, BIC, and the LR test for selection of an IRT model. In using measures of relative fit, there is no guarantee that the selected model fits the data well, only evidence that it fits at least as well as the larger models considered. Hence, it is essential that tests of absolute fit be used in conjunction with those of relative fit. The study of Maydeu-Olivares and Cai (2006) demonstrates this point in the context of IRT models.
For many large-scale assessments, such as state end-of-course tests, policy often dictates the choice of IRT model. Such programs are then interested solely in the absolute fit of the chosen IRT model to observed responses, and measures of relative fit are not of concern. However, LR tests for IRT model selection have been used with smaller-scale assessments in studies from a variety of contexts, including education research (Bergan, 2010), personality data evaluation (Reise & Waller, 2003), language testing research (Bachman, Davidson, Ryan, & Choi, 1995), psychological testing research (Kline, 2005), and health outcomes instrument development (Edelen & Reeve, 2007). Such studies rely on the description of how to implement LR tests in IRT model selection provided in introductory texts on IRT (e.g., De Ayala, 2009; DeMars, 2010; Embretson & Reise, 2000) and in the documentation for IRT software programs (e.g., du Toit, 2003; Thissen, 1991). Hence, it is important that the statistical properties of LR tests for comparing IRT models are well understood and properly communicated in such sources. The next section of this article presents the technical details underlying LR tests for IRT model selection, including a discussion of which are nonstandard testing situations.
LR Tests
An LR test assesses whether or not reduction from a more complex or “full” model to a simpler or “reduced” model is appropriate when the two models are nested. Let

Under certain regularity conditions, G2 has an asymptotic χ2 distribution with degrees of freedom equal to the difference between the number of parameters in the full and reduced models (Wilks, 1938). The larger the obtained value of G2, the stronger the evidence that the reduced model is inadequate and that the full model should be retained.
The LR testing procedure can be applied to the 1PL, 2PL, and 3PL models, as they form a series of nested models. Models with more parameters will always fit at least as well as models with fewer parameters when the models are nested, but the LR test can determine if removal of certain parameters does not significantly decrease the model fit. Assuming measures of absolute model fit indicate that the 3PL model is suitable, an LR test can be used to determine if reduction to the 2PL model is appropriate. If the 2PL model holds, then a second LR test can be used to determine if further reduction to the 1PL model is permissible. Calculation of the LR statistic for such tests is possible in BILOG-MG as well as MULTILOG, as both programs report
Across all items, the hypotheses in an LR test comparing the 2PL and 3PL models are as follows:

The null hypothesis places the guessing parameters at their lower boundary of 0, thereby violating one of the regularity conditions needed for Wilks’s theorem to hold. As a result, the standard
The problem of testing a null hypothesis that is on the boundary of the parameter space is a familiar one in the mixed-effects modeling literature. Using LR methods to test for the inclusion of random effects in a linear model is a nonstandard problem, as the null hypothesis that their variance components are 0 places these variance parameters on the boundary of the parameter space (Stram & Lee, 1994). In the most common situation, testing for the existence of a single random effect is a test of
Simulation Studies
The simulation studies consisted of two main components. In the first component, Type I error rates were estimated for three different LR tests for IRT model selection through simulation of the null distribution. In the second component, the power of these tests to detect varying levels of departure from the null model was investigated across different sample sizes.
Type I Error Studies
Method
The purpose of this section is to illustrate the impact of the boundary condition violation on the Type I error rate in LR tests involving the 3PL model. Type I error rates were calculated in three different studies comprising the following testing scenarios:
The first Type I error study considered an LR test for selection among the Rasch and the 2PL models. That is, the hypotheses of interest were
The LR test investigated in the second Type I error study compared the 2PL and 3PL models for all items of a test. Thus, the hypotheses under consideration in this study were
In the third Type I error study, LR tests for model selection at the item level rather than at the overall model level were considered. The reduced model in this case always specified the 2PL model for all n items. This was tested against a full model that specified the 3PL model for just one of the test items, while the remaining n− 1 items were still modeled with the 2PL. Hence, this study consisted of as many LR tests as there were test items, each one testing
For each of these three scenarios, the distribution of the LR statistic under the null hypothesis was approximated through simulation. This was done to estimate the probability of mistakenly rejecting a true null hypothesis (i.e., the Type I error rate) when the boundary issue is ignored and the standard reference distribution is used to assess significance. In each condition, this was accomplished by generating 1,000 binary item response data sets consisting of N = 5,000 examinees and n = 30 items according to the null model. The LR test statistic
Examinee abilities in all three conditions were drawn from a standard normal distribution. In the first Type I error study, the data were generated according to a Rasch model with difficulty parameters
Results
Histograms of the simulated null distributions in each of the Type I error studies are presented in Figure 1. In each case, the density curve for the standard reference distribution was superimposed on the graph. The simulated null distribution for the first Type I error study appears to be well approximated by the standard

Histograms of the simulated distribution of the likelihood ratio statistic under the null hypothesis in each of the Type I error studies.
In the first study, the observed Type I error rates were quite close to the nominal level with
In Table A1 (see the online appendix), empirical estimates of the Type I error rate according to the standard
In the third Type I error study, for each simulated data set 30 different significance tests were conducted, one to determine whether including a guessing parameter was advantageous for each item of the test. Thus, the familywise error rate, the probability of rejecting at least one null hypothesis in a series of tests when all of the null hypotheses are true (see, for example, Oehlert, 2000), is of concern. The comparisonwise error rates reported in Table A1 are simply the probabilities of rejecting a particular null hypothesis, given that it is true. In conducting a large number of tests, the familywise error rate can become severely inflated if no multiplicity control is used. For example, in 776 of the 1,000 replications in the third Type I error study, at least one of the 30 tested null hypotheses was incorrectly rejected when the correct mixture
Power Analysis
The results from the Type I error studies illustrate the conservative nature of LR tests comparing the 2PL and 3PL models when the boundary issue is ignored. That is, the probability that these tests will mistakenly reject the simpler 2PL model in favor of the more complex 3PL model is lower than the stated α level. The major drawback of using a conservative test is that it will have less power to detect departures from the null model when they truly do exist. In conducting the following power analysis, the goal was to demonstrate the loss of statistical power that occurs in LR tests comparing the 2PL and 3PL models when the boundary condition is not taken into account.
Method
The power analysis focused on tests comparing the 2PL and 3PL models for just one item of a simulated 30-item test, as the correct reference distribution in this case is known, thus facilitating a comparison between tests that do and do not account for the boundary issue. The correct reference distribution in an LR test comparing a 2PL model for all items of a test with a 3PL model for all items is not known, and though it is the most common comparison made in practice, the same outcome can be reached using a one-at-a-time approach.
For each condition in this study, response data for 1,000 samples were generated from the alternative (3PL) model to estimate the probability of correctly rejecting a false null hypothesis (i.e., the power of the test). All test lengths were fixed at 30 items. For the generating model, five values of the item guessing parameters
For each simulated data set, the value of the LR statistic
Results
The proportion of significant outcomes for a significance level of .05 is given in Table 1. These results would be of interest when only one particular item is being considered for reduction from a 3PL to a 2PL, perhaps because it is known in advance that the item is very easy and it is not thought that a large proportion of examinees will attempt to guess the correct answer choice. As can be seen in Table 1, the proportion of rejections of the misspecified null model increased as the sample size increased across all item parameter specifications. This is an expected result, as larger samples provide more information about the true nature of the population. It is also clear from Table 1 that the values of the difficulty, discrimination, and guessing parameters all greatly affect the power of these tests. It was anticipated that the further the true values of the guessing parameters were from 0, the more likely it would be that a departure from the null value would be detected. However, these tests had adequate power (e.g., higher than 80%) to detect the presence of a guessing parameter only for items that were highly discriminating and at least moderately difficult, even when the value of the guessing parameter was quite large. The degree to which the values of the difficulty and discrimination parameters affected the power estimates is a very interesting and unexpected result.
Proportion of Rejections of the Misspecified 2PL Model in LR Tests Comparing the 2PL and 3PL Models for Each Item of a 30-Item Test.
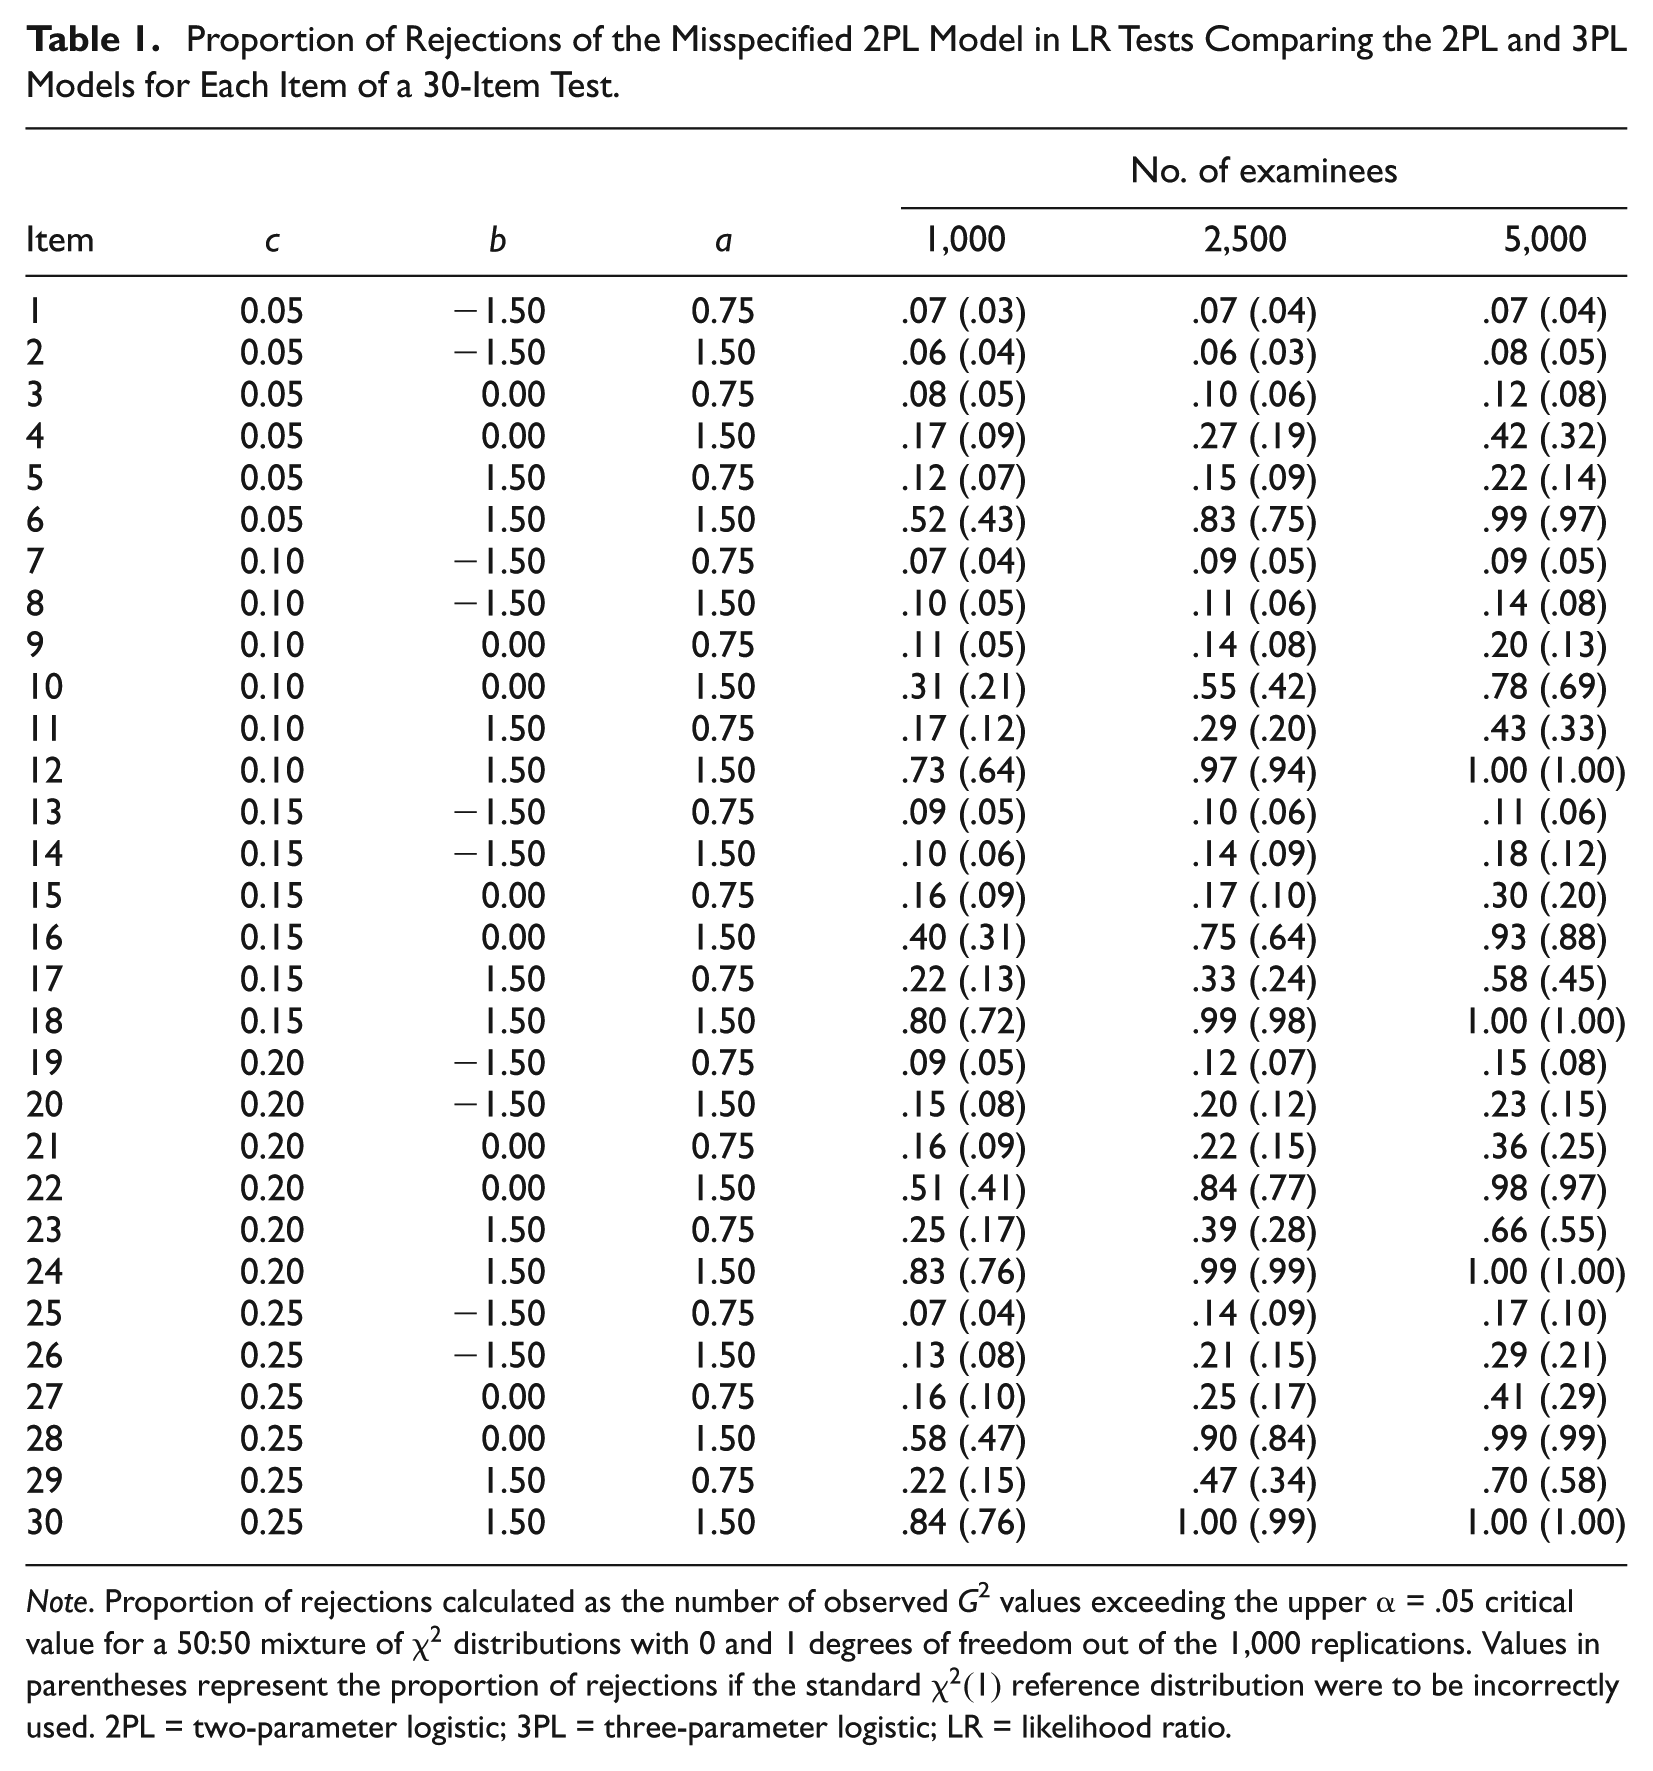
Note. Proportion of rejections calculated as the number of observed G2 values exceeding the upper α = .05 critical value for a 50:50 mixture of
Also evident in Table 1 is the loss of power that occurred when the significance of an outcome was assessed according to the incorrect standard
Table 2 gives power estimates for the same hypothesis tests as Table 1, but with a Bonferroni correction applied. These results would be of interest when all items of a test of moderate length are being considered for reduction from a 3PL to a 2PL model. From the results in Table 2, it is clear that these tests were only powerful in the detection of a guessing parameter for items that were highly discriminating and at least moderately difficult. For such items, there was again a noticeable difference between the power estimates according to the standard
Proportion of Rejections of the Misspecified 2PL Model in LR Tests Comparing the 2PL and 3PL Models for Each Item of a 30-Item Test with a Bonferroni Correction.

Note. Proportion of rejections calculated as the number of observed G2 values exceeding the upper α = .05/30 critical value for a 50:50 mixture of
Empirical Example: Comparing the 2PL and 3PL Models for the Items on a Statewide Mathematics Test via an LR Test
As the simulation studies highlighted, the standard
Data
The item response data used in this example came from the 2003 Florida Comprehensive Assessment Test (FCAT) ninth-grade mathematics test (Florida Department of Education, 2003). This exam was administered to 211,601 students, and in this study the responses from a random sample of 5,000 of these students were analyzed. There were a total of 44 items on this exam, of which 29 were dichotomously scored multiple-choice items. For this example, the authors were concerned with modeling the responses to these 29 multiple-choice items.
Method
To begin the analysis, a 3PL model was fit to all 29 of the multiple-choice items on the 2003 FCAT Mathematics Test for Grade 9. The question of interest was then whether or not reduction to a 2PL model would be appropriate for any of these 29 items. To address this question, a technique that is commonly referred to as backward elimination in the statistical modeling literature was implemented (e.g., Kutner, Nachtsheim, Neter, & Li, 2005). That is, the initial model included guessing parameters for all 29 items. Then, at each step in the analysis, the LR test statistics corresponding to a test of whether the guessing parameter for each item was significantly different from 0 was calculated. The guessing parameter with the least significant LR statistic was then removed from the model and the process continued until all remaining guessing parameters had statistically significant LR statistics.
The statistical significance of the LR statistics was assessed according to a 50:50 mixture of
Results
The item parameter estimates for the initial model specifying a 3PL for all items are given in Table B1 (see the online appendix). Note that these items generally had larger estimated item discrimination parameters, implying that the LR test should have adequate power to detect the presence of a guessing parameter, based upon the results of the power analysis simulation study. In Table B2, the LR test statistics for the first step in the backward elimination procedure are listed. There were three guessing parameters (
Each time a guessing parameter was removed from the model for the FCAT data, the item was subsequently estimated to be more discriminating and less difficult. Such information might potentially affect decisions regarding the use of these items in future administrations of the FCAT, illustrating how the choice of a model for a set of item response data can affect conclusions made in subsequent analyses. Furthermore, item parameter estimates will affect reported ability estimates and their standard errors. Figure B1 provides a comparison between the standard error of the ability estimates across the range of
Discussion
The results of this study illustrate that an issue widely recognized in the mixed-effects modeling literature, namely, that when testing if a parameter is equal to one of its boundary values the standard
Many established testing programs use a particular IRT model as a matter of policy, and as such do not routinely use LR tests to compare the fit of several different IRT models. However, a general awareness of how the boundary issue affects LR tests for IRT model selection is important in the field of IRT modeling, as researchers choosing to apply IRT methods to instruments used in their own research context rely on the information about LR tests for IRT model selection presented in many of the popular introductory IRT texts and in the documentation of many widely used IRT software programs. The potential consequences of ignoring the boundary issue in LR tests comparing the 2PL and 3PL models will be dependent upon the research questions of interest for a particular study. For example, IRT model comparisons can affect conclusions drawn about the comparability of two tests measuring the same construct (e.g., Bachman et al., 1995); results from model comparisons can have implications for the conclusions reached about the quality of items included on a particular scale (e.g., Reise & Waller, 2003); IRT model choice affects item parameter estimates, which, in turn, might be used to assist in questionnaire development (e.g., Edelen & Reeve, 2007); selection of a misspecified IRT model can potentially lead to inaccuracies in the reported measurement errors and test reliability (e.g., Bergan, 2010). Thus, a complete understanding of the statistical properties of the methods used for IRT model selection is essential.
In conclusion, LR tests comparing the 2PL and 3PL models will need to somehow account for the boundary issue to avoid being overly conservative. One potential method for taking this into account when comparing the fit of a 2PL model with the fit of a 3PL model was presented in the analysis of data from the 2003 FCAT Mathematics Test. The authors’ approach made use of tests that considered the removal of just one guessing parameter at each step of the analysis, thus allowing for the use of a known reference distribution, and allowing greater modeling flexibility than an approach which assumes that all items on a test either need a guessing parameter or do not need one. Alternatively, the ltm package for the statistical computing software R (Rizopoulos, 2006) has the option to request p values from a simulated null distribution for LR tests for IRT model selection, which would be more appropriate than using the standard reference distribution when such tests involve determining whether guessing parameters are significantly different from 0.
Footnotes
Declaration of Conflicting Interests
The author(s) declared no potential conflicts of interest with respect to the research, authorship, and/or publication of this article.
Funding
The author(s) received no financial support for the research, authorship, and/or publication of this article.
References
Supplementary Material
Please find the following supplemental material available below.
For Open Access articles published under a Creative Commons License, all supplemental material carries the same license as the article it is associated with.
For non-Open Access articles published, all supplemental material carries a non-exclusive license, and permission requests for re-use of supplemental material or any part of supplemental material shall be sent directly to the copyright owner as specified in the copyright notice associated with the article.