
Abstract
An informational distance/divergence-based approach is proposed to detect the presence of parameter drift in multidimensional computerized adaptive testing (MCAT). The study presents significance testing procedures for identifying changes in multidimensional item response functions (MIRFs) over time based on informational distance/divergence measures that capture the discrepancy between two probability functions. To approximate the MIRFs from the observed response data, the k-nearest neighbors algorithm is used with the random search method. A simulation study suggests that the distance/divergence-based drift measures perform effectively in identifying the instances of parameter drift in MCAT. They showed moderate power with small samples of 500 examinees and excellent power when the sample size was as large as 1,000. The proposed drift measures also adequately controlled for Type I error at the nominal level under the null hypothesis.
Keywords
Multidimensional computerized adaptive testing (MCAT; Bloxom & Vale, 1987; Segall, 1996; Tam, 1992) has recently gained much popularity as a diagnostic measurement tool in educational, psychological, and clinical settings. It allows more comprehensive description of examinees’ test performances than traditional unidimensional item response theory (IRT) and achieves much efficiency in test administration by taking advantage of adaptive item selection technique (Chang, 2015). One of the critical issues in administering MCAT is to ensure item parameters remain stable over time. Because scoring of examinees’ latent traits is predicated on the item parameter invariance, any systematic instability in item parameters can adversely affect the scoring process. If test items are used to grant professional competence such as in certification or licensure assessments, shifts in item parameters can lead to false decisions when classifying examinees. Hence, it is important to identify instances of parameter drift as soon as possible to minimize any repercussions on the validity and comparability of the scaled scores.
There are a number of factors causing the item parameter drift in practice. The occurrence of parameter drift (Goldstein, 1983) can be attributed to changes in instruction or curriculum (Bock, Muraki, & Pfeiffenberger, 1988; Cook, Eignor, & Taft, 1988), changes in constructs (Chan, Drasgow, & Sawin, 1999), or changes made to items between test administrations (Sykes & Ito, 1993). The parameter drift can also appear as a consequence of item disclosure by previous test takers, test fraud, item overexposure, or inappropriate testwise training (Li, 2008).
A common practice for identifying parameter drift in unidimensional items is to recalibrate items and evaluate changes in the estimated parameter values over testing occasions. The instance of parameter drift can be determined by comparing the item parameter estimates directly (Bock et al., 1988) or comparing model fit statistics obtained from the different testing events (Glas, 2000). Alternatively, one can compare test characteristic curves across time points (Guo, Zheng, & Chang, 2015; Wollack, Cohen, & Wells, 2003). Statistical measures that are originally developed for analysis of differential item functioning (DIF) also serve as drift detection measures (e.g., Kim & Cohen, 1991; Lord, 1980; Raju, 1988). Concerned with the computerized adaptive testing (CAT), the cumulative sum chart based on standardized differences between estimated item parameter values can be used to evaluate the drift (Veerkamp & Glas, 2000). For a discussion of causes and methods for detecting parameter drift in unidimensional tests, see Clark (2014).
Although much has been studied about the drift detection methods in unidimensional tests, there has been relatively little work developing or comparing drift procedures in MCAT. A complication of using the traditional methods for the MCAT data is that outcomes of the drift analysis are likely to be confounded with high calibration error or linking error. Because the traditional approaches use item parameter estimates from separate calibrations as a basis for drift analysis, the efficacy of the procedures is critically dependent upon the quality of item calibration (Donoghue & Isham, 1998). If the parameter estimates contain high uncertainty due to large numbers of parameters or missing responses, inferences about the existence of parameter drift may be hardly validated. Besides, calibrating items in MCAT separately time after time is an onerous task, especially when the items have varying frequencies in terms of exposure distribution. In instances where operational items need to be routinely monitored during the MCAT administrations, the computational burden of separate calibrations becomes even more serious.
The focus of this article is on developing viable options for detecting parameter drift without the need to calibrate items in the MCAT data. The new procedures do not involve item parameter estimation, and hence, they can be freed from calibration error or linking error. The procedures are based on significance testing of the difference between an observed multidimensional item response function (MIRF) and an anticipated MIRF. In a typical MCAT program, a precalibrated item pool is available such that items can be selected according to their known statistical properties. Therefore, the presence of parameter drift can be determined by comparing the probability function observed from the operational testing against the probability function derived from the initial item parameter values. The present article introduces four informational distance/divergence measures that serve this role.
The present article is organized as follows. First, the theoretical framework for the analysis of parameter drift in multidimensional items is briefly outlined. The article proceeds to introduce the informational distance/divergence measures that can be used for identifying the existence of the drift. The proposed methods are then evaluated in simulations. Finally, some discussion on the use of informational distance/divergence measures is provided. Throughout the article, it is assumed that items used for MCAT have adequate fit for the psychometric model of concern, and they are precalibrated with enough precision before the operational use. The initial parameter values of the items can thus be treated as known or reference values in the subsequent drift analysis.
Analysis of Parameter Drift in Multidimensional Items
Suppose a test purports to measure a set of latent proficiencies,

for all levels of

for all levels of
Consider a dissimilarity measure,
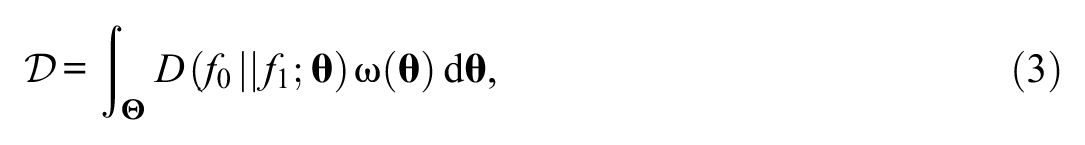
where
Computation of the drift statistic in Equation 3 requires a matching criterion so that the two probability functions can be evaluated at the same proficiency level. In the unidimensional tests, examinees’ number-correct scores or unidimensional proficiency estimates are commonly used as a matching variable. When a test is intended to measure multiple traits, matching on the unidimensional criterion can result in Type I error inflation (Ackerman, 1992). Therefore, to meet the validity standards and to avoid high Type I error rate, the present study employs latent proficiency vectors estimated from the operational MCAT as a matching criterion. The proficiency estimates take all pertinent latent dimensions into account and are readily obtainable from the administrations of the MCAT. Note that in multidimensional tests, it is almost impossible to match examinees on the exact values of the proficiency estimates (i.e., thin matching). A certain strategy must be employed to pool examinees based on their estimated proficiency vectors (i.e., thick matching). This goal is achieved by employing the k-nearest neighbors (k-NNs) algorithm.
A basic procedure follows from this. Given a collection of query vectors,
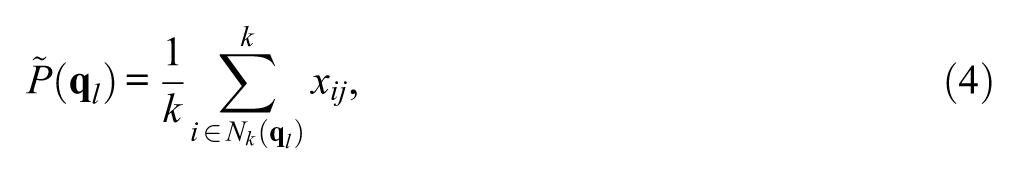
where
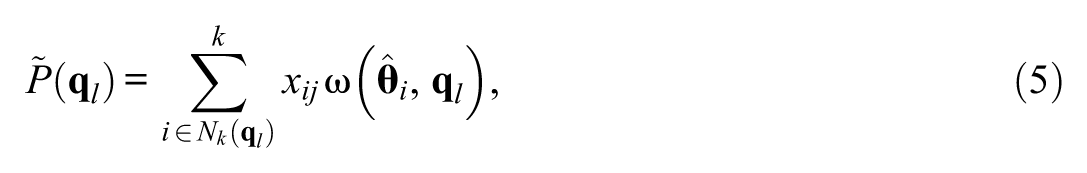
where
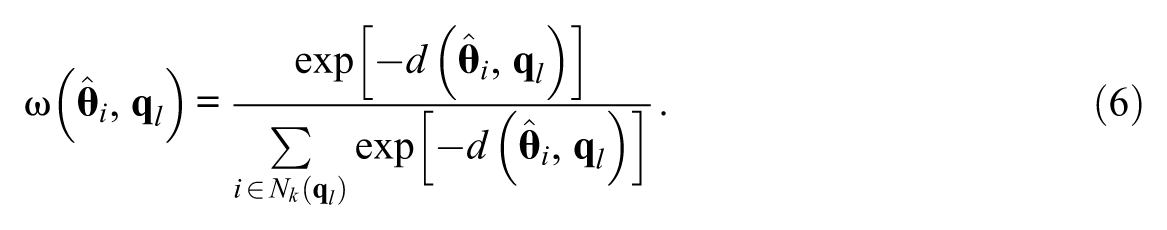
The weights defined in this manner satisfy
The main advantage of using the k-NNs technique in the MCAT data is that the algorithm always finds a proper set of matching variables for comparing the MIRFs. Despite the fact that the size or the distribution of examinee samples can change over different testing events, the k-NNs algorithm can approximate the MIRFs with comparable precision over time by taking the k-NNs close to the query vectors into consideration.
Informational Distance/Divergence Measures
To structure the heterogeneity between the MIRFs, a statistical dissimilarity index that separates pairs of probability functions is needed. This article proposes four informational distance/divergence measures that serve such purpose. The informational distance/divergence measures have been widely employed in many areas of statistics such as binary hypothesis testing, classification applications, anomaly detection in high-dimensional data, and so forth. The use of the distance/divergence measures is especially advantageous in multidimensional settings in that they can summarize the degree of heterogeneity between probability distributions into a single numeric without regard to the size of dimension or the number of parameters.
The following introduces four informational distance/divergence measures for identifying the presence of parameter drift in MCAT and presents corresponding estimation methods of the drift statistics. The drift statistics below are defined for the dichotomous items for convenience; however, their definitions stated in terms of the MIRFs are not necessarily limited to the dichotomous cases. When multidimensional polytomous items are of concern, the distance/divergence measures can be adjusted to assess the discrepancy between two multidimensional item response category functions.
In line with the notations above, the vector of reference item parameters (i.e., initial item parameter estimates) is denoted as
Euclidean Distance
One of the simplest ways to quantify the degree of dissimilarity between two probability functions is to use the Euclidean distance. For given
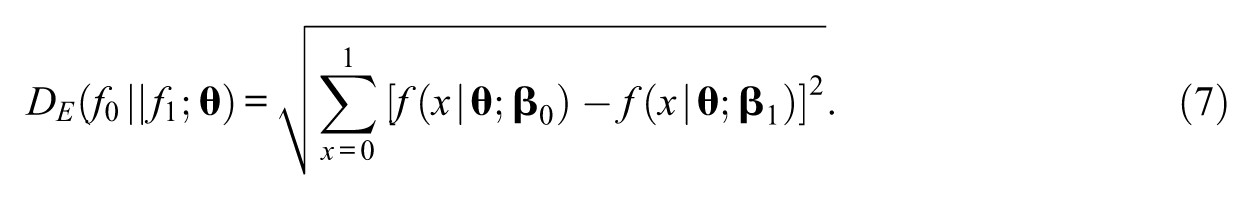
The quantity defined in Equation 7 is nonnegative and equals 0 if and only if
The drift statistic based on the Euclidean distance is obtained by plugging Equation 7 into Equation 3:
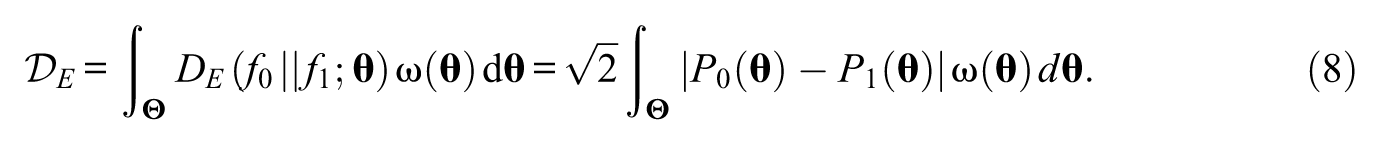
In Equation 8,
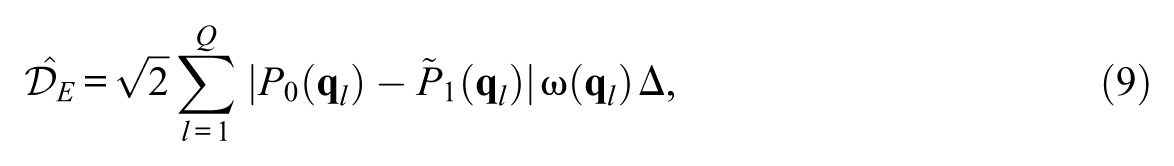
where
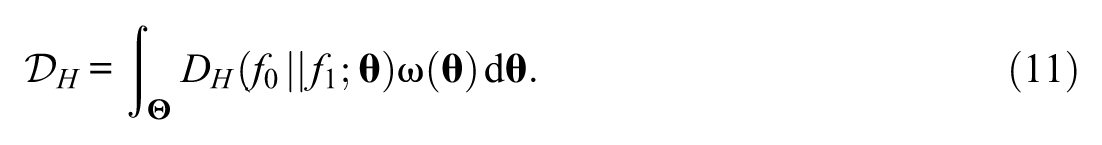
Hellinger Distance
The Euclidean distance of the square root function is called Hellinger distance (Bhattacharyya, 1943). In the present context, the Hellinger distance between
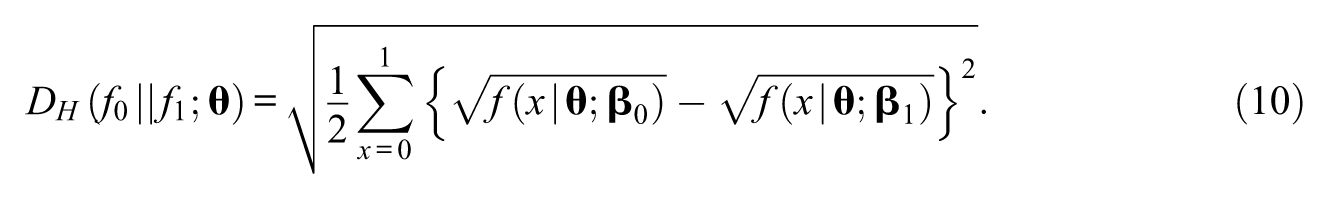
The Hellinger distance,
Based on the observed responses, this quantity can be estimated as follows:
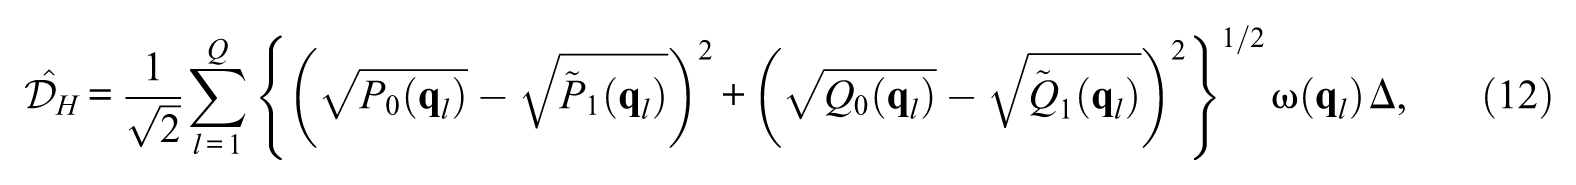
where
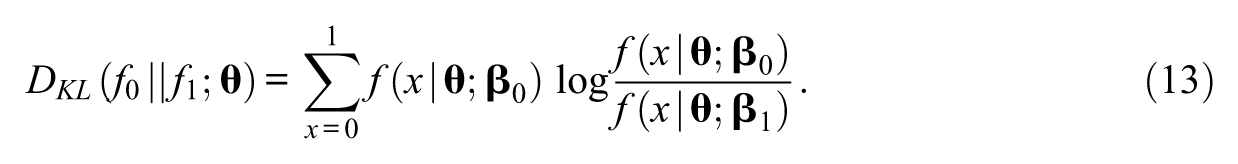
Kullback–Leibler (KL) Divergence
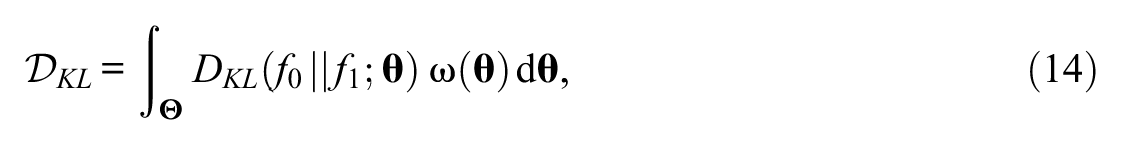
The KL (Kullback & Leibler, 1951) divergence (also known as relative entropy or crossing entropy) has been frequently used in information theory as a measure of discriminating two probability functions. Chang and Ying (1996) introduced the KL divergence to the IRT framework as a global item information measure that discriminates examinees’ true proficiencies and provisional estimates in CAT. In the context of multidimensional IRT, the KL divergence of
The KL divergence is nonnegative because of Gibbs inequality and equals 0 when the two distributions coincide almost everywhere. The drift statistic for the KL divergence is obtained as
and estimated as
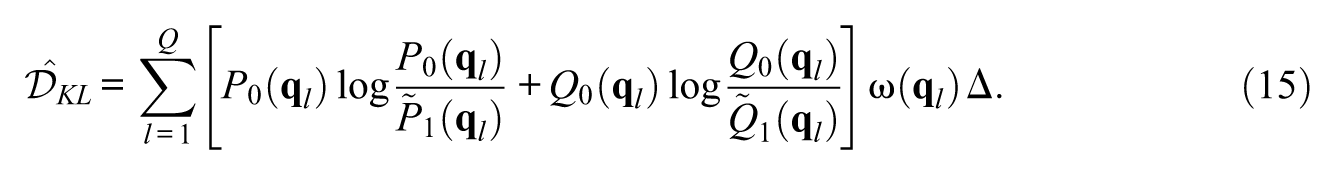
While the KL divergence has been considered as one of the most powerful discriminating measures of probability functions in information theory, it has a number of drawbacks that may detract from its usefulness as a pairwise drift measure in applied settings. By definition, the KL divergence is not symmetric in
Jensen–Shannon (JS) Divergence
Let

The quantity
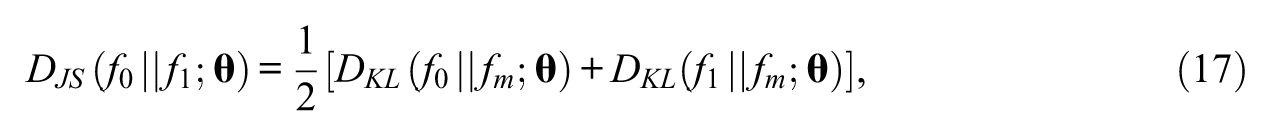
where
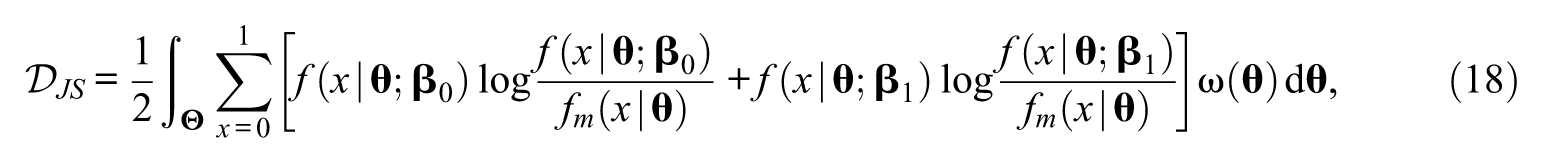
where
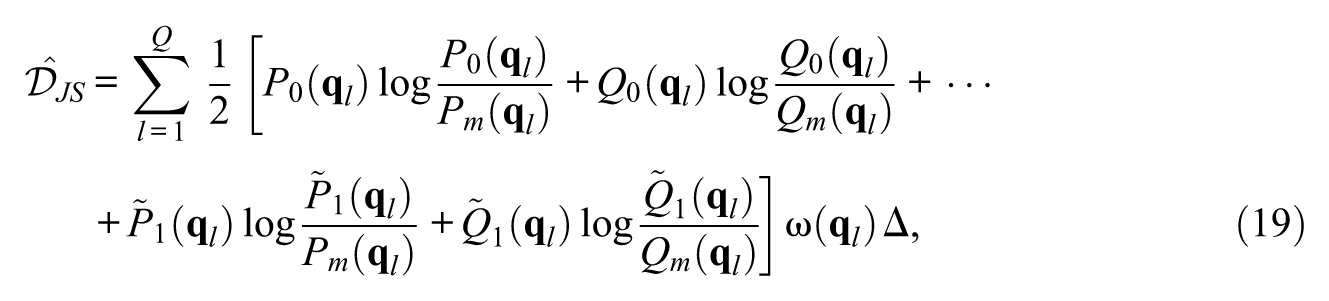
where
Simulation Study
A simulation study is used to examine the performance of the distance/divergence-based drift measures. For the drift analysis to be fully sequential, significance testing must be carried out after each included observation; however, such procedure becomes inefficient in terms of a central process unit time. The present study conducts drift analysis at three predefined time points instead. The drift statistics were computed at each time an item was administered to n = 500, 1,000, and 1,500 examinees, and significance testing was carried out on the difference between the original and observed probability functions.
Determination of k
Because the performance of the drift measures depends on the k-NNs algorithm, it is important to carefully choose the size of k. An overly large value of k would fail to evaluate the heterogeneity in the item response functions properly. If k is too small, the approximation of item response functions could be unstable because only a bit of responses are utilized for a given query vector. (In the extreme case of k = 1,
Determination of Query Vectors
Among a number of heuristic techniques for determining the query vectors, grid search and random search are the most widely used methods for hyperparameter optimization of the k-NNs algorithm. The grid search method uses grid points manually drawn from a subset of a hyperparameter space (i.e.,
Determination of Critical Values
The asymptotic distributions of the drift statistics proposed are unknown. Thus, critical values were obtained empirically through bootstrap resampling under the null hypothesis. A brief description of finding the critical values at significance level α is given as follows.
Step 1: Compute drift statistics at each time an item is assigned to n examinees in the null case of MCAT administration.
Step 2: For each n condition, treat the original set of the drift statistics as a population of scores and perform resampling with replacement.
Step 3: Repeat Step 2 to generate m resamples of test statistics.
Step 4: Calculate the 100(1 −α) quantile in each m resample to obtain critical values.
Step 5: Determine an empirical critical value as an average of the critical values over the m resamples.
The number of resamples, m, should be large enough to get a good estimation of the quantile. The present study used m = 1,000 resamples and determined the critical values at significance level α = 0.05 in the upper tail of the sampling distributions. The critical values resulting from the above steps are size-corrected that do not depend on unknown population parameters but are likely to yield a test with little power. Therefore, to secure adequate power of the drift statistics, n = 500 was considered as the minimum sample size for drift analysis.
Data Generation
MCAT was administered based on the multidimensional three-parameter logistic model (Reckase, 1997):
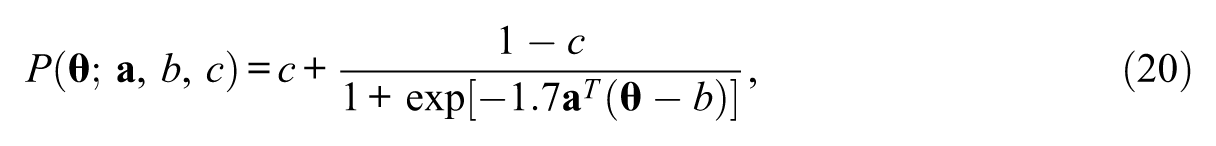
where
Parameter Drift Simulation
Within each MCAT scenario, performances of the drift measures were evaluated with or without parameter drift occurring. The study design included three proportions of item pool-wide parameter drift: 0%, 5%, and 10%. Motivated by the tendency in practice in which overexposed items tend to have high likelihood of being flagged for parameter drift (Zhang, 2014), drift items were randomly selected from a set of frequently used items in the null case of MCAT. All items chosen for parameter drift were made to experience the same type of parameter drift to examine the impact of drift type systematically. Two types of parameter drift were created. The parallel shifts in the MIRFs were made by changing the b-parameters of the drift items by 0.3 or 0.5 units from the original values. The nonparallel transformations of the MIRFs were simulated by changing the a-parameters by 0.5 units and the b-parameters by 0.3 or 0.5 units. The direction of the parameter drift was determined such that the drift items became less discriminating or less difficult over the testing events (e.g., DeMars, 2004; Veerkamp & Glas, 2000). Because the proposed drift measures do not place any constraints on the direction, similar inferences can be made about the performance of the measures in the opposite direction.
Crossing the conditioned factors resulted in 18 different MCAT scenarios. Each scenario was executed with 100 replications to regulate the sampling error, and the results were averaged over the replications.
Results
Determination of Q
The preparatory study for determining the number of query vectors suggested that
Empirical Sampling Distributions
To serve as test statistics for significance testing, drift measures must have distinct limiting distributions under the null hypothesis. As their asymptotic distributions are unknown, the current study obtained empirical sampling distributions via simulation and evaluated their characteristics in the null case of no drift. Figure 1 presents empirical sampling distributions of the drift statistics obtained from the two-dimensional CAT. All drift measures demonstrated explicit forms of sampling distributions. The distance-based statistics had the symmetric sampling distributions. The divergence-based measures appeared positively skewed distributions. The impact of increasing n on the drift statistics was manifested by shifts of the sampling distributions toward the left. In general, the empirical sampling distributions became less dispersed, less skewed, and less peaked as n increased.
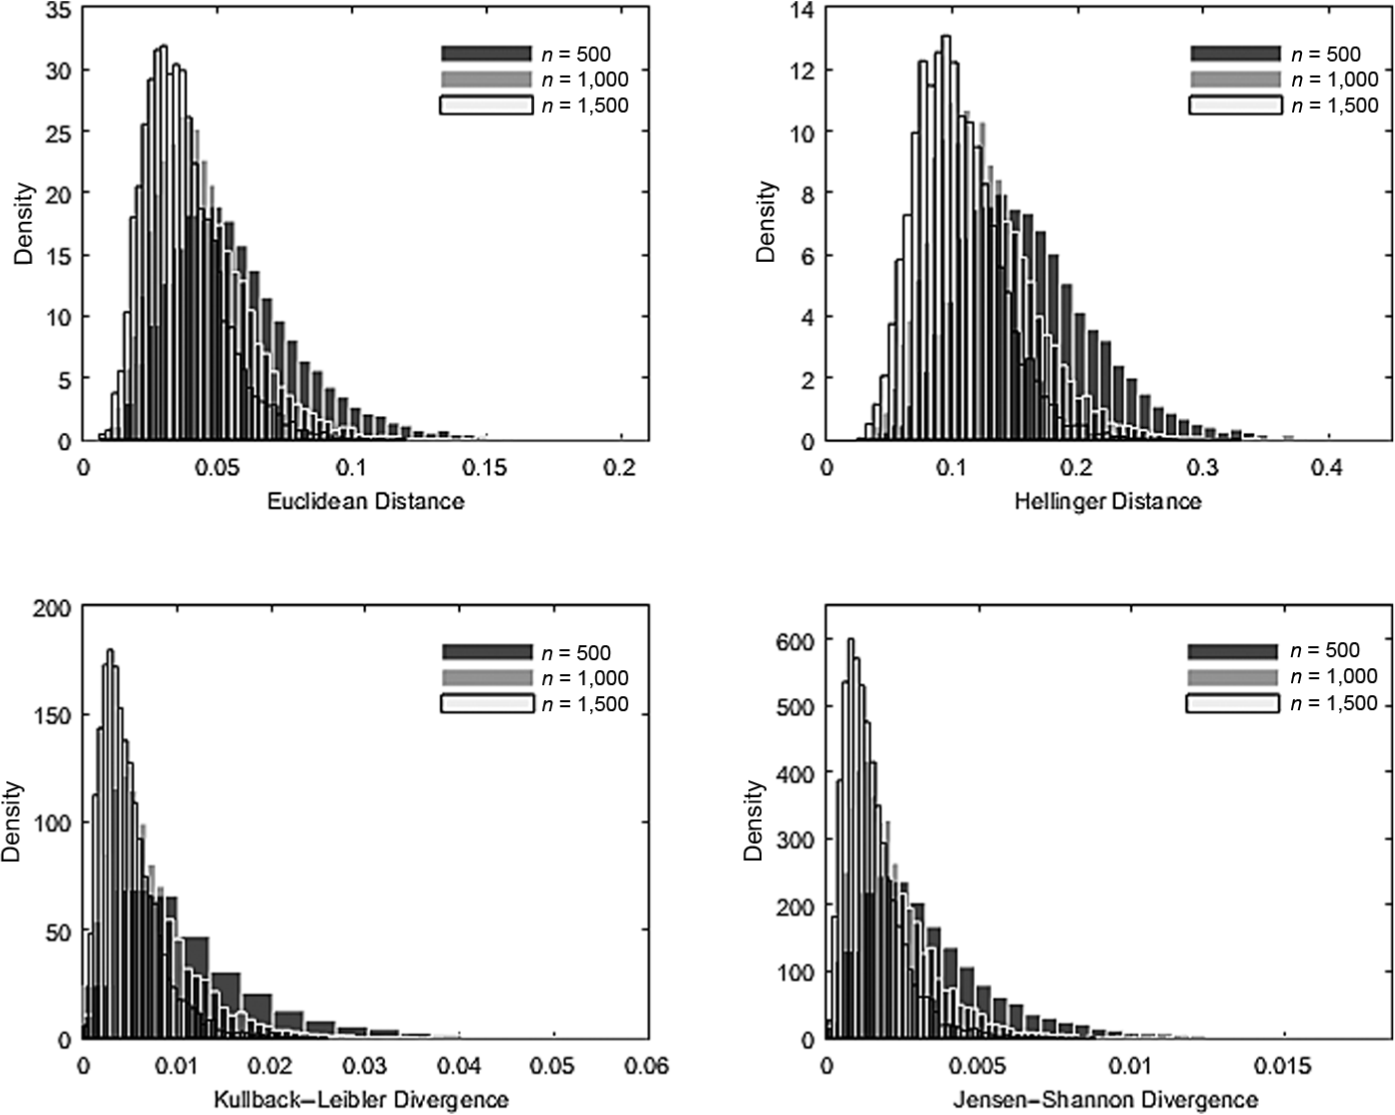
Empirical sampling distributions in the two-dimensional computerized adaptive testing.
Similar patterns were observed for the three-dimensional case. Figure 2 provides empirical sampling distributions obtained from the three-dimensional CAT. All drift test statistics showed distinct sampling distributions under the null. Compared with Figure 1, the sampling distributions in Figure 2 had smaller averages and smaller standard deviations (SDs), suggesting that drift statistics from the higher dimension were less distinguishable. The trends associated with n were consistent with those for the two-dimensional CAT. When the
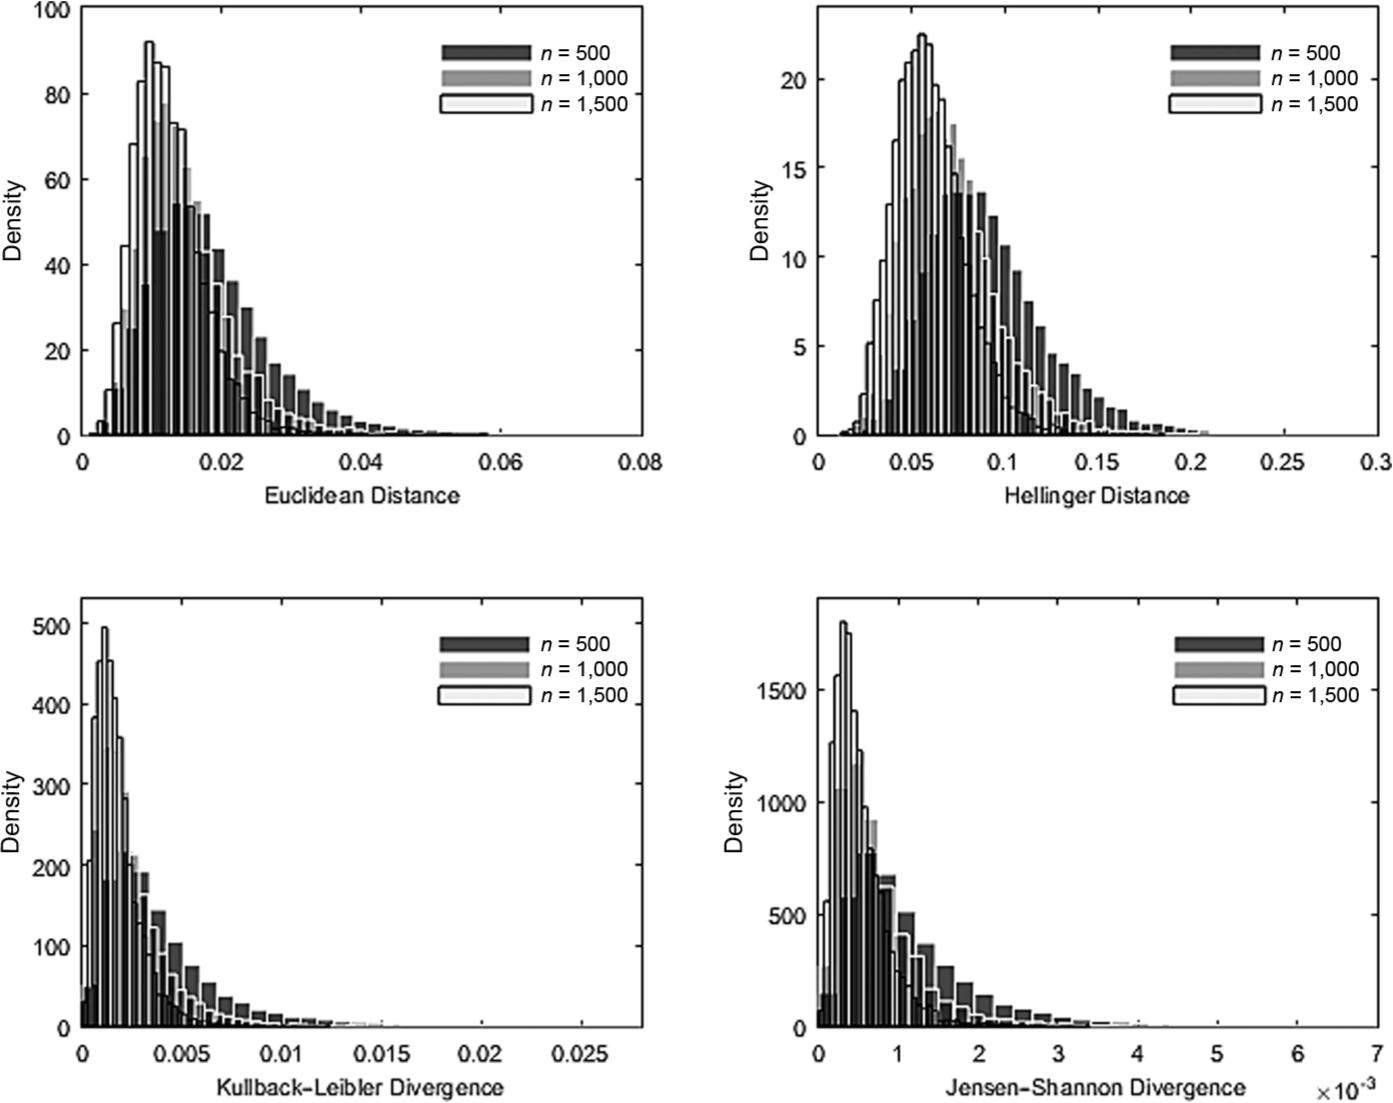
Empirical sampling distributions in the three-dimensional computerized adaptive testing.
The figures presented above suggest that the distance/divergence-based drift statistics have explicit sampling distributions under the null hypothesis. Based on these distributions, empirical critical values were obtained through bootstrap resampling at the significance level of 0.05. Table 1 reports the average and SD values of the critical values used in the study. In line with the prior results, the empirical critical values tended to decrease as n or p increased. Along with these changes, the critical values became less dispersed, suggesting that the critical values became more consistent.
Averages and SDs of Empirical Critical Values.
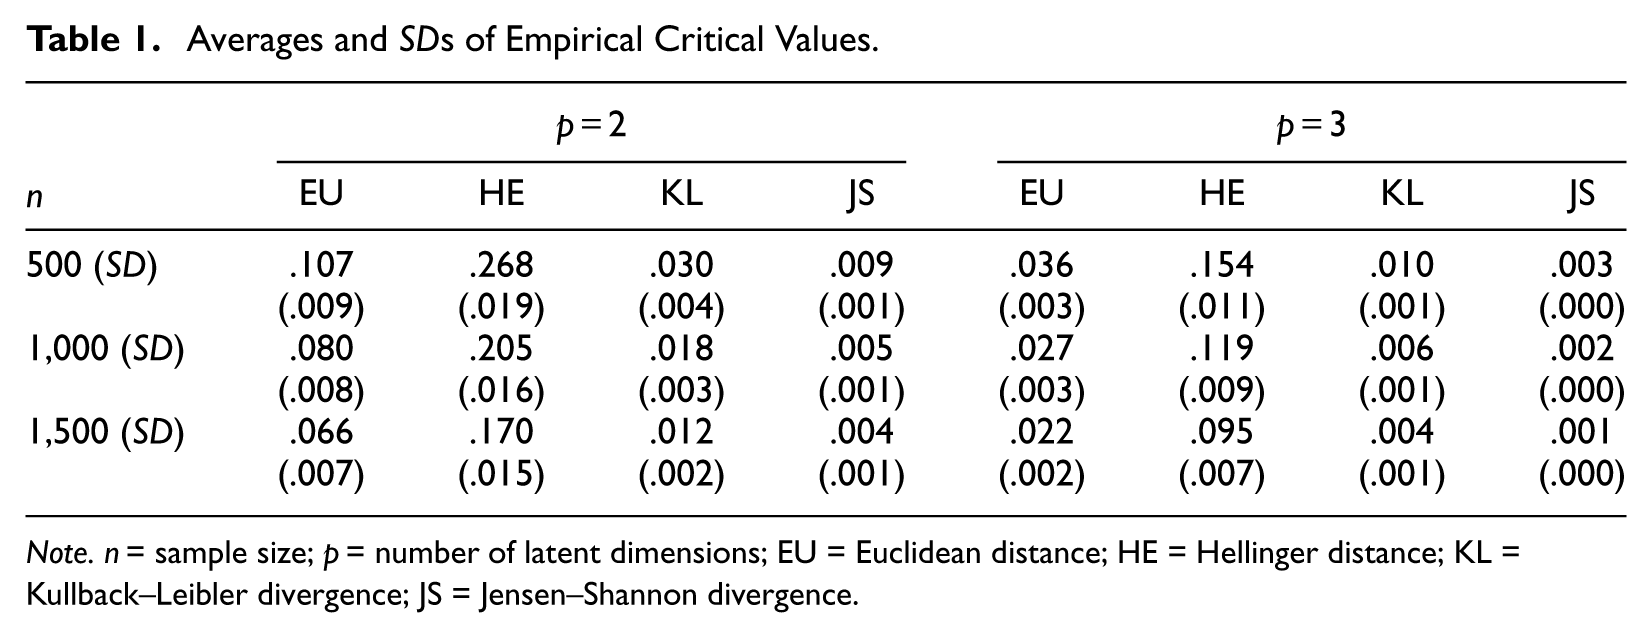
Note.
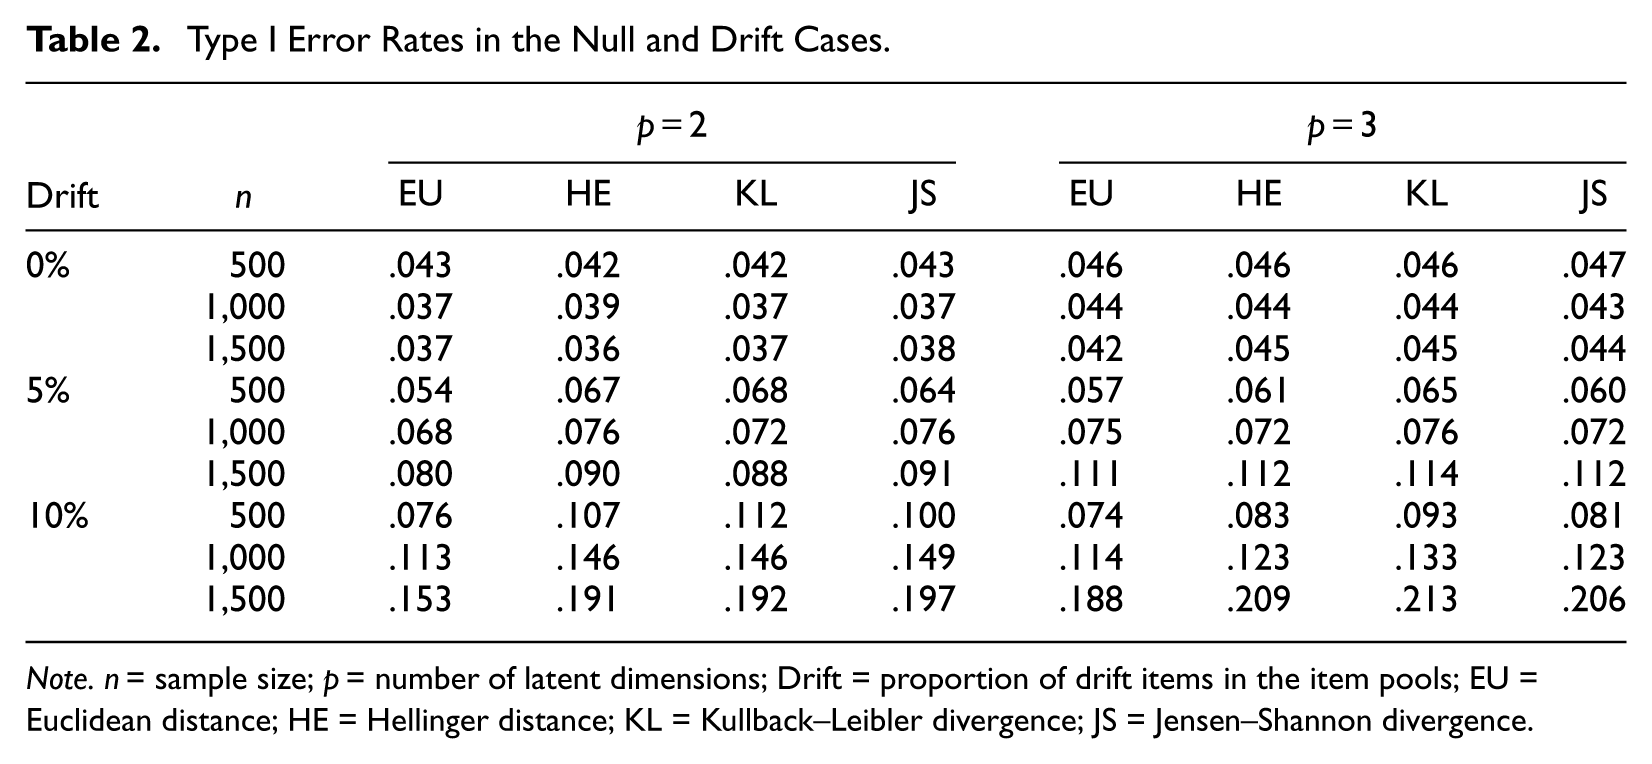
Type I Error Study
In Table 2, Type I error rates of the drift measures are summarized for the null and drift cases. The Type I error rate was defined as the percentage of nondrift items that were erroneously identified as drift in each MCAT administration. The values reported for the drift cases were obtained by averaging over the drift levels and drift types because no systematic pattern was found across these factors. Overall, the drift measures maintained good adherence to the nominal level of significance under the null hypothesis. They constantly kept Type I error rates below the nominal level without regard to n or p. SDs of the Type I errors remained small and slightly increased as n increased. The average SDs were .006, .008, and .009 for each n condition.
Type I Error Rates in the Null and Drift Cases.
Note.
The drift measures began to display Type I error inflation as the item pools were contaminated with drift items. The magnitude of the inflation was somewhat minor or moderate when 5% of the items in the pool were flagged for parameter drift. The Type I error inflation problem appeared substantial as 10% of the item pools were flagged for drift. Among the distance/divergence measures, the Euclidean distance was found most conservative in terms of Type I error inflation. Increasing n in the drift analyses resulted in increased Type I error rates for all drift measures possibly due to the greater sensitivity with the larger n. Consistent with the null case, SDs of the Type I error rates were influenced by the level of n, that is, the larger the n, the more the variability in the Type I error rates. In the 5% drift case, SDs of the Type I error rates were .031, .044, and .054 for increasing n. In the 10% drift case, SDs of the Type I error rates increased to .046, .073, and .094. Overall, the impact of the dimensionality on the averages and SDs of the Type I error rates was not immediately obvious.
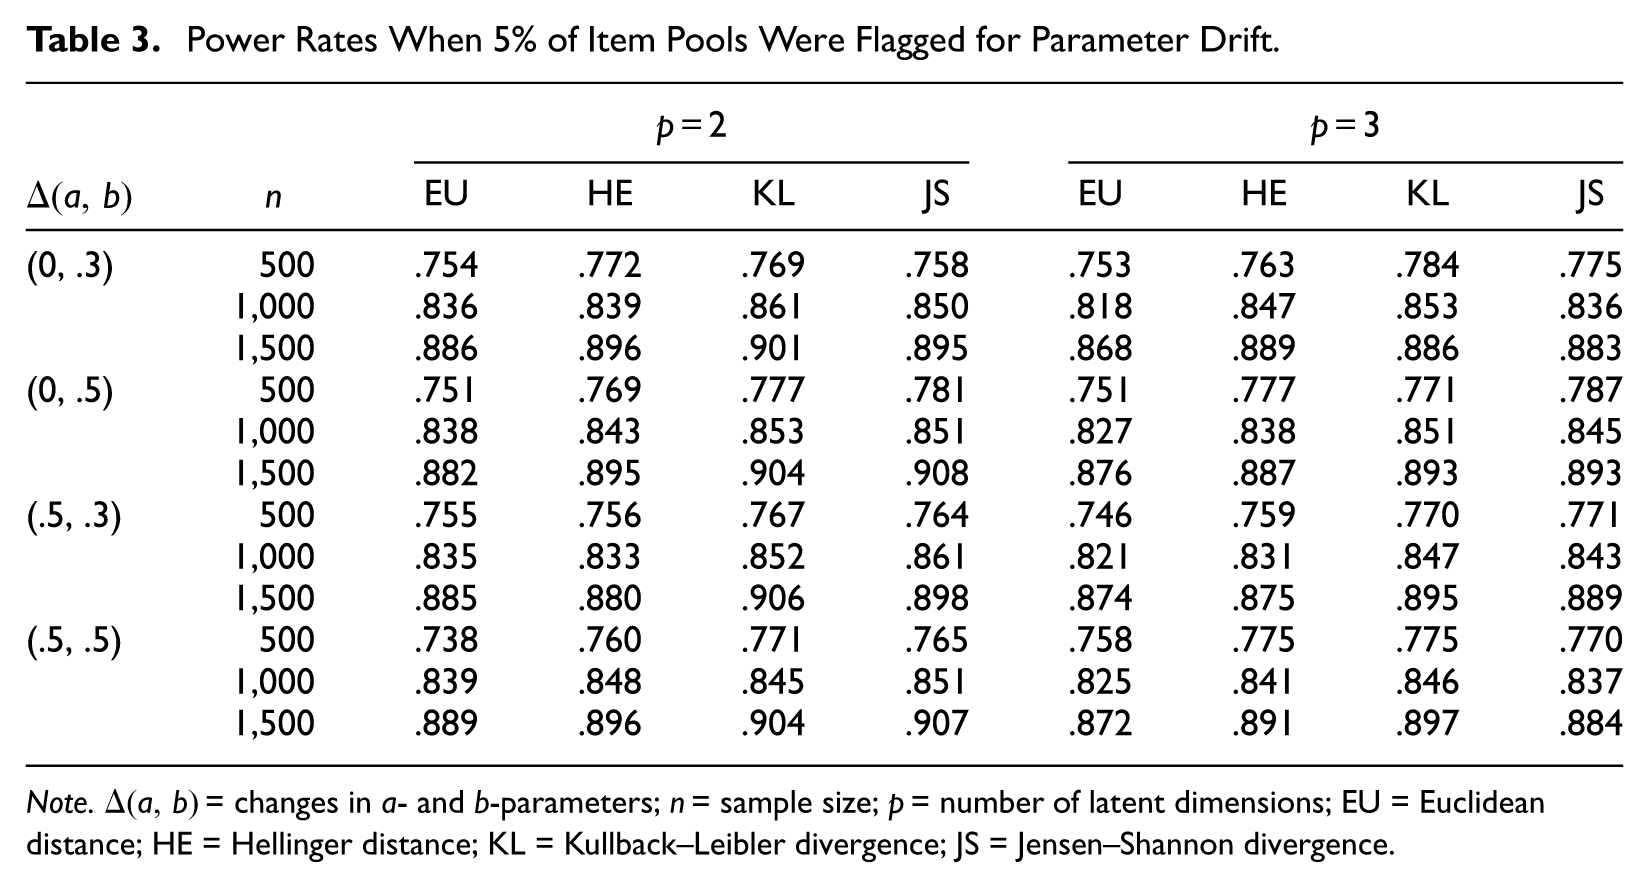
Power Study
Table 3 reports power rates of the distance/divergence measures when 5% of the items in the pool were flagged for parameter drift. The power rate was defined as the proportion of correctly identified drift items in each MCAT administration. For evaluation, power rates above .80 were considered excellent (Cohen, 1992) and rates between 0.70 and 0.80 were considered moderate. In Table 3, the distance/divergence measures identified changes in the item parameters quite effectively despite the presence of multidimensionality. The measures showed moderate power when n was as small as 500 and showed excellent power when n was equal to or greater than 1,000. Overall, increasing n led to substantial improvement in the detecting power for all drift measures. The increase in n also resulted in decreasing SDs of the power rates. SDs of the power rates were on average .108, .094, and .082 in the two-dimensional CAT, and .110, .096, and .084 in the three-dimensional CAT at each conditioned n. These results suggest that the drift measures performed more consistently along with the larger n.
Power Rates When 5% of Item Pools Were Flagged for Parameter Drift.
Note.
In Table 3, the divergence measures in general outperformed the distance measures. The differences between the lowest and highest power rates, however, occurred less than 0.05 in all occasions, indicating that the drift measures under evaluation performed very comparably in detection of drift items. Overall, the impact of the drift level and the drift type on the power rates seemed minor. One plausible explanation for this pattern would be the use of random query vectors in the k-NNs algorithm. As the query vectors were randomly selected, absolute values of the drift statistics could vary depending on the selected query vectors. A direct comparison of the power performances will be less meaningful in such cases despite the systematic differences in the drift level and the drift type. The grid search method, on the contrary, may show distinct patterns related to these factors. According to preliminary studies, when a set of fixed query vectors (e.g., a grid between [−2, 2] at increments of 1) was used in the k-NNs algorithm, the drift measures displayed clear patterns in the power rates as the drift level and the drift type changed. The larger the drift level, the higher the power. The b-drifted items were constantly better detected compared with those with ab-parameter drift.
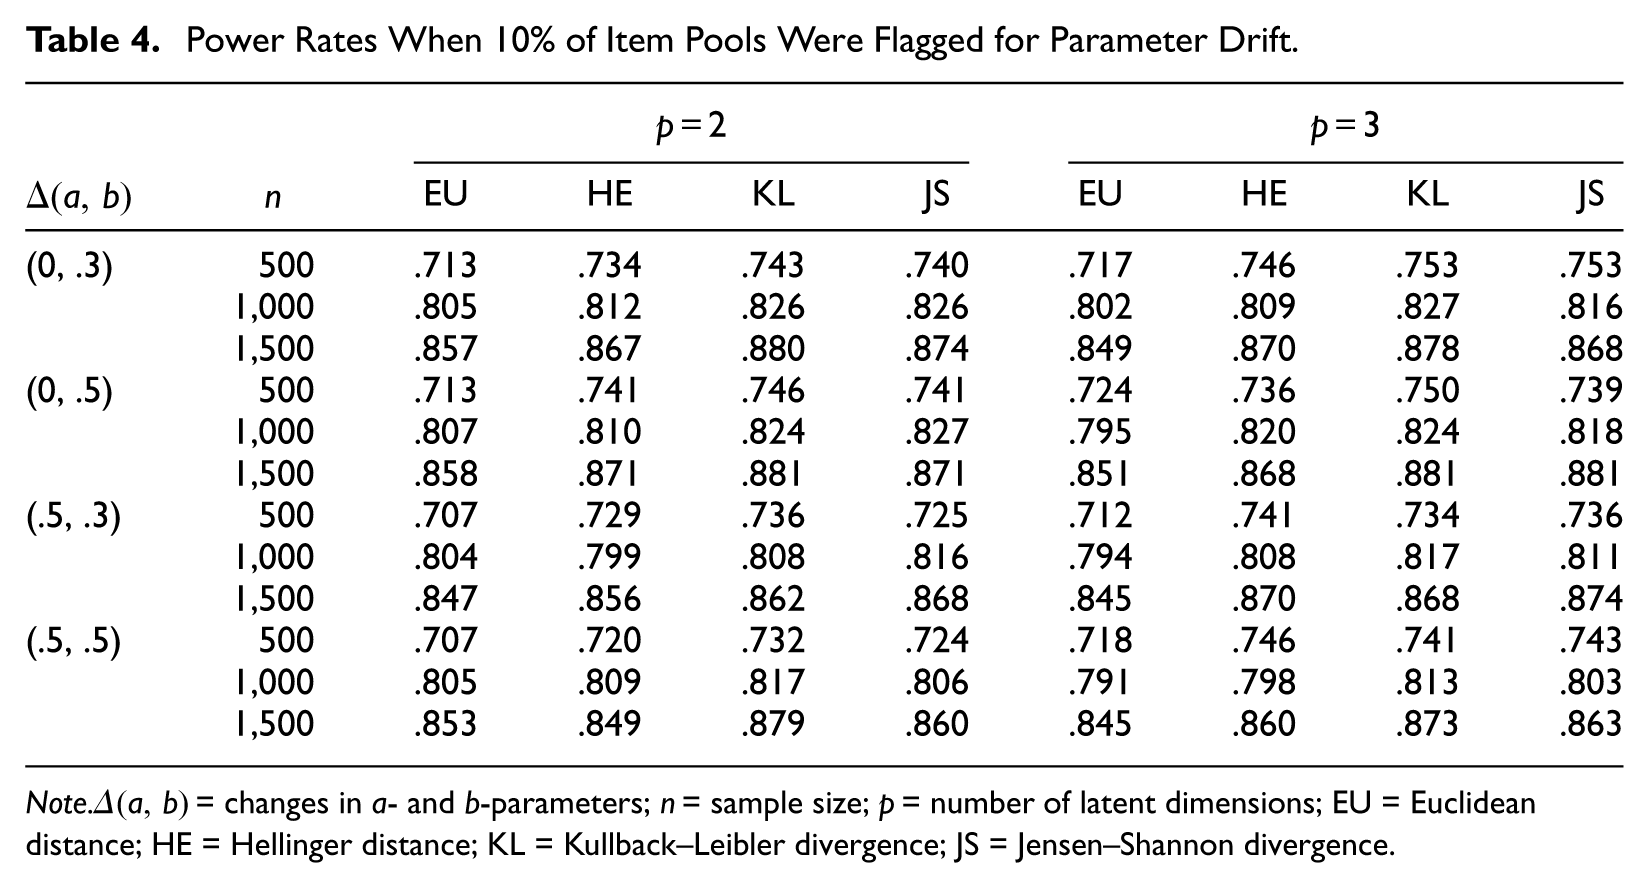
Table 4 provides power rates of the drift measures when 10% of the items in the item pools were flagged for parameter drift. Comparison between Tables 3 and 4 reveals that the proportion of the drift items in the pools had a distinct impact on the power performances of the drift measures. As the item pools included more drift items, the detecting power of the drift measures decreased across all conditions. The extent of the reduction in the power was, however, rather modest; the differences in the power rates occurred less than 0.05 under all conditions controlled for in this study.
Power Rates When 10% of Item Pools Were Flagged for Parameter Drift.
Note.
Conclusion
Preserving the quality of an item pool is essential for any continuous testing program to ensure that test scores have the same meaning over time. The traditional approach to quality control is to routinely recalibrate items and compare parameter estimates with initial values. When data from MCAT are analyzed for parameter drift, difficulties arise due to the multidimensionality and sparseness in the test data. In this article, significance testing procedures were proposed to identify the presence of parameter drift in MCAT without the need for calibrating items and, thereby, without invoking problems related to calibration or linking error. The drift indices were based on four widely used informational distance/divergence measures such that the heterogeneity in the MIRFs could be summarized into a single numeric value. The significance testing was conducted for the difference between two MIRFs, one from the initial item parameter estimates and the other from operational testing. For approximating the MIRFs from the observed data, the k-NNs algorithm was employed with the random query search method.
The simulation study demonstrated the potential of the distance/divergence measures as a drift measure in the MCAT. The drift statistics had explicit sampling distributions and adequate control over Type I error in the null MCAT administrations. The drift measures produced moderate power under the small samples (n = 500) and excellent power as the sample size increased to 1,000. Contamination of the item pools by drift items degraded the power and Type I error performances of the drift measures, yet in a predictable manner.
The procedures developed in this study do not assume any prior model nor require item calibration, and hence, they are inexpensive to use and much less cumbersome than the traditional calibration-based methods. Furthermore, as the procedures need only the knowledge about the response function for computing the drift statistics, they can be easily generalized to other parametric models. The k-NNs technique introduced in this study also promises high potential for approximating the MIRFs in operational testing. Despite changes of samples (and therefore, in data sparseness) over time, it always finds proper sets of matching variables for comparing the MIRFs with comparable precision.
The performance of the distance/divergence measures can be further examined in future studies by systematically varying the item parameter values, the level of parameter drift, the degree of item pool contamination, and so on. In addition, since both the drift analysis and DIF analysis concern whether an item functions the same in different sets of data within the IRT framework, performances of the distance/divergence measures may well be investigated in detecting the existence of DIF. DIF studies will call for additional deliberation on factors such as sample sizes or proficiency differences between examinee groups.
Another issue that merits a systematic study is whether the distance/divergence measures would remain desirable in the presence of MIRF misspecification. As one anonymous reviewer pointed out, items may falsely be flagged for parameter drift because of misfit of the response model in spite of the absence of drift. Previous research has shown that even small amounts of model misfit can result in serious Type I error inflation for parametric DIF detection procedures (Bolt, 2002). A future investigation might well focus on to what extent model misfit affects the performance of the drift measures and whether the distance/divergence measures might offer advantages over fully parametric calibration-based procedures. The present study relied on the assumptions that the item response model being used for MCAT is precisely specified, and the item pools from which items are selected are precalibrated with enough accuracy. Hence, robustness of the drift procedures against the violations of these assumptions will warrant future discussion. A systematic study of this issue would entail an evaluation of Type I error performances under minor violations of the response model or based on an empirical data set in which no parameter drift is expected.
Footnotes
Appendix
Acknowledgements
The authors would like to thank Associate Editor, Dr. Daniel Bolt, and anonymous reviewers for their constructive comments and suggestions to improve the quality of the paper.
Declaration of Conflicting Interests
The author(s) declared no potential conflicts of interest with respect to the research, authorship, and/or publication of this article.
Funding
The author(s) received no financial support for the research, authorship, and/or publication of this article.