
Abstract
This research introduces a latent class item response theory (IRT) approach for modeling item response data from zero-inflated, positively skewed, and arguably unipolar constructs of psychopathology. As motivating data, the authors use 4,925 responses to the Patient Health Questionnaire (PHQ-9), a nine Likert-type item depression screener that inquires about a variety of depressive symptoms. First, Lucke’s log-logistic unipolar item response model is extended to accommodate polytomous responses. Then, a nontrivial proportion of individuals who do not endorse any of the symptoms are accounted for by including a nonpathological class that represents those who may be absent on or at some floor level of the latent variable that is being measured by the PHQ-9. To enhance flexibility, a Box-Cox normal distribution is used to empirically determine a transformation parameter that can help characterize the degree of skewness in the latent variable density. A model comparison approach is used to test the necessity of the features of the proposed model. Results suggest that (a) the Box-Cox normal transformation provides empirical support for using a log-normal population density, and (b) model fit substantially improves when a nonpathological latent class is included. The parameter estimates from the latent class IRT model are used to interpret the psychometric properties of the PHQ-9, and a method of computing IRT scale scores that reflect unipolar constructs is described, focusing on how these scores may be used in clinical contexts.
Background and Motivation
Over the last decade, item response theory (IRT) has played an increasing role in psychopathology research, commonly used in the assessment of constructs such as depression (e.g., Cole et al., 2013; Lee, Krishnan, & Park, 2012), anxiety (e.g., Roberson-Nay, Strong, Nay, Beidel, & Turner, 2007), and addiction (e.g., Liu, Hedeker, & Marmelstein, 2013; Muthén & Asparouhov, 2006). Although gaining more widespread use in psychology, the application of IRT to clinical assessment poses some unique challenges that are often overlooked in the clinical literature (Reise & Revicki, 2015; Reise & Rodriguez, 2016). Perhaps most fundamentally, IRT models assume that instruments measure bipolar constructs (Reise & Waller, 2009), likely stemming from IRT having its origins in educational measurement. Although it is reasonable to assume that many educational constructs are bipolar (e.g., math ability falls along a continuum from far below average to far above average), the bipolar assumption may be less justified in clinical assessment, where psychopathology constructs tend to be positively skewed (Lucke, 2015; Reise & Rodriguez, 2016; Reise & Waller, 2009; Wall, Park, & Moustaki, 2015).
To appreciate why the assumption of a bipolar latent variable may be unrealistic in clinical contexts, depression is considered as measured by the Patient Health Questionnaire (PHQ-9; Kroenke, Spitzer, & Williams, 2001). The PHQ-9 is used extensively in clinical practice and has undergone several psychometric evaluations in clinical and nonclinical samples that are beyond the scope of this research (Kocalevent, Hinz, & Brahler, 2013; Lowe, Kroenke, Herzog, & Grafe, 2004; Martin, Rief, Klaiberg, & Braehler, 2006). The measure comprises nine items that inquire about depressive symptoms over the last 14 days, to which respondents endorse not at all (0), several days (1), more than half the days (2), or nearly every day (3). Figure 1 shows the summed score frequencies for 4,925 individuals who completed the PHQ-9 as a depression screener on the 2012 National Health and Nutrition Examination Survey (NHANES; Centers for Disease Control and Prevention & National Center for Health Statistics, 2012). Approximately 35% of the respondents in this sample endorsed “not at all” for all nine items and received a summed score of 0, a value that corresponds to the lowest possible level of the latent variable.

Summed score frequencies for 4,925 respondents on the PHQ-9.
For simplicity, Figure 1 presents summed scores for these 4,925 individuals, but one could also compute IRT scale scores. In this case, a summed score of 0 would map onto an IRT scale score that suggests a below average level of depression (i.e., a negative score); however, should individuals who endorse none of the items really be described as having “below average” levels of depression? Perhaps the lowest end of the latent variable continuum is not below average depression but the absence of depression (Reise & Revicki, 2015; Reise & Waller, 2009), and if so, scores not at the floor level may be more meaningfully interpreted as someone’s level of depression relative to someone who has no depression (Lucke, 2015). Thus, IRT models that assume a unipolar rather than bipolar latent variable may be better suited for assessing constructs of psychopathology (Reise & Rodriguez, 2016). The summed scores in Figure 1 reveal that depression, at least as measured by the PHQ-9 in a nonclinical sample, may be a unipolar construct (sometimes referred to as a quasi-trait, Reise & Waller, 2009). Some of the existing methodologies for the analysis of arguably unipolar constructs are reviewed first. Then, features of these existing methodologies are combined to develop a more flexible modeling approach for the analysis of the PHQ-9 data, with the possibility of application to other assessments of psychopathology. The computation of IRT scale scores that reflect unipolar constructs is also addressed.
A Log-Logistic IRT Model for Unipolar Constructs
Lucke proposed a class of IRT of models that he refers to as unipolar item response models (UIRMs), in which a nonnegative latent variable underlies someone’s responses to items on a clinical assessment (Lucke, 2014, 2015). Based on Stevens’ (1957) psychophysical power model (Thomas, 1983), Lucke’s model treats item responses as manifestations of a nonnegative latent variable

in which
The UIRM for dichotomous responses can be viewed as a transformation of the traditional 2 parameter logistic (2PL) IRT model that assumes a bipolar latent variable, and as pointed out in Reise and Rodriguez (2016), crude approximations of the UIRM item parameter estimates can be obtained through simple transformations of the 2PL item parameters:
Box-Cox Normal Transformation for the Latent Variable Distribution
Lucke’s log-logistic model assumes that the latent variable follows a log-normal(0,1) distribution in the population. Although the log-normal distribution is commonly used to model nonnegative, positively skewed data, other latent variable densities may also be appropriate. One approach involves empirically estimating the latent variable density to account for nonnormality (Woods, 2006, 2007; Woods & Thissen, 2006). Another option is to approximate the latent variable density with a skew-normal distribution (Molenaar, 2015; Molenaar, Dolan, & de Boeck, 2012). Others have adopted a mixture modeling approach, using a mixture of normal and degenerate distributions to accommodate heterogeneous populations (Muthén & Asparouhov, 2006; Wall et al., 2015). For consistency with Lucke’s log-logistic model, the log-normal(0,1) population density is retained but additional flexibility is introduced by allowing the transformation parameter to be determined empirically. The Box-Cox transformation is a power transformation in which an additional parameter

where

The log-normal distribution is a special case of the Box-Cox normal distribution in which
Latent Class Item Response Models for Zero-Inflated Data
A common artifact of measuring constructs of psychopathology is zero inflation—that is, a floor effect of summed or scale scores that is the result of a subset of individuals in the sample who do not exhibit any degree of the psychopathology that is being measured. One approach to modeling constructs of psychopathology that exhibit such zero inflation is mixture or latent class IRT, in which the latent variable density is specified as a mixture of normal and degenerate distributions to accommodate population heterogeneity (Finkelman, Green, Gruber, & Zaslavsky, 2011; Magnus & Thissen, 2017; Wall et al., 2015). According to the latent class IRT model, the trace line describing the conditional probability of endorsing a particular response category is expressed as a function of both a latent variable and a group membership,

in which
Finkelman et al. (2011) analyzed psychopathology data using a similar model, also including a latent class to account for a subset of the individuals who endorse all of the items on a symptoms checklist. More recently, Magnus and Thissen (2017) used latent class IRT to model zero-inflated and maximum-inflated symptom frequency data on a measure of emotional health. Applications of latent class IRT modeling demonstrate its usefulness in describing zero-inflated data that often arise in the assessment of nonclinical samples; however, existing applications of this method have assumed a normal density for those who fall along the latent variable continuum, implying a bipolar latent variable for members of the pathological class. If depression truly is a unipolar construct, a model that takes into consideration the unipolar nature of the construct within the pathological class while simultaneously accounting for the zero inflation that manifests from within the nonpathological class may be more appropriate. Individuals belonging to the nonpathological class can receive a score that is substantively meaningful within the framework of a unipolar latent variable: zero.
The Proposed Model
A latent class item response model that extends Lucke’s UIRM is proposed to (a) accommodate polytomous item responses that are frequently found on measures of psychopathology, and (b) account for zero inflation that can often occur on such measures. To enhance flexibility, the assumption of a log-normal population density is also relaxed by specifying a Box-Cox normal distribution for the latent variable. The skewness of the latent variable can then be characterized by a transformation parameter that is estimated directly from the item response data, with values near zero providing support for a log-normal population density. As shown here, maximum likelihood estimation can be used as an alternative to the Bayesian methods described by Lucke (2014, 2015).
Lucke’s UIRM model can be generalized to polytomous responses by introducing a category-specific easiness parameter,

where

The severity parameter
To allow for the possibility of a nonpathological group, a latent class IRT approach similar to that of Wall et al. (2015) is adopted. The nonpathological class represents some, perhaps many, of the people in the sample who do not endorse any of the symptoms and do not have any degree of depression. They can be thought of as being absent on or at some floor level of depression. The pathological class represents everyone else. Importantly, the pathological class is expected to include some individuals who do not endorse any of the symptoms but still have some degree of depression (i.e., their symptoms are not addressed by the measure). Anyone who endorses at least one of the symptoms is automatically a member of the pathological class. Importantly, everyone in the population is considered “at risk” of depression—there is no one to whom the construct does not apply. It is instead a question of whether all who are at risk are believed to have depression.
Let

where
Let

In Equation 8,
Goals of the Current Research
The primary goal of this research was to combine existing psychometric approaches to model data where (a) the construct of interest is arguably unipolar, and (b) there is a large degree of zero inflation. Responses to the PHQ-9 serve as motivating data. First, Lucke’s log-logistic UIRM is extended to accommodate polytomous item responses. Then, flexibility is incorporated by using a Box-Cox normal transformation for the latent variable distribution. Finally, the issue of zero inflation that is not accounted for by the IRT model is addressed by including a latent class that describes a proportion of individuals who do not endorse any of the items and may be absent on the latent variable (i.e., they do not have depression). To test the usefulness of this approach over more parsimonious modeling techniques, four models are compared in sequence: a log-logistic UIRM with a log-normal prior, a log-logistic UIRM with a Box-Cox normal prior, a zero-inflated log-logistic UIRM with a log-normal prior, and a zero-inflated log-logistic UIRM with a Box-Cox normal prior. All model parameters were estimated with maximum likelihood using nlm, R’s general optimizer, by minimizing the negative of the log likelihood function specified in Equation 8 (R Core Team, 2016). As a secondary goal, a method of computing IRT scale scores “As a secondary goal, a method of computing IRT scale scores for unipolar latent variables in the presence of a nonpathological class is described.” for unipolar latent variables is described in the presence of a nonpathological class.
Empirical Analysis of the PHQ-9
Model Comparison
Table 1 contains model fit statistics and parameter estimates for the four models of interest. To compare the performance of the log-normal and Box-Cox normal priors, the two models in the upper panel of the table that do not include a nonpathological class are first considered. In this scenario, all individuals are assumed to belong to the pathological class. Of these two models, both the Akaike information criterion (AIC) and Bayesian information criterion (BIC) support the model with a log-normal prior. Furthermore, the Box-Cox transformation parameter is very close to 0 (
Fit Statistics and IRT Parameter Estimates for the Four Log-Logistic IRT Models.
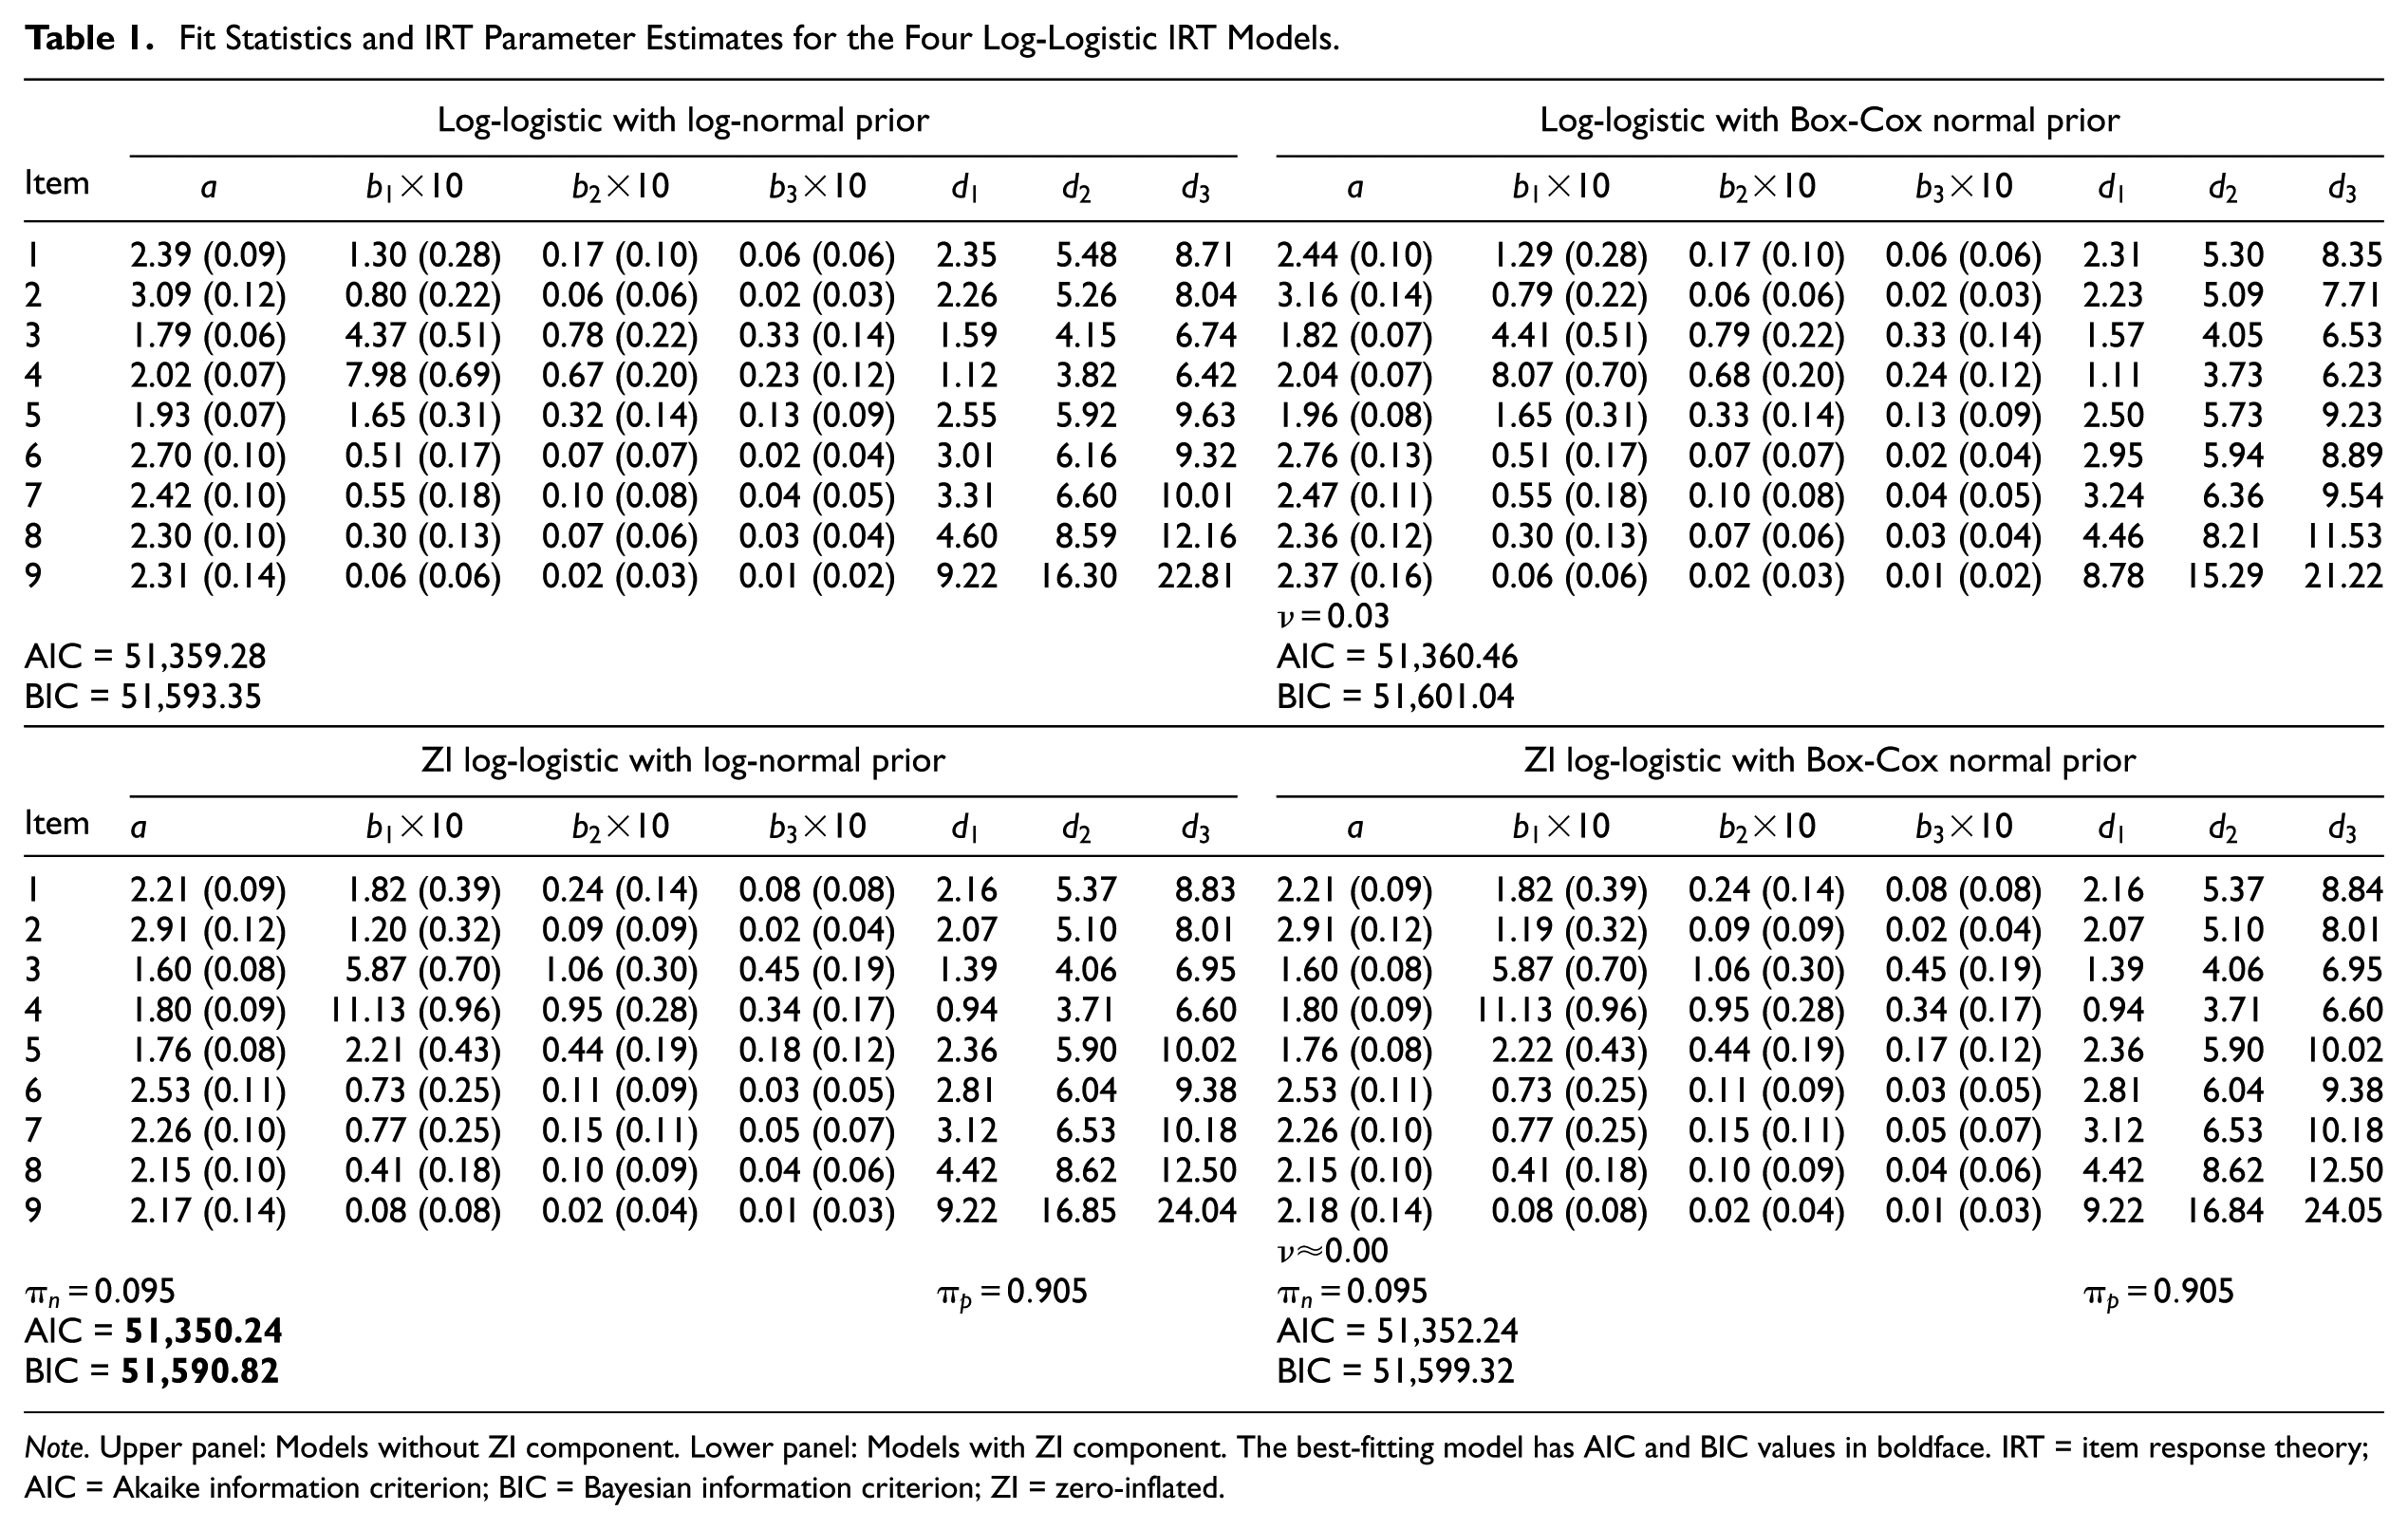
Note. Upper panel: Models without ZI component. Lower panel: Models with ZI component. The best-fitting model has AIC and BIC values in boldface. IRT = item response theory; AIC = Akaike information criterion; BIC = Bayesian information criterion; ZI = zero-inflated.
Item parameter estimates can also be found in Table 1. Note that easiness parameters

Trace lines for the PHQ-9 items.
The two models that include a nonpathological class are considered next. Although the IRT model alone is expected to capture some of the all-0 response patterns, specifying a nonpathological class may be necessary to more completely account for the floor effect that is driven by those who do not endorse any of the symptoms. The fit statistics and parameter estimates from the zero-inflated UIRMs can be found in the lower panel of Table 1. Four findings are particularly noteworthy. First, both the AIC and BIC favor the zero-inflated UIRM with a log-normal prior over its Box-Cox normal counterpart. Second, the Box-Cox transformation parameter estimate is approximately 0, which indicates that after accounting for zero inflation in these data, the log-normal density adequately describes the latent variable distribution. Third, and related to the adequacy of the log-normal prior, the item parameter estimates of the two models are nearly identical. After incorporating a nonpathological class, there is essentially no difference between these two models when fit to the PHQ-9 data: The Box-Cox normal density becomes equivalent to the log-normal density. The trace lines for both models are shown with the dashed black lines in Figure 2. Because both models yield identical parameter estimates, the trace lines completely overlap; thus, only one set of dashed lines is shown. Fourth, it is the inclusion of the zero-inflated component, rather than allowing additional skewness in the latent variable density, that is able to capture the excess zeros in the data: Both versions of the zero-inflated model fit better than their counterparts without the nonpathological class.
In comparing across the four models, both the AIC and BIC support the zero-inflated log-logistic UIRM with a log-normal prior. The parameter estimates in Table 1 reveal that explicitly modeling the nonpathological class reduces the magnitudes of the item discrimination parameters by as much as 11%: Omitting the nonpathological class from the model suggests that the items have greater discriminatory power than they likely do, a finding consistent with prior research (Wall et al., 2015). This finding is not unexpected: As true of bipolar IRT models, unipolar models are susceptible to inflated discrimination parameters in the presence of excess zeros. Although it is the estimates of the discrimination parameters that are most affected, the magnitudes of the severity parameters also change depending on whether the nonpathological class is included. Differences can be seen more clearly in the trace lines in Figure 2. Incorporation of a nonpathological class has little effect at low levels of depression. For individuals with low depression levels (
Interpretation of the Zero-Inflated Log-Logistic UIRM
Because model fit statistics and parameter estimates suggest that the zero-inflated log-logistic UIRM with a log-normal prior best describes the data, this is the model of interpretational focus for the remainder of the paper. Relevant parameter estimates can be found in the lower left corner of Table 1. Approximately 9.5% of the sample is estimated to belong to the nonpathological class. According to the model, these are individuals who, while at risk of depression, exhibit a complete absence on the latent variable. Of the 1,741 all-0 response patterns observed in the data, around 27% of them are expected to have come from members of the nonpathological class. The remaining 73% all-0 response patterns belong to individuals who possess some level of depression even though they did not endorse any of the symptoms.
Similar to conventional IRT models, items with higher discrimination parameters
Interpretation of the severity parameter for category
Based on the severity parameter estimates for the zero-inflated log-logistic UIRM in Table 1, there appear to be three “bundles” of items, a term introduced by Lucke (2015) to describe how sets of items relate to the severity of the psychopathology. The item bundle that best measures people who are low on depression includes those items asking about sleep and energy levels: Even individuals with low levels of depression are moderately likely to endorse these symptoms. In contrast, the item with the highest severity parameters, and thus the item that is most appropriate for measuring people with high levels of depression, asks about thoughts of self-harm or suicide. The remaining six items fall somewhere in the middle.
The item bundling is more easily described graphically in Figure 3, which depicts the relationship between someone’s underlying level of depression and the expected response category of endorsement. Most noticeably, one must be much higher on depression before being expected to endorse “several days” or higher for the item about thoughts of self-harm or suicide (i9), shown with the dashed black line. The item about difficulties with moving and speaking (i8), shown with the dotted gray line, also stands out for its higher severity, such that compared with the other items, one must be relatively high on depression before being expected to endorse one of the more extreme response categories. On the contrary, the items about sleep (i3) and energy (i4), shown with the pair of dashed gray lines, are rather easily endorsed, even at low levels of depression. As depression increases, however, most of the item bundling disappears, except for the item about thoughts of self-harm or suicide (i9).

Expected response category endorsement as a function of depression.
Finally, the large degree of redundancy of the middle two response categories is noted: “several days” and “more than half the days.” This is most clearly seen in Figure 2. At low levels of depression (e.g.,
Conditional Scoring
One of the advantages of zero-inflated UIRMs is that unlike IRT models that assume a bipolar latent variable, there is an absolute zero point that has a natural interpretation for members of the nonpathological class; a score of 0 implies an absence of depression. All other scores can be interpreted as the severity of depression relative to zero. Approximately 9.5% of the sample was estimated to belong to the nonpathological class. Based on this estimate, 468 of the all-0 response patterns belong to people who are absent on depression, and the remaining 1,273 all-0 response patterns belong to members of the pathological class. According to the model, these 1,273 individuals have some degree of depression, even though they did not endorse any of the symptoms. Unlike members of the nonpathological class, they receive scale scores that are slightly greater than 0 to indicate that they have some (mild) degree of depression that was not captured by the measure.
To compute scores, all response patterns that included the endorsement of at least one symptom (

where
Assigning scores to individuals with all-0 response patterns is less straightforward. Unlike response patterns that include the endorsement of at least one symptom, which must belong to the pathological class, without additional data or covariates, all-0 response patterns cannot be directly classified at the individual level. If the goal is to simply identify the distribution of scores at the population level and not to assign scores to individual respondents, one option is to assign a score of 0 to 27% (
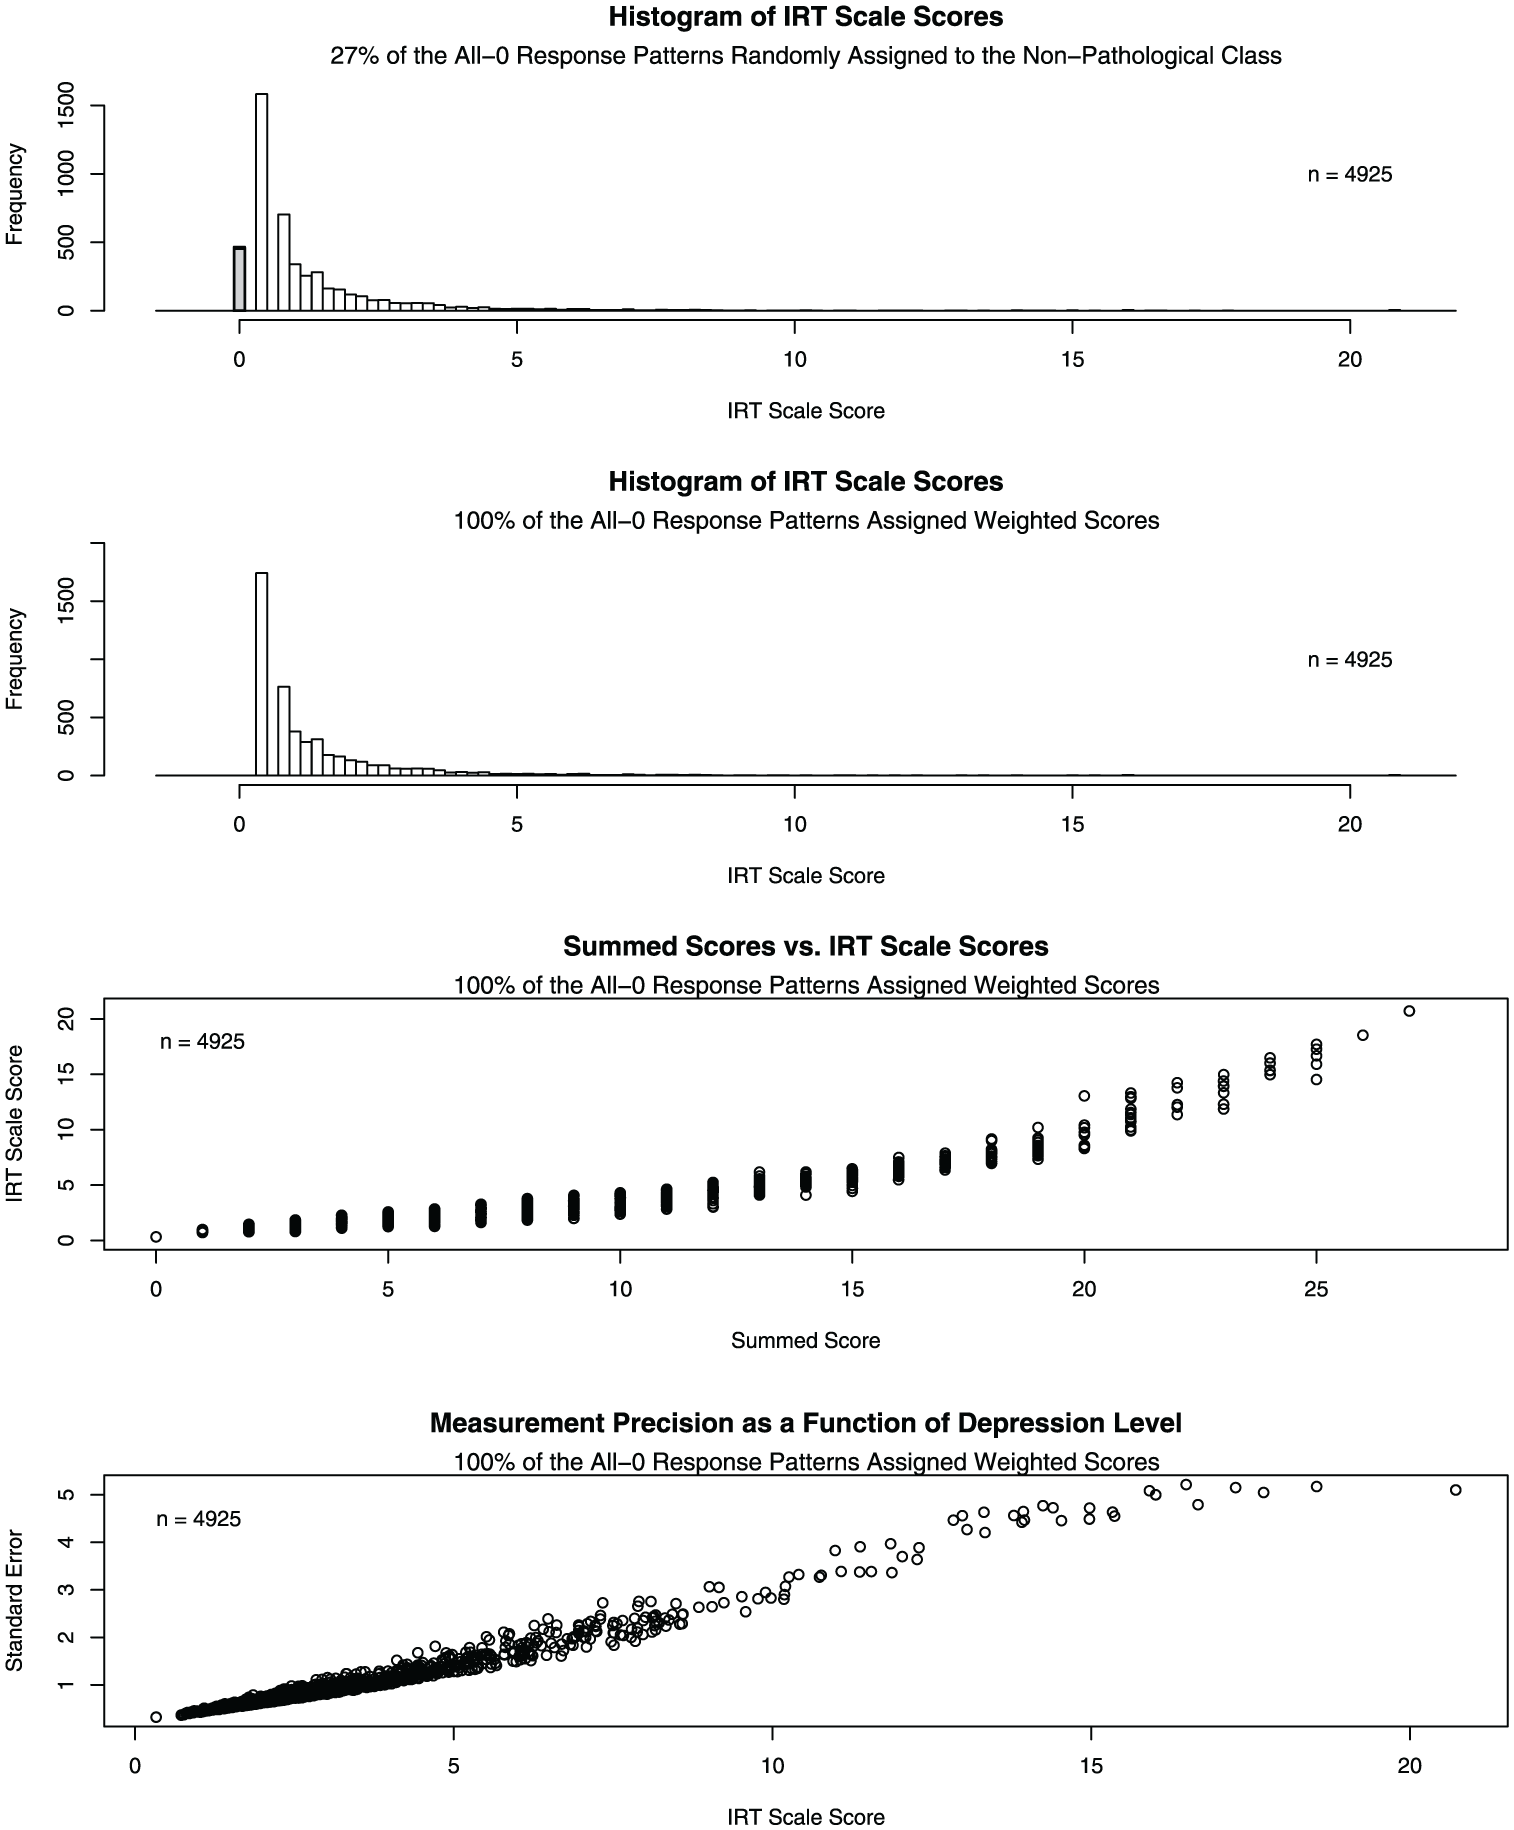
IRT scale scores and summed scores for the PHQ-9
A second scoring approach is to use a posterior modal classifier to assign each of the all-0 response patterns to the latent class with the highest posterior probability. In the present case, the only information available to determine the posterior probability is the response pattern; thus, the posterior probability of belonging to the nonpathological class is 27% for everybody with an all-0 response pattern. Accordingly, 100% of the all-0 response patterns would be classified as pathological and receive scores based on the log-logistic UIRM. Unlike the previous scoring method, this approach does not require the random assignment of 73% of the all-0 response patterns to the pathological class; however, posterior modal classification is likely better suited for cases in which covariates are available to further differentiate the posterior probabilities among people with all-0 response patterns. For this reason, a third scoring method that does not require the assignment of all-0 response patterns to a latent class is proposed. The remainder of score interpretation is based on this alternative scoring method.
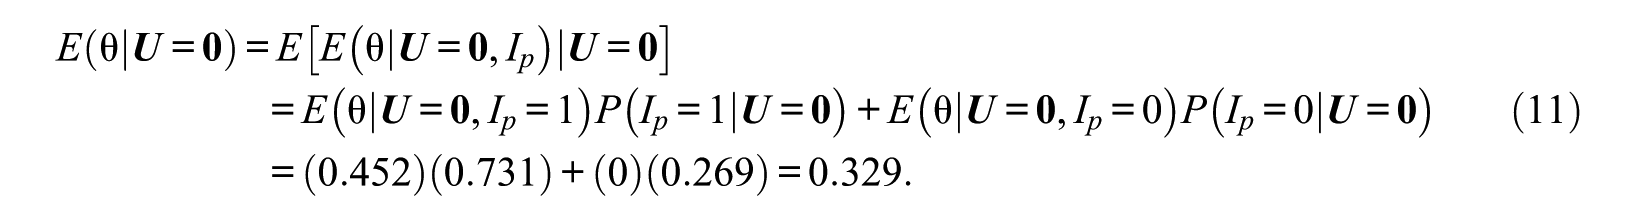
In the absence of additional data that may be able to differentiate all-0 response patterns belonging to members of the nonpathological class from those belonging to members of the pathological class, an alternative approach to scoring is to compute a weighted score for the all-0 response patterns that is based on the conditional probability of belonging to each class. Given that one has an all-0 response pattern, the probability of belonging to the pathological class is approximately 0.731. Thus, the expected scale score for an all-0 response pattern can be obtained by weighting the
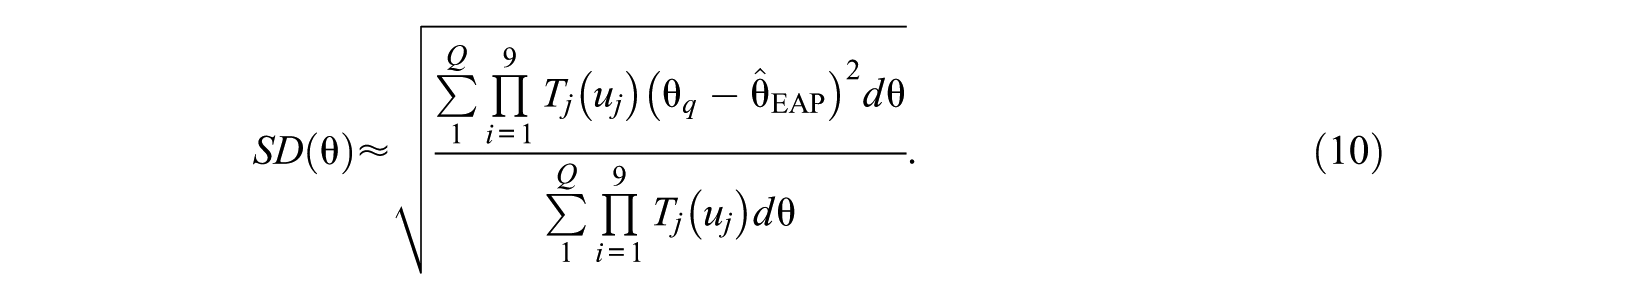
A similar method can be used to derive the weighted posterior standard deviation for an all-0 response pattern:

According to the combined scoring approach, all-0 response patterns receive a scale score of
The third panel of Figure 4 shows the relationship between summed scores and IRT scale scores for all respondents, regardless of latent class membership. With the exception of people who respond to every item with “nearly every day,” there is substantial variability in the scale scores that correspond to each possible summed score. This is an advantage of using scale scores over summed scores: Even individuals with the same summed score may have different levels of depression. As summed scores increase, IRT scale scores tend to spread out, suggesting that scores from the UIRM are better able to differentiate among individuals who are high on the psychopathology.
The lower panel of Figure 4 shows standard errors as a function of scale scores for all respondents, where the standard error corresponding to the minimal scale score was computed as shown in Equation 12. In general, scores lose precision as depression levels increase. This feature is in contrast to what is typically found in fitting conventional IRT models, where scale scores near item location parameters tend to be estimated with the greatest degree of precision. Although the UIRM allows for better separation of individuals who are high on the latent variable, there is also greater uncertainty associated with these individuals’ scores.
Discussion and Conclusion
This research introduces a novel approach for modeling zero-inflated data that arise from potentially unipolar clinical constructs by combining two different methodologies: Lucke’s log-logistic UIRM for measuring unipolar constructs and a latent class IRT model that can account for population heterogeneity—that is, a nonpathological class. In addition to generalizing Lucke’s log-logistic UIRM to polytomous item responses, the model is further extended by using a Box-Cox normal prior to empirically determine a transformation parameter to describe the latent variable distribution in the population. The estimate of the Box-Cox parameter can provide support for use of the log-normal distribution, as shown in the present study, or it can suggest an alternative transformation. In either case, it is helpful in choosing an appropriate prior for the UIRM. Finally, as shown here, model parameters can be estimated within a maximum likelihood framework in addition to a Bayesian framework (Lucke, 2014, 2015).
Unipolar models may be inherently appropriate for measuring latent variables that are believed to have a natural zero point, which often coincides with zero inflation, but the results of this study suggest that a zero-inflated component is also needed to account for all of the people who do not endorse any of the psychopathology symptoms. Including a nonpathological class not only improves model fit, but it is substantively justified. When administering a psychopathology questionnaire to a nonclinical sample, it is likely that some respondents are absent on the construct that is being measured (Reise & Rodriguez, 2016; Wall et al., 2015). Thus, it is reasonable to treat these individuals as belonging to a qualitatively different class from those who do have some level of depression but do not endorse any of the symptoms. Rather than assigning individuals from the nonpathological class an arbitrarily large negative value of
One of the advantages of the proposed model is that the proportion of people who belong to the nonpathological class is estimated from the model; however, one of the disadvantages of the model is that without additional data, it is not possible to identify which all-0 response patterns belong to members of the nonpathological class. If a researcher is interested in scores only at the population level, this is not necessarily a problem. If a clinician wishes to score and diagnose individuals as being pathological or nonpathological, however, it is impossible to determine which score to assign to individuals with all-0 response patterns. A partial solution is offered by assigning these individuals a scale score that is a weighted average of the
Although the primary goal of this study was to demonstrate the feasibility of applying a novel method to the analysis of general unipolar constructs, this research also reveals several features of the PHQ-9 that may be of interest to applied researchers. First, application of the zero-inflated log-logistic UIRM suggests a small number of item bundles. Items can be grouped into bundles according to the location of the latent variable where they are best able to measure individual differences. For example, the items pertaining to sleep and energy levels are better at separating individuals who are low on depression, whereas the item about thoughts of self-harm or suicide is most relevant at high levels of depression. Results also suggest that when respondents are asked to report symptom frequencies over a 14-day period, the “several days” and “more than half the days” response categories are largely indistinguishable. Thus, researchers may wish to consider combining these response categories before administering instruments with a similar recall period.
In this case, it is noted that the decision to use a unipolar model is based on a theoretical justification rather than an empirical one. Because the zero-inflated log-logistic UIRM proposed here is simply a transformation of a zero-inflated GRM that assumes a bipolar latent variable, statistical evidence is unable to support one model over the other: The model log-likelihoods are identical. However, the unipolar framework may be more conceptually appealing in measuring constructs such as depression because of its absolute zero point on the latent variable scale. Depression can arguably be viewed as a unipolar trait because, unlike other constructs, it is possible to possess no level of the psychopathology. Others have similarly argued that because the opposite of depression may be the absence of depression rather than happiness, it is reasonable to consider depression as a unipolar trait (Reise & Rodriguez, 2016; Reise & Waller, 2009). Lucke (2014, 2015) advocates for the use of substantive theory in guiding one’s decision about whether a trait is unipolar, suggesting that treating a trait as unipolar is justified in cases where there is likely to be a multiplicative effect of the latent variable on symptom manifestation. Finally, it should be noted that depression may be qualitatively different from other potentially unipolar constructs of psychopathology where some people are not at risk because they do not partake in the associated behaviors (e.g., gambling addiction). Further substantive research on the theory of depression may provide more compelling evidence that the treatment of depression as a unipolar construct for which everyone is at risk is warranted.
Footnotes
Declaration of Conflicting Interests
The author(s) declared no potential conflicts of interest with respect to the research, authorship, and/or publication of this article.
Funding
The author(s) received no financial support for the research, authorship, and/or publication of this article.