
Abstract
Decisions on how to calibrate an item bank might have major implications in the subsequent performance of the adaptive algorithms. One of these decisions is model selection, which can become problematic in the context of cognitive diagnosis computerized adaptive testing, given the wide range of models available. This article aims to determine whether model selection indices can be used to improve the performance of adaptive tests. Three factors were considered in a simulation study, that is, calibration sample size, Q-matrix complexity, and item bank length. Results based on the true item parameters, and general and single reduced model estimates were compared to those of the combination of appropriate models. The results indicate that fitting a single reduced model or a general model will not generally provide optimal results. Results based on the combination of models selected by the fit index were always closer to those obtained with the true item parameters. The implications for practical settings include an improvement in terms of classification accuracy and, consequently, testing time, and a more balanced use of the item bank. An R package was developed, named cdcatR, to facilitate adaptive applications in this context.
Keywords
Adaptive testing methodologies, originally developed in the context of traditional item response theory (IRT), are being generalized to more complex scenarios, including cognitive diagnostic computerized adaptive testing (CD-CAT; for a review, see Akbay & Kaplan, 2017; Huebner, 2010). CD-CAT is based on cognitive diagnosis models (CDMs), which are specifically developed to detect mastery and nonmastery of set of latent fine-grained skills. Some of the decisions that will affect the performance of the adaptive algorithms in this context involve the internal structure of the test specified in the Q-matrix and model selection. The identification of the Q-matrix is a laborious process where many professionals are typically involved. For example, in the development of a Q-matrix for a proportional reasoning test, a diverse group composed of mathematics researchers, mathematics educators, middle school teachers, and graduate students in psychometrics and mathematics education was involved in Tjoe and de la Torre (2014)’s study. Examinees are also generally considered using think-aloud protocols to validate the theoretical framework (e.g., Li & Suen, 2013). The usual next step is to evaluate the initial Q-matrix using empirical Q-matrix validation methods and evaluating the fit of the different specifications (e.g., Sorrel et al., 2016).
Arguably, the element that has received less attention is model selection. How to choose among the wide range of CDMs available is not an easy decision. Each CDM assumes a different cognitive process involved in responding to an item (e.g., conjunctive, disjunctive, or additive condensation rules). Besides, many CDMs have been created ranging in complexity. In this sense, recent developments have produced general CDMs such as the generalized deterministic inputs, noisy, “and”gate (G-DINA; de la Torre, 2011) model, the general diagnostic model (GDM; von Davier, 2005), and the log-linear CDM (LCDM; Henson et al., 2009). Reduced models are nested within these general models. Examples of reduced CDMs are the deterministic inputs, noisy “and” gate (DINA; Haertel, 1989) model, the deterministic inputs, noisy “or” gate (DINO; Templin & Henson, 2006), and the additive CDM (A-CDM; de la Torre, 2011). Due to its relative novelty, CD-CAT empirical applications are still scarce. A trend may be noted, however, toward the use of the same CDM for all the items in the item bank. For example, H. Y. Liu et al. (2013) applied a noncompensatory CDM, the DINA model, to a 352-item English language proficiency item bank. Reduced models have been widely used by researchers because of their simplicity of estimation and interpretation. However, these models make strong assumptions on the data and that’s why their fit to the actual data should be evaluated.
Compared to reduced models, general models offer the advantage of wide applicability; they allow for all types of condensation rules within the same test. This is the case, for example, of the CD-CAT application by Sorrel, Yigit, and Kaplan (2017) where the authors applied the G-DINA model to a 76-item proportional reasoning item bank. This alternative might be more appropriate since previous empirical studies have shown that no reduced model can be deemed appropriate for all test items (e.g., de la Torre et al., 2018; de la Torre & Lee, 2013; Ravand, 2016). Nevertheless, accurate calibration of parameters in a general model is more dependent on data conditions (e.g., sample size), and the risk of capitalization of chance is higher. Owing to these shortcomings, researchers introduced item-level model comparison indices like the likelihood ratio (LR) for the purpose of relative-fit evaluation (Sorrel, Abad, et al., 2017). This allows for an intermediate situation between the two extremes (i.e., single reduced CDM vs general model). The idea is to select the most appropriate CDM for each item. A further development on the LR test, the two-step LR test (2LR) demonstrated promise as a tool for assessing item relative fit in CDMs (Sorrel, de la Torre, et al., 2017). Importantly, the 2LR test is expected to perform very well under the usual item bank calibration conditions, typically involving a large number of items (Sorrel, Abad, et al., 2017; Sorrel, de la Torre, et al., 2017).
According to previous research, model selection might have an impact on classification accuracy (Ma et al., 2016; Rojas et al., 2012) and the generalization of the item parameter estimates (Olea et al., 2012). In that respect, Rojas et al. (2012) found that single reduced models, when appropriate, led to a better classification accuracy compared to general models. This was more notable in poor-quality conditions, where it was more difficult to estimate the general model (e.g., small sample size and low item discrimination). In the context of IRT, Olea et al. (2012) explored the consequences of fitting a complex model under poor-quality item bank calibration conditions. They found that a parameters of the three-parameter logistic model were overestimated, causing an overestimation of the precision of the trait-level estimates. Despite its potential benefits, relative model fit is not systematically evaluated in empirical applications. According to the review by Sessoms and Henson (2018), most of the studies estimated reduced CDMs like the DINA model, and 28% of them did not report model fit.
Therefore, all together, previous research indicates that test calibration conditions are highly related to the accuracy of the model estimates. This would be of major importance in the context of adapting testing where items are selected based on their parameter estimates. Considering all above, this study investigates whether item-level model comparison indices can be useful to improve CD-CATs performance in terms of classification accuracy and item usage. The rest of the article is structured as follows. First, a detailed overview on CDM, item-level model comparison, and CD-CAT is provided. Second, the design of the simulation study is described, and the results under the different conditions are presented. Finally, several implications and limitations of this study are discussed.
Cognitive Diagnosis Modeling
CDMs are confirmatory latent class models that are receiving increasing attention in the literature (for an overview of these models see, e.g., Rupp & Templin, 2008). The goal of CDM is to classify respondents as masters or nonmasters on a set of prespecified list of K discrete attributes (e.g., skills, cognitive processes, and disorders). This latent attribute vector or latent class can be denoted by

where
Reduced CDMs can be formed by constraining some of the parameters of this general model. In this article, we consider three of these reduced models: DINA, DINO, and A-CDM. In the DINA model, all terms in Equation 1 except the baseline probability and the highest interaction term are set to 0. The DINA model only has two parameters per item: the guessing parameter represented by
Item-Level Model Comparison
Among all the competing models, the Occam’s razor principle dictates that the simplest should be chosen. One of the reasons for doing that is to avoid the capitalization on chance problem. Different studies pointed out that particularly when the sample size is small and the item quality is poor, an appropriate reduced CDM will lead to a higher accuracy (Ma et al., 2016; Rojas et al., 2012). The advantage of using a reduced CDM will be greater the more complex the item structure is. In the case of minimum complexity (i.e., one-attribute items), it is irrelevant which CDM is applied because all of them are equivalent. In contrast, more complex items will lead to different IRF specifications according to the different CDMs. In this sense, the DINA and DINO models will always have two parameters per item regardless of the item complexity, but the number of item parameters will linearly and exponentially grow for the A-CDM and G-DINA models, respectively. Sample size requirements for estimation of item parameters in complex structures will be stricter.
Model comparison can be conducted at the item level using relative fit statistics such as the Wald and LR tests (for a comparison of these tests see, e.g., Sorrel, Abad, et al., 2017; Sorrel, de la Torre, et al., 2017). They allow selecting the most appropriate reduced model for each item. The traditional implementation of the LR test requires both the general and the reduced CDM to be estimated. Sorrel, de la Torre, et al. (2017) proposed a more efficient approximation with the advantage of only requiring the more general model to be estimated, referred to as two-step LR test (2LR). Item-level maximum likelihoods for the competing models are estimated using the following formula:

where

where
Cognitive Diagnosis Computerized Adaptive Testing
This is a new area of application that has been aided from the developments in traditional CAT. Unfortunately, because latent variables in CDMs are discrete, item selection methods based on the Fisher information cannot be applied in CD-CAT. However, several item selection indices have been proposed for CD-CAT, including the G-DINA model discrimination index (GDI; Kaplan et al., 2015). This index yielded shorter test administration times compared to the other item selection methods (e.g., modified posterior weighted Kullback–Leibler). The next item to be selected by the adaptive algorithm is the one with the highest GDI:

where
Goal of the Present Study
This study aims to explore the impact of item bank calibration on the CD-CAT performance. Specifically, it is assessed to what extent a better performance can be obtained when an appropriate reduced CDMs is chosen for each item using the 2LR test. Hypothetically, the 2LR test will show a very good performance under the usual item bank calibration conditions. Thus, it is expected that this index will be useful in improving CD-CAT performance. Compared to a situation where a general model is estimated for all the items, a combination of models derived by the 2LR test will require estimating fewer parameters. Thus, these parameters will be estimated more accurately, having an impact on the classification accuracy. In addition, item usage under the different item bank calibration conditions will be explored. A simulation study was conducted to address these research questions. Only low item discrimination conditions are considered because a larger improvement can be expected in these situations.
Method
A simulation study was conducted to evaluate the classification accuracy and item usage obtained with each of the model calibrations described: G-DINA, 2LR-derived combination of models, DINA, DINO, and A-CDM. For comparison purposes, true item parameters were also considered, which allows obtaining an estimation of the upper limit for the classification accuracy. Factors and levels were selected based on a literature review of current CDM and CD-CAT empirical applications. Three data factors were varied, namely the calibration sample size (N = 250, 500, and 2,000 respondents), the item bank length (J = 165 and 330 items), and the Q-matrix complexity (Q-str = simple and complex Q-matrix structure). More specifically, Q-matrix complexity was understood as the number of attributes being measured by each of the items. Two levels were considered for this factor. In the simple Q-matrix condition, 45 one-, 60 two-, and 60 three-attribute items were generated. On the contrary, in the complex Q-matrix condition, 60 two-, 60 three-, and 30 four-attribute items were generated, and 15 additional one-attribute items were also included to ensure identifiability of the Q-matrix (Xu, 2017). In the J = 330 item conditions, these numbers were doubled.
The 2LR test is an inferential test and thus a significance level needs to be selected. We report the results for α = .05 (2LR-None) and also correcting for multiple comparisons using the Holm correction procedure (2LR-Holm). The following procedure was used to determine the most appropriate CDM for each item. All reduced models (i.e., tests) whose p-values were significant were rejected. All reduced models with a nonsignificant p-value defined the set of candidate reduced models Aj. The set Aj can include all combinations by taking 0 to 3 elements from the list of tested reduced models (i.e., DINA, DINO, and A-CDM). The G-DINA model was retained if all reduced models were rejected at this step (i.e., Aj = {}). Whenever the set Aj included more than one element, the model with the largest p-value was selected as the best model for that item. We expected a better performance of the procedure based on the adjusted p-values (i.e., 2LR-Holm) considering the fact that a large number of tests were being considered. For example, in the 165 items and simple Q-matrix condition, there were 120 items measuring more than one attribute. Given that we considered three possible reduced models, 360 tests were conducted. Multiple comparison corrections might be conservative. This can be translated into an increase in the number of “false” reduced model candidates in the set Aj. Choosing the model with the largest p-value provided a higher classification accuracy compared to using the G-DINA model alone in a previous study (Ma et al., 2016).
Ten item banks were constructed for each simulated condition. The following text describes these item banks in terms of item discrimination, number of attributes, and data generating model. Item parameters were generated randomly from the following distributions: P(
For each condition and item bank, we generated a validation sample consisting of 5,000 response patterns generated uniformly from the space of possible 25 = 32 latent classes. A CD-CAT based on each of the model calibrations was applied to each of these validation samples. The first item was randomly chosen from the medium discriminating items in the item bank. The item selection rule was the G-DINA discrimination index (GDI; Kaplan et al., 2015). Different studies have discussed the relationships among several of the item selection rules available and have highlighted the strong relationship among them (Wang et al., 2020; Yigit et al., 2019). GDI was chosen on the basis of computational time. Results can be expected to be generalizable to other item selection rules. Conditional results on different CD-CAT length conditions were explored: starting from five up to 30 items. However, most of the results were described assuming that the CD-CAT length was fixed to 30 items (i.e., fixed-length stopping rule), a reasonable test length that provides sufficient classification accuracy considering prior research (Kaplan et al., 2015). The scoring method was the maximum likelihood estimation method.
To assess the quality of the item bank calibration, we compared the item parameters estimates with the true item parameters. The root mean squared error (RMSE) was computed for each method, and averaged across the item banks. The formula for RMSE is

where
Results
Calibration Sample Results: Model Selection
Table 1 includes the results for the average 2LR performance across all the test bank replications. 1 The overall performance was generally acceptable regardless of the condition. The large number of comparisons caused that the Type I error rate increased. Accordingly, the correct reduced CDM was selected more frequently when the Holm correction was used (grand mean of 86 vs 93). Even in the small calibration sample size conditions, the true reduced model was selected at least in 79% of the items when the p-value was adjusted for multiple comparisons. To facilitate the interpretation of the effects of calibration sample size, item bank length, and Q-matrix complexity a graphical representation is included in Figure 1. The calibration sample size factor had the largest effect. Small sample size conditions affected the power of the statistic, thus increasing the number of times that an incorrect reduced CDM was retained. As the calibration sample size increased, the selection rates improved. In the N = 2,000 conditions, the true reduced model was always selected under 2LR-Holm. The other two factors affected more the percentage of times the G-DINA model was retained, but these effects depended on the application of the correction for multiple comparisons. When the correction was made (i.e., 2LR-Holm), the G-DINA model was hardly ever retained, and these factors had only a small effect on the performance of the statistic. In contrast, for the 2LR-None, the most unfavorable conditions (i.e., a small item bank length and a complex Q-matrix structure) resulted in a higher proportion of G-DINA selections to the detriment of correct CDM selections. The good performance of the 2LR test allowed dramatically reducing the number of parameters to be estimated. For example, in the J = 330 and simple Q-matrix condition, the GDINA model estimated 1,620 parameters, whereas the combination of models selected by the 2LR test estimated an average of 770.6 to 779.7 parameters for the different levels of calibration sample size. Table 2 includes the RMSE results that represent the impact on the accuracy of the item parameter estimates (Equation 5). RMSE values were always lower for the combination of models selected by the 2LR test results compared to the G-DINA model. As shown in Table 1, including the Holm correction improved the performance of the 2LR test. Accordingly, RMSE values were smaller when models were selected including the Holm correction. Differences among the models became smaller as the sample size and the item bank length increased. In addition, the complex Q-matrix condition is a more challenging situation because it includes more parameters. This resulted in larger RMSE values. Item parameter recovery was expected to affect the performance of the adaptive algorithms based on those estimates as we explore in the next section.
Model Selection Rates for the 2LR Test (×100).
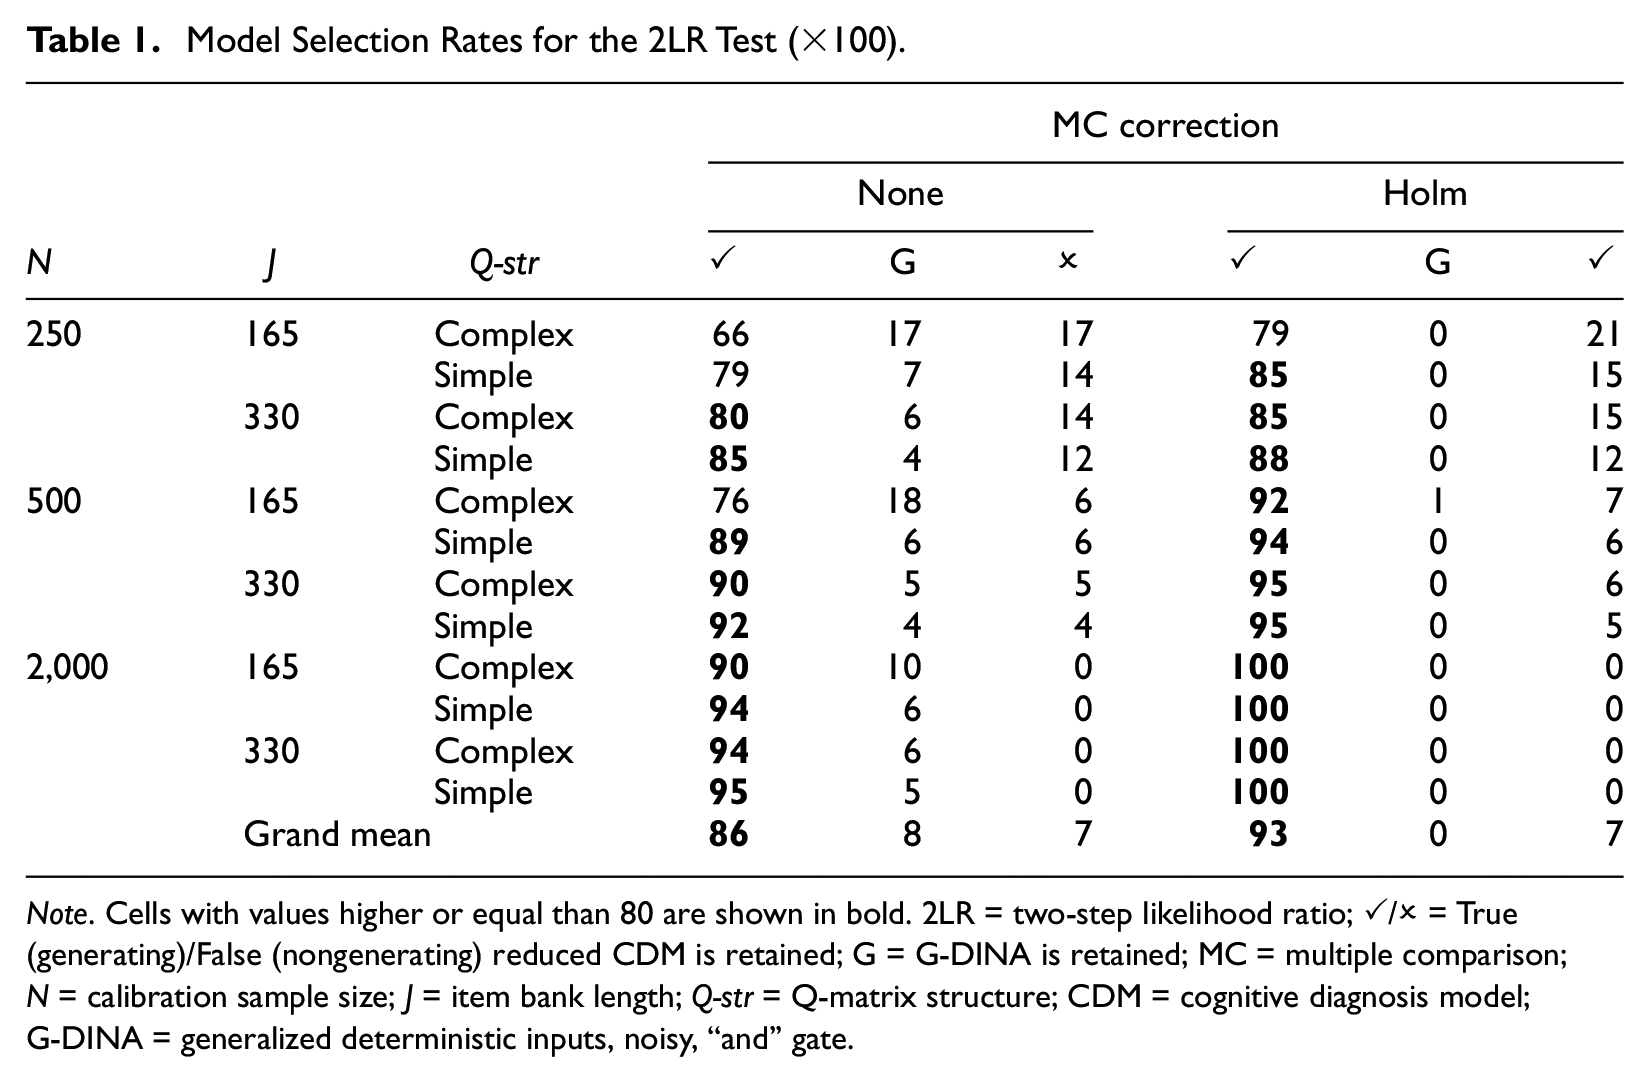
Note. Cells with values higher or equal than 80 are shown in bold. 2LR = two-step likelihood ratio; ✓/✗ = True (generating)/False (nongenerating) reduced CDM is retained; G = G-DINA is retained; MC = multiple comparison; N = calibration sample size; J = item bank length; Q-str = Q-matrix structure; CDM = cognitive diagnosis model; G-DINA = generalized deterministic inputs, noisy, “and” gate.
Average Root Mean Squared Error Results.
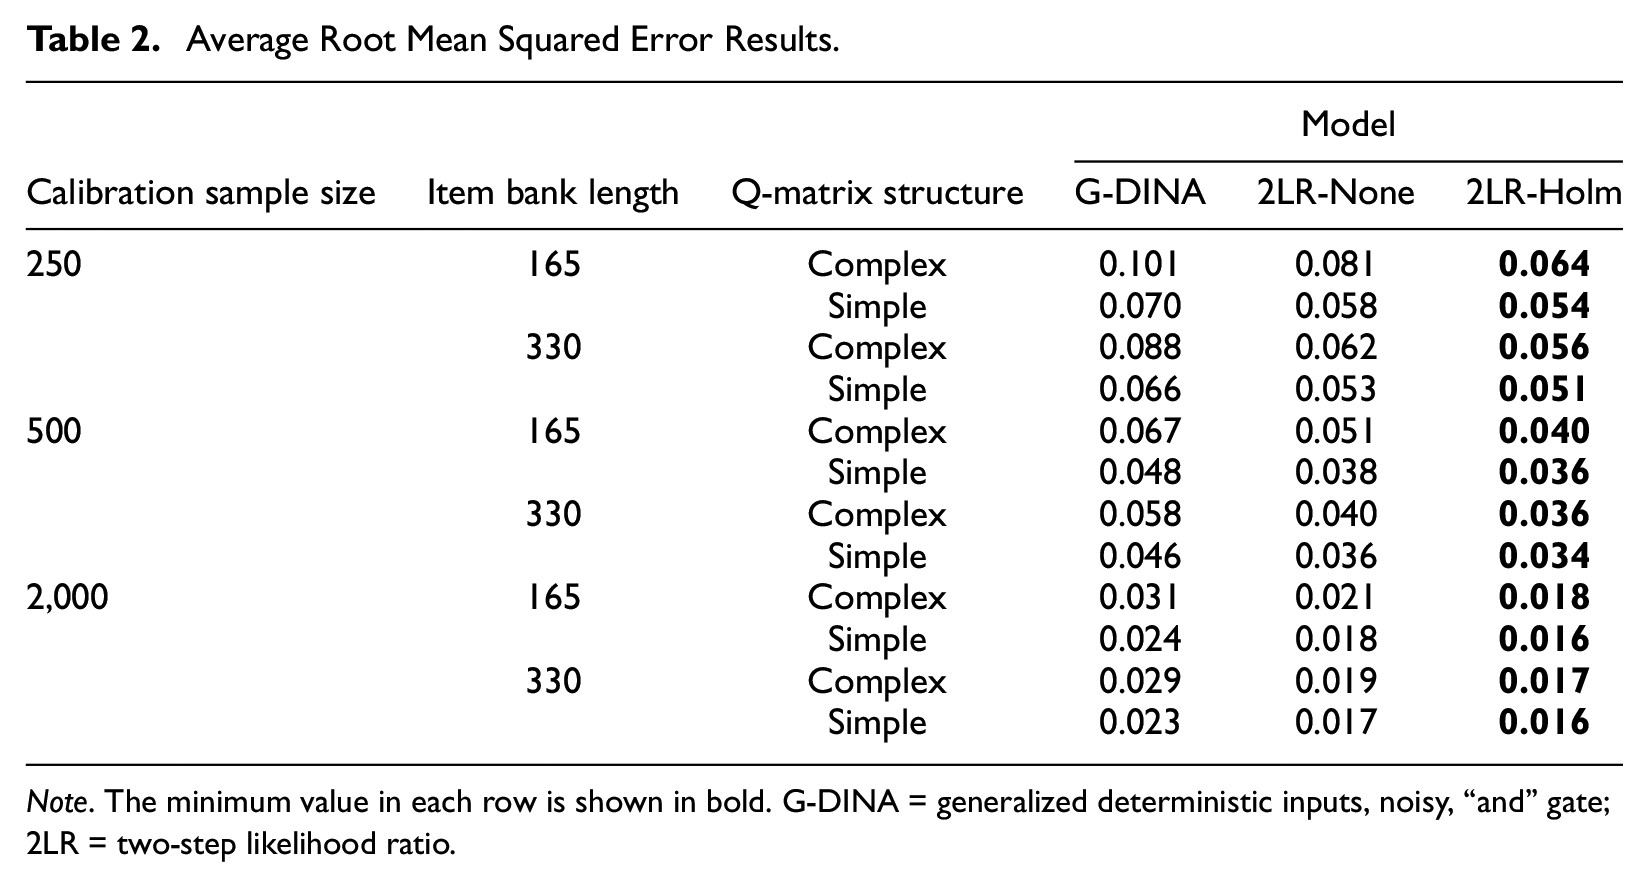
Note. The minimum value in each row is shown in bold. G-DINA = generalized deterministic inputs, noisy, “and” gate; 2LR = two-step likelihood ratio.
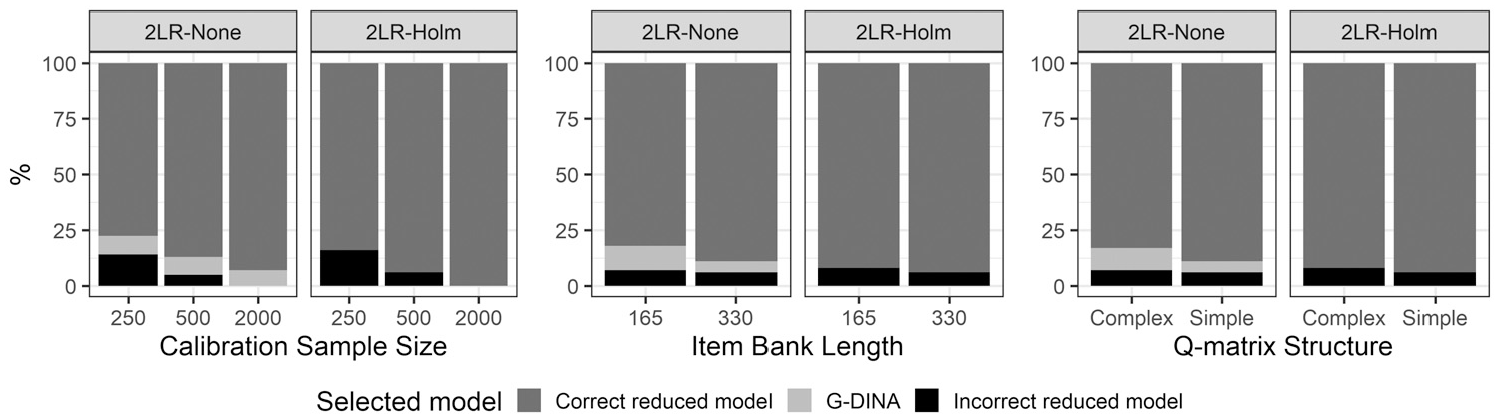
Representation of the 2LR test results by factor.
Validation Sample Results: Pattern Recovery
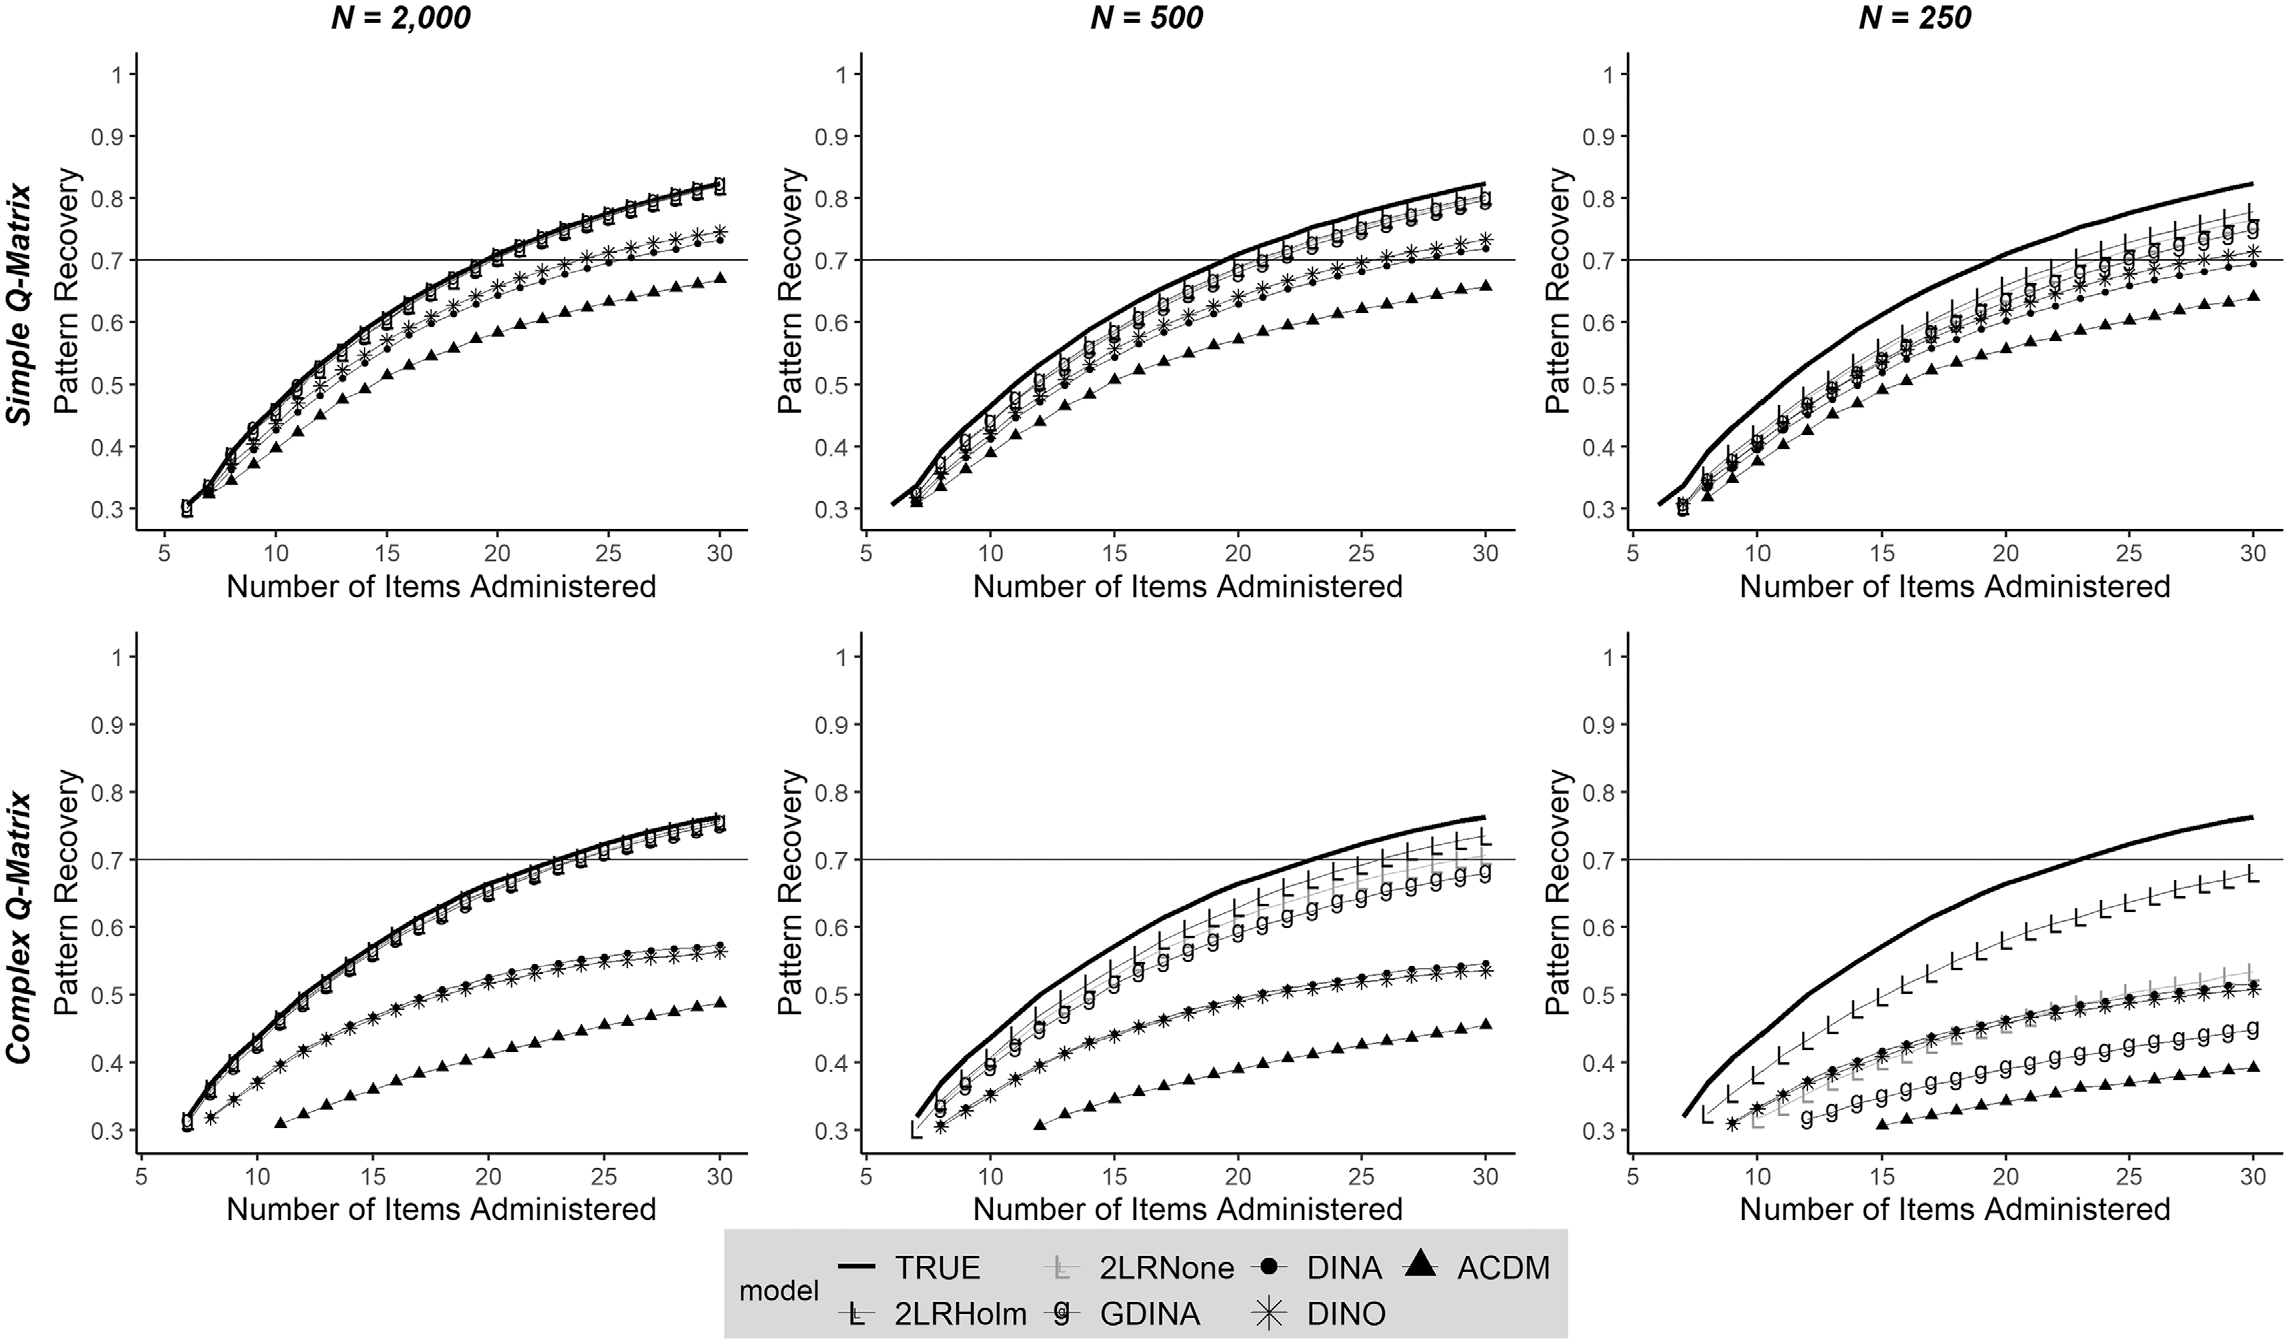
Pattern recovery results are shown in Figures 2 and 3 for the 165 and 330 item bank length conditions, respectively. For comparison purposes, the upper limit of the pattern recovery is represented in black. In the following, we describe the most notable findings.
Pattern recovery according to fitted model and number of items administered.
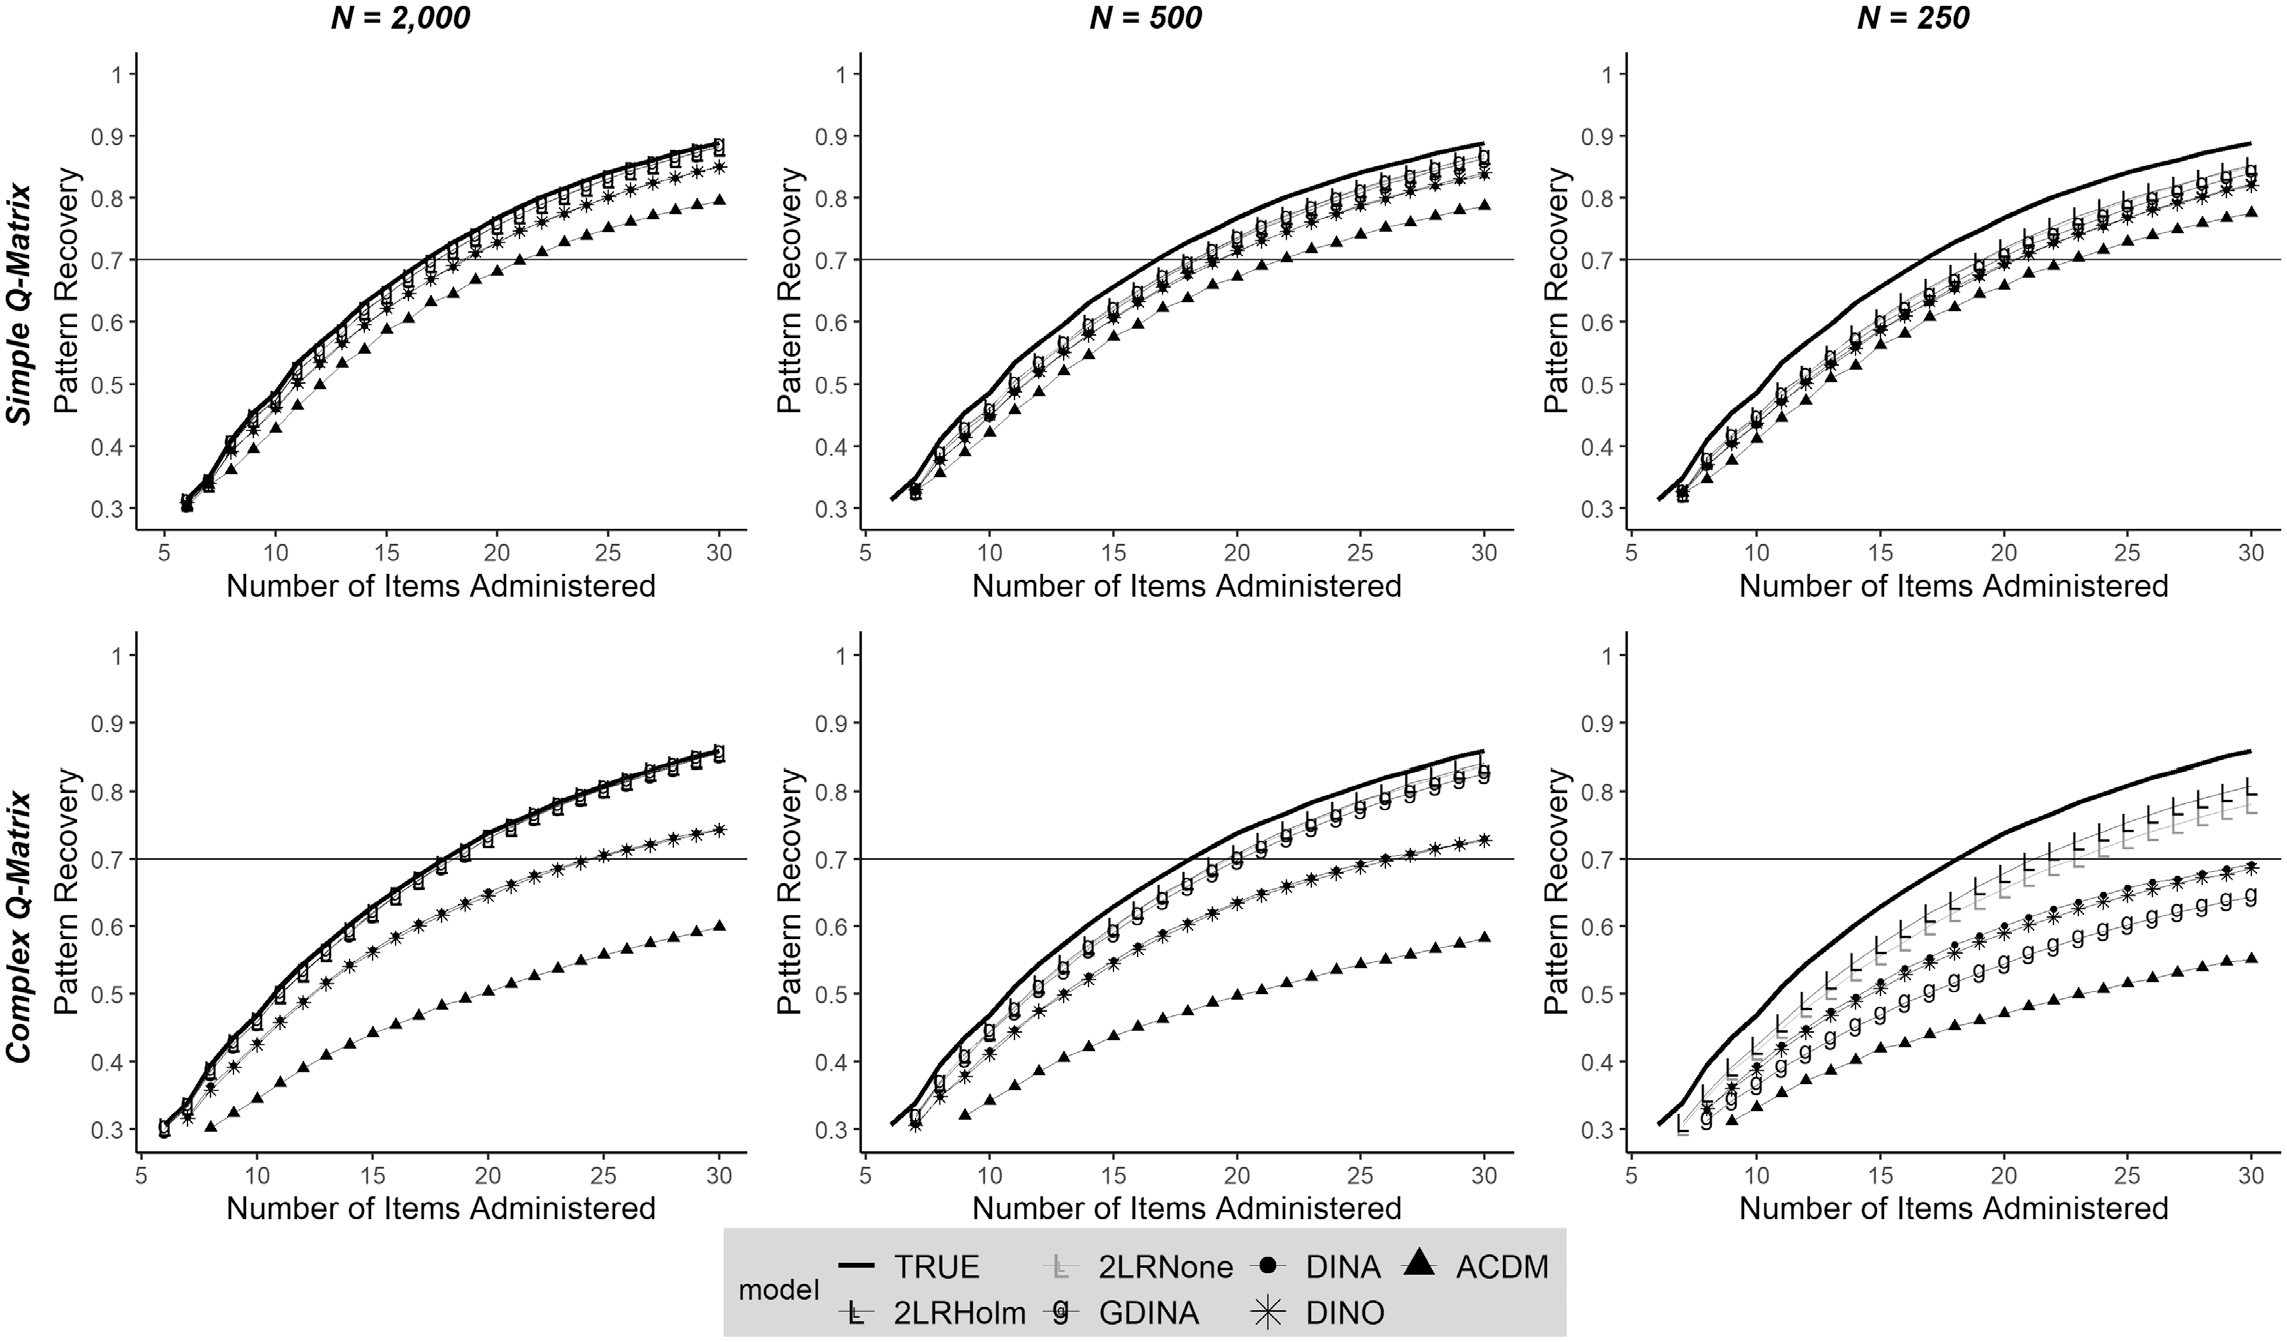
Pattern recovery according to fitted model and number of items administered.
General versus reduced CDMs
The true underlying model for the item bank was a combination of DINA, DINO, and A-CDM items. Thus, as expected, estimating the same reduced model (i.e., DINA, DINO, or A-CDM) for all the items in the item banks resulted in a poorer performance of the CD-CAT compared to that of the CD-CAT based on the G-DINA model that subsumes all of them. Among the reduced models, CD-CATs based on the DINA and DINO models performed similarly, and CD-CATs based on the A-CDM performed considerably worse in all conditions. As indicated in the previous section, the 2LR test generally flagged the most appropriate model for each item. Consequently, CD-CAT based on that combination of models usually had a very good overall performance. Indeed, the performance of this combination of models was always equal or better compared to that of the G-DINA model. For a 30-item CD-CAT, the average improvement in pattern recovery that was obtained by the 2LR test along with the Holm correction was 0.044, and ranged from 0.001 to 0.234.
Multiple comparison correction
Including the Holm correction always led to a better performance of the CD-CAT. This was related to the results described in the model selection section. Differences were more notable when the calibration sample and the item bank length were small, and the Q-matrix was complex.
Calibration sample size
The sampling estimating error was smaller when the sample size was large (i.e., N = 2,000), and then the results for pattern recovery for the more general model (i.e., G-DINA) were close to the upper limit. The same can be said for the combination of models selected by the 2LR test results, given that this statistic performed very well under this condition. In contrast, the G-DINA model was not accurately estimated under small sample conditions (i.e., N = 500, 250), and that’s why the CD-CAT based on the G-DINA model parameters performed poorly when the calibration sample size became smaller. The 2LR test results performed generally close to the upper limit, given that reduced CDMs were easier to estimate under small calibration sample size conditions.
Q-matrix complexity
It was always harder to recover the attribute vector when the Q-matrix was complex. This decrement in accuracy was more pronounced for the G-DINA model as the number of item parameters to be estimated was higher. For example, in the complex Q-matrix for an item measuring four attributes 24 = 16 parameters were estimated under the G-DINA model. If the DINA model fitted that particular item according to the 2LR test, only two parameters were estimated. In this line, even when the calibration sample size was 250, the CD-CAT based on the 2LR test selection was still relatively close to the upper limit. In the J = 330 condition, for a 30-item CD-CAT, the average pattern recovery was 0.86, 0.81, and 0.64 for CD-CATs based on the true item parameters, 2LR test along with the Holm correction selection and G-DINA estimates, respectively.
Item bank length
Increasing the item bank length always led to a better performance of the CD-CAT. Item parameters were generated using a uniform distribution, then augmenting the bank length increases the number of high-quality items, for which 2LR test model selection rates are higher. Results based on the 2LR-Holm test selection of models always achieved values greater than 0.70, even in the more problematic condition.
Validation Sample Results: Item Usage
Average item usage results across the 10 item banks are shown in Table 3. Only the large item bank length condition (J = 330) is considered to prevent the different item types in the item bank from being exhausted by the selection algorithm. In addition, due to space limits, only the most and least ideal data conditions are presented (i.e., simple vs complex Q-matrix, large vs small calibration sample size). The most notable results are listed in the following text: (a) simpler items were typically preferred when using GDI. It should be noted that in the complex Q-matrix condition there were only 30 one-attribute items. Probably, highly discriminating one-attribute items were exhausted. The use of one-attribute items could have been greater if a wider range of one-attribute items were available; (b) the patterns of item usage for both α = 0.05 and Holm implementations of the 2LR test were quite similar, and were the ones closest to the pattern corresponding to the true estimates. These patterns were also similar to those of the CAT based on the G-DINA model, except for a smaller use of four-attribute items in the complex Q-matrix condition; (c) when the data were calibrated using a single reduced CDM, one-attribute items were generally preferred. It should be noted that all the CDMs are equivalent when the number of attributes being measured by the item is one. In addition, items following a different model were seldom used, and items following that specific reduced models were mostly used. The former was more pronounced when the Q-matrix was simple, whereas the latter was more pronounced when the Q-matrix was complex; (d) items following the A-CDM model were seldom administered. This was most noticeable in the simple Q-matrix conditions, where, even when the item bank was calibrated using the A-CDM model, A-CDM items were rarely administered. In this situation, the algorithm generally administered one-attribute items.
Average Item Usage Results for the 330-Item Banks in the Most and Least Ideal Conditions.
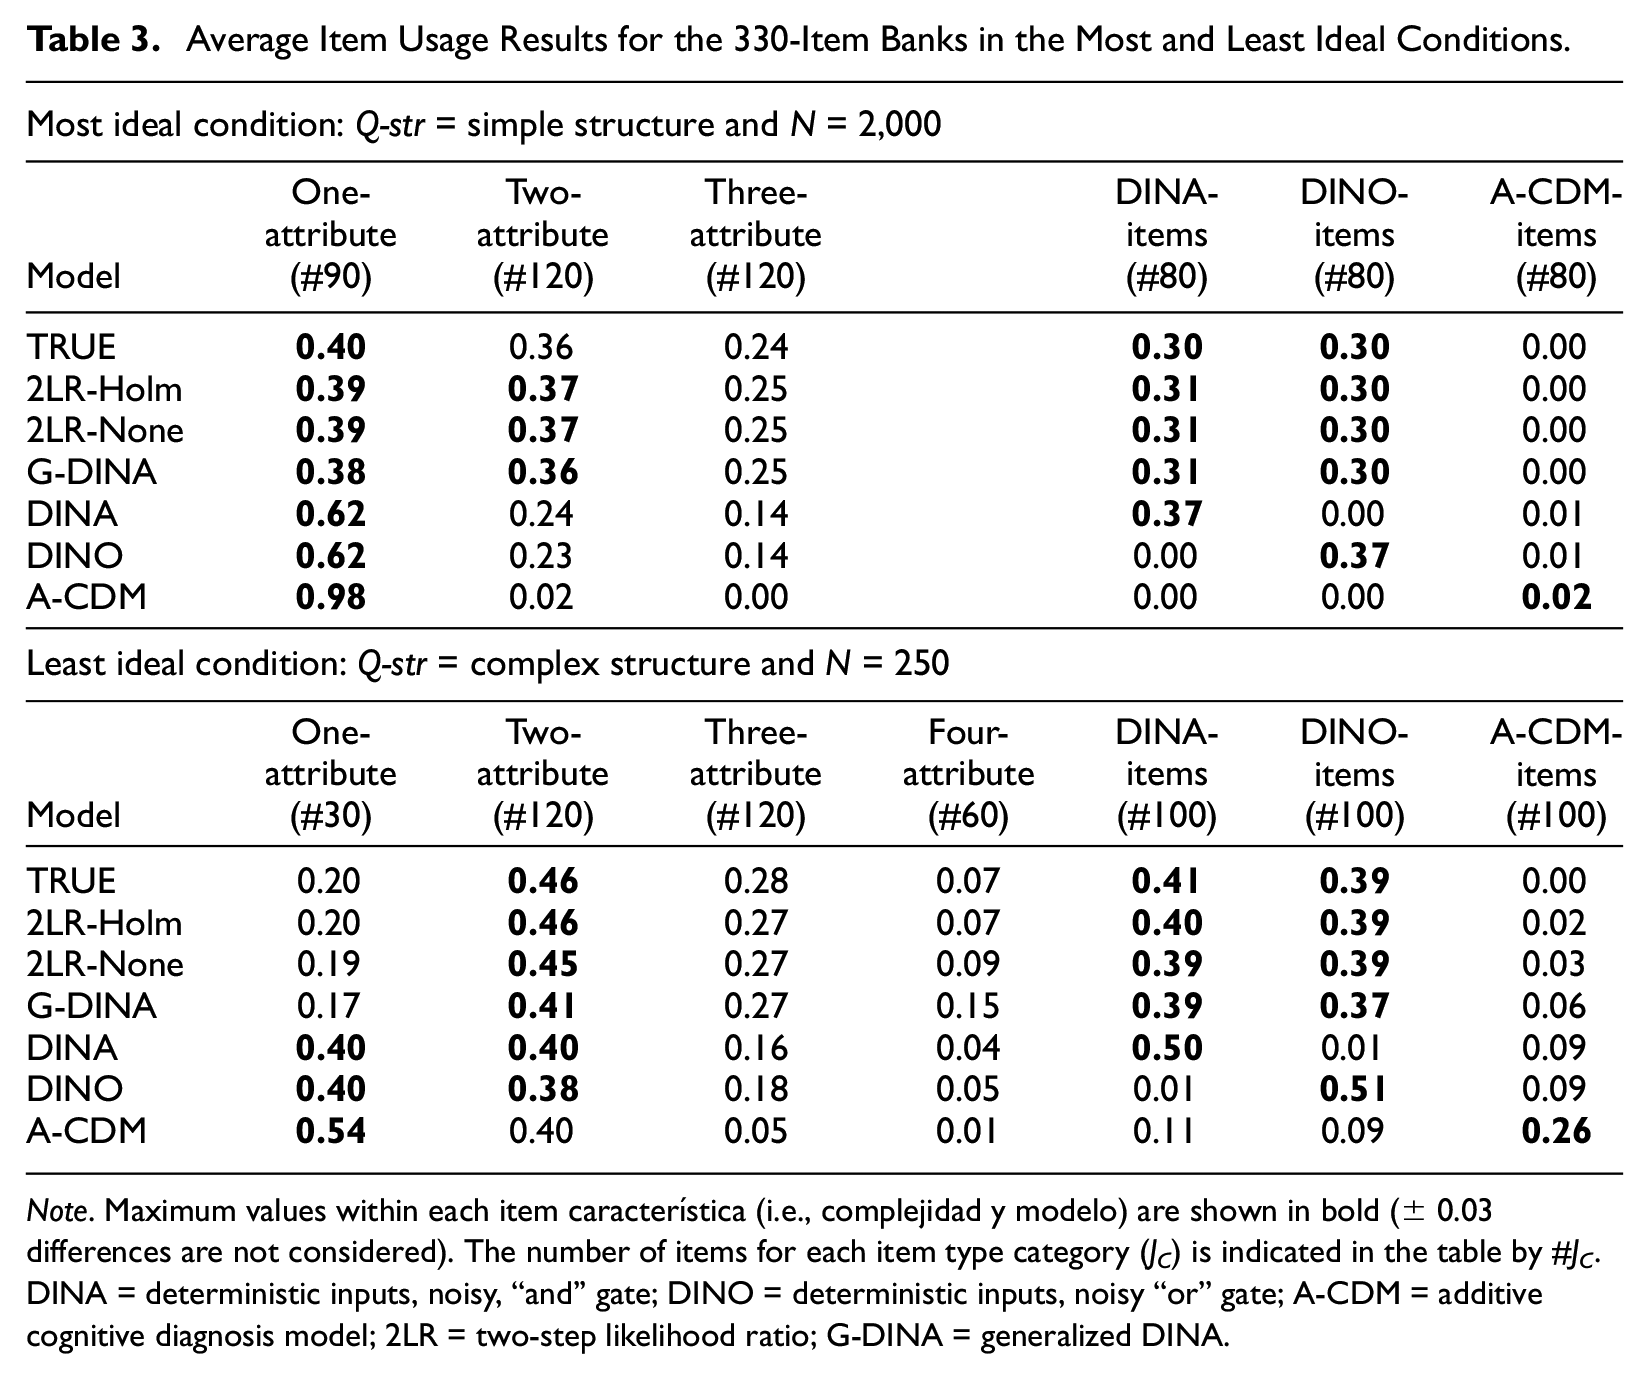
Note. Maximum values within each item característica (i.e., complejidad y modelo) are shown in bold (± 0.03 differences are not considered). The number of items for each item type category (JC) is indicated in the table by #JC. DINA = deterministic inputs, noisy, “and” gate; DINO = deterministic inputs, noisy “or” gate; A-CDM = additive cognitive diagnosis model; 2LR = two-step likelihood ratio; G-DINA = generalized DINA.
All above has to do with the fact that item parameters were not properly estimated when the calibrated reduced model differed from the true generating model. This is illustrated in Table 4 where the estimated parameters for two items in the N = 2,000 and simple Q-matrix condition are presented. Item 2 was a one-attribute item, and thus all the CDMs provided essentially the same item parameters. This might explain why one-attribute items were usually used under any condition. Item 50 was a two-attribute item following the DINA model. As can be seen from the table, the estimated GDI for DINO and A-CDM was quite low, whereas the G-DINA model, the model derived from the 2LR test, and the G-DINA model provided similar results close to the GDI that was specified in the data generation.
True and Estimated Item Parameters for Two Different Item Types.
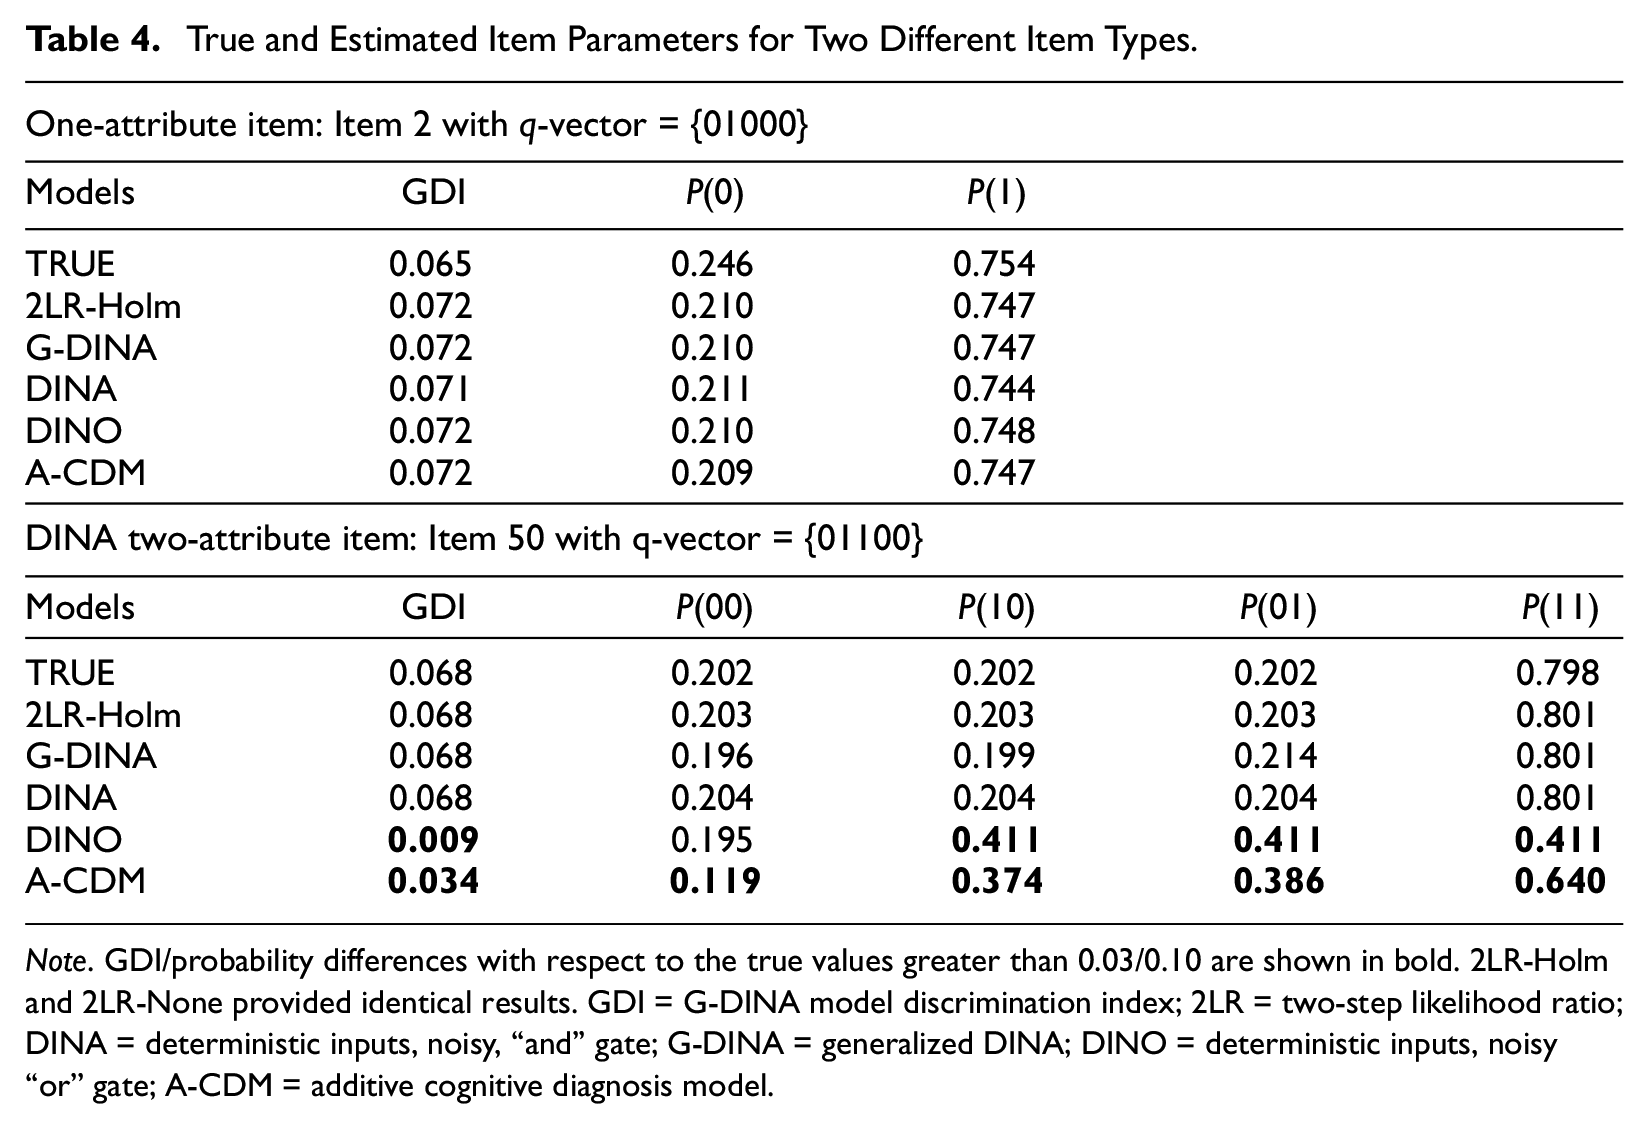
Note. GDI/probability differences with respect to the true values greater than 0.03/0.10 are shown in bold. 2LR-Holm and 2LR-None provided identical results. GDI = G-DINA model discrimination index; 2LR = two-step likelihood ratio; DINA = deterministic inputs, noisy, “and” gate; G-DINA = generalized DINA; DINO = deterministic inputs, noisy “or” gate; A-CDM = additive cognitive diagnosis model.
Discussion
In current empirical studies, a single reduced CDM is applied to all items in the item bank (e.g., H. Y. Liu et al., 2013). Generally, this might not be a suitable approach, given that reduced models make strong assumptions about the data, so they might not be appropriate for all items. Accounting for the heterogeneity of CDMs even within the same test found in some empirical studies (de la Torre et al., 2018; Ravand, 2016), the use of general CDMs emerged as a good alternative (Sorrel, Yigit, & Kaplan, 2017). A recent literature review of CDM fixed-form applications found that only 31% of the studies used general CDMs (Sessoms & Henson, 2018), so this alternative is not the most common. It has a limitation that the estimation of general CDMs is much more challenging, typically requiring a larger sample size to be estimated accurately. Considering this, the present study explored whether the classification accuracy can be improved using comparison indices to select the most appropriate model for each item. The results indicated that implementing item-level model comparison indices such as 2LR test (Sorrel, de la Torre, et al., 2017) improved the accuracy of the CD-CAT under all the simulated conditions. Accordingly, the same accuracy can be obtained with fewer items administered. Time saving has been traditionally considered one of the advantages of CATs. This study shows that a key element to maximize this advantage is model selection. This time saving might be of major importance, for example, in classroom settings because it would allow teachers designing classroom specific activities to optimize student learning. A test of this type can be applied in a weekly basis to develop a learning profile for the students in the class and adapt instruction accordingly (Wu, 2018). The lack of appropriate software programs for conducting adaptive applications based on CDM might have hampered the development of more empirical applications. To facilitate these applications and encourage new ones, the code was turned into an R package named
Regarding the manipulated factors, we found that the accuracy improvement by the use of the 2LR test can be expected to be larger when the Q-matrix structure is complex (i.e., large proportion of items measuring more than one attribute) and the calibration sample size is small. Otherwise, if the same reduced CDM (e.g., DINA) is applied to all items in a situation in which items follow several different CDMs, the resulting accuracy will be generally much lower. This might be ameliorated in a certain way if the sample size is large and the Q-matrix has a simple structure, as in H. Y. Liu et al. (2013)’s study, but still a CD-CAT based on a general model or a combination of appropriate models would provide better accuracy results. Furthermore, even if a similar accuracy is obtained with the application of a single reduced model, there will be a poor use of the item bank. Specifically, items following a different reduced CDM will not be selected by the adaptive procedure. This is due to a severe underestimation of the model discrimination when an incorrect reduced CDM is specified for an item. Results of this study indicate that this inefficient use of the item bank can be tackled through the use of model selection indices. On the other hand, procedures based on a general model (e.g., G-DINA) will lead to optimal results provided the general model is accurately estimated. This will generally be the case when the sample size is large and the number of parameters to be estimated is small (e.g., Sorrel, Yigit, & Kaplan, 2017). Otherwise the classification accuracy can be compromised. In any case, the main finding of this study is that we can improve classification accuracy and make a better use of the item bank using item-level model fit indices to select the most appropriate CDMs for each item. Importantly, it will not have any negative impact. This study considers DINA, DINO, and A-CDM models, but other different constrained versions of the G-DINA model can be easily included in the set of compared models. Given the large number of comparisons, we encourage researches and practitioners to use a procedure to control the Type I error rate such as the Holm correction. It is worth noting that these methodologies are indeed very easy to implement. It only takes a few seconds to conduct the model selection analysis.
Findings from this study can serve future research in several ways. First, both calibration sample size and Q-matrix complexity are factors that greatly influence the adaptive algorithm. Results regarding the calibration sample size are consistent with those in the recent study by Huang (2018). Simulation studies in this context should consider these two factors in order to ensure findings that are broadly generalizable. Second, we found that simpler items were typically preferred by GDI. One of the possible reasons is that all models are equivalent when the item measures only one attribute, whereas the models are more and more different as the item complexity increases. If the appropriate reduced model is not correctly specified, the item discrimination would be severely underestimated. On another note, items following A-CDM were not generally administered. These results are in line with previous research using GDI (Kaplan et al., 2015; Yigit et al., 2019). Third, most of the item selection methods rely on parametric models. There is a recent nonparametric item selection (NPS; Chang et al., 2019) method that has demonstrated promising results. It uses the nonparametric classification (NPC; Chiu & Douglas, 2013) method to estimate the attribute profiles. Nonparametric models have been shown to outperform the parametric ones when the sample size is especially low (i.e., 30–100). The main drawback of the NPC is that it needs to specify a condensation rule that determines the ideal response pattern for each item and latent class. According to our results, it is expected that assuming an incorrect condensed rule will result in a loss in classification accuracy. Finally, it was not uncommon to see that multiple reduced CDMs obtained a fit similar to that of the general model. Like other previous studies (e.g., Ma et al., 2016), we retained the reduced CDM with the highest p-value. Despite the good results achieved, future studies might address whether descriptive measures of fit such as AIC or BIC can improve the model selection rates.
A few limitations of this study are worth mentioning. First, the Q-matrices involved in this study were assumed to be known. This represents a plausible scenario in the context of CD-CAT were a lot of resources are invested and the Q-matrix construction is probably guided by a strong theory. This is the case, for example, of H. Y. Liu et al. (2013) and Sorrel, Yigit, & Kaplan (2017) studies. Over the recent years, a number of methods for Q-matrix empirical validation have been proposed. These include the GDI method (de la Torre & Chiu, 2016; Nájera et al., 2019). This method requires an initial Q-matrix that will contain, presumably, some misspecifications. The method is aimed to detect and correct those misspecifications. Second, to keep the scope of this study manageable, a few simplifications about factors affecting the CD-CAT performance were made. These included fixing the number of attributes, using a single method in estimating the attribute vectors, and focusing on the unconstrained CD-CAT where neither exposure control nor content balancing was considered. The reason for that is that usually CDM applications are relatively low-stakes and, accordingly, test security is not a big concern. But if the test is high-stakes (e.g., personnel selection), exposure control becomes necessary. This can be done, for example, using the Sympson–Hetter algorithm or dynamic binary searching procedures (Zheng & Wang, 2017). These two methods are viable solutions to reduce item exposure without seriously affecting accuracy. In the data generation process, there was no reason to consider any particular attribute joint distribution. Therefore, latent classes were sampled from a uniform distribution. This favors the item bank calibrations. Different studies might explore the effect of the attribute joint distribution assuming a particular prior. Responses to all items were available for the item bank calibration. Matrix sampling designs are more common in practical settings to minimize testing time and fatigue. In those situations, when the data set is incomplete, the item parameter and pattern recovery will be worse. Nonetheless, it could be hypothesized that the calibration based on the general model would be more negatively affected because less information is available. The results of a preliminary simulation study conducted in response to the comments of one of the reviewers showed that the benefit of using the 2LR rather than the G-DINA model was even higher under incomplete designs. Matrix sampling designs are unexplored in the context of CDM. Future research is required to address this issue. Finally, this study focuses on what has come to be called low item quality in previous simulations studies (e.g., Ma et al., 2016; Sorrel, Abad, et al., 2017) because a higher accuracy improvement was expected. This is nonetheless a realistic scenario considering the range of item discrimination values reported in empirical applications outside educational measurement (de la Torre et al., 2018; H. Y. Liu et al, 2013; Sorrel et al., 2016; Templin & Henson, 2006).
Footnotes
Declaration of Conflicting Interests
The author(s) declared no potential conflicts of interest with respect to the research, authorship, and/or publication of this article.
Funding
The author(s) disclosed receipt of the following financial support for the research, authorship, and/or publication of this article: This research was supported by grants PSI2013-44300-P and PSI2017-85022-P (Ministerio de Economia y Competitividad and European Social Fund) and the UAM-IIC Chair «Psychometric Models and Applications>>.