



Abstract
As one of the important research areas of cognitive diagnosis assessment, cognitive diagnostic computerized adaptive testing (CD-CAT) has received much attention in recent years. Measurement accuracy is the major theme in CD-CAT, and both the item selection method and the attribute coverage have a crucial effect on measurement accuracy. A new attribute coverage index, the ratio of test length to the number of attributes (RTA), is introduced in the current study. RTA is appropriate when the item pool comprises many items that measure multiple attributes where it can both produce acceptable measurement accuracy and balance the attribute coverage. With simulations, the new index is compared to the original item selection method (ORI) and the attribute balance index (ABI), which have been proposed in previous studies. The results show that (1) the RTA method produces comparable measurement accuracy to the ORI method under most item selection methods; (2) the RTA method produces higher measurement accuracy than the ABI method for most item selection methods, with the exception of the mutual information item selection method; (3) the RTA method prefers items that measure multiple attributes, compared to the ORI and ABI methods, while the ABI prefers items that measure a single attribute; and (4) the RTA method performs better than the ORI method with respect to attribute coverage, while it performs worse than the ABI with long tests.
Keywords
Introduction
Cognitive diagnosis assessment (CDA) has recently received much attention in educational and psychological assessment (Rupp & Templin, 2008). Compared to classical test theory and item response theory (IRT), which only provide an overall score to indicate the information about the position of one individual relative to others on one specific latent trait (de la Torre & Chiu, 2016), CDA can provide detailed information about the strengths and weaknesses of individuals for specific content domains. Consequently, efficient remediation can be conducted based on the fine-grained information available about individuals (Gierl et al., 2007; Lim & Drasgow, 2017; Sawaki et al., 2009).
One important research area in CDA is cognitive diagnostic computerized adaptive testing (CD-CAT; Cheng, 2009; McGlohen & Chang, 2008; Xu et al., 2003). CD-CAT combines a cognitive diagnostic model (CDM) and computer technology to improve testing efficiency and measurement accuracy. Like IRT-based CAT, CD-CAT has compelling advantages over traditional paper-and-pencil (P&P) tests. For example, the performance of individuals can be estimated immediately after they provide a response to each item (Cheng & Chang, 2009). CD-CAT can also provide equivalent or higher accuracy in the measurement of an individual’s latent skills, with reductions in test length.
The primary goal of CD-CAT is to improve the measurement accuracy of individuals (Zheng & Chang, 2016) and the item selection method is one of the most important keys to this. Numerous item selection methods have been proposed, such as the Kullback–Leibler method (KL; Xu et al., 2003), the Shannon Entropy method (Tatsuoka, 2002), the posterior-weighted KL method (PWKL; Cheng, 2009), the mutual information method (MI; Wang, 2013), and the modified PWKL method (MPWKL; Kaplan et al., 2015). Recently, Zheng and Chang (2016) developed two new item selection methods designed for short-length tests: the posterior-weighted cognitive diagnostic index (PWCDI) and the attribute-level discrimination index (PWADI), based on previous work by Henson and Douglas (2005) and Henson et al. (2008).
In addition to the item selection method, the coverage for each attribute can also impact the measurement accuracy. Cheng (2010) indicated that attribute coverage influences both measurement accuracy and reliability, and it is important to make sure that each attribute is measured adequately to ensure the validity of the inferences based on the test. Therefore, she used the modified maximum global discrimination index (MMGDI) method, first used in IRT-based CAT by Cheng and Chang (2009), to balance the attribute coverage and improve measurement accuracy. The simulation study showed that, compared with the original KL method, the MMGDI method produced a relatively higher attribute correct classification rate (ACCR) and pattern correct classification rate (PCCR).
When the minimum number of items that measure each attribute is not satisfied, the attribute balance index (ABI) used in Cheng (2010) tends to select items with a single attribute (Mao & Xin, 2013), which means that the ABI is suitable when the item pool is composed of many items that measure a single attribute. Measurement accuracy would however be lower if the item pool is comprised of many items that measure multiple attributes. Although a test with single-attribute items can produce high PCCR in the CDA framework (e.g., Madison & Bradshaw, 2015; Wang, 2013), it is difficult to construct such items because more than one attribute is required to successfully solve items in real testing situations (DeCarlo, 2011; Huang, 2018). An extreme case is when there are hierarchical relationships among attributes (Leighton et al., 2004), where the ABI tends to produce low measurement accuracy. In addition, the ABI has only been used with the KL method and its performance with other item selection methods is unknown. Therefore, the current study proposes a new method—the modified ratio of test length to the number of attributes (RTA), influenced by the study conducted by Kuo et al. (2016)—to balance attribute coverage and improve measurement accuracy when the item pool comprises many multiple-attribute items. Furthermore, the study examines whether the RTA and ABI can be extended to more types of item selection methods.
The remainder of the paper is organized as follows: First, we will introduce the two CDMs used in the study and summarize the item selection methods used. After that, the ABI and RTA will be presented. Then, a simulation study is conducted to examine the RTA with respect to the correct classification rate conditional on several manipulated factors. Finally, the discussion and conclusions are presented.
Cognitive Diagnostic Models and Item Selection Methods
Numerous CDMs have been proposed to deal with different test situations and with CD-CAT, the ‘‘Deterministic Input, Noisy ‘And’ Gate’’ (DINA) model (Junker & Sijtsma, 2001) and the Reduced Reparameterized Unified Model (RRUM; Hartz, 2002) are commonly used (e.g., Chen et al., 2012; Cheng, 2010; Huebner et al., 2018; Xu et al., 2016). Let


Attribute Coverage Indices


The term
The RTA criterion balances the attribute coverage and prefers multiple-attribute items. On the contrary, the ABI criterion balances the attribute coverage and prefers single-attribute items. Note that the RTA is determined by both H and
Simulation Study
The goals of the simulation study are to examine the performance of the new attribute coverage index and examine whether the RTA and ABI can be extended to other item selection methods. Several factors are manipulated: model type, number of attributes, Q-matrix structure, test length, attribute coverage index, and item selection method. In total there are 2 (model type) × 2 (number of attributes) × 2 (Q-matrix structure) × 3 (test length) × 3 (attribute coverage index) × 4 (item selection method) = 288 conditions in the study. The details of the simulation study are given in the following.
Model Type
Both the DINA model and the RRUM will be used in the current study since these two CDMs are commonly used in CD-CAT (e.g., Cheng, 2010; Huebner et al., 2018; Mao & Xin, 2013; Xu et al., 2016).
Number of Attributes
Wang (2013) and Zheng and Chang (2016) used five attributes in their studies, while Cheng (2010) used six attributes in her study. In the current study, both five and six attributes are considered to examine the performance of RTA and ABI.
Q-matrix Structure
Two types of Q-matrix are generated in this study, namely simple structure and complex structure (Chen et al., 2012; Huang, 2018; Wang, 2013). For the simple structure Q-matrix, all items are unidimensional, meaning that each item measures a single attribute. This Q-matrix is generated based on a discrete uniform distribution with equal probability for all possible patterns. Meanwhile, for the complex structure Q-matrix between one and three attributes are measured by each item. The generation of the complex structure Q-matrix is based on Chen et al. (2012) and can be summarized as follows. First, three basic matrix units are generated. The first matrix unit is a K-by-K identity matrix, while the second and third matrix units are comprised of all possible q-vectors that measure two and three attributes, respectively. Second, the first matrix unit is replicated twenty times while the second and third matrix units are replicated ten times. This results in 100 items that each measure one, two, and three attributes, respectively. Third, the items are merged to create a 300-by-K matrix, and the rows of the 300-by-K matrix are randomly re-ordered.
Test Length
Three different test lengths (10, 20, and 30 items) will be used in this study. We view these as short-length, moderate-length, and long-length tests, similar to previous research (e.g., Kuo et al., 2016).
Attribute Coverage Index
Three types of ACI will be used in the study. The first type is the original item selection method without attribute coverage control (abbreviated to ORI), which can be treated as the baseline. The second type is the ABI proposed by Cheng (2010), and the last type is the RTA which is proposed in the current study.
Item Selection Method
The item selection methods used in this study are the MI, MPWKL, PWADI, and PWCDI methods. All these methods can produce high correct classification rates even for short-length tests.
Since the generation of the
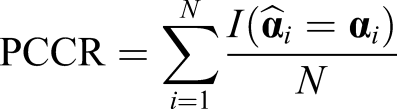
The evaluation criteria used in this study are averaged ACCR (A-ACCR), PCCR, and the usage of k-attribute items (Kuo et al., 2016). These statistics are calculated by


Results
Correct Classification Rate
Correct Classification Rate for the DINA Model (K = 5).

Note. MI refers to mutual information method; MPWKL refers to modified posterior-weighted Kullback–Leibler method; PWADI refers to posterior-weighted attribute-level discrimination index; and PWCDI refers to posterior-weighted cognitive diagnostic index; ORI refers to original item selection method without attribute coverage control; ABI refers to Cheng’s (2010) method; RTA refers to the ratio of test length to the number of attributes; PCCR refers to pattern correct classification rate; A-ACCR refers to averaged attribute correct classification rate; Est refers to the estimate; SE is standard error.
Correct Classification Rate for the RRUM (K = 5).

Note. PWCDI = posterior-weighted cognitive diagnostic index; PWADI = posterior-weighted attribute-level discrimination index; PCCR = pattern correct classification rate; A-ACCR = averaged attribute correct classification rate; ABI = attribute balance index; RTA = ratio of test length to the number of attributes; RRUM = Reduced Reparameterized Unified Model.
The results in Table 2 exhibit a similar pattern to that observed with the DINA model: the ABI performs better than ORI and RTA for moderate- and long-length tests for the MI method while it performs worse for short-length tests. In addition, both RTA and ORI produce larger PCCRs than ABI for short- and moderate-length tests for the MPWKL, PWADI, and PWCDI methods. Moreover, all of these three attribute coverage indices produce very similar PCCRs when the test length is long. Furthermore, the RTA produces a lower A-ACCR than ABI for the MI method, while it produces an identical or larger A-ACCR than ABI for most conditions. All main effects and second- and third-order interaction effects are statistically significant, with the exception of the second-order interaction effect between test length and Q-matrix structure for the MPWKL method, and the
The PCCR and A-ACCR for six attributes are presented in the supplementary material and the results can be summarized as follows: (1) The ABI, in general, produces higher PCCRs and A-ACCRs than RTA for the MI method; (2) the RTA and ORI methods produce higher PCCRs and A-ACCRs than ABI with the MWPKL, PWADI, and PWCDI methods regardless of Q-matrix structure and test length; (3) all the third-order interaction effects are significant, and the
The Usage of Items
The Usage of Items Measures k-Attribute for Five Attributes and Complex Q-Matrix.

Note. k-A means items measure k attribute(s). PWCDI = posterior-weighted cognitive diagnostic index; PWADI = posterior-weighted attribute-level discrimination index; ABI = attribute balance index; RTA = ratio of test length to the number of attributes.
a4-A and 5-A equal to 0 for all conditions.
Coverage of Attributes
Overall Percentage for Moderate- and Long-Length Tests.

Note. ABI = attribute balance index; RTA = ratio of test length to the number of attributes; RRUM = Reduced Reparameterized Unified Model. The results are omitted for the short-length test (i.e., J = 10) because all three attribute coverage indices do not satisfy the attribute coverage requirement.
Discussion and Conclusions
The goals of this study are to develop a new attribute coverage method, RTA, to deal with empirical situations when more than one attribute is involved in successfully solving a test item (DeCarlo, 2011; Huang, 2018) and to examine the performance of both ABI and RTA when different item selection methods are used. A simulation study is conducted to examine the performance of RTA and ABI, and promising results are produced.
The results show that the RTA produces lower PCCRs than ABI for moderate- and long-length tests with the MI method, especially with a complex structure Q-matrix. On the contrary, the RTA produces relatively high PCCRs than the ABI for short- and moderate-length tests with the MPWKL, PWADI, and PWCDI methods. A possible explanation is that both the MI method and the ABI criterion prefer single-attribute items, while the RTA and three other item selection methods tend to use fewer single-attribute items than ABI and MI method. As Madison and Bradshaw (2015) and Huebner et al. (2018) demonstrated, the more single-attribute items there are in a test, the higher the measurement accuracy is for long-length tests. Therefore, the RTA can be expected to produce lower measurement accuracy since fewer single-attribute items are used for the MI method. As for the MPWKL, PWADI, and PWCDI methods, the differences between the usage of items that measure one and two attributes are small, meaning that these item selection methods prefer items that measure either one or two attributes. Therefore, when the ABI criteria, which prefers the single-attribute items, is added to these three item selection methods, information provided by two-attribute items may be lost and, consequently, lower measurement accuracy is produced for the ABI compared to the ORI and RTA criteria. Meanwhile, a possible reason why the ABI performs worst in most conditions for short-length tests (J = 10) is that it is hard to satisfy the minimum number of items that measure each attribute when the test length is short. Although previous studies demonstrated that tests containing more single-attribute items tend to produce higher measurement accuracy (Huebner et al., 2018; Madison & Bradshaw, 2015), the prerequisite for a high measurement accuracy is that the test length is long enough.
Moreover, the results show that the ABI is not suitable for all item selection methods. In the current study, the ABI is suitable for the MI method, while it is unsuitable for the MPWKL, PWADI, and PWCDI methods. In the study of Cheng (2010), the combination between ABI and KL method (MMGDI) can produce higher measurement accuracy than the original KL method (MGDI). Since both the ABI criterion and KL/MI methods prefer single-attribute items rather than multiple-attribute items, using the ABI criterion further reinforces the tendency of the KL and MI methods to select single-attribute items. Hence, the combination between the ABI criterion and the original item selection methods would produce high measurement accuracy if the original item selection methods prefer single-attribute items. On the flipside, low measurement accuracy would be produced if more than one attribute is preferred by the original item selection methods (e.g., MPWKL, PWADI, and PWCDI).
It is worth noting that, although the RTA criteria produces higher measurement accuracy than the ABI criteria with the MPWKL, PWADI, and PWCDI methods, this does not indicate that the RTA performs better than ABI for all situations. By examining the ABI and RTA criteria, the ABI tends to penalize items that measure multiple attributes, while the RTA tends to select items that measure multiple attributes. Therefore, it is reasonable to infer that the composition of items that measure different number of attributes in the item pool have an important influence on these two criteria. The RTA performs better than ABI if there is a large number of multiple-attribute items in the item pool. Meanwhile, the ABI performs better than RTA if there is a majority of single-attribute items, producing higher measurement accuracy than RTA for all conditions.
The results also show that the ABI performs better than the RTA for moderate- and long-length tests concerning the attribute coverage, which coincides with our expectation. As stated previously, the formulation of the RTA is determined by two components. One is used to control the usage of items that measure different numbers of attributes and the other is used to control the attribute coverage. When one of the components is satisfied, the other component is ignored. For instance, when the summation of the first component is zero, the component that controls the attribute coverage is ignored and consequently the attribute coverage will not be satisfied.
In conclusion, the new attribute coverage control method—RTA—is suitable for controlling the attribute coverage and producing acceptable measurement accuracy when the item pool is comprised of a large number of items that measure multiple attributes, which is a common phenomenon in empirical testing situations (DeCarlo, 2011; Huang, 2018). The ABI, on the other hand, is appropriate for test situations when the majority of an item pool is comprised of single-attribute items. Furthermore, the ABI is suitable for item selection methods that prefer single-attribute items, such as the KL method (Cheng, 2010) and the MI method, but is not suitable for methods that prefer both single- and multiple-attributes items such as the MPWKL, PWADI, and PWCDI methods.
Although some promising results are found in the current study, several remaining open issues deserve further studies. First, we assume that the minimum number of items that measure each attribute are the same for all attributes. Considering that different attributes may carry different importance, this is not a necessary constraint and further studies can take the importance of each attribute into consideration to further investigate the performance of attribute coverage methods in CD-CAT. Second, fixed-length tests were used in the current study. Therefore, everyone was administered the same test length. Future studies can examine the performance of RTA when the test length is different for each individual (variable-length tests). Third, both the DINA model and the RRUM are specific CDMs and some constraints imposed on these specific CDMs are (a) only a single model is available across the entire test and (b) either compensatory or non-compensatory relationships is assumed for the test (Ravand, 2016). General CDMs relax these constraints, and therefore a general CDM can be used in future studies.
Supplemental Material
sj-pdf-1-apm-10.1177_01466216211040489 – Supplemental Material for A New Method to Balance Measurement Accuracy and Attribute Coverage in Cognitive Diagnostic Computerized Adaptive Testing
Supplemental Material, sj-pdf-1-apm-10.1177_01466216211040489 for A New Method to Balance Measurement Accuracy and Attribute Coverage in Cognitive Diagnostic Computerized Adaptive Testing by Xiaojian Sun, Björn Andersson and Tao Xin in Applied Psychological Measurement
Footnotes
Acknowledgment
The authors would like to thank the Editor in Chief, Dr. John R. Donoghue, the Associate Editor, Dr. Chun Wang, and two anonymous reviewers for their helpful comments on earlier drafts of this article.
Declaration of Conflicting Interests
The author(s) declared no potential conflicts of interest with respect to the research, authorship, and/or publication of this article.
Funding
The author(s) disclosed receipt of the following financial support for the research, authorship, and/or publication of this article: This study was supported by National Natural Science Foundation of China (Grant No. 32071093) and Research Program Funds of the Collaborative Innovation Center of Assessment for Basic Education Quality (2020-06-025-BZPK01).

Supplemental Material
Supplemental material for this article is available online.
References
Supplementary Material
Please find the following supplemental material available below.
For Open Access articles published under a Creative Commons License, all supplemental material carries the same license as the article it is associated with.
For non-Open Access articles published, all supplemental material carries a non-exclusive license, and permission requests for re-use of supplemental material or any part of supplemental material shall be sent directly to the copyright owner as specified in the copyright notice associated with the article.
