



Abstract
Targeted double scoring, or, double scoring of only some (but not all) responses, is used to reduce the burden of scoring performance tasks for several mastery tests (Finkelman, Darby, & Nering, 2008). An approach based on statistical decision theory (e.g., Berger, 1989; Ferguson, 1967; Rudner, 2009) is suggested to evaluate and potentially improve upon the existing strategies in targeted double scoring for mastery tests. An application of the approach to data from an operational mastery test shows that a refinement of the currently used strategy would lead to substantial cost savings.
Several high-stakes mastery tests such as the California Teaching Performance Assessment (e.g., Guaglianone et al., 2009) include performance tasks that require extensive responses and involve supporting information such as video recording.
Double scoring of the response to each performance task for each examinee is the gold standard in the testing industry (e.g., Williamson et al., 2012). However, scoring of performance tasks is expensive (e.g., Wiggins, 1990), which may make double scoring of all performance tasks for all examinees prohibitive for some mastery tests. One possible approach to control the cost is to perform double scoring for a random subset of examinees instead of all examinees. However, as Finkelman et al. (2008) argued, a better strategy is targeted double scoring (TDS), or, double scoring of a subset of examinees who are close to the boundary of the pass/fail 1 cutoff, provided such examinees can be accurately identified.
Supplemental Appendix A includes a brief description of an approach suggested by Finkelman et al. (2008) for TDS for tests that include both multiple choice items and performance tasks. This article focuses on TDS for mastery tests that comprise performance tasks and may not include any multiple choice items 2 and suggests an approach based on statistical decision theory (e.g., Berger, 1989; Ferguson, 1967; Rudner, 2009) for optimal selection of the subset of examinees whose responses would be double-scored. The approach is demonstrated using data from a high-stakes mastery test that includes three performance tasks.
A New Approach Based on Decision Theory for Targeted Double Scoring
Let us consider a mastery test that employs TDS and comprises one or more performance tasks. Let us focus on one part of the mastery test (referred to as a subtest of interest) that includes one or more performance tasks. The remaining part of the test could include any types of items including performance tasks and multiple choice items. Suppose that the responses of an examinee to the tasks belonging to the subtest of interest were rated/scored by one rater who is randomly chosen from a pool of raters. The task scores are added over all tasks of the subtest to compute a Rater 1 subtest score for each examinee. Note that the actual rater who rates the tasks of the subtest varies over examinees and the various subtests for a single examinee may be rated by different raters, often because the responses to the different subtests for an examinee may not be available to the testing organization at the same time. Suppose that according to the policy for TDS of the mastery test, all examinees whose Rater 1 subtest scores fall within a critical score range (CSR) are double-scored. The job of the investigator is to find values of the upper and lower bound of the CSR in an optimum manner so that the resulting scores are reliable and valid for their purposes and the scoring cost is not too high. Note that the scores on the remaining part of the test may or may not be available at the time of making the decision of double scoring on the subtest of interest. It is also assumed that an overall test score—that combines the scores on the subtest of interest and the remaining part of the test—is computed for all examinees. In the simplest case (like in the Application section of this article), the score on the subtest of interest is equal to a simple average of the two scores from the two raters on the subtest for the double-scored examinees and equal to the Rater 1 score for the non–double-scored examinees; and the overall test score for any examinee is equal to the sum of the score on the subtest of interest and the score on the remaining part of the test.
In applications of statistical decision theory (e.g., Berger, 1989; Ferguson, 1967; Rudner, 2009), an investigator chooses one among a set of possible actions/decisions. A major tool in decision theory is a loss function that quantifies the gain or loss associated with each possible action. Applications of decision theory also involve an unknown element that is typically expressed as one or more random variables and their associated probability distribution(s). The investigator computes the average (or expected) loss, averaged over the probability distribution(s), for each action and chooses the action that leads to the minimum average loss among all possible actions.
In TDS, an action corresponds to the choice of a specific CSR for the subtest of interest and the unknown elements are the rater scores. If the Rater one subtest score of an examinee falls within the CSR (that leads to the double scoring for the examinee on the subtest), the resulting loss is assumed to be equal to the cost of an extra rating on the subtest. Let us denote this cost as c. For each Rater 1 subtest score that falls outside the CSR, no double scoring is performed, but that event is assumed to lead to a loss of • L
P
if the examinee passes the test based on Rater 1 subtest score (that is, with single scoring) and would have failed the test if the subtest were double-scored; • L
F
if the examinee fails the test based on Rater 1 subtest score and would have passed the test if the subtest were double-scored; • 0 if the examinee’s pass/fail status is the same irrespective of whether one or two ratings are used.
The quantity L
P
primarily quantifies the harm caused by borderline examinees who incorrectly passed the mastery test in the way of performing poorly at their professions.
3
The quantity L
F
represents the loss corresponding to the potentially unfair failing and the resulting loss of job income of a borderline examinee. This formulation of the problem capitalizes on the fact that double scoring leads to an improvement in the quality of the scores compared to single scoring, which has been noted by, for example, Finkelman et al. (2008) and Williamson et al. (2012). The expected loss for a CSR is then given by

It is assumed in the above calculations (for the subtest of interest) that a decision of single or double scoring has been taken on the remaining part of the test, and, scores are available in the remaining part.
Equation 1 can also be expressed as

Equation 1 or 2 can be used to estimate the expected loss of each CSR if the probabilities in the equations can be accurately estimated. It is possible to employ a statistical or psychometric model to estimate the probabilities. Or if a representative sample of double-scored responses is available, then the probabilities in the equations can be estimated by the corresponding sample proportions. The CSR that leads to the smallest estimated expected loss can be chosen as the optimum CSR. The approach of choosing the CSR by minimizing the expected loss constitutes an optimal approach in the sense that (a) such an approach has desirable theoretical properties (for example, fundamental axiomatic developments suggest that such an approach is consistent with plausible axioms of rational behavior) and (b) situations can be constructed in which the follower of other approaches will be assured of inferior results (e.g., Berger, 1989; Ferguson, 1967). To estimate the expected loss using Equation 1 or 2, one needs appropriate values of c, L P , and L F —these values are problem-specific.
Application
The Data
Some Details on the Three Tasks of the Licensure Test.

The same rater scores the three or four parts of a task response on a 0-4 scale. A task score from a rater is the sum of the scores on all the parts of a task. In the past, each task response used to be scored by two raters and the task score was set equal to the average of the task scores from the two raters. After the recent introduction of TDS for the test, each task response is first scored by a rater who is chosen from a rater pool of several hundred raters; if the task score assigned by the rater (referred to as the “Rater 1 task score” henceforth) falls within a CSR, the corresponding task response receives an independent second rating and the task score is set equal to the average of the task scores from the two raters. The currently used CSRs for the three tasks are shown in Table 1. The scoring is performed one task at a time. Thus, when a decision on double scoring is made for an examinee on a task, scores for the examinee on the other tasks may not be available.
The final test score is the rounded weighted sum of the scores on the three tasks. The weights on the three tasks are provided in Table 1—they imply that the test score ranges between 0 and 60. The passing score on the test is 36.
It was decided to apply the decision-theoretic approach to data from this test to determine if the CSRs shown in Table 1 are optimum. It was also decided to estimate the probabilities in Equations 1 and 2 by the corresponding sample proportions. Because such estimation requires double-scored responses from a representative sample, the data for the 731 examinees who took the test before the introduction of TDS were used—all task responses were double-scored for these examinees. 4
Percentages of Examinees with Various Rater 1 Scores for the Three Tasks.

Analysis
The aforementioned data were used to estimate the expected losses of several CSRs including the operational CSR for each task, one at a time. Because operational scoring is performed one task at a time for the test, a task plays the role of a subtest in the approach suggested above. For each task, P(CSR) in Equation 2 was estimated by the proportion of all examinees whose Rater 1 task score for the task of interest falls within the CSR. For each task, the probability

Conversations with the administrators of the test made it clear that one task rating costs about $40 on average after including all expenses. Therefore, c was set equal to 40. The following five combinations of L P and L F were used in the computations of the estimated expected losses: {40, 40}, {400, 400}, {4000, 4000}, {800, 200}, {200, 800}. The first and third combinations were chosen to represent two extremes, representing the cost of an incorrect decision (arising out of single scoring) to be very low and very high, respectively. The other three combinations represent more moderate conditions. While L P = L F in three of the five combinations, the combinations {800, 200} and {200, 800} were chosen to represent unequal losses from the two types of incorrect decisions. 5
Results
Figure 1 shows the estimated expected losses along the vertical axis for Task 1 for six CSRs that include the operational CSR for the task (6–8), two extreme CSRs (the null set representing no double scoring and the set 0–12 representing double scoring of all responses), and three other CSRs that were found to lead to small estimated expected losses on average in a preliminary investigation. Each line corresponds to a CSR and connects five points that represent the estimated expected losses for five combinations of L
P
and L
F
that are represented along the horizontal axis for that CSR. The six CSRs are denoted using different symbols, as denoted in the legend of the figure. A logarithmic scale is used for the vertical axis for convenience of viewing. Supplemental Appendix B includes a figure that shows the estimated expected losses for several CSRs for Tasks 2 and 3 and also includes three tables that show the estimated expected losses and several other relevant statistics for 10 CSRs (including the six represented in Figure 1) for the three tasks. Estimated expected losses for Task 1 for six CSRs for the real data example.
Figure 1 shows that The estimated expected loss is always 40 for the CSR 0–12. When L
P
and L
F
are equal to 40, the loss for incorrect pass/fail decisions is no more than the cost of double scoring (thus, incorrect decisions are not costly), and, consequently, the estimated expected loss is the smallest for the null CSR, and “no double-scoring” is the optimum decision. When L
P
and L
F
are equal to 4,000, the loss for incorrect pass/fail decisions is much larger than the cost of double scoring (thus, incorrect decisions are very costly), and, consequently, the estimated expected loss is the smallest (and equal to 40) for the CSR 0–12, and “all double-scoring” is the optimum decision. In additional investigations, all double scoring was found to be the optimum decision for any combination in which both L
P
and L
P
are larger than 1000. For the other three sets of values (the three middlemost combinations in the figure) of L
P
and L
F
, the estimated expected loss is the smallest for the CSRs 5–7 or 4–6, which also lead to fewer examinees (22% and 13%, respectively) being subjected to double scoring compared to the currently used CSR (32%). These two CSRs also have optimum values of some other statistics in the first table in Supplemental Appendix B.
An interesting finding is that the optimum CSR varies over the three combinations where L P and L F are equal. The reason is that as both L P and L F increases, the investigator believes more strongly that an incorrect pass/fail decision is more costly compared to the cost of an additional rating and the decision-theoretic approach favors more double scoring or wider CSRs. So it is natural that the null range leads to the smallest loss when L P = L F = 40, the middle ranges lead to the smallest loss when L P = L F = 400, and the full range leads to the smallest loss when L P = L F = 4,000.
The final choice of CSRs would depend on the unknown values of L P and L F . For example, if one strongly believes that both L P and L F are larger than, say, 2,000, then double scoring should be implemented for all examinees, or, for as many examinees as possible under the budget. From our discussion with those who work closely with the aforementioned test, the actual losses for the test somewhere in between those represented by the combinations {400, 400}, {800, 200}, and {200, 800} of L P and L F . Therefore, the CSRs of 5–7 or 4–6 seem to be the optimum CSR for Task 1. A similar analysis shows (see the second figure and the latter two tables in Supplemental Appendix B) that the CSR 7-10 seems preferable compared to the currently used CSR of 9–11 both for Tasks 2 and 3. Any of these optimum CSRs lead to a considerable improvement over the currently used CSRs in terms of several factors such as score reliability and the passing rate from TDS being closer to that obtained for full double scoring.
Figure 2 is a graphical demonstration of why the CSRs that appear to be optimum from a decision-theoretic analysis are reasonable. Each row in the figure shows, for a task, the proportion of examinees whose passing status flips with double scoring as against single scoring (along the Y-axis) versus the Rater 1 task score (along the X-axis). “Proportion of P1F2” refers to the proportion of examinees who passed based on Rater 1 scores on all tasks, but failed with double scoring only on the task of interest, while “Proportion of F1P2” refers to the proportion of examinees who failed based on Rater 1 scores on all tasks but passed with double scoring only on the task of interest. Each square corresponds to one such proportion for a R1 score on the task of interest. The number inside a square is the number of examinees who received the corresponding Rater 1 score on the task of interest. For example, the topmost square surrounding the number 17 in the top right panel indicates that among the 17 examinees who obtained a Rater 1 score of 4 on Task 1, a little less than 20% failed based on Rater 1 scores on all tasks, but passed with an extra rating on Task 2. The left panels correspond to passing based on Rater 1 scores and failing based on double scoring and the right panels correspond to failing based on Rater 1 scores and passing based on double scoring. The range of Y-axis is the same in all the panels. In TDS, the CSRs should ideally include the values of Rater 1 scores for which proportions of P1F2s and F1P2s are large, with more importance being given to the proportion of F1P2 (that is because the proportion of F1P2 is larger in the data set compared to that of P1F2; this result is an outcome of regression to the mean and the fact that the passing score is below the mean for the test, which is just above 40). A minor objective while forming the CSRs is to stay away from the modes of the task scores that are shown using vertical dashed bars (this is so that expenses are kept low. There are more examinees at the mode). In the figure, the CSRs 4–6, 7–10 and 7–10 satisfy both of these, respectively, for the three tasks. That is, the proportions of P1F2s and F1P2s are the overall largest for these CSRs that are all below the modes. Proportion of switches resulting from the second rating for the real data example.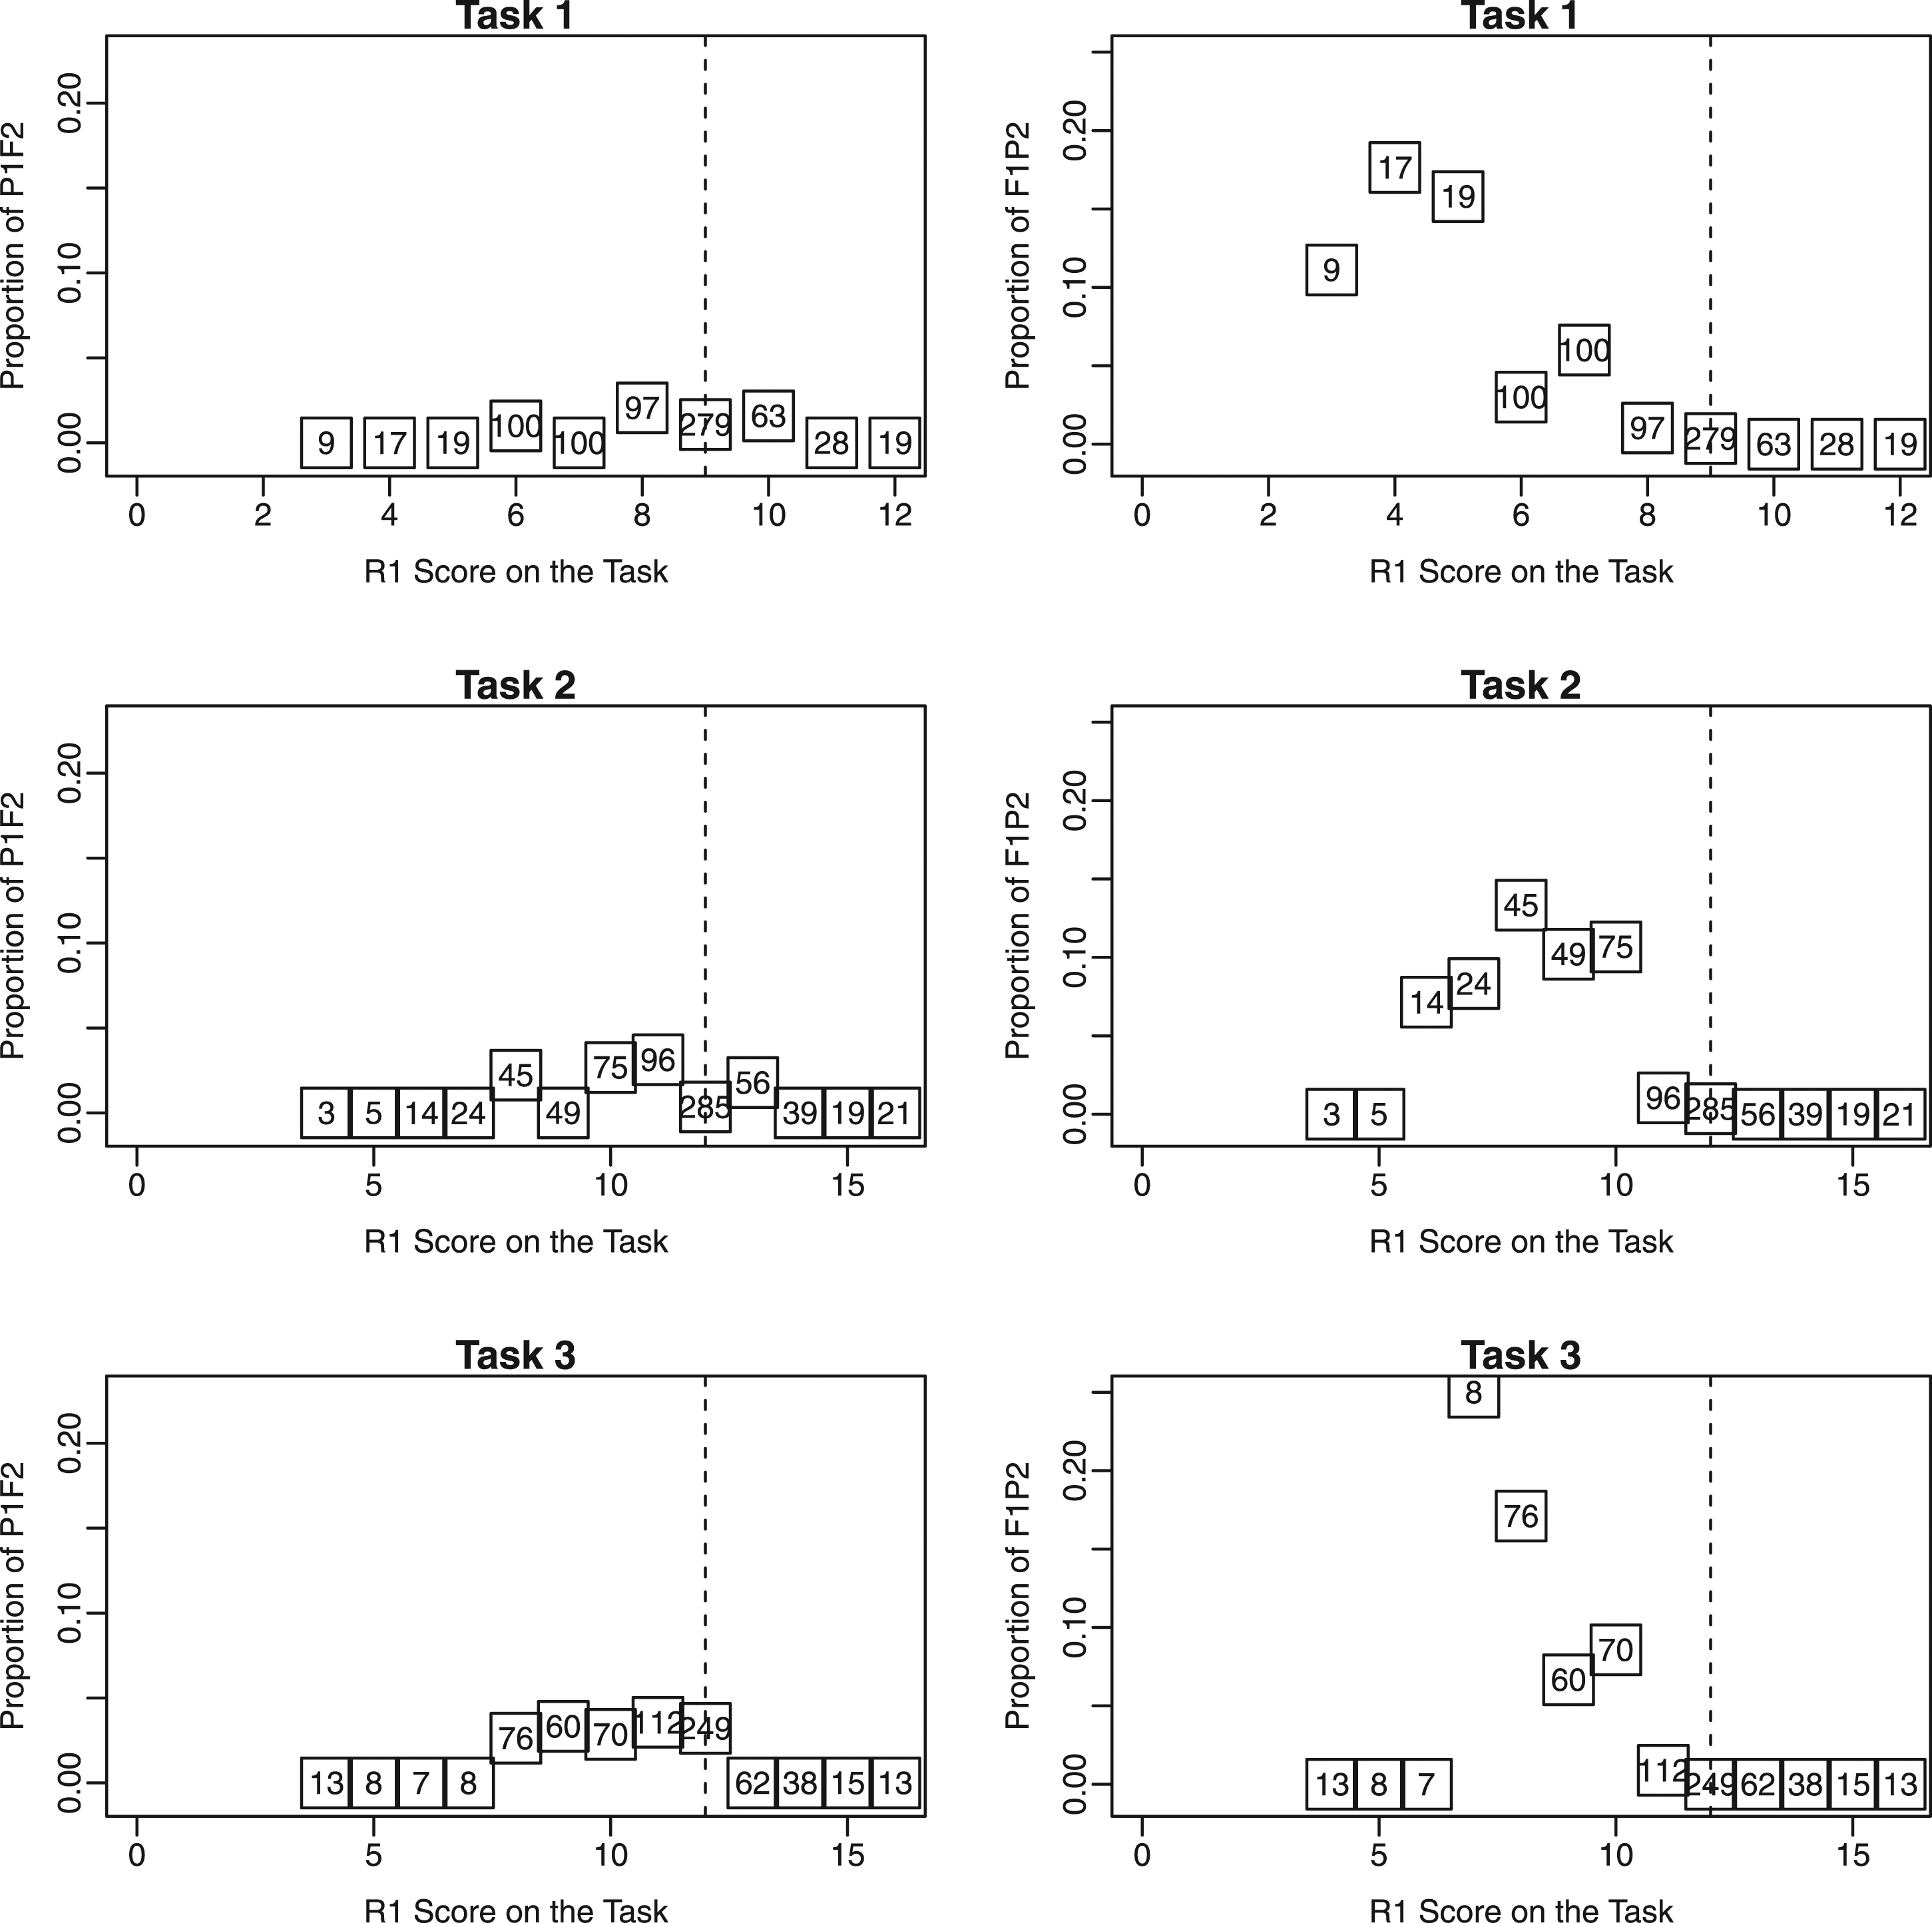
Instead of using three CSRs for the three tasks, more cost saving may be achieved by using a strategy that involves (a) the computation of a total score over all tasks based only on Rater 1 scores, and (b) the use of double scoring on all tasks for the examinees whose total scores are the closest to the cut score. However, because a decision on double scoring for a task is made for an examinee whose scores on the other tasks are not available yet for the aforementioned test, it is operationally infeasible to make TDS decisions based on a total test score. So the use of separate CSRs for the three tasks is a reasonable procedure as of now. A recommendation for the testing program thus is to score all the tasks for each examinee roughly at the same time and make double-scoring decisions based on the total Rater 1 score on the test. Another potential area of future exploration is full (possibly Bayesian) flexible modeling of the problem, taking into account details of the test including the covariance among the tasks, scoring costs etc., followed by optimization based on the score users’ requirements. Such an approach will most likely involve (a) the assumption of a probability model for the task scores, (b) the computation of the posterior distribution of the examinee ability given the available scores, (c) a loss function representing as much information about the test as possible, and (d) double scoring of the examinees with the largest expected loss.
Supplemental Material
Supplemental Material - Targeted Double Scoring of Performance Tasks Using a Decision-Theoretic Approach
Supplemental Material for Targeted Double Scoring of Performance Tasks Using a Decision-Theoretic Approach by Sandip Sinharay, Matthew S. Johnson, Wei Wang, and Jing Miao in Applied Psychological Measurement
Footnotes
Declaration of conflicting interests
The author(s) declared no potential conflicts of interest with respect to the research, authorship, and/or publication of this article.
Funding
The author(s) received no financial support for the research, authorship, and/or publication of this article.

Supplemental Material
Supplemental material for this article is available online.