
Abstract
A variety of approaches have been presented for assessing desirable responding in self-report measures. Among them, the overclaiming technique asks respondents to rate their familiarity with a large set of real and nonexistent items (foils). The application of signal detection formulas to the endorsement rates of real items and foils yields indices of (a) knowledge accuracy and (b) knowledge bias. This overclaiming technique reflects both cognitive ability and personality. Here, we develop an alternative measurement model based on multidimensional item response theory (MIRT). We report three studies demonstrating this new model’s capacity to analyze overclaiming data. First, a simulation study illustrates that MIRT and signal detection theory yield comparable indices of accuracy and bias—although MIRT provides important additional information. Two empirical examples—one based on mathematical terms and one based on Chinese idioms—are then elaborated. Together, they demonstrate the utility of this new approach for group comparisons and item selection. The implications of this research are illustrated and discussed.
Keywords
Introduction
Despite their limitations, self-report measures have continued to be a mainstream method for human assessment in educational, psychological, and applied settings (Paulhus & Vazire, 2007). Their popularity stems from several advantages: they are easy to administer and inexpensive to score compared to informant or behavioral alternatives. In addition, they can be completed within a reasonable short time, facilitating the recruitment of survey participants.
In spite of these advantages, self-report measures have long drawn concerns about response styles (Cronbach, 1949). Arguably, the most threatening of these response styles is socially desirable responding (SDR; Paulhus, 1991). Differential tendencies to give desirable responses can contaminate valid responses. The impact of SDR on self-report measures of personality remains controversial despite 80 years of empirical investigation (for a review, see Ziegler et al., 2011). Because of this potential threat, it is important to distinguish the valid content of self-reports from the distortion engendered by SDR. This goal requires measurement of SDR. However, the most tempting solution—partialing SDR out of self-reports—has proven counterproductive (Paulhus, 2017). Advocates for the superiority of cognitive ability measures point out that, by contrast, their scoring is objective; that is, responses are valid if they match a scoring key.
To overcome the limitations of self-reports, objective performance methods are generally preferred (Furr & Funder, 2007). In the literature, proactive and reactive methods have been applied to measure or control SDR. Proactive methods are used to enhance respondents’ motivation to provide true answers before data are collected, whereas reactive methods are used to detect or correct biased responses after data are collected. One may refer to Muszyński (2020) for a detailed review and comparison of different methods.
Among them, two reactive methods, which are relatively easy to implement in practice, are briefly introduced here (Paulhus & Holden, 2010). One exploits the fact that faking a response takes longer than responding honestly (Holden et al., 1992). Thus, Holden and Kroner (1992) were able to diagnose SDR by comparing response times under faked versus honest instructions.
A second objective method, called the overclaiming technique (OCT; Paulhus et al., 2003), requests respondents to indicate their level of familiarity with a set of items belonging to a specific content domain (e.g., historical events, famous musicians). To address exaggeration, the item set included some items that do not exist (called foils). Any endorsement of such foils is of particular interest where there might be a cognitive bias (Müller & Moshagen, 2018) or a tendency of self-enhancement (Paulhus et al., 2003). In this study, such endorsements were taken as representing a blatant misrepresentation of reality. Indeed, this concept of overclaiming bias has been designated as one of the “five pillars of self-enhancement” (Sedikides & Alicke, 2019).
Here, we use the term “overclaiming data” for any dataset comprising responses to a combination of real items and foils. Because such datasets incorporate a key for “truth” (i.e., the factual difference between reals and foils), the accuracy of an individual’s responses can be scored without any external criterion and can be taken as an objective performance measure (Paulhus & Harms, 2004). Although presented as a nonthreatening survey of everyday familiarities, the OCT method can be used to tap both knowledge accuracy (i.e., true familiarity with knowledge) and knowledge bias (i.e., knowledge exaggeration) for each respondent (Paulhus, 2011).
For example, the academic version, the Over-Claiming Questionnaire-150 (OCQ-150; Paulhus et al., 2003), covered 10 content domains (e.g., historical names and events, fine arts, language, and popular culture), each of which contained 15 items. In that initial version, the real and foil items were 80% and 20%, respectively. Respondents were asked to rate their familiarity with each item on a 7-point scale ranging from 0 (never heard of it) to 6 (know it very well). Because the 150-item version is rather lengthy to apply widely in practice, Paulhus et al. (2003) shortened the instrument to 60 items. Other studies have used even briefer measures (e.g., Bing et al., 2011) and alternative content (Jones et al., 2020; Paulhus & Dubois, 2014; Ziegler, Kemper, & Rammstedt, 2013). The standard analytical approach of OCT was derived from signal detection theory (SDT; Swets, 1964). Under that terminology, the endorsements of reals and foils are labeled hits and false alarms, respectively. Using a variety of standard formulas (MacMillan & Creelman, 2005), those endorsement rates can then be transformed to capture knowledge accuracy and knowledge bias (Paulhus et al., 2003; see details below). A more elaborate method requires confirmation of hits (Ackerman & Ellingsen, 2014). Finally, a structural equation alternative has been recommended by Hülür et al. (2011).
Item Response Theory
Item response theory (IRT) has become the predominant measurement model in many fields. For example, its advantages have now been exploited in educational (e.g., Wang et al., 2006) and personality research (e.g., Reise & Henson, 2003). In applying IRT to overclaiming data, Williams and Zumbo (2003) had to confront a challenge for any alternative to the SDT; namely, that accuracy scores require both reals and foils. They overcame this challenge by analyzing a 75-item overclaiming dataset using a two-stage method. The first step was to obtain a latent accuracy factor score for each respondent. This goal was effected by creating 12 groups of “pseudo items” based on the subscale structure. The accuracy score of each pseudo item was calculated from the averaged hit rates (for real items) and false alarm rates (for foils). A factor analysis was then conducted on the 12 accuracy scores, with the factor scores being used to represent the latent variable. The second step was to derive an item characteristic curve (ICC) for each pseudo item (i.e., each subscale). To do so, the locally weighted scatterplot smoothing method (Fox, 1997) was fitted to each scatterplot: The x- and y-axes represented the latent variable and the standardized accuracy score on each pseudo item, respectively. Thus, the obtained nonparametric ICCs represented the functioning of pseudo items on the latent variable.
Although novel, the Williams–Zumbo approach has limited value for analyzing overclaiming data. First, it deals only with accuracy, overlooking knowledge bias entirely. Second, the approach does not address raw items directly; rather, the pseudo items are at the subscale level (i.e., topics). Consequently, the relationship between the derived latent variable and the raw items remains unclear. Finally, because an accuracy score is averaged over the raw items within the pseudo item, the selection of raw items highly influences the quality of the pseudo item. This may be an issue for subscales with few raw items. In addition, a substantial number of pseudo items are required to satisfy the assumptions of factor analysis. Hence, this method is most appropriate for a longer questionnaire composed of many subscales. Recently, SDT indices have been to be problematic and less straightforward in representing two independent latent variables, as was commonly assumed (Goecke et al., 2020). To address these limitations, we propose a multidimensional item response theory (MIRT) framework to model overclaiming data directly at the item level.
The present article is organized as follows. First, formulas for the SDT approach are reviewed, and formulas for the MIRT approach are introduced. Then, parallels between the SDT indices and the MIRT model parameters are highlighted. Next, we detail a simulation study and two empirical applications to demonstrate the capability of this new method. Finally, the results and suggestions for further research are discussed.
Applying Signal Detection Theory (SDT)
As noted earlier, the SDT approach has been the standard method for OCT data analysis. First introduced by Swets (1964), SDT classifies the response to each item into one of four categories: (1) hit, (2) miss, (3) false alarm, or (4) correct rejection. A hit and a miss refer to the cases where an existent stimulus has or has not been correctly recognized by the respondent, respectively; a false alarm refers to a nonexistent stimulus that has been incorrectly claimed, and a correct rejection indicates an accurate denial of receiving a nonexistent stimulus.
In SDT, a respondent’s judgment as to whether a signal is presented or not (i.e., a stimulus is real or not) can be depicted on a latent continuum of familiarity with two standardized normal distributions (DeCarlo, 2020; 2021). Figure 1 illustrates the formulation visually. In the panels of Figure 1, the right and left distributions represent respondents’ familiarity for real items and foils, respectively. Figure 1(a) shows the case in which a real stimulus is presented (i.e., the distribution plotted with solid line). Compared to the conceptual distribution (graphed with a dashed line on the left) for respondents who do not recognize the real stimulus, the areas above and below the criterion refer to hit and miss rates, respectively. Figure 1(b) shows the case in which a foil is presented (i.e., the left distribution with solid line). Compared to the conceptual distribution (plotted with dashed line on the right) for respondents who deem the stimulus to be real, the areas above and below the criterion refer to false alarm and correct rejection rates, respectively. The Signal Detection Model for (a) real items with corresponding hit and miss rates and (b) foils with corresponding false alarm and correct rejection rates.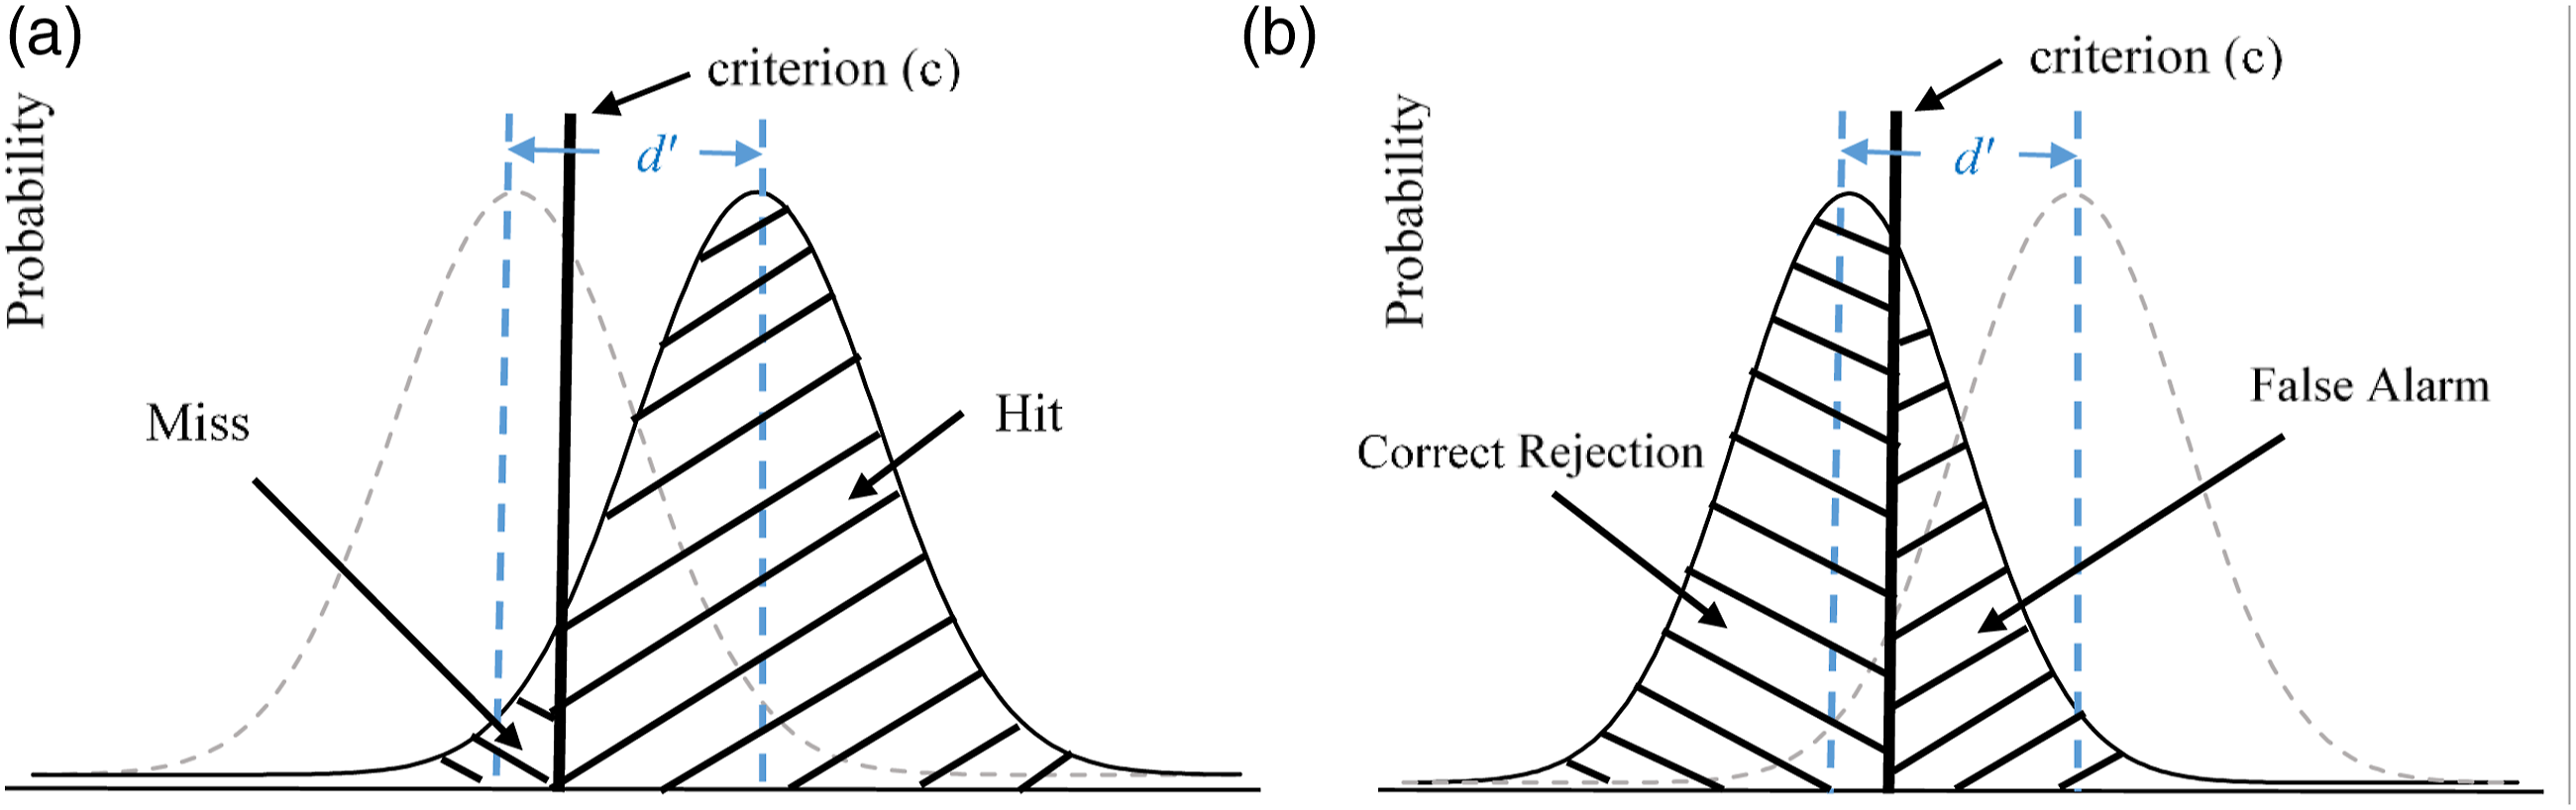
In the present case, all items (reals and foils) are treated as homogeneous; only the differences between subjects were of interest here. As indicated in Figure 1, two person parameters are associated with the probabilities of the four response categories (hit, miss, false alarm, and correct rejection). First, knowledge accuracy for respondent n, which is defined as the number of hits relative to the number of false alarms, is calculated and standardized as

The criterion c
n
, which is known as the knowledge bias index (MacMillan & Creelman, 2005; Paulhus et al., 2003; Sorkin, 1999), is used to represent the respondent n’s tendency to overclaim. It is calculated as follows

The SDT approach is not limited to binary outcome variables; it can also be extended to accommodate ordinal (rating) responses (MacMillan & Creelman, 2005). Consider a set of items with J categories (scored from 0 to J – 1) and scores of 1 to J – 1 used sequentially as cutoff values. For example, the first cutoff was set at 1, which means that every response scored at 1 or above was taken as a hit (for a real item) or false alarm (for a foil), and the d′ and c′ indices were in turn calculated for each respondent. These procedures were then repeated for the remaining J – 2 cutoffs, and two indices were computed accordingly. The overall accuracy and bias score for each respondent were obtained by averaging the J – 1 d′ and c′ indices.
Although SDT can be used to characterize individual differences in knowledge accuracy and bias (Paulhus et al., 2003), a complication ensues from the fact that each item response is actually a function of two elements: personal features and item features. As Williams and Zumbo (2003) correctly noted, the measurement of item features remained unclear in the SDT approach. To accurately predict a person’s response to an item and correctly evaluate the measurement quality, both personal and item features should be jointly modeled. Given this more precise representation of each person’s response to each item, the extent of a respondent’s misrepresentation (bias) can also be recovered more cleanly.
Also, in SDT analyses, the personal indices are typically reported without measurement errors. This deficiency precludes a comparison between the two estimates of an individual’s accuracy and distracts from possible inaccuracies in decision-making about an individual’s accuracy (or bias). Third, although the two indices are useful for determining the relative location of a subject within a sample, the practical implications are not evident. The indices have no units and therefore require further explication. To address these drawbacks, we now follow-up the Williams and Zumbo (2003) method and promote an alternative: the MIRT approach.
Applying Multidimensional Item Response Theory (MIRT)
Self-report inventories, including overclaiming questionnaires, are usually composed of items rated on an ordinal scale. Over the past several decades, a number of studies have developed or used different IRT models to accommodate ordinal (rating) data under various conditions (Jeon & De Boeck, 2016; Jin & Wang, 2014; Tay et al., 2011; Wang et al., 2006). In the present article, we adopted an IRT measurement model capable of dealing simultaneously with overclaiming data (i.e., a set of reals and foils). Similar to SDT analysis, two underlying assumptions were made as follows: first, the operation of knowledge bias inflates the scores of both reals and foils; and second, the knowledge accuracy reflects not only the endorsement of reals but also the correct rejection of foils. The anticipated multidimensional model for overclaiming (MMOC) can then be formulated as follows


Figure 2 presents the two-dimensional item characteristic curves for reals and foils. This illustrates that, for a given accuracy level, a stronger bias induces a higher probability of endorsing both reals and foils. On the other hand, for a given bias level, higher accuracy will increase the probability of endorsing a real item and decrease that of endorsing a foil. The ratio of λi1 to λi2, defined as bias saturation, indicates the degree of overclaiming on item i (for similar precedents, see Wang et al., 2015). The larger the ratio, the more substantial the impact of knowledge bias. The numerator and denominator are restricted to positive numbers, so the ratios are always positive. Item characteristic curves for real items and foils.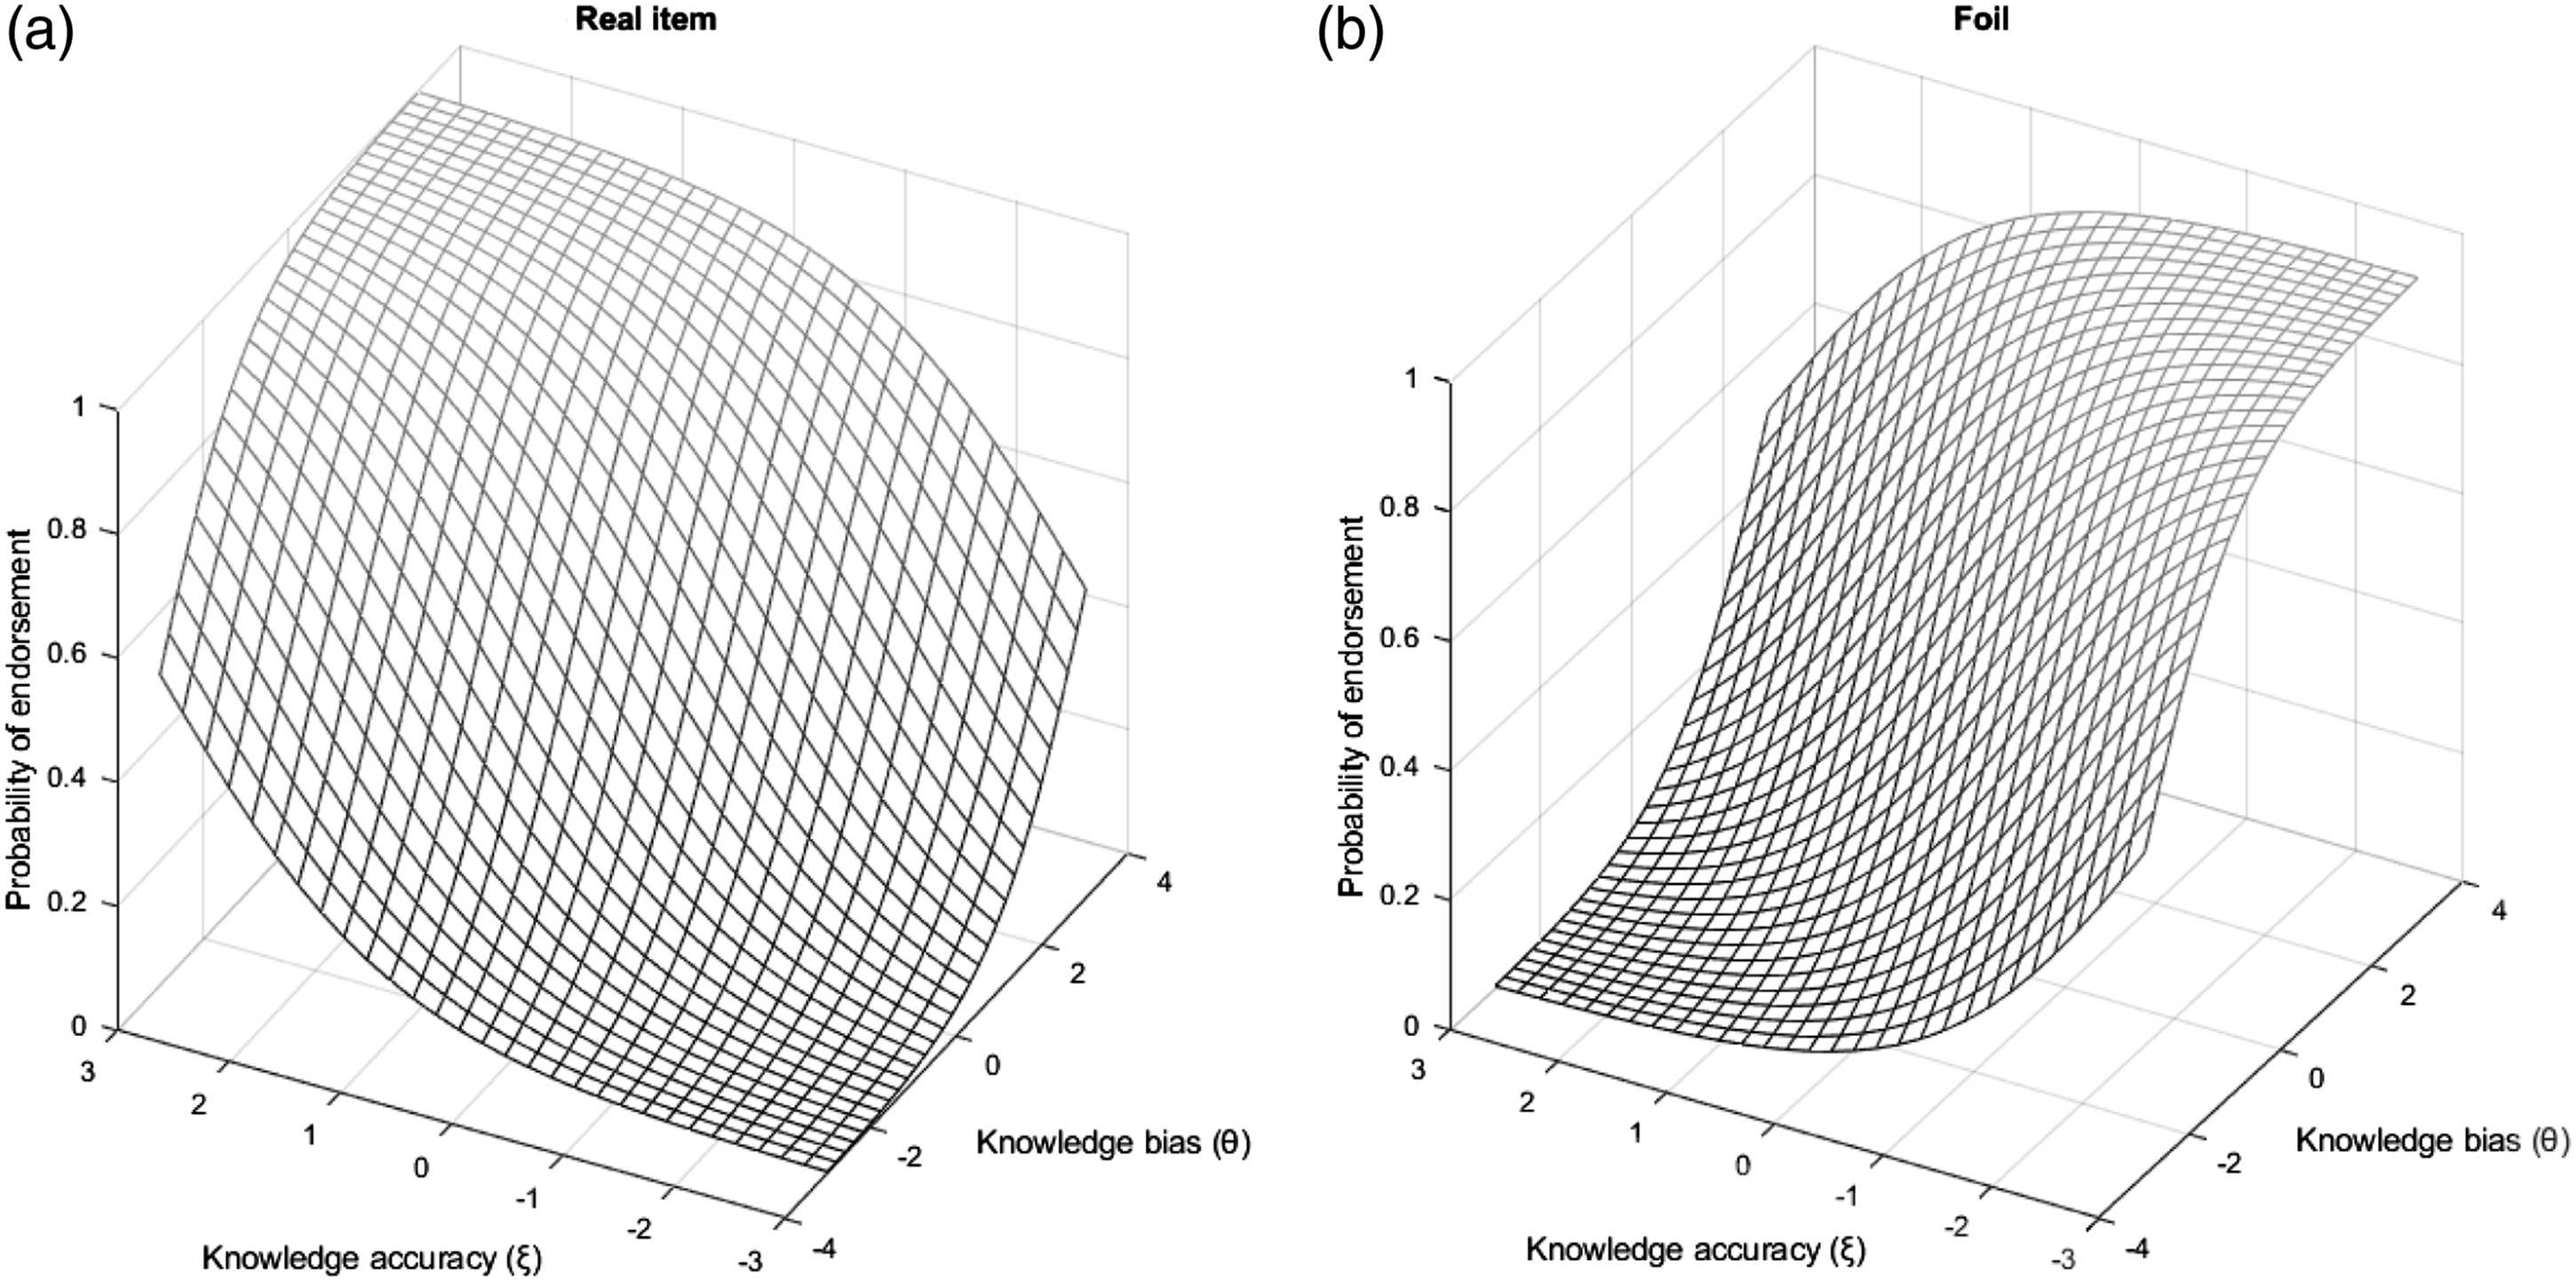
Equations (3) and (4) can be easily generalized to fit ordinal data. For example, the probability of endorsing category y on item i of person n can be expressed as


The limitations of using the SDT model to analyze overclaiming data, as mentioned above, can be easily addressed by the MMOC. The item response function of the MMOC is helpful for describing the relationship between person features, item features, and observed responses. Moreover, measurement errors are available for both θ and ξ; these are necessary for estimating test reliability. Precise item response prediction is feasible by simultaneously applying the person and item estimates. These values can also be applied to evaluate the misfit of response vectors against the measurement model’s expectation or to predict individual responses to unanswered items.
Of special importance, item parameters can be obtained when the MMOC is applied to overclaiming data. This information may be useful in practice (e.g., pruning items for a shorter version of the OCQ). Hence, the quality of measurement can be further ensured. As for parameter estimation, because the MMOC is a restricted model of the multidimensional random coefficients multinomial logistic model (Adams et al., 1997), many existing computer programs can feasibly be used for parameter calibration. We used the R package, TAM (Kiefer et al., 2020), implementing the tam.mml function with marginal maximum likelihood estimation.
Relations Between the SDT and MIRT Analyses of Overclaiming Data
In the SDT model, the hit rate is directly proportional to d′ and c′, whereas the false alarm rate is directly proportional to c′ and inversely proportional to d′. These relationships also hold in the MMOC. Specifically, the expected hit rate for combinations of θ and ξ is calculated by averaging the probability of positive responses across all reals. Thus, a higher θ (or ξ) would lead to a higher hit rate. Similarly, the expected false alarm rate is calculated by averaging the probability of positive responses across all foils; a higher θ (or a lower ξ) would therefore lead to a higher false alarm rate. In sum, the SDT and the MMOC approaches are conceptually equivalent: the SDT accuracy index, d′, is analogous to the ξ parameter in the MMOC, and the SDT bias index, c′, is analogous to the θ parameter. Next, we demonstrate the empirical relationship between these two approaches in a simulation study, after which we present two empirical examples. Due to space limitations, the second example is included in the Appendix A.
Method
Simulation Study
A systematic series of simulations was conducted to compare the accuracy and bias indices obtained from the MMOC with those obtained from SDT. In particular, (a) correlations were evaluated between the two methods of calculating each index, and (b) the values of these correlations were investigated as a function of several design factors. Notably, because SDT is the most common procedure for analyzing overclaiming data (e.g., Kam et al., 2015; Müller & Moshagen, 2019; Paulhus et al., 2003; Vonkova et al., 2018), it was treated as a comparative reference for the proposed MMOC in this study.
Design
For each of the 48 experimental conditions, we generated datasets of 1000 hypothetical respondents. This process was then replicated 200 times. The results under each condition were then represented as the means of the 200 replications. The 48-condition design emerged from manipulating three factors: (1) the test length (10, 20, or 30 items); (2) the proportion of foils (20%, 30%, 40%, or 50%); and (3) the number of response categories (2, 3, 4, or 5). The person parameters (θ and ξ) were drawn from a multivariate normal distribution with mean
Analyses
The simulated data were analyzed with the R package TAM. The R script for calculating the MMOC indices from the data is provided in the Appendix B. The corresponding SDT indices were similarly calculated with R. To determine the similarity of person indices from the SDT and MIRT, two dependent variables were calculated: the correlation between θ and c′ (denoted by rθc′), and the correlation between ξ and d′ (denoted by rξd′). The higher the correlation coefficients, the more interchangeable the MIRT and SDT person indices are. In addition, to investigate the impact of the manipulated factors on the two dependent variables, two sets of three-way ANOVAs were conducted. Because correlation coefficients (ranging from −1 to 1) violate the normality assumption of ANOVA, a Fisher z-transformation was applied to create approximately normally distributed dependent variables (zθc′ and zξd′) for analysis.
Results
Figure 3 shows the distributions of rθc′ and rξd′ across conditions. These values were higher than .70 for most conditions, supporting the proposition that the indices of knowledge accuracy and knowledge bias are directly related to the two latent trait estimates in the MMOC. However, when the dataset dipped to 10 dichotomous items, the correlation coefficients were less impressive. Differences in correlations across foil proportions were also most discrepant under the 10-item condition. All correlations were found to consistently range from .85 to .95 under the 30-item condition. Relationships between the SDT and MMOC indices across conditions. Note. The first row (a, b, c) refers to knowledge bias; the second row (d, e, f) refers to knowledge accuracy.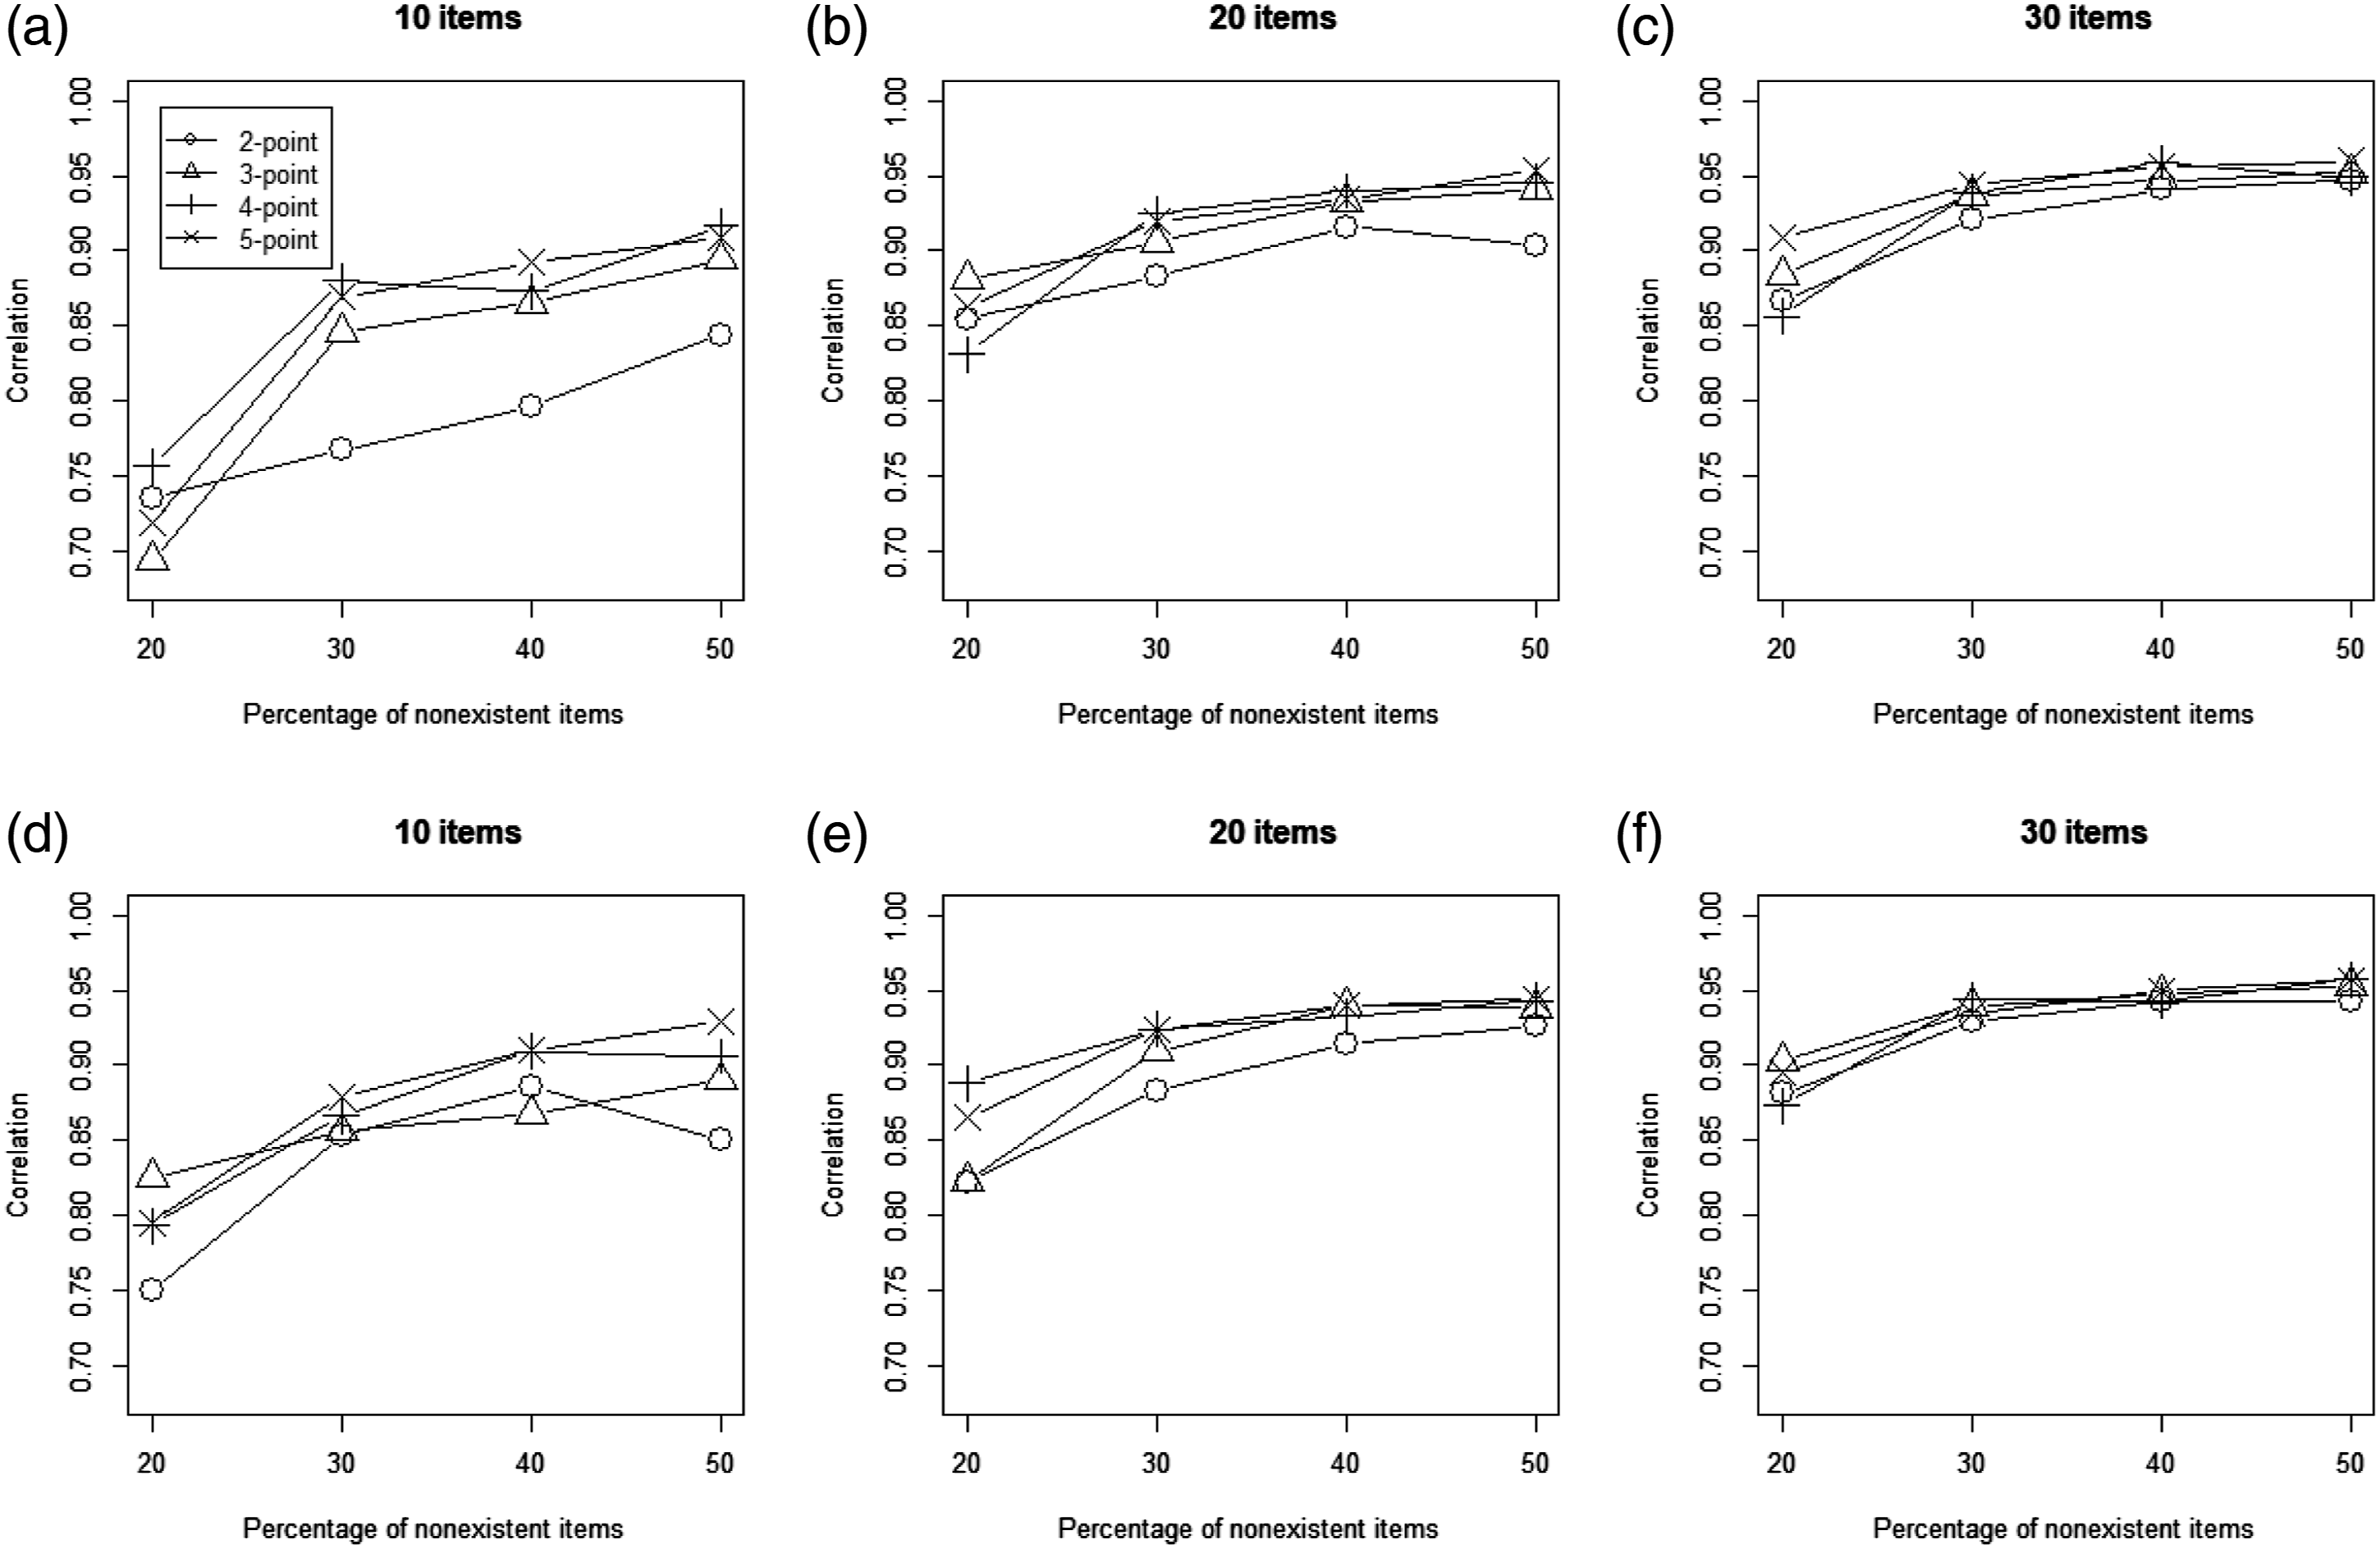
Results of the Three-way ANOVA on zθc′ and zξd′.

Note. R2 = .990 in first analysis and R2 = .985 in the second analysis.
PISA Data on Mathematical Concepts We were fortunate to have access to mathematical knowledge-claiming data from the Programme for International Student Assessment (PISA) questionnaire in 2012 (OECD, 2014), the most highly recognized cross-national study of student achievement. Students were asked to identify their familiarity with 16 mathematical concepts using a five-point scale, where 0 = never heard of it, 1 = heard of it once or twice, 2 = heard of it a few times, 3 = heard of it often, and 4 = know it well and understand the concept. Three specific yet nonexistent mathematical concepts (proper number, subjunctive scaling, and declarative fraction) were designed as foils. These same data proved useful in a recent study showing that accuracy and bias levels varied substantially across cultures (Fell et al., 2019). We selected the Hong Kong subsample of 2936 students. The mean scores for the 13 real concepts ranged from 2.3 to 4.7 (M = 3.6), while those for the three foils ranged from 1.8 to 2.4 (M = 2.0). Since the SDT has been applied to analyze this dataset (OECD, 2014), we further implemented the MMOC and examined the consistency of the two techniques in reporting the two indices of knowledge accuracy and knowledge bias. The correlation between the d′ and ξ estimates was .83, and that between the c′ and θ estimates was .95. In short, the two approaches tapped the same constructs. As noted earlier, reliabilities are not available for the SDT indices. Using the MMOC, however, we obtained EAP reliability
2
estimates of .73 and .84 for accuracy and bias, respectively. Table 2 shows the estimates of the slope (λi1 and λi2) parameters for each of the 16 items under the MMOC. Thus, the bias saturation ratio of Although no statistical tests are currently available, the guidelines are straightforward. Items with low saturation ratios (well below 1.0) are the best future candidates for reals; items with high saturation rates (well above 1.0) make the best future foils. These guidelines hold regardless of whether the items were originally categorized properly. Rather than relabeling vector and cosine as foils, for example, we recommend dropping these two items from future PISA item sets. In sum, the MMOC results should prove useful in adjusting the overclaiming datasets after the fact.
Item slope estimates of knowledge bias and knowledge accuracy in Example 1.

Note. * = intended foils. λi1 = item slope on dimension “knowledge bias”, λi2 = item slope on dimension “knowledge accuracy”.
Conclusion and Discussion
The overclaiming technique (OCT) was developed to assess individual differences in both the accuracy and exaggeration of knowledge (for a review, see Paulhus, 2011). Respondents indicate their level of familiarity with a set of items, some of which are real and some of which are foils. For each respondent, the endorsement rates of reals and foils are analyzed with formulas from SDT. Such formulas yield measures of individual differences in knowledge accuracy and knowledge bias. No item features are generated.
Comparison with the Williams–Zumbo Two-Stage Model
In an extension designed to address item features, Williams and Zumbo (2003) noted similarities between SDT and item response theory (IRT). They proposed a two-stage method and found it feasible to describe item functioning for knowledge accuracy, as calculated from overclaiming data. We also recognized the value of modeling item features for overclaiming data and proposed a new technique that exploits MIRT. Our proposed multidimensional model for overclaiming (MMOC) quantifies knowledge accuracy and knowledge bias as two independent latent traits.
Our model differs from the two-stage method in several ways. First, the latent trait variables in the two-stage method are the estimated factor scores of the factor analysis on pseudo items 3 , whereas the variables in the MMOC are estimated using raw items under the MIRT framework. Second, the item parameters of the two-stage method are obtained indirectly from a scatterplot showing the relationship between the factor score and a pseudo item. These parameters can be directly estimated using software (e.g., TAM). Third, the two-stage model adopted a nonparametric approach to describe item characteristics; by contrast, the MMOC is parametric (see Equations (3)–(6)).
Although both methods enable researchers to analyze overclaiming data in an IRT framework, the MIRT approach has distinct advantages over the two-stage approach. First, the MMOC yields separate scores for knowledge accuracy and bias, whereas the two-stage approach neglects the bias component. That neglect is unfortunate, considering that both accuracy and bias are essential factors in responding to OCQ items. In addition, fitting the MMOC is straightforward but offers a more in-depth analysis of psychometric properties. Third, the item parameter estimates obtained from the MMOC model can inform the winnowing or selection of real and foil items from a novel pool. For example, researchers can select more difficult items when a more capable group of respondents is to be evaluated.
Comparison with the SDT Approach
The results of the simulation study indicated that the corresponding person measures of SDT and the MMOC were highly intercorrelated, suggesting that these two approaches tap the same constructs. The key advantage of the MMOC is the provision of item and person features. From the item features, we derived a novel index labeled “bias saturation.” When applied to empirical studies (such as our two examples), the index provides a straightforward criterion for selecting the best reals (low saturation) and the best foils (high saturation) for follow-up studies.
The MMOC also elaborates on person features by providing measurement errors for the accuracy and bias indices. For example, the test reliabilities for these indices can be exploited to deattenuated correlation coefficients with outcome variables. In short, to achieve more accurate inferences, we recommend using MMOC person estimates to investigate associations with other variables (e.g., SDR scales and psychophysiological measurements) in future research.
One could argue that the arbitrary constraint of orthogonality between knowledge accuracy and knowledge bias in the MMOC is unrealistic. Holman and Glas (2005) provided an alternative constraint by fixing λi1 = 0 for some items and λi2 = 0 for others. In other words, the orthogonal constraint could be relaxed when at least one item purely measuring accuracy and another one purely measuring bias can be successfully identified; however, such items are impossible in the OCT context.
In principle, overclaiming data are no different from other rating-scale data. Because IRT has become the dominant psychometric approach for analyzing rating-scale data, other useful statistics are now available for practitioners to check the quality of measurement through IRT modeling. For example, item/person fit statistics that have been developed for categorical data in the IRT framework, such as S-X
2
(Orlando & Thissen, 2000; 2003) and
Limitations and Alternatives
To date, a number of studies have supported the use of OCT as a practical and cost-effective approach for detecting SDR in academic, cross-cultural, and organizational research (for a review, see Paulhus, 2011). Nonetheless, this method has not always proven successful in personnel selection (Ludeke & Makransky, 2016). It now appears clear that a necessary condition for successful application is the development of effective foils (see Dubois & Paulhus, 2020). In the most thorough investigation conducted to date, Dunlop et al. (2019) varied the content of the overclaiming items. They showed that the bias index only predicts faking if (a) the stakes are high, and (b) items match the nature of the job application. For example, applicants who tend to exaggerate their musical knowledge are unlikely to exaggerate their chemistry knowledge when applying for a pharmacy job.
Nonetheless, other interpretations of overclaiming indices have been offered. Instead of impression management, the bias index has been interpreted as an exaggerated feeling of knowing (Atir et al., 2015; Clariana et al., 2016); that is, high scores reflect a subjective sense that many stimuli are familiar. Most compelling is Study 3 from Atir and colleagues, where expertise was experimentally manipulated and higher familiarity ratings ensued. Closely related interpretations of overclaiming bias include a high openness to experience (Dunlop et al., 2017) and uncritical credulousness (Pennycook & Rand, 2018).
The current article opens up other possible avenues for overclaiming research. The broadest question concerns the degree to which accuracy and bias are trait-like qualities. Temporal stability remains untested. Level of education was found to have little effect on overclaiming tendencies (Clariana et al., 2016). Our second empirical example also showed a negligible difference in overclaiming bias between 14-year-olds and college undergraduates. More convincing would be a within-subjects design to determine whether the rank order of person qualities is stable. Cross-situational stability is also a key issue: Dunlop et al. (2020) began the task with person features, but the MMOC raises the question of stability in item features.
Some 20 years ago, the cross-topic consistency of accuracy and bias indices was demonstrated using the 10 topics of the OCQ-150 (see Paulhus et al., 2003); however, those topics were all academic in nature. 4 Investigation of more diverse content domains may conclude that a single pair of θ and ξ values is insufficient to capture an individual’s person features. The bias saturation of items will likely vary across content domains. Moreover, neglected in the current analysis are advances in rating-response styles (e.g., Bolt & Johnson, 2009; Jonas & Markon, 2019). Already, more general MIRT models have been developed to accommodate the OCT paradigm and various response styles (e.g., Chen & Jin, 2022). In addition, inattentive responding (e.g., Jin et al., 2018) can also be integrated into IRT analyses of overclaiming. Finally, other software packages warrant evaluation to compare their performances and efficiencies in conducting such analyses. Notwithstanding these issues, we believe that the MMOC offers a substantial advance in the analysis of overclaiming data.
Supplemental Material
Supplemental Material - A New Approach to Desirable Responding: Multidimensional Item Response Model of Overclaiming Data
Supplemental Material for A New Approach to Desirable Responding: Multidimensional Item Response Model of Overclaiming Data by Kuan-Yu Jin, Delroy L. Paulhus, and Ching-Lin Shih in Applied Psychological Measurement.
Footnotes
Acknowledgments
The authors would like to thank Dr Liu Li for granting permission to use the Chinese idiom data.
Author Note
Visiting Scholar, The Measurement, Evaluation, and Research Methodology (MERM) program University of British Columbia, Canada.
Declaration of Conflicting Interests
The author(s) declared no potential conflicts of interest with respect to the research, authorship, and/or publication of this article.
Funding
The author(s) disclosed receipt of the following financial support for the research, authorship, and/or publication of this article: This work was supported by Delroy L. Paulhus was supported by Social Sciences and Humanities Research Council of Canada (Grant 435–2015-0417). Ching-Lin Shih was supported by Ministry of Science and Technology of Taiwan (grant number MOST 108-2918-I-110 -005 and MOST 110–2410-H-110–044).
Supplemental Material
Supplemental material for this article is available online.
Notes
References
Supplementary Material
Please find the following supplemental material available below.
For Open Access articles published under a Creative Commons License, all supplemental material carries the same license as the article it is associated with.
For non-Open Access articles published, all supplemental material carries a non-exclusive license, and permission requests for re-use of supplemental material or any part of supplemental material shall be sent directly to the copyright owner as specified in the copyright notice associated with the article.