



Abstract
This article identifies a leader–follower relationship in stock recommendations and documents the characteristics of lead analysts. We develop a metric for identifying lead analysts based on the observation that lead analysts have directed a “path” for the consensus in the past year. We find that recommendations are more likely to direct a path for the consensus when they are issued by lead analysts, accompanied by concurrent earnings forecast in the same direction from the same analysts, away from the consensus, followed by price momentum, issued on large and high growth firms, and issued by analysts from large brokers with less frequent recommendations. This result still holds even after controlling for public information, excluding news announcement dates, Regulation Fair Disclosure legislation, and other robustness checks. Empirical analysis shows that there is a greater market reaction to the recommendations of lead analysts than others.
In this research, we look at the leading–herding behavior of equity analysts. There is an extensive literature on whether analysts herd and which analysts herd. However, there is sparse research on which analysts lead the herd in stock recommendations. This is surprising given the view that identifying lead analysts is important for investors in deciding which analysts to listen to, given that analysts’ stock recommendations have investment value. 1 In this article, we fill this gap by providing a method of identifying lead analysts in stock recommendations. We further examine which analysts are more likely to lead and whether lead analysts’ recommendations cause greater market reaction.
Research (Cooper, Day, & Lewis, 2001) has so far examined which analysts lead the herd in terms of earnings forecasts. However, given the differences between earnings forecasts and stock recommendations, it is important to identify lead analysts using stock recommendations. First, in addition to earnings, analysts need other information to generate stock recommendations. For example, analysts estimate the discount rate when using discount dividend models and benchmark price–earnings (PE) ratios when using price comparables. Second, some analysts use price patterns rather than earnings to generate stock recommendations. Lo and Hasanhodzic (2009) interview leading practitioners of technical analysis and reveal that some analysts make recommendations on patterns in the recent history of prices. Academic researchers (e.g., Altinkilic & Hansen, 2009; Jegadeesh, Kim, Krische, & Lee, 2004) also confirm that analysts often follow a momentum strategy. Third, some analysts make stock recommendations, but do not issue earnings forecasts, making it impossible to judge recommendations based on forecast ability. Loh and Stulz (2011) find that only half the analysts contemporaneously revise earnings when they issue stock recommendations. Jegadeesh and Kim (2010) find that even within the subsample of contemporaneous revisions, only half the cases involve earnings forecast revisions in the same direction as recommendation revisions. These differences in analyst behavior between forecasts and recommendations indicate that analysts may have different leading or following incentives for earnings forecast revisions than for price recommendation revisions.
This article provides a method for defining leadership using analyst stock recommendations. The dictionary of Merriam–Webster defines “lead” as “to direct on a course or in a direction.” To avoid confusion between recommendations and analysts, we use “path-directing” for recommendations and “lead” for analysts. Path-directing recommendations are those that the consensus moves to once they are issued. Lead analysts are those who made path-directing recommendations in the last year. Therefore, lead analysts are already identified at the beginning of the year.
In deriving the results, we use equity recommendations from Institutional Brokers’ Estimate System (I/B/E/S) between 1994 and 2006 and answer two questions. First, we determine whether, after controlling for public information, lead analysts are more likely to issue path-directing recommendations in the current year. We find that recommendations are more likely to be path-directing when they are issued by lead analysts, accompanied by concurrent earnings forecast in the same direction from the same analysts, away from the consensus, followed by price momentum, issued on large and high growth firms, and issued by analysts from large brokers with less frequent recommendations. This result still holds even after controlling for public information, excluding news announcement dates, Regulation Fair Disclosure (Reg FD), and other robustness checks. The second question is whether lead analysts’ recommendations generate a stronger market reaction than those of other analysts. We find that the initial market reaction is stronger for lead analysts than for peer analysts.
This method of defining path-directing recommendations and lead analysts differs from that in the literature, which mainly uses the leader–follower ratio (LFR) and bold measures. Cooper et al. (2001) first create LFR based on timeliness, that is, how quickly followers revise their own forecasts after lead analysts make their forecast. In detail, they take all annual earnings forecasts on a firm, calculate the cumulative days of forecasts made prior to and subsequent to a forecast separately, and use the ratio of days, the LFR, to define the timeliness of lead analysts. Loh and Mian (2006) and Ertimur, Sunder, and Sunder (2007) find that timely lead analysts, based on the LFR of their forecasts, issue more profitable recommendations. Jegadeesh and Kim (2010) and Loh and Stulz (2011) redo the LFR analysis using recommendation data and find that the market reacts more strongly to LFR-based lead analyst recommendations than those from other analysts.
Our lead analyst definition differs from that using the LFR in several ways. First, the LFR is designed to demonstrate how quickly other analysts respond to a given forecast, without revealing whether they move closer to the forecast or not. Our results show that the LFR does not increase the likelihood of issuing path-directing recommendations. Second, our lead analyst measure has explanatory power over and above the LFR-based lead analysts. After controlling for LFR, the market reaction is still stronger for lead analysts than others. Third, there are limitations in applying the LFR when using recommendation data. Unlike earnings forecasts, whose deadline is a fiscal-year (quarter) end so that timeliness relevant to a deadline is clearly measured, analysts frequently update their stock recommendations without a clear “deadline.” Thus, discretionary assumptions on a deadline have to be made to compare their timeliness. Jegadeesh and Kim recognize this when they say, “It is hard to define a measure of recommendation success as precisely as in the case of earnings forecasts” (p. 903). In contrast, our path-directing measure has the advantage of avoiding the discretionary assumptions about deadlines by directly observing the change in the consensus recommendation.
Our lead analyst measure also differs from the bold measure developed by Gleason and Lee (2003). Forecasts that are between the consensus and the analyst’s own prior forecasts are defined as herding, and forecasts that are greater or less than both are bold. Thus, the bold measure is a response to the prior consensus and the analyst’s own prior forecast. However, our study is not about the reaction to the past consensus, but rather about whether a recommendation directs the consequent consensus. The empirical results show that the correlation between our path-directing measure and the bold measure is very low, and lead analysts are more likely to issue path-directing recommendations even after we control for boldness.
This study contributes to the literature in several ways. First, the new methodology for defining path-directing recommendations and lead analysts adds new insight into identifying lead analysts. The existing literature that focuses on timeliness or boldness does not make it possible to understand which analysts lead the herd in stock recommendations. A key distinguishing feature of our methodology is that we focus on each analyst’s influence on the consensus; therefore, it directly catches how lead analysts direct the path for other analysts. Second, our results complement the herding literature. While the literature studies which analysts herd, this article has a different perspective: to discover which analysts lead the herd. Furthermore, our results help explain how analysts use accounting information for their stock recommendations. We find that recommendations accompanied by concurrent earnings forecasts issued by the same analyst in the same direction are more likely to be path-directing. More specifically, upgrade recommendations accompanied by upward earnings forecast revisions and downgrade recommendations accompanied by downward forecast revisions are more likely to be path-directing. Finally, we extend the growing literature on the market reaction to stock recommendations. The results show that the stock market return is stronger for lead analysts than for others, indicating their greater influence on investors.
Our main conclusions are that lead analysts, who issued a higher percentage of path-directing recommendations in the past year, are more likely to issue path-directing recommendations in the current year. In other words, there exists consistency in the influence of lead analysts on the direction of the future consensus. A question arises: What causes this consistency? 2 Cooper et al. (2001) argue that consistency may come from “innate ability, industry-specific human capital, or an underwriting relation between a company and the brokerage firm’s investment banking group” (p. 384). Our findings rule out innate ability, as both past timeliness and profitability are statistically insignificant. An influential paper by Brown, Call, Clement, and Sharp (2013) surveys 365 sell-side analysts and reports on 18 detailed follow-up interviews covering a wide range of topics. Their key findings are as follows: (a) analysts frequently communicate directly with management, and their private phone conversations with management are especially valuable to them; (b) generating underwriting business or trading commissions is important for their compensation; (c) broker votes are very important for their career advancement, much more important than the Institutional Investor’s All-Star status; and (d) their industry knowledge is very important for their compensation, as an input to their earnings forecasts, and as an input to their stock recommendations. Therefore, access to management, relationship with brokers and clients, and industry knowledge are possibly the reasons for selected analysts to lead. Exploring these reasons is an interesting topic for future research.
The remainder of this article is organized as follows. The section titled “Related Literature” reviews the literature. The section titled “Measure of Path-Directing Recommendations and Lead Analysts” describes the measure of identifying leadership. The section titled “Sample Selection and Summary Statistics” describes the sample selection criteria, variable constructions, and the sample. The section titled “Which Analysts Issue Path-Directing Recommendations” reports the empirical work on our first research question and the robustness checks. The section titled “The Market Reaction” reports the empirical work of the market reaction to lead analysts. The section titled “Conclusion” concludes the article.
Related Literature
This article is primarily related to the literature on the herding behavior of analysts. “Herding” refers broadly to the observation of similar actions taken by multiple agents in close time windows (see Jegadeesh & Kim, 2010). Empirical research has tackled it from two aspects: “Which analysts herd?” and “Which analysts lead the herd?” mainly by using earnings forecast data. The literature defines forecasts that are between the consensus and the analyst’ own prior forecasts as herding, and forecasts that are greater or less than both of them as bold. Several patterns have been identified. Chevalier and Ellison (1999) and Hong, Kubik, and Solomon (2000) find that less experienced analysts are more likely to herd; consistent with career concern theories and a lack of conviction in their beliefs. However, Zitzewitz (2001) shows that when controlling for information effects, less experienced analysts actually exaggerate their differences from the consensus. Clement and Tse (2006) find that the likelihood of boldness increases with the analyst’s prior accuracy, brokerage size, and experience, which is consistent with theories linking boldness with career concerns and ability. Finally, the market reaction is stronger for bold forecasts than for herding forecasts (see Clement & Tse, 2006; Gleason & Lee, 2003). Studies on which analysts lead the herd in earnings forecasts are more limited. Cooper et al. (2001) identify lead forecasts mainly by timeliness. They find that only highly informative forecast surprises by timely lead analysts generate higher market reactions than those of followers.
Despite the extensive literature on earnings forecasts, empirical papers on the leader–follower relationship in terms of stock recommendations are limited. Welch (2000) finds that analysts are more likely to revise their recommendations toward the market consensus, rather than away from it. However, as he notes, “Lacking access to the underlying information flow, we cannot discern if the influence of recent revisions is either a similar response by multiple analysts to the same underlying information or is caused by direct mutual imitation” (p. 393). Jegadeesh and Kim (2010) find that price reactions following recommendation revisions are stronger when the new recommendation is away from the consensus than when the revision is closer to it, indicating that the market recognizes the tendency of analysts to herd. Jegadeesh and Kim (2010) and Loh and Stulz (2011) find that recommendations issued by timely lead analysts are more likely to have an influential market reaction. None of these studies examine which analysts lead the herd.
In sum, the literature has identified some leader–follower patterns among analysts. For instance, some analysts move toward the consensus, whereas others move away from it. The information in this behavior is recognized by investors and, as a result, the market reaction is stronger for bold forecasts and recommendations than for follower or herd behavior. However, the following questions still remain: Which analysts issue path-directing recommendations? Are lead analysts’ recommendations associated with stronger market reaction?
Measure of Path-Directing Recommendations and Lead Analysts
The dictionary of Merriam–Webster defines “lead” as “to direct on a course or in a direction.” To avoid any confusion between analysts and recommendations, we use “path-directing” for recommendations and “lead” for analysts. Path-directing recommendations are those that the consensus moves to once they are issued. A related classification is herding and bold recommendations. The literature defines forecasts that are between the consensus and the analyst’s own prior analysts as herding, and forecasts that are greater or less than both of them as bold. The fundamental difference between path-directing and bold definitions is that the former directs the subsequent consensus, but the latter is only defined with respect to the current consensus and makes no suggestions as to whether or not the consensus subsequently moves toward the bold recommendation. One can think, for example, of an analyst who consistently stands out with bold recommendations, but who is ignored. Such “maverick” analysts do not influence other analysts or direct the consensus. In this sense, a bold recommendation is not necessarily path-directing, as the consensus may move either toward it or further away from it.
Another related definition is the first mover recommendation, which is also not necessarily path-directing, as again after it is made it might be ignored in that the consensus may move toward or away from it. What this article is concerned with is neither the “quick” nor the “bold” analyst, but the analyst who is judged by his or her peers to be a leader and as a result directs the consensus for other analysts. This is what is defined as a path-directing analyst.
Before defining the path-directing measure, it is necessary to review how I/B/E/S, the source used for analyst recommendations, describes a recommendation. The recommendation levels are 1 for strong buy, 2 for buy, 3 for hold, 4 for sell, and 5 for strong sell. I/B/E/S also provides the recommendation dates (RECDATS) and the review dates (REVDATS). The review date is the most recent date on which I/B/E/S called the analyst and verified that a particular recommendation was still valid. If an analyst confirms that a previous recommendation is still valid, the original database record for that recommendation is retained and only the review date variable is updated. If an analyst changes his or her recommendation, a new record is entered in the database with a new date. The previous recommendation and the new revision are treated as two recommendations and both are evaluated on whether they are path-directing.
The deviation from the consensus is the mean of the absolute value of the difference between a recommendation in question and all other recommendations on the same firm on the same day. It is modeled as follows:

where i measures the analyst, j measures the firm in question, k measures all other analysts except i, REC measures the level of recommendations, n measures the number of analysts other than analyst i covering firm j at that time, and t measures the date. 3
A recommendation is path-directing if the consensus converges to it. In other words, after a path-directing recommendation is issued, the deviation from the consensus has to drop to an acceptable limit. To measure the change in deviation, we compare the deviation on two dates: the recommendation date and the end date. The end date is the earlier of the review date and 365 days after the recommendation date. We only count valid recommendations on the two dates. For example, an analyst issues her first recommendation before a recommendation in question is issued, but makes a revision before its end date. We count her first recommendation in the consensus on the recommendation date and then her revised recommendation in the consensus on the end date. For another example, during the period between the recommendation date and the end date of a recommendation in question, an analyst issues a recommendation and then stops it. This recommendation is not counted in the calculation of the consensus on either date.
Path-directing recommendations are defined as below:

The first condition requires the deviation from the consensus measure to drop from the recommendation date to the end date, ensuring that other recommendations move toward it. The second condition focuses on the strength of the leadership, requiring other recommendations to be less than or equal to one level from the path-directing recommendation. It must be noted that this definition allows more than one recommendation to be defined as path-directing. Indeed, the quick recommendation that meets these two requirements can also be path-directing. The reason is that analysts with these quick recommendations must have good expertise or information as well and are making decisions for others to follow. In the robustness checks, we differentiate between first mover and quick followers.
The algorithm is illustrated by the data in Figure 1. A stock is covered by multiple analysts. All outstanding recommendations cluster around strong buy and buy (I/B/E/S records 1 and 2). A new recommendation of strong sell (I/B/E/S records 5) is issued. Note that this new recommendation is fixed at 5 from its recommendation date to the end date before it is revised. This is a bold recommendation, but the question is, Will anyone else follow this recommendation? In this case, as time goes on, other recommendations move toward this recommendation. At the end date, the difference between this recommendation and all others is smaller than on the recommendation date, and is smaller than 1. On this basis, we define this recommendation of a strong sell as a path-directing recommendation. If, however, the difference between this recommendation and the others had increased it would not be so defined, even though it remained a bold recommendation.
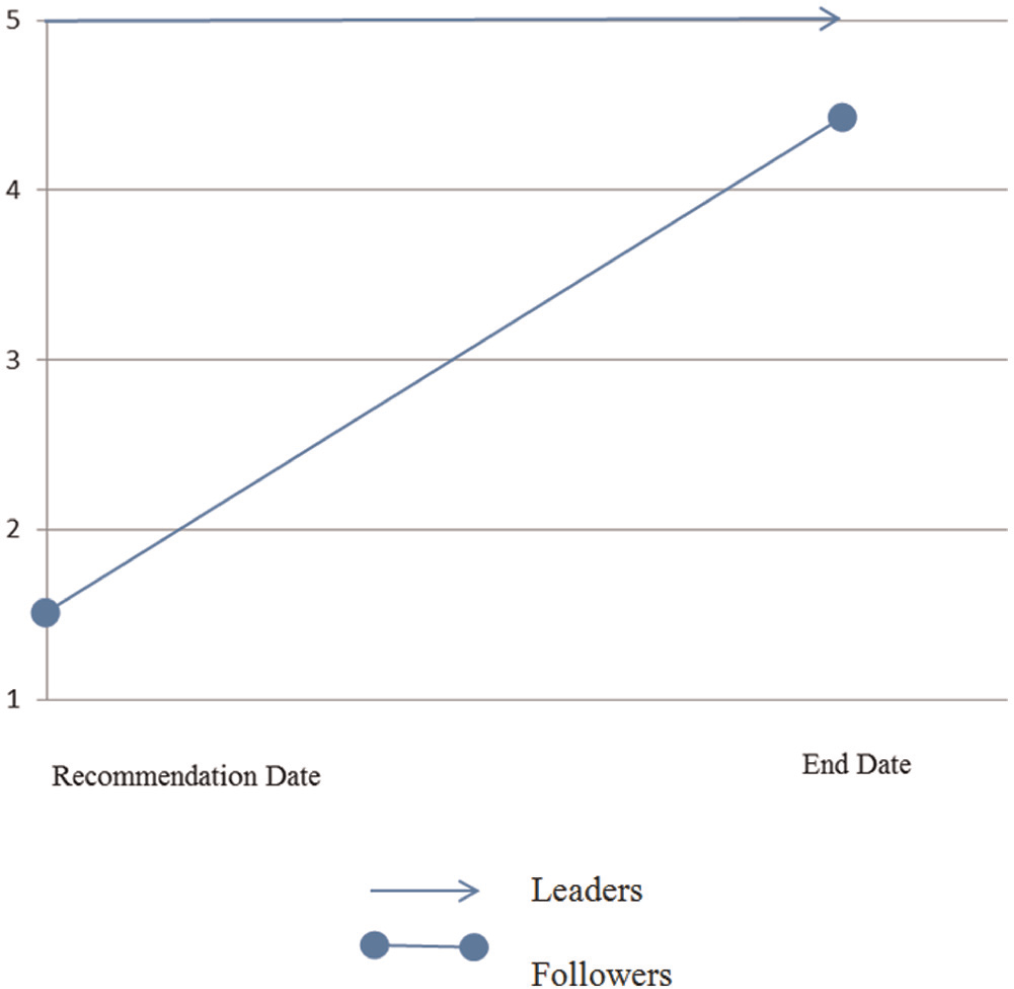
A hypothetical example to define path-directing recommendations.
We next develop a measure of analyst leadership. The past year’s analyst leadership measure Leadi,t−1 is the average of path-directingi,j,rec recommendations across all stocks covered by the analyst issued in year t−1. Stated differently, it is the percentage of path-directing recommendations, as path-directing is a dummy of either 1 or 0. Therefore, Leadi,t−1 is a known variable at the beginning of year t. This definition has the benefit of tracking all recommendations that an analyst issues in a year, revealing a record of personal path-directing performance. In the robustness check, we use an alternative industry-specific lead analyst measure. We do not use a firm-specific leadership measure, as Brown and Mohammad (2007) find that analyst ability has a general aspect incremental to its firm-specific aspect.
Sample Selection and Summary Statistics
We collect information on analyst recommendations—company identifications, analyst and broker codes, recommendation dates and levels, and recommendation review dates—from the I/B/E/S Detailed History file from January 1994 to December 2006. We collect individual stock returns and market returns from the daily Center for Research in Security Prices (CRSP) database and book equity data from the CRSP/Compustat merged database. To identify path-directing recommendations and lead analysts, we require the following criteria:
The stock return data of firms covered in our analysis should be available on the CRSP.
Firms with annual coverage of less than two analysts are excluded, as the leader–follower relationship can only occur when there are multiple analysts.
Recommendations on the dates when the rating system changed due to the “Global Settlement” are excluded. 4
Analysts must be identifiable in I/B/E/S. Some analysts do not want to give their identifications, so I/B/E/S assigns 0 to the analyst identification code (AMASKCD).
Analysts must have at least 2 years’ experience, considering that we define lead analysts by the prior year’s path-directing practice.
In the empirical analysis, we focus on recommendation revisions (upgrades and downgrades) because revisions are salient for investors. Previous research found that revisions have significant information content, but reiterations do not (see Womack, 1996). In unreported tests, we find that the market reaction to reiterations is not statistically different from 0. Applying the above criteria leaves 103,136 recommendations as seen in Tables 1 and 2.
Summary Statistics.
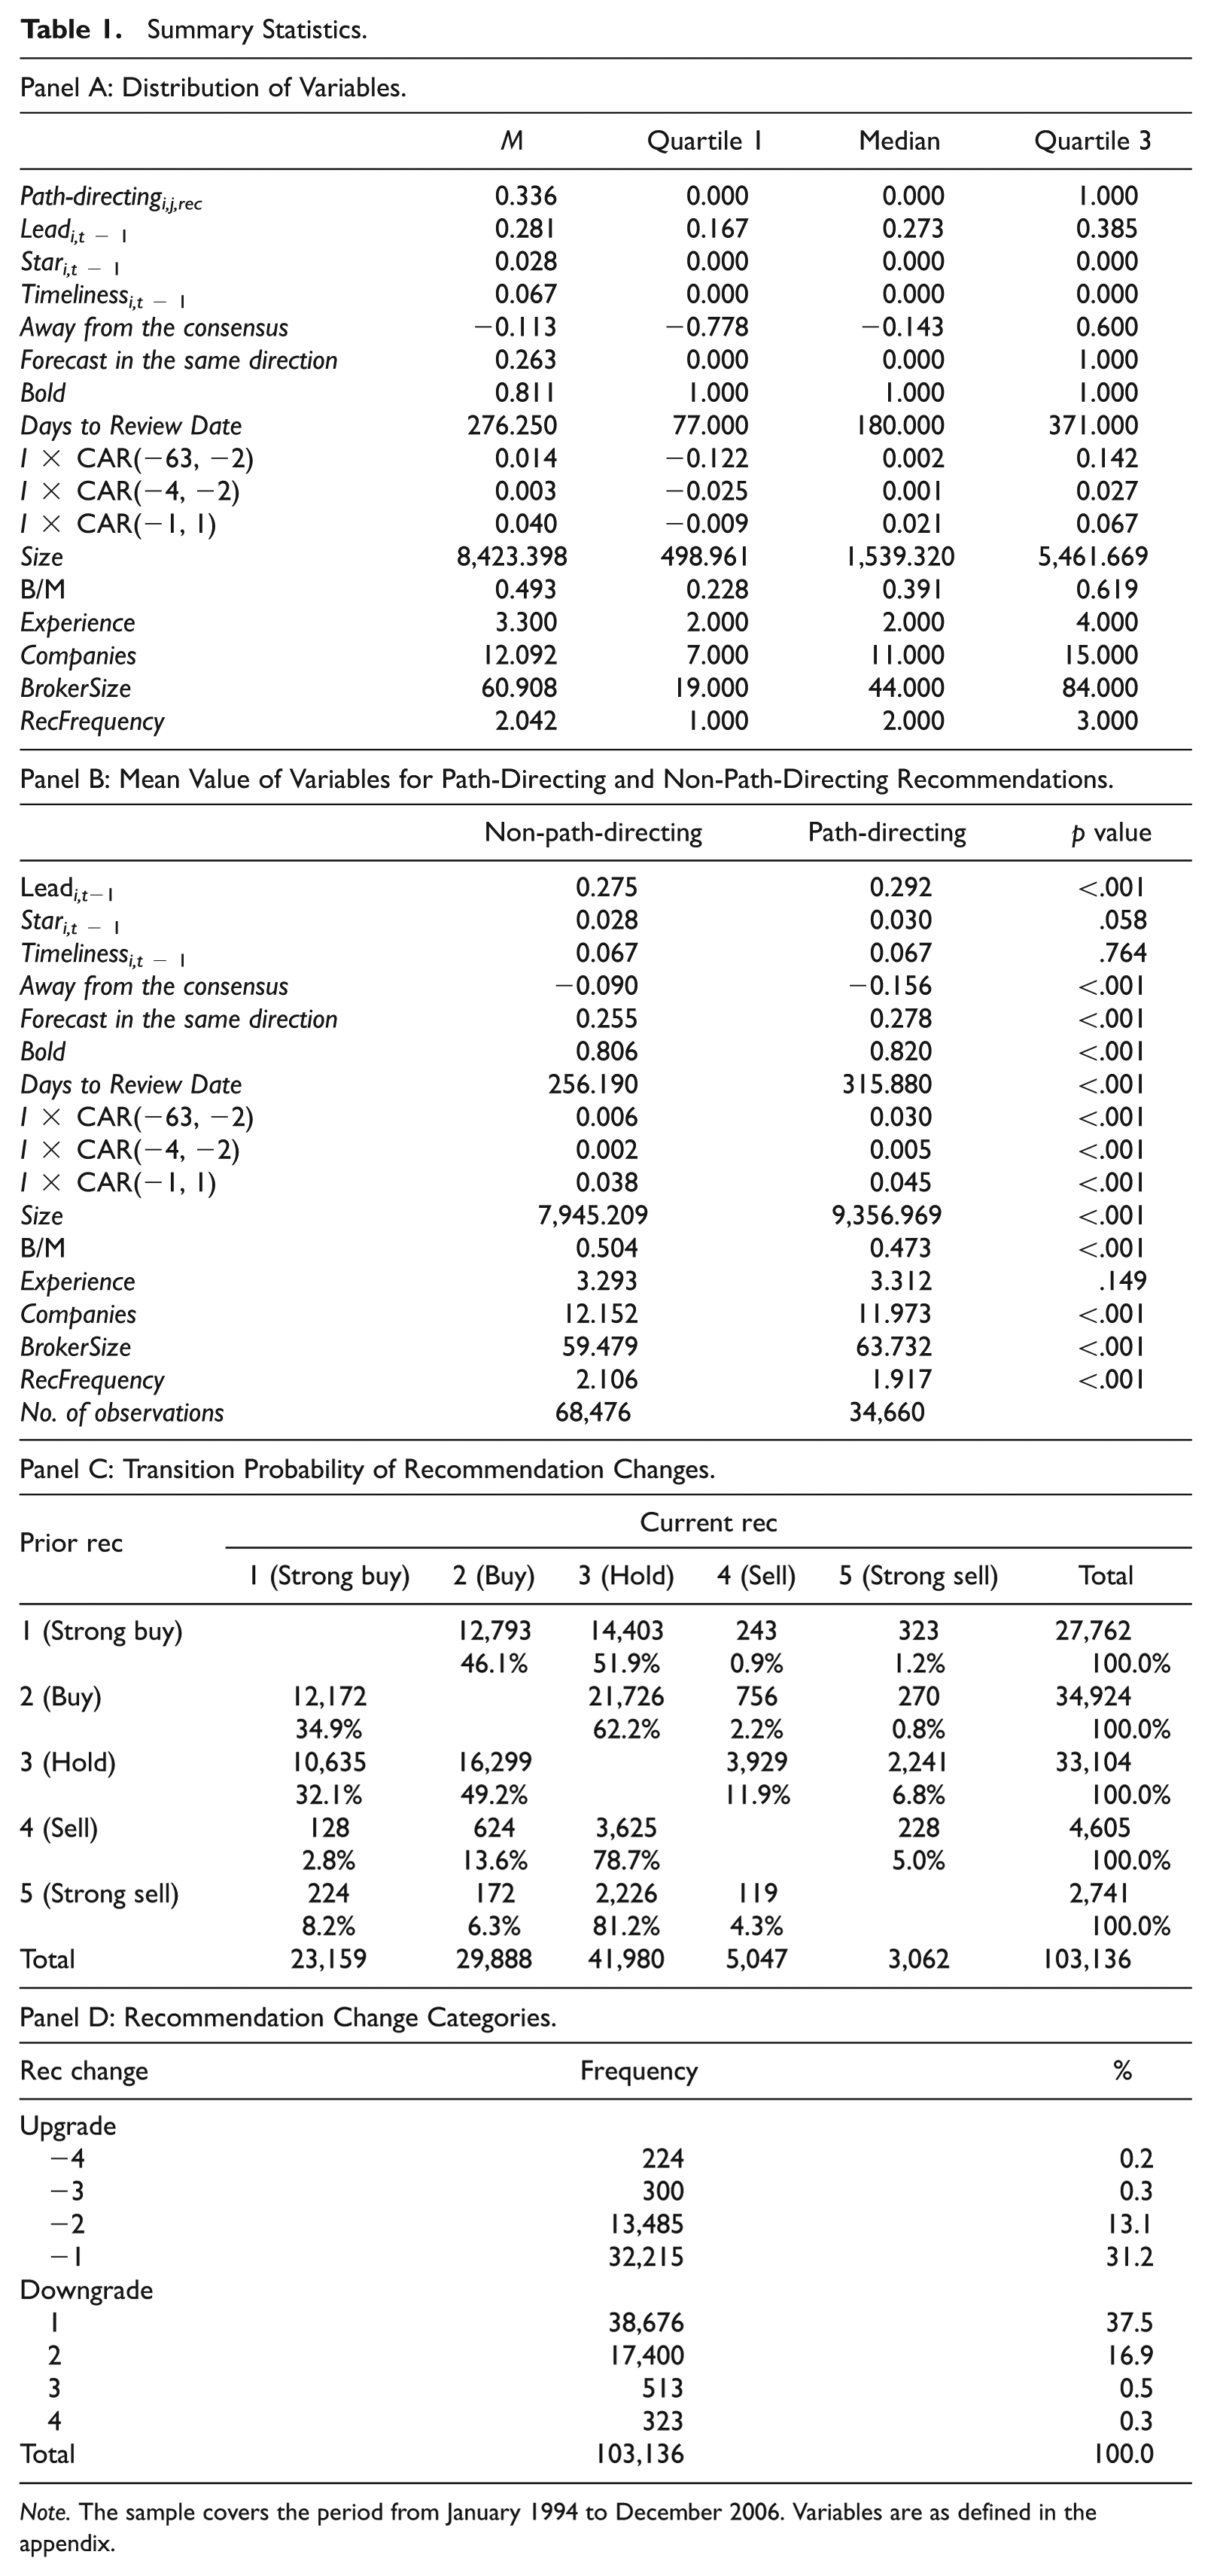
Note. The sample covers the period from January 1994 to December 2006. Variables are as defined in the appendix.
Quintile Analysis of Leadership Measure and Market Reaction.

Note. The sample covers the period from January 1994 to December 2006. The final sample is split into quintiles according to Leadi,t−1, the past lead analyst measure. Quintile 1 represents the lowest past lead analyst measure, and Quintile 5 represents the highest past lead analyst measure. Variables are as defined in the appendix. p values of t statistics are reported.
We include the lead analyst measure and control for recommendations, firms, and analyst characteristics that might affect their behavior. The variable of interest is the lead analyst measure and we investigate whether they are more likely to issue path-directing recommendations. We also report two alternative lead analyst measures: the top one All-America stars and the timely lead analysts. Institutional Investor magazine annually collects votes from fund managers and ranks the highest-voted analysts as All-America stars in the October issue. The literature documents that All-America stars have better reputations, issue more accurate forecasts, are less likely to herd, and generate higher market reactions to their recommendations than do non-stars (Stickel, 1992, 1995). To test our leadership model, we define Stari,t−1, as the prior year’s All-America star status. This measure is 1 if the analyst is the top one analyst in any of the categories of the All-America star rankings and 0 otherwise. The correlation between Leadi,t−1 and Stari,t−1 is only .03, alleviating any concerns that lead analysts may simply be “stars.” 5 Timelinessi,t−1 is a dummy variable with 1 for timely lead analysts in the past year and 0 otherwise. Timely lead analysts are those with a LFR in recommendations above the top 10 percentile of their F distribution, while the ratios are calculated from two recommendations issued by different analysts before the revision and two after the revision. The correlation between Leadi,t−1 and Timelinessi,t−1 is only .02, also alleviating the concern that lead analysts may be simply timely leaders.
Recommendation-level variables include the following: Forecasts in the same direction are a dummy variable that equals 1 if the same analyst issues any types of earnings forecasts within 3 trading days before and after a recommendation, and the change of earnings forecasts is in the same direction as the change of recommendation, and 0 otherwise. More specifically, it is 1 if upgrade recommendations are accompanied by upward earnings revisions and downward recommendations are accompanied by downward earnings revisions. In the literature on how analysts use earnings forecasts in generating stock recommendations, Kecskes, Michaely, and Womack (2013) find that the market reaction is stronger for recommendations accompanied by forecasts in the same direction. 6 Thus, this variable is expected to increase the likelihood of path-directing recommendations.
The bold dummy variable equals 1 if a new recommendation level is either greater than both the consensus and the analyst’s own last recommendation or less than both of them, as defined by Gleason and Lee (2003). The consensus is the average of all other recommendations. A bold recommendation is likely to catch the eyes of peer investors and may cause them to follow. Thus, we include a bold dummy.
Consistent with the existing literature, we measure public information by pre-recommendation return I × CAR(−63, −2), where CAR(−63, −2) is the market-adjusted buy-and-hold returns from 63 trading days until 2 trading days before the recommendation, and I equals 1 for upgrades and −1 for downgrades. For instance, Ryan and Taffler (2004) find that 65% of price changes can be accounted for by the release of public information. Prior research has also found that analysts react to stock returns. 7 For example, Jegadeesh et al. (2004) show that analysts seem to follow a momentum strategy, which is to upgrade recommendations after price runs up and downgrade them after price drops. They use market-adjusted returns before recommendations to proxy momentum.
Away from the consensus is the consensus minus the recommendation level. Jegadeesh and Kim (2010) find that the market reaction to away-from-the-consensus recommendations is higher than others. Days to review date is the number of calendar days from the recommendation date to review date.
Firm-level variables include size and book-to-market ratio (B/M) of the last calendar year. Size is measured as the market capitalization in millions of dollars. 8 Large firms are usually followed by more analysts. As herding is the observation of similar actions taken by multiple agents in close time windows, observing leading–following behavior should be more likely when more analysts are covering the same firm. B/M is book equity divided by market capitalization. Book equity is shareholders’ equity plus deferred taxes plus investment tax credit minus preferred stock as in Daniel and Titman (1997). We only include book-to-market for firms with positive shareholder’s equity and non-negative book equity. Firm value is the sum of value in place and the growth opportunity, between which the growth opportunity is more uncertain and more difficult to estimate. A low book-to-market firm has more growth opportunities and poses a greater challenge for analyst recommendations. Therefore, leading is more likely to happen on low book-to-market firms than high book-to-market firms.
Analyst-level variables such as Experience, Companies, BrokerSize, and RecFrequency have been previously found by Clement and Tse (2006) to affect analyst behavior. Experience is the number of years that an analyst covers a firm in the I/B/E/S Recommendation file. Companies are the number of companies that an analyst covers. BrokerSize is the number of analysts that a brokerage employs. RecFrequency is the number of recommendations that an analyst issues on a given stock in a given year.
Table 1 provides descriptive statistics. Variables are defined in the appendix. In Panel A, around a third of the recommendations in the current year are defined as path-directing. The mean lead analyst variable is 28.1%. Star analysts issue 2.8% of the recommendations. Timely lead analysts issue 6.7% of the recommendations. Concurrent earnings forecasts accompany 55.2% of recommendations, but only half of them are in the same direction as the recommendations. Therefore, 26.3% of all recommendations in the sample are accompanied by forecasts in the same direction. Bold recommendations make up 81.1%, consistent with the percentage of bold forecasts in Gleason and Lee (2003). The correlation between boldness and path-directing is only .02, alleviating the concern that all path-directing recommendations are bold. Away-from-the-consensus measure averages −0.113. Days to review dates average at 276 calendar days. Average size is US$8,423 million and average B/M is 0.493. On average, a brokerage employs 61 analysts, and an analyst has 3.30 years’ experience on a firm, covers 12 firms, and issues 2.04 recommendations on a firm in a year. The distribution of the variables is similar to those in the literature.
Panel B compares the means of variables between path-directing and non-path-directing recommendations. The difference in the means is tested by t statistics and p values are reported. Several patterns are observed. First, lead analysts are higher for path-directing recommendations, providing preliminary evidence that lead analysts are more likely to issue path-directing recommendations. Star status is also higher for path-directing recommendations, but the timely lead analyst measure is not significantly different across the two groups. Second, recommendations that have later review dates are accompanied by earnings forecasts in the same direction, experience a larger price momentum, and are bold are more likely to be path-directing. Third, path-directing is more likely to happen with recommendations on large or growth firms. Finally, analysts who cover fewer companies, come from larger brokerage firms, and change recommendations less frequently are more likely to issue path-directing recommendations. However, the analyst experience measure is similar for path-directing and non-path-directing recommendations.
Panel C provides the transition probability for recommendation changes. Recommendations are predominantly optimistic with 93% in the favorable category of strong buy, buy, and hold. Non-hold recommendations tend to be revised to hold. The portion of recommendations moving to hold from strong buy, buy, sell, and strong sell are 51.9%, 62.2%, 78.7%, and 81.2% individually. Hold recommendations are likely to be upgraded to strong buy (32.1%) and buy (49.2%).
Panel D reports the frequency of recommendation changes. The largest group is one-level downgrades (rec change = 1), which dominate 37.5% of the sample. It is closely followed by one-level upgrades (rec change = −1) with 31.2% of the sample. Two-level recommendation downgrades make up 16.9% of the sample and two-level upgrades make up 13.1%. More extreme recommendation changes are very rare.
We then investigate whether lead analyst status, identified with recommendations issued in the previous year, affects the likelihood of issuing path-directing recommendations and the market reaction to their recommendations issued in the current year. The sample is split into quintiles according to Leadi,t−1, past lead analyst. Quintile 1 contains analysts with the lowest past lead analyst measure and Quintile 5 represents the highest past lead analyst measure. The variable of interest is the current year’s leadership, Lead i,t , which is defined as the average percentage of path-directing recommendations issued by a given analyst in the current year. Panel A of Table 2 reports the average of this variable within each quintile. It shows a monotonic increase from 0.247 to 0.337 from Quintile 1 to Quintile 5, which is a 36% increase ([0.337 − 0.247] / 0.247). In summary, this panel shows that current leadership monotonically increases with each quintile, indicating the persistence of leadership. Stated differently, lead analysts based on past practice are more likely to lead again in the current year.
We split the sample into upgrades and downgrades. Panel B of Table 2 demonstrates that the current year’s market reaction increases with the quintiles sorted by lead analyst ranking. Among all upgrades, CAR(−1, 1) increases from 2.4% to 3.5% from Quintile 1 of the lowest leadership to Quintile 5 of the highest leadership. The market reaction to downgrades is more dramatic, as it decreases from −3.3% to −5.7%. The results indicate that the market reacts much more strongly to lead analyst recommendations.
Which Analysts Issue Path-Directing Recommendations?
Empirical Results
Our first test is to examine whether, after controlling for public information, lead analysts are more likely to issue path-directing recommendations in the current year. Lead analysts are those who have issued path-directing recommendations during the past year. Other analysts are likely to follow a lead analyst’s recommendations if the lead analyst has access to managers of the firms covered, has a better relationship with brokers and clients, and has industry knowledge. A lead analyst builds this reputation over time, so it is unlikely to suddenly disappear. Consequently, one would expect leadership persistence over time.
However, although we document that other analysts do follow some lead analysts, an alternative explanation to herding observation may be that both types of analysts act in response to public information releases, as all analysts tend to revise their recommendations in a short time window after the release of public information. As a result, “quick” analysts may appear to be lead analysts even though most analysts react in the same way to the same release of public information. We control for the release of public information, that is, firm news. We measure it by pre-recommendation market-adjusted returns. To be more specific, we investigate whether lead analysts are more likely to issue path-directing recommendations than other analysts after controlling for pre-recommendation returns.
We investigate this question with the following logistic model:
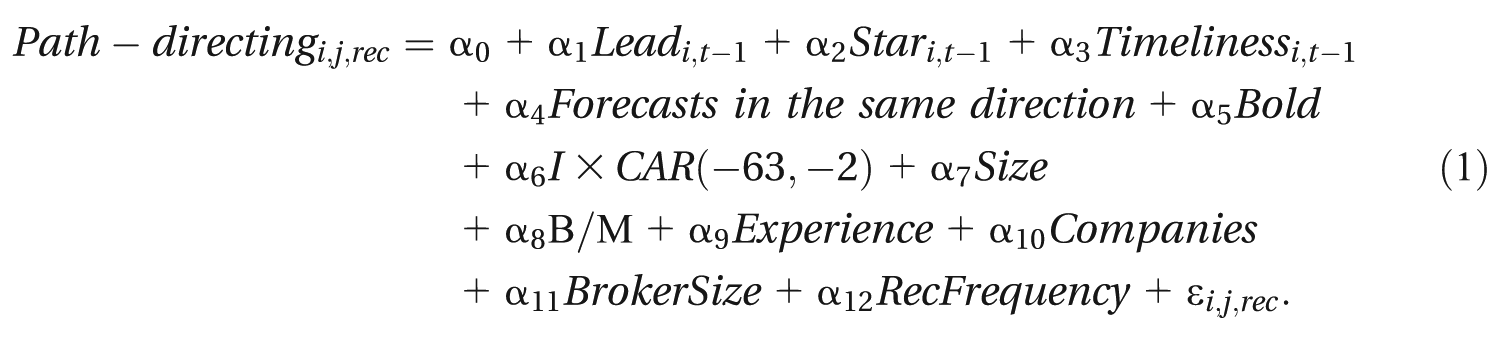
Further including non-negative B/M leaves 90,091 observations in regressions. As suggested by Petersen (2009), the standard errors are adjusted for clustering within the same stock, the same year, and the same analyst to account for correlation of the error terms. Column 1 of Table 3 presents the results of Model 1. The coefficient estimate on lead analyst is positive and statistically significant at the 1 percent level. As I × CAR(−63, 2) is already included in the regression, the results suggest the persistence of leadership, even after controlling for momentum. Also, the parameter estimate of a past year All-America star is statistically insignificant, after controlling for lead analysts, public information, and other variables. Peer analysts do not follow stars’ recommendations despite their high voter ranking, suggesting that actions speak louder than words. Timeliness is statistically insignificant, indicating that analysts who cause quick actions by other analysts are not necessarily directing a path for them.
Logistic Regressions of Which Analysts Issue Path-Directing Recommendations.
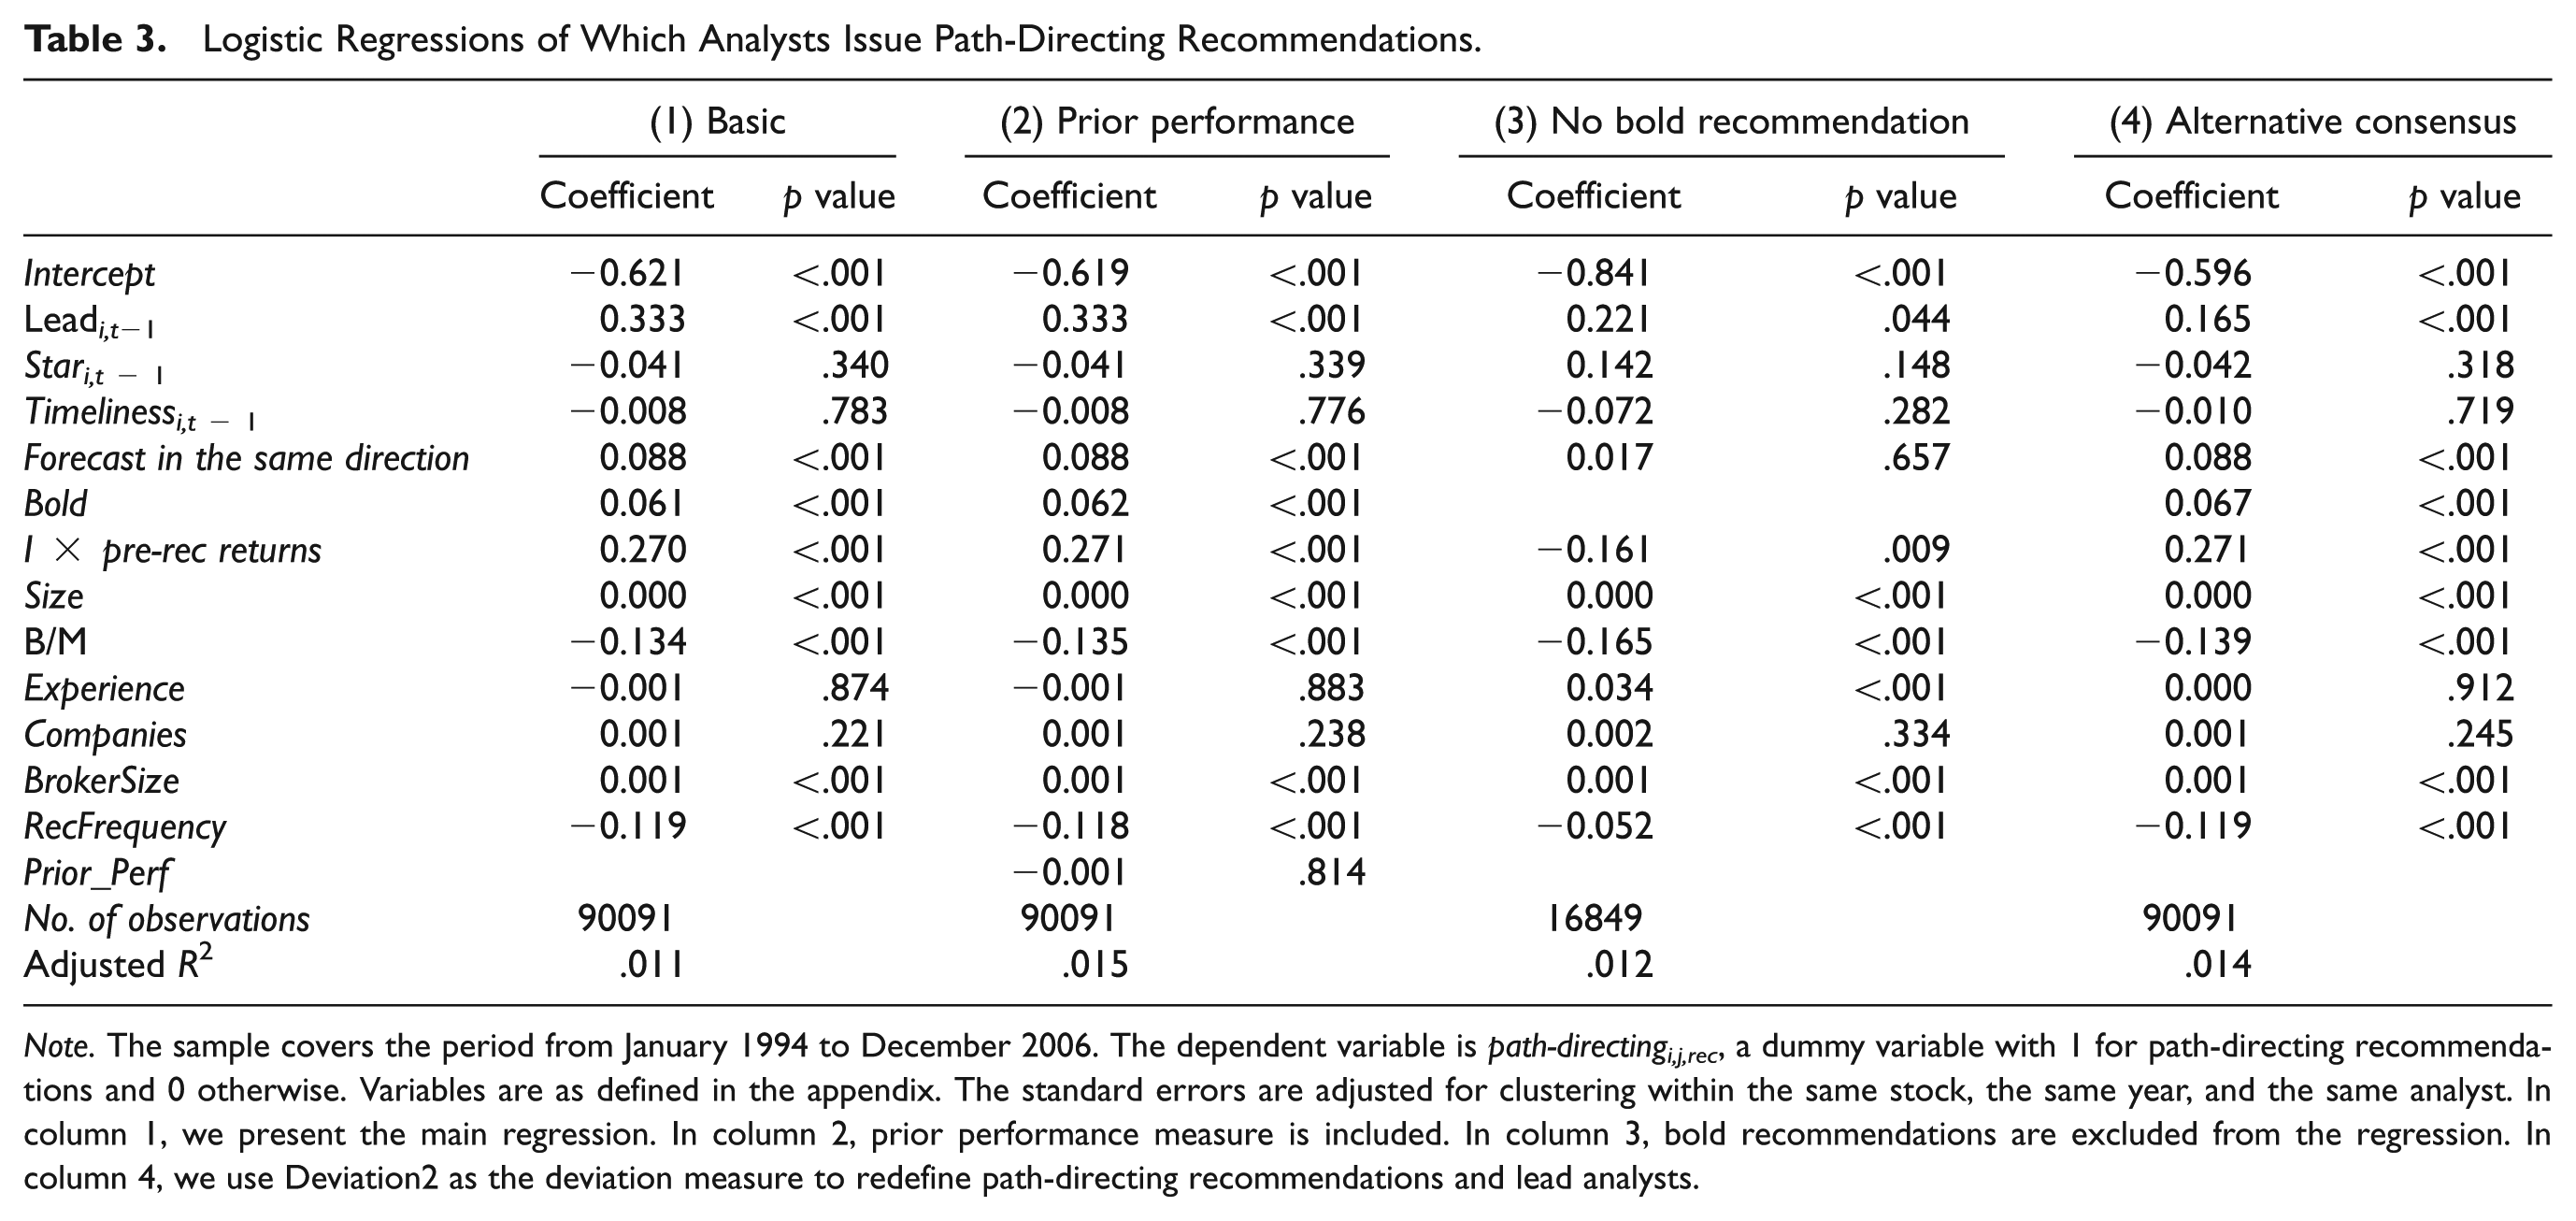
Note. The sample covers the period from January 1994 to December 2006. The dependent variable is path-directingi,j,rec, a dummy variable with 1 for path-directing recommendations and 0 otherwise. Variables are as defined in the appendix. The standard errors are adjusted for clustering within the same stock, the same year, and the same analyst. In column 1, we present the main regression. In column 2, prior performance measure is included. In column 3, bold recommendations are excluded from the regression. In column 4, we use Deviation2 as the deviation measure to redefine path-directing recommendations and lead analysts.
Table 3 also shows the coefficients on the other variables. The coefficient estimate on forecasts in the same direction is positive and statistically significant, suggesting that peer analysts use information of earnings forecasts in judging which recommendations to follow. The coefficient estimate on bold is statistically significant, suggesting that being bold helps attract peer analysts. But lead analysts remain statistically significant after controlling for boldness, indicating that lead analysts have explanatory power over and above the boldness measure. The coefficient estimate on the pre-recommendation returns is positive and significantly different from 0, suggesting that many analysts issue similar recommendations following a price momentum. The likelihood of observing path-directing recommendations is higher with larger firms, growth firms, less recommendation frequency, and if issued by analysts from larger brokerages. Overall, the results provide strong support for the persistence of lead analysts.
Discussion
Analysts’ prior performance
Mikhail, Walther, and Willis (2004; thereafter MWW) find persistence in analysts’ profitability, that is, analysts whose recommendation revisions earned the most (least) excess returns in the past continue to outperform (underperform) in the future. If this is so, a question naturally arises: Are lead analysts those with good prior profitability? Path-directing and profitability are different by definition because path-directing catches the impact on future analyst movement, but profitability catches the market reaction. Therefore, path-directing provides a new measure to identify lead analysts.
The two concepts are also different in the empirical specification. This article focuses on leading–herding relation, but MWW avoid this. They make it clear in their footnote 4 that “our analysis does not explicitly control for analyst herding” (p. 79). They apply three methods to avoid an overlap with herding. First, “we limit the effects of herding on our statistical tests in our non-overlapping return windows sample by eliminating all observations for which multiple revisions for the same firm occur during the return accumulation window” (p. 79). The return accumulation window is from 2 days prior to revision date to 2 days, 1 month, 2 months, and 3 months after. As shown in our first robustness check, leading–following can be measured in 1-month, 2-month, 3-month, and up to 6-month periods. The second method of MWW is to combine individual revisions for the same firm (MWW). The third method is to use one observation a month for each firm. All three methods by construction avoid herding.
However, the MWW research does lead to the question: Does being profitable in the past help an analyst to become a leader? To investigate this, we follow MWW and calculate the average of I × CAR(−1, 1) of recommendations issued by an analyst in the past year. We then sort this average into quintiles with the highest CAR(−1, 1) in the highest quintile and lowest CAR(−1, 1) in the lowest quintile, and name it Prior_Perf. We then use it as an independent variable in the logistic regression with path-directing as the dependent variable. Column 2 of Table 3 shows the results. The coefficient estimate of Prior_Perf estimate is −.001 with a p value of .814. Therefore, being profitable in the past does not help an analyst to be path-directing this year. As a robustness check, we use the average of 1-month, 2-month, or 3-month post-recommendation return in the past year as profitability measure, and then use the quintile of this average as an alternative measure of Prior_Perf. We still find prior_perf to be statistically insignificant in affecting the likelihood of path-directing.
Bold recommendations
By definition, path-directing and bold recommendations are different because the former catches the impact on the future consensus, but the latter catches the movement away from the existing consensus. However, it is challenging to distinguish between the two, as Panel A in Table 1 shows that 81% of the recommendations are bold. To completely remove the impact of bold recommendations, we exclude them from the regression model and report the results in Column 3 of Table 3. We still find that past leaders are more likely to make path-directing recommendations this year. Again the results support our main argument without the inference of bold recommendations.
Measure consensus
We can alternatively measure the deviation from the consensus by using Deviation2,
Robustness Checks: Alternative Specifications of Path-Directing Recommendations and Lead Analysts
We conduct the first six robustness checks to determine whether the results on path-directing recommendations are specific to certain aspects of the definition of path-directing recommendations and lead analysts. To do this, we check whether the results hold when the following effects are controlled for:
1. alternative end dates,
2. industry-level lead analysts,
3. the differentiation between first mover and quick-following recommendations,
4. a dummy variable with 1 for analysts in the top quintile of Leadi,t−1 and 0 otherwise,
5. a new threshold on beginning deviation, and
6. a new threshold on ending deviation.
Alternative end dates
In forecasting earnings, the fiscal-year (quarter) end serves as a natural deadline, so researchers can compare analyst forecast accuracy based on the deviation from the actual earnings at the fiscal-year (quarter) end. However, there is no unanimous deadline for recommendations and equity analysts update their recommendations over time, which poses challenges in setting the end date for defining path-directing recommendations. Earlier, we defined the end date as the earlier of 365 days after recommendation date, or the review date, which is the last date that a recommendation is confirmed by I/B/E/S. The review date suffers from a disadvantage in that it is endogenous: If the analyst’s opinion about the stock does not change quickly, the review date is far from the recommendation date. In contrast, if the analyst changes opinions quickly, the review date is close to the recommendation date. The review date also depends on how frequently I/B/E/S verifies with analysts on the validity of recommendations. The third concern of using review date is that in our sample, on average, it is 276 calendar days after the recommendation date. In such a long period, other events may prompt analysts to converge to the first mover’s recommendations. To understand whether the days between the recommendation date and the review date affect path-directing behavior, we control for days to review date in an unreported regression and find its coefficient to be positive and statistically significant.
We moderate these problems by setting the end date to be 1 month after the recommendation date, resulting in the same number of days from the recommendation date to the end date across all recommendations. In more detail, we only include recommendations with review dates at least 1 month later than recommendation dates. We use 1 month after the recommendation date as the new end date and use it for both the identification of path-directing recommendations and lead analyst measures. The regression results are presented in column 1 of Table 4. Similar to Table 3, the coefficient of the new past year’s leadership is still positive and statistically significant, suggesting again that other analysts follow the lead analysts’ recommendations. 10
Robustness Checks of Which Analysts Issue Path-Directing Recommendations.

Note. The sample covers the period from January 1994 to December 2006. The dependent variable is path-directingi,j,rec, a dummy variable with 1 for path-directing recommendations and 0 otherwise. Variables are described in the appendix. The standard errors are adjusted for clustering within the same stock, the same year, and the same analyst. In column 1, 1 month after recommendation date is used as the end date in defining path-directing recommendations and lead analysts. In column 2, an industry-level lead analyst measure is included. In column 3, recommendations are weighted to differentiate between first mover and quick-following recommendations. In column 4, past lead analysts are a dummy variable with 1 for analysts in the top quintile of Leadi,t−1 and 0 otherwise. In column 5, the beginning deviation must be greater than 1 to define path-directing recommendations and lead analysts. In column 6, the ending deviation must be less than 0.5 to define path-directing recommendations and lead analysts. In column 7, recommendations made around earnings releases, management earnings guidance, and days with multiple recommendations are excluded. In column 8, a post-Reg FD sample is used. In column 9, deviation from the global consensus is included. In column 10, I × CAR(−4, −2) is used to proxy immediate pre-recommendation public information. In column 11, all variables are standardized by subtracting the mean and dividing by twice the standard deviation.
Industry-level lead analyst
The All-America stars are ranked within each industry. Boni and Womack (2006) show that an analyst usually specializes by industry and creates investment value mainly through their ability to rank stocks within an industry. They use S&P/Morgan Stanley Capital International (MSCI) Global Industry Classification Standard (GICS) to classify companies into 59 industries, close to the 70 industries reported by the All-America star industry classification. To be consistent with this practice, we also consider an industry-level lead analyst measure, which is the average of path-directing measures across the industry of stock j that analyst i covers in year t−1. We use GICS reported by I/B/E/S for identifying industries. Model 1 is tested using the industry-level lead analyst measure and results are reported in column 2 of Table 4. The coefficient estimate on the industry-level lead analyst measure is positive and statistically significant.
First mover and quick-following recommendations
A concern with the previous definition of path-directing recommendation is that quick-following recommendations can be classified as path-directing. To alleviate this problem, we weight recommendations by the degree of repetition. For example, a new recommendation that is different from all outstanding recommendations receives a heavier weight than a following recommendation. More specifically, we weight path-directingi,j,rec by Wi,j,rec, then use the weighted sum to get the analyst level Leadi,t−1, where

t refers to the recommendation date. Nt − 1 is the number of recommendations on firm j on the day before the recommendation date. Nsame, t−1 is the number of the same level of recommendations on firm j on the day before the recommendation date. The weight ranges between 0 and 1. If a recommendation is new, then the number of the same recommendations on the prior day is 0, and thus the weight is 1. In contrast, if a recommendation is exactly the same as all recommendations, then it gets a weight of 0. We test Model 1 again using the newly defined lead analyst measure and present the regression estimates in column 3 of Table 4. The coefficient on lead analyst is positive and statistically significantly different from 0. It suggests that investors tend to differentiate between the first mover and quick followers.
Top lead analyst
Leadi,t−1 is a continuous variable in the range of 0 to 1. It measures how frequently an analyst’s recommendations issued in the past year are path-directing. A challenge is that it might not directly answer a frequently asked question: Who is a lead analyst and who is not? To answer this question, one can assign a dummy variable to differentiate between lead analysts and follower analysts based on Leadi,t−1. Table 2 shows that as the quintiles of Leadi,t−1 increase, the average path-directing score in the current year increases monotonically. Based on the analysis in Table 2, we use a top lead analyst dummy that equals 1 if Leadi,t−1 is in the highest quintile and 0 otherwise. We then rerun Model 1 with top lead analyst replacing Leadi,t−1 and the regression results are in Column 4. The coefficient estimate of top lead analyst is positive and statistically significantly different from 0, supporting the persistence of top lead analysts. The odds ratio of the lead analyst dummy is 1.11, indicating that the odds of observing path-directing behavior by a lead analyst is 1.11 times the odds of other analysts.
New threshold on beginning deviation
A path-directing recommendation is confirmed if the deviation from consensus decreases from the recommendation date to the end date and the deviation from consensus on the end date is less than or equal to 1. A concern is that there is no requirement on the beginning deviation, that is, the deviation on the recommendation date. If the beginning deviation is very low, then a small change by others in the direction of the recommendation will cause the recommendation to be classified as path-directing. Therefore, in the robustness check we add another threshold that the beginning deviation must be greater than 1. We then redefine path-directing recommendations and lead analysts. We test Model 1 again with the new specification and present the regression estimates in column 5 of Table 4. The coefficient estimate on the newly defined lead analyst variable is still positive and statistically significant.
New threshold on ending deviation
Another concern that arises from the definition of a path-directing recommendation is that the threshold of the ending deviation may be too loose, causing one third of the recommendations to be identified as path-directing as in Panel A of Table 1. Therefore, in the robustness check, we tighten this threshold, so that the ending deviation must be less than or equal to 0.5. We then redefine path-directing recommendations and lead analysts. Using the new threshold, the percentage of path-directing recommendation is reduced to be 15%. We test Model 1 again and present the regression estimates in column 6 of Table 4. The coefficient estimate on newly defined lead analysts is still positive and statistically significant.
Robustness Checks: Other Samples, Variables, or Econometric Methods
We conduct five more robustness checks on other samples, additional independent variables, and other econometric methods. We check whether the results hold when the following effects are controlled for:
7. the exclusion of days around firm news releases,
8. the impact of Reg FD regulation,
9. the long-term mean reversal of recommendations,
10. immediate public information, and
11. other standardization techniques.
Exclude firm news days
As discussed earlier, herding may be caused by similar independent analyst reaction to firm news, rather than following some lead analysts. Earnings releases convey the greatest information when compared with other news. Thus, earnings releases must have a significant impact on analyst recommendations. This argument is supported, for instance, by Ivkovic and Jegadeesh (2004) who find that analyst recommendations immediately following earnings releases are likely to be based on their interpretation of financial data. It is also supported by Livnat and Zhang (2012) that a significant portion of earnings forecasts are issued around news releases (including earnings announcements) and they are more likely to be the interpretation of information. In contrast, recommendations made at other times are likely to be based on information gathered privately. To control for the possibility that analysts simultaneously make similar recommendation revisions in response to the release of earnings, we exclude recommendations made within 3 trading days before and after earnings releases. Another type of corporate news is earnings guidance issued by firms, as argued by Altinkilic and Hansen (2009). We obtain earnings guidance dates from the First Call Guidelines database. We exclude recommendations made within 3 trading days before and after earnings guidance releases. Also Bradley, Jordan, and Ritter (2008) suggest that clustering of recommendations occurs because of firm news. Thus, we exclude days with multiple recommendations on the same firm. Excluding multiple recommendations alleviates another concern that when two or more analysts issue recommendations on the same day, each of them may be treated as co-equal path-directing, even though they may follow each other at different points of time during a day. First, we rerun the logistic regression without one of the three news events. In unreported regressions, we find that the coefficient on the lead analysts is still statistically significant in each case. Then, we exclude earnings announcements releases, management earnings guidance, and multiple recommendations altogether. Thirty-nine percent of recommendations are issued around the three types of news events and therefore removed. We report the regression results in column 7. Again, the coefficient on the lead analysts is still statistically significant, indicating that they direct the consensus even without firm news releases.
The impact of Reg FD
Reg FD is a set of “fair disclosure” rules enforced by the U.S. Securities and Exchange Commission (SEC). Approved on August 10, 2000, and effective October 23, 2000, these rules require a company to reveal any “material” information to all investors and to analysts simultaneously in case of intentional disclosures, or within 24 hr in case of unintentional disclosures. Prior to Reg FD, analysts could achieve persistent leadership through persistent private access to information. Mohanram and Sunder (2006) find that analysts who had preferential links with firms they covered tend to have greater forecast accuracy in the pre-Reg FD period. However, these analysts are unable to sustain their forecasting superiority in the post-Reg FD period, which suggests that there has been a leveling of the information playing field among analysts. Palmon and Yezegel (2011) also find a significant decline in the predictive value of analysts’ recommendations for identifying earnings surprises after Reg FD took effect. Z. Chen, Dhaliwal, and Xie (2010) find that cost of capital declines after Reg FD, supporting their argument that Reg FD succeeds in prohibiting selective disclosure.
The literature cited above suggests that Reg FD makes it less likely, if not impossible, that some analysts will persistently acquire private information. We expect that after Reg FD’s introduction, there is less following behavior and less leadership for analysts who used to have a persistent channel to private information before Reg FD. In an unreported regression, we add a Reg FD dummy variable and an interaction between it and the lead analyst measure. The coefficient estimates of both are negative and statistically significant, indicating that the impact of lead analysts on path-directing recommendations is less pronounced after Reg FD.
An interesting question arises: Does the impact of lead analyst on path-directing recommendations go away completely after Reg FD? To get a clear picture of the impact of Reg FD, we rerun Model 1 with a subsample of recommendations after Reg FD, that is, recommendations issued after October 23, 2000. Column 8 of Table 4 presents the regression estimates. In this subsample, the coefficient on lead analysts is still positive and statistically significant. Using the approval date of August 10, 2000, to divide the sample does not change the result. 11 Altogether, the results suggest that, although Reg FD reduces the impact of lead analysts on path-directing recommendations, their influence does not disappear. Lead analysts are still more likely to direct the consensus than other analysts.
Mean reversion
Unlike earnings forecasts, stock recommendations are bounded by 1 and 5, and extreme recommendations at either end will likely change to the middle of the bound. As seen from Panel C of Table 2, non-hold recommendations tend to change to hold. Thus, it is possible that a path-directing observation may be caused by the mean reversion of the consensus. We examine whether lead analysts are still more likely to issue path-directing recommendations, while controlling for this mean reversion. Following Jegadeesh and Kim (2010), we measure the mean-reverting consensus by the global consensus, which is the mean of all outstanding recommendations on all stocks on each day. We include a deviation from the global consensus in the regression model, which is the global consensus minus the recommendation. In this robustness check only, to avoid any confounding effects when the global consensus and the stock consensus are too close, we include only stocks whose consensus is at least one standard deviation away from the global consensus. We test Model 1 again and present the regression estimates in column 9 of Table 4. The coefficient estimate on lead analysts is still positive and statistically significant.
Immediate public information
Analyst recommendations, if they are useful, should immediately affect stock prices and, therefore, returns. It would seem appropriate to measure returns immediately before recommendation to proxy public information. We use I × CAR(−4, −2) to replace I × CAR(−63, −2) for public information. We test Model 1 again and present the regression estimates in column 10 of Table 4. The coefficient estimate of I × CAR(−4, −2) is positive and significant, indicating that analysts react strongly to recent information as well. When immediate pre-recommendation return is controlled, the coefficient of lead analyst is still positive and significant. The result suggests that lead analysts are more likely to issue path-directing recommendations, while the immediate public information is controlled.
Standardize variables
Gelman (2008) raises a question on standardizing variables when independent variables include both binary variables and numeric variables. The common way to standardize a variable is to subtract the mean and then divide by the standard deviation. Then, researchers can interpret the regression by one-unit change of the standardized variables. However, this method is not applied to binary variables. Consider a binary variable with equal probability of 0 and 1. It has a mean of 0.5 and a standard deviation of 0.5. The coefficients for the binary predictors correspond to a comparison of x = 0 to x = 1, or 2 standard deviations, which is different from 1 standard deviation in the common technique. To use this benchmark of binary variables to interpret standardized coefficients more broadly, Gelman proposes a new way to standardize variables: subtract the mean and divide by twice the standard deviations. Following Gelman (2008), we standardize all the variables, rerun the regressions in Model 1, and present the regression estimates in column 11 of Table 4. The coefficient estimate on lead analysts is still positive and statistically significant. Therefore, we are confident that our results are robust to an alternative econometric method to standardize variables.
In conclusion, despite 11 different robustness checks the basic relationship still holds: There is a leadership pattern in stock recommendations.
The Market Reaction
In this section, we focus on the second question of this article: Whether lead analysts’ recommendations generate a stronger market reaction than those of other analysts. It is well known that the market reacts positively to upgrades and negatively to downgrades. In other words, recommendations have informational value. It has also been shown that some analysts’ recommendations contain more information (see Womack, 1996) or provide better interpretation of public information (see Altinkilic & Hansen, 2009; X. Chen, Cheng, & Lo, 2010; Livnat & Zhang, 2012) than other analysts. This raises the question of whether the market responds more strongly to lead analyst recommendations. As leadership is persistent and takes time to build, lead analysts must have generated more valuable information by providing new information or better interpretation. In contrast, other analysts follow lead analysts and only play a “confirmatory” role (Lys & Sohn, 1990). Thus, market returns should be stronger for lead analyst recommendations.
We estimate a multivariate regression Model 2:

In the regression, the standard errors are adjusted for clustering within the same stock, the same year, and the same analyst. The dependent variable is CAR(−1, 1). We include the independent variables that are found to affect market returns by the literature. Jegadeesh and Kim (2010) find that the market reaction is greater to timely lead analysts and away from the consensus recommendations. Clement and Tse (2006) and Mikhail, Walther, and Willis (1997) find that analysts who are All-America stars or are employed by larger brokerages tend to generate more precise research or have higher market reaction. Kecskes et al. (2013) find that stock recommendations accompanied by earnings forecasts in the same direction have larger price reactions.
We report the results in Table 5. The coefficient on past lead analysts is .011 for upgrades and −.026 in downgrades. This result suggests that recommendations issued by lead analysts contain more information than those by other analysts, and the impact is even stronger with downgrades. Panel A of Table 1 shows that the Quartile 1 of Leadi,t−1 is 0.167 and Quartile 3 is 0.385, respectively, a difference of 0.218. Thus, for analysts in Quartile 1 and Quartile 3 of
Regression of Market Reaction.
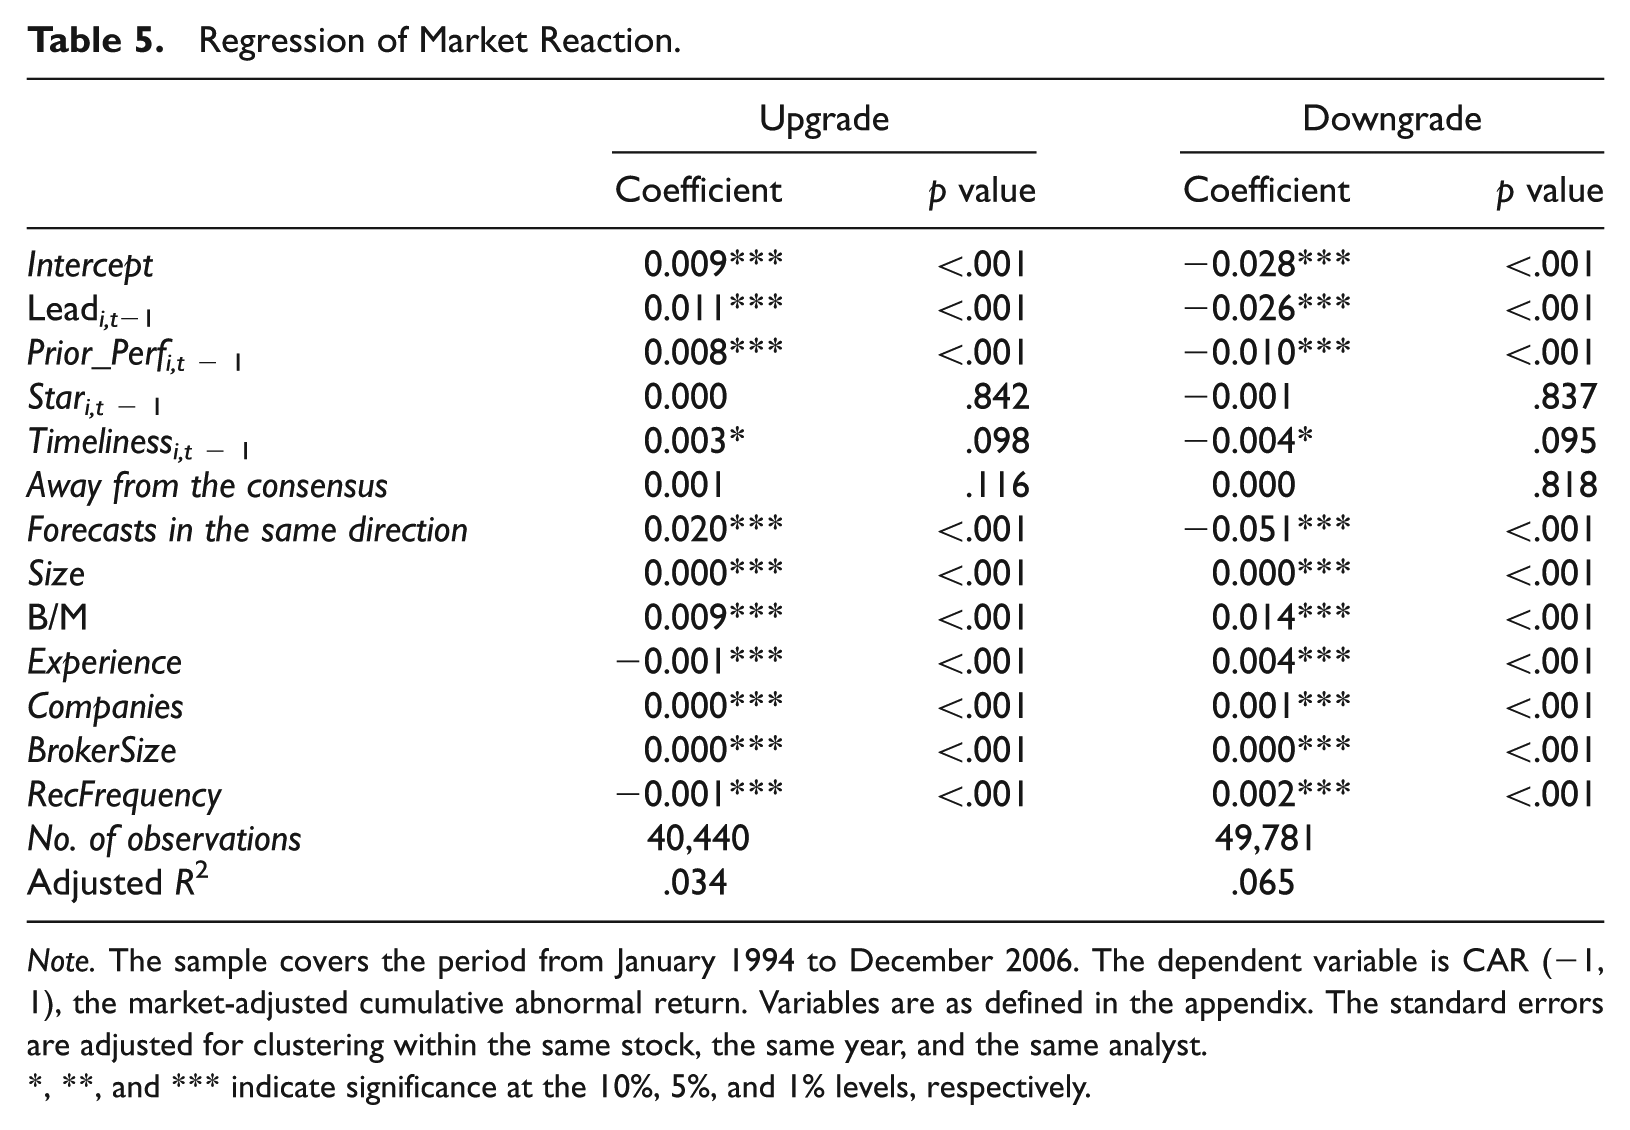
Note. The sample covers the period from January 1994 to December 2006. The dependent variable is CAR (−1, 1), the market-adjusted cumulative abnormal return. Variables are as defined in the appendix. The standard errors are adjusted for clustering within the same stock, the same year, and the same analyst.
, **, and *** indicate significance at the 10%, 5%, and 1% levels, respectively.
The coefficient of Prior_perf is positive and statistically significant in upgrades and negative and statistically significant in downgrades, consistent with the MWW argument that analysts who earned the highest excess returns in the past continue to outperform in the future. The coefficient estimate of star is statistically insignificant. Timely lead analysts are positive in upgrades and negative in downgrades. The coefficient of forecasts in the same direction is positive in upgrades and negative in downgrades, suggesting that analysts use information in earnings forecasts to generate recommendations. We also find that the market reaction is negatively related to firm size, analyst experience, and recommendation frequency. Collectively, these results support the argument that lead analyst recommendations generate stronger market reaction. One might argue that the stronger market reaction may be triggered by firm news, rather than reactions to recommendations, if the recommendations are issued around news releases. To evaluate this issue, in an unreported robustness check we exclude recommendations made within 3 days of news events, including earnings announcements, management earnings guidance, and multiple recommendations altogether. We still find that the initial market return is higher for recommendations issued by lead analysts. As a robustness check, we use the average of all other recommendations as the consensus. We then use the absolute difference from this consensus (Deviation2) to measure path-directing recommendations and lead analysts. We still find that the market reacts more strongly to lead analyst recommendations.
Conclusion
Analyst leading–herding behavior has attracted significant interest in academic research. However, what has not been analyzed so far is, Who leads the herd in stock recommendations? In this article, we provide a method to identify lead analysts. We define path-directing recommendations as those that the consensus moves to once they are issued. We define lead analysts as those who have issued path-directing recommendations in the past year. We verify the validity of this definition by finding that lead analysts are more likely to issue path-directing recommendations even after controlling for public information. We also find that recommendations accompanied by larger pre-recommendation return increases, on larger and growth firms, by analysts from larger brokerage houses and with fewer recommendations are more likely to be path-directing. Our results are robust to a variety of controls.
Identifying lead analysts is important for investment decisions. We find a stronger market reaction to lead analyst recommendations, suggesting that their recommendations are more informative than those of other analysts. The results indicate that recommendations are partially driven by the tendency to follow the lead analysts, and the leader–follower relation is recognized by the market.
Our methodology of identifying path-directing recommendations and lead analysts is significantly different from the bold or timeliness measure in the herding literature. We explore herding research from a new perspective by examining which analysts lead the herd. In addition to the literature demonstrating that analysts herd, our results further show that they herd toward specific lead analysts. Thus, this research complements the herding literature.
Footnotes
Appendix
Construction of Variables
| Variables | Definition |
|---|---|
| Lead analyst variables | |
| Leadi,t−1 | The average of the path-directing recommendations that an analyst issued in the past year. |
| Stari,t−1 | A dummy variable with 1 for All-America stars in the past year and 0 otherwise. |
| Timelinessi,t−1 | A dummy variable with 1 for timely lead analysts in the past year and 0 otherwise. Timely lead analysts are those with a leader–follower ratio in recommendations above the top 10 percentile of their F distribution. |
| Recommendation-level variables | |
| Path-directingi,j,rec | A dummy variable with 1 for path-directing recommendations and 0 otherwise. Path-directing recommendations are recommendations that the consensus moves to after their releases. |
| CAR(t1, t2) | The buy-and-hold return from trading days t1 to t2 around the recommendation date, excluding market returns. |
| I | A dummy variable with 1 for upgrades and −1 for downgrades. |
| Away from the consensus | The consensus minus the recommendation level. |
| Days to review date | The number of calendar days between the recommendation date and the review date. |
| Bold | A dummy variable which equals 1 if a new recommendation level is either higher than both the consensus and the analyst’s own last recommendation or lower than both the consensus and the analyst’s own last recommendation, and 0 otherwise. |
| Deviation from global consensus | The global consensus minus the recommendation. |
| Forecasts in the same direction | A dummy variable which equals 1 if the same analyst issues any type of earnings forecasts within three trading days before and after a recommendation, and the change of earnings forecasts is in the same direction as the change of recommendation, and 0 otherwise. |
| Firm-level variables | |
| Size | Market capitalization at the end of last calendar year in millions of dollars |
| B/M | Book equity divided by market capitalization at the end of last calendar year. Book equity is shareholders’ equity plus deferred taxes plus investment tax credit minus preferred stock. Shareholders’ equity must be positive and book equity must be non-negative. |
| Analyst-level variables | |
| Experience | The number of years that an analyst covers a company in the I/B/E/S Recommendation file. |
| Companies | The number of companies that an analyst covers. |
| BrokerSize | The number of analysts in a brokerage house. |
| RecFrequency | The number of recommendations an analyst makes on a given company in a year. |
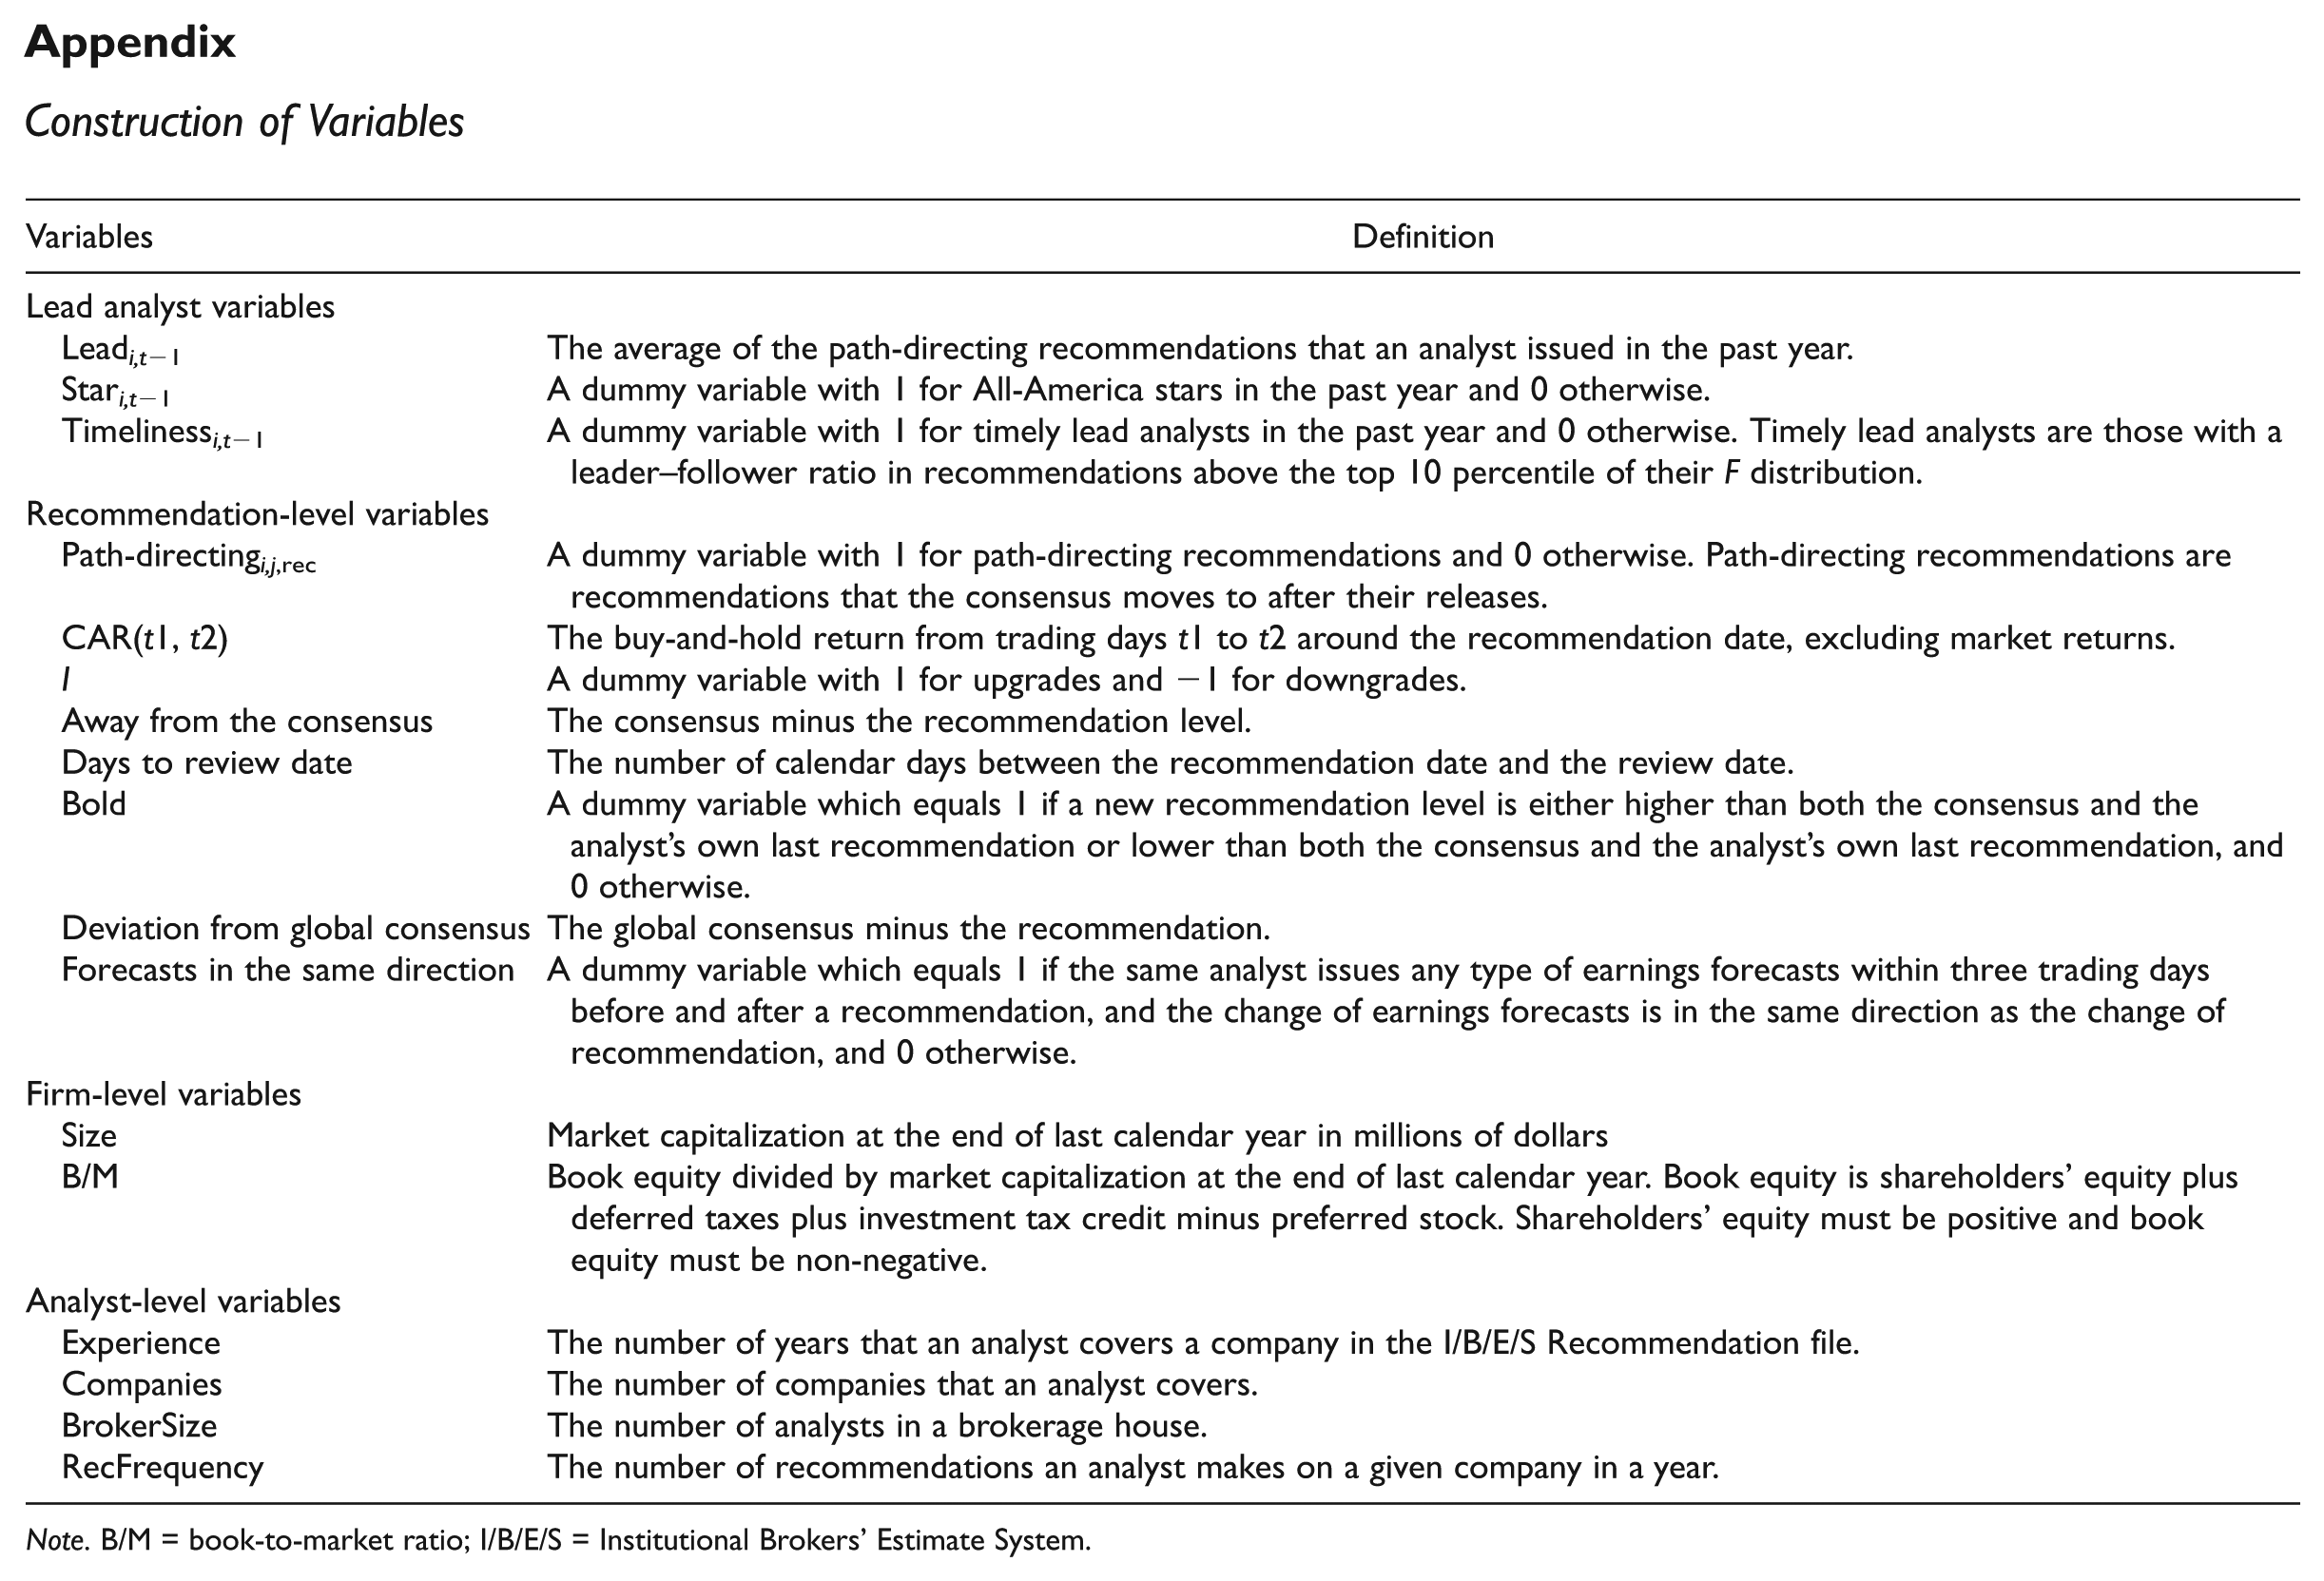
Note. B/M = book-to-market ratio; I/B/E/S = Institutional Brokers’ Estimate System.
Declaration of Conflicting Interests
The author(s) declared no potential conflicts of interest with respect to the research, authorship, and/or publication of this article.
Funding
The author(s) received no financial support for the research, authorship, and/or publication of this article.