




Abstract
In recent times, there has been evidence of abnormal Directors and Officers liability (D&O) insurance purchase by the firms. Although D&O coverage is necessary to protect the directors and officers from the rising lawsuit risk, the motivation for carrying abnormal coverage is not clear. In this article, we examine the implications of providing excessive protection to the directors and officers on managerial behavior and firm performance. We use firm reporting and investment activity to examine managerial behavior and firm’s profitability to examine firm performance. For a sample of U.S. firms from 2004 to 2008, our results show that abnormal D&O insurance is positively associated with aggressive reporting, aggressive investment activity, and abnormal profit performance. Our results hold even after controlling for endogeneity and serial correlation in the data.
Introduction
Directors and Officers liability insurance, hereafter D&O insurance, has become an essential part of top management contracts among publicly traded companies in the United States. According to Tillinghast Towers-Perrin 2004 survey of D&O insurance, about 99% of their U.S participants who are publicly listed report purchasing D&O insurance in 2004. The growing popularity of such insurance has been attributed to the rising lawsuit risk against directors and officers. Weisdorn, McCord, and William (2006) report that complaints against directors have increased by 137% since 1995, whereas Zinkewicz (2006) reports a 30% increase in the number of complaints against directors and officers between 2004 and 2005. Many firms see the D&O insurance as a means to attract and retain skilled officers (Linck, Netter, & Yang, 2009) and provide adequate incentives for the officers to create value for shareholders.
What has also emerged in the literature is that many firms buy D&O insurance in excess of what is justified by the firms’ litigation risk (Kim, 2005). Such coverage—abnormal coverage—typically expands the scope of events against which the officers are covered and/or raises the level of coverage from third-party lawsuits. A few studies suggest that such coverage is driven by managerial opportunism: Abnormal D&O coverage reflects a strategy by powerful executives to shield their personal wealth from third-party lawsuits for the wrongful acts of the firm and its officers (Boubakri, Boyer, & Ghalleb, 2008; Chalmers, Dann, & Harford, 2002). Under this view, abnormal coverage is perverse and portends negative effect on firm performance.
An alternative view not yet explored is based on the predictions of the contract theory. Optimal contracting theory describes contexts in which lowering the risk imposed on executives can enhance managerial performance. Lambert (1986), for example, analyzes the effect of risk on project selection. He shows that executives who bear excessive risk will favor “safe” (but potentially low yield) projects and reject risky projects, even when the latter have superior profit potentials. Jenter (2002) similarly shows that executives will be reluctant to provide effort when they are uncertain about the impact of their effort on performance. A key point in both studies is that lowering the risk on executives to appropriate levels will induce the executives to search for, and adopt, “best” projects. This has the potential to enhance shareholder value by mitigating the underinvestment that would result if the executives assumed excessive risk. In the sense of the theory, abnormal D&O insurance can be optimal: It reduces or eliminates officers’ exposure to litigation costs and assures that the officers’ wealth is not at risk when they adopt risky projects. Such protection creates incentives for the officers to be aggressive in taking enterprise actions that promise superior profits. Under this view of D&O insurance, abnormal coverage is an optimal incentive mechanism expected to correlate positively with firm performance.
In our analysis, we explore this contracting explanation for abnormal coverage. Drawing from models of optimal contracts (e.g., Lambert, 1986, 2001; Jenter, 2002), we propose that abnormal D&O coverage—a measure of lower litigation risk on executives—is associated with (a) firm financial disclosure, (b) investment activity, and (c) firm profit performance. First, we test that abnormal coverage is associated with greater financial disclosure (which we measure as the frequency of abnormal forward-looking statements in the Management Discussion & Analysis section of Form 10-K) and more aggressive investments (which we measure as abnormal research and development expenditures and abnormal capital expenditures). Next, we examine the link between abnormal coverage and abnormal profit performance (defined as abnormal return on assets and abnormal security returns).
Our sample period extends from 2004 to 2008 and includes U.S. listed firms that disclose D&O coverage information. Consistent with Kim (2005), we find that a significant amount of coverage is unexplained by the firms’ litigation risk. We then find that the unexplained coverage, our measure of abnormal coverage, is associated with greater disclosures of forward-looking statements in the Management Discussion and Analysis (MD&A) section of Form 10-K. Moreover, using research and development costs (R&D) and capital expenditure as proxies for investments, we find that abnormal coverage is positively associated with current and future abnormal investments. We further show that abnormal coverage has a positive impact on current as well as years-ahead profit performance.
This study is relevant for, at least, two reasons. First, it adds to the literature on the economic effects of D&O insurance in the United States. Prior analyses of the phenomenon rely largely on Canadian firms whose domestic environment is less litigious and subject to different sets of governance rules (Boyer, 2003). In the United States, shareholder lawsuits are common, and can affect the behavior of corporate executives with respect to decision making and risk taking. Second, the purchase of abnormal D&O insurance raises questions regarding its efficacy. Abnormal coverage is costly to the firm in that it passes on to the firm the direct and implicit costs of the coverage. As a result, it is important to assess the potential benefits of indemnifying directors and officers in excess of what is justified by the known determinants of insurance.
The rest of the article proceeds as follows: The section “Background: D&O Insurance” provides information on D&O insurance while “Motivation and Hypothesis” section reviews prior literature and develops the hypotheses. The “Sample Selection” section describes our sample selection process and “Research Design” section describes the research design. The “Results” section then reports the results and the final section concludes the article.
Background: D&O Insurance
D&O insurance reduces the financial liability of officers and directors arising from lawsuits filed against them while working for the company. The policy may combine up to three types of coverage: Side A or Personal Coverage, which provides direct payment to directors and officers when the firm cannot; Side B or Corporate Reimbursement Coverage, which reimburses the firm for the costs of defending and settling lawsuits against its officers and directors; and Side C or Entity Coverage, for claims against the entity rather than individuals. Generally, Side A coverage is the most extensive and widely purchased (Tower Watson, 2011). In addition, the policies frequently contain a priority-of-payment clause. The clause provides that any payments under the D&O policy will be made first under Side A to protect the assets of directors and officers before any payments can be made under Side B or Side C clauses. Such a clause confers added protection to directors and officers against potential lawsuit costs.
Although the insurance covers a majority of claims against the directors and officers, it has three basic exclusions. The first exclusion, fraud exclusion, excludes claims raised against the directors or officers resulting from fraudulent activities. The second exclusion, prior claim exclusion, excludes claims noticed or pending prior to the commencement of the current policy. The third type is insured versus insured exclusion, which excludes claims by one officer against other officers or the corporation. In addition, D&O insurance does not cover claims pertaining to the Employee Retirement Income Security Act (ERISA), claims alleging bodily injury or emotional distress, or claims arising from service to other organizations. Despite the exclusions, the D&O insurance program is costly to firms. Firms must pay significant amounts as premiums for the policy. The premium generally reflects the insurer’s assessment of the client firm’s litigation risk arising from its business activities, accounting practices, regulation, governance risk, and the amount of coverage selected (Core, 2000). The insurer can also lower the premium by attaching higher deductible to the plan. The deductible, however, applies more or less to entity level coverage; it is largely zero for Side A coverage (Baker & Griffith, 2007a, 2007b).
Motivation and Hypotheses
Incentives for Firms to Purchase Abnormal D&O Insurance
With the growing popularity of D&O insurance, several studies analyze the incentives for, and impact of, D&O insurance on shareholder wealth. On a broader scale, Mayers and Smith (1982) observe that the demand for insurance arises from a firm’s need to lower bankruptcy costs, improve service efficiency, expand growth opportunities, and reduce risk for managers. Many studies use the underlying arguments in Mayers and Smith to examine the determinants of D&O insurance (e.g., Baker & Griffith, 2007a, 2007b; Cao & Narayanamoorthy, 2014; Core, 1997, 2000; Kaltchev, 2007; O’Sullivan, 1997, 2002). Overall, these studies conclude that the main source of D&O risk in terms of liability exposure is shareholder lawsuit, and that firms obtain D&O coverage primarily to insulate the officers against such risks. As Baker and Griffith (2007a, p. 502) observe, “Corporations are eager to assure their officers and directors that their personal assets will not be at risk as a result of accepting a board seat or other position with the company.”
Recently, however, a few studies find that firms purchase D&O insurance above the limit justified by the known determinants of litigation risk. Kim (2005), for example, finds that about 55% of the coverage is unexplained by the firm’s litigation risk. Boubakri et al. (2008) and Chalmers et al. (2002) document abnormal coverage for firms during seasoned equity offering (SEO) and initial public offering, respectively. Although prior literature identifies the factors that determine normal coverage, the incentive for, and goal of, abnormal coverage is not fully known. A view that has received a fair amount of attention is that abnormal coverage motivates managerial opportunism. Kim (2005), for example, reports that abnormal coverage is positively linked to the likelihood of aggressive financial reporting and concludes that excess buffering of the directors and officers via abnormal coverage is value destroying. Chung and Wynn (2008) use a sample of Canadian firms to test the effect of increased D&O coverage on the timeliness of earnings. They find a decrease in the timeliness of earnings for firms that have high coverage. Boubakri et al. (2008) also find that, during SEO, higher D&O coverage is associated with higher risk of accounting manipulation.
Another view of the insurance process, however, is that abnormal coverage reflects efficient contracting. Under this view, the coverage level a firm selects is an integral part of its contracting arrangement and, for many firms, comprises two components—a normal and an abnormal components. The normal component covers officers for lawsuit risk that derives from the firm’s normal disclosure practices, business activities, securities laws, and corporate governance (Cao & Narayanamoorthy, 2014), and must be adequate to attract and retain risk-averse officers (Baker & Griffith, 2007b). Gardner and Fulton (2007) observe that prospective directors (and officers) would reject a position on the board in the absence of D&O coverage. Baker and Griffith (2007a) also point out that risk-averse directors and officers are eager to protect their personal assets and will not serve without individual-level coverage. Normal coverage, thus, functions as the minimum D&O insurance that the firm must provide to guarantee that executives accept a position in the firm.
Abnormal coverage, however, offers a level of protection for officers beyond what is implied by normal litigation risk (Cao & Narayanamoorthy, 2014). The additional coverage can be optimal especially when the risk imposed on executives is so high that conventional levels of coverage are insufficient to induce managers to exert appropriate levels of effort toward risky, but valuable, tasks. Consider, for example, Section 302 of the Sarbanes–Oxley Act (SOX) of 2002, “Corporate Responsibility for Financial Reports,” that holds CEOs and CFOs personally liable for the reliability of the reports. Carter, Lynch, and Zechman (2009) and Cohen, Dey, and Lys (2009) note that such mandates not only impose greater risks on the executives, but also alter the incentives among the executives to take risky actions that have great upside potentials. Cohen et al. point out that the personal costs and liabilities imposed on the executives by SOX are likely to motivate modifications in executive contracts that adjust for the effect of such risks on the executives’ incentives to take risks.
Lambert (1986) formally models the effects of altering the risk imposed on executives. He shows that when the risk imposed on executives is too high, the probability that risky projects will be acceptable becomes so small that it dampens all considerations for the upside potentials. The outcome for the firm is lower profitability as managers “screen out” risky projects, including those with superior profit potentials. Jenter (2002) similarly shows that at higher risk levels, executives will be unwilling to provide effort, especially when they are uncertain about the impact of their effort on performance. Suijs (2007) also shows that increased litigation risk raises the prospect that a firm will reduce the content and scope of financial disclosures, whereas lower litigation risk creates incentive for greater disclosure. A corollary based on these analyses is that proper lowering of risk can motivate executives to favor actions that have high upside potentials. In the context of D&O insurance, the results raise the prospect that abnormal D&O coverage—a direct cutback in litigation risk imposed on officers 1 —is designed to induce officers to exert greater effort in evaluating and adopting risky acts that have high upside potentials. In our analysis, we consider these latter views of D&O insurance and investigate the link between abnormal D&O insurance and firms’ financial reporting practices, investment activities, and profit performance. The hypotheses that underlie the empirical tests are discussed below.
Hypotheses
Aggressive financial reporting
Notably, information gap between firms and outsiders imposes costs on firms (Myers & Majluf, 1984). Aware of the costs, firms routinely provide disclosures that explain current activities or forecast future events. The benefits of such disclosures include lower bid-ask spread (Healy, Hutton, & Palepu, 1999; Welker, 1995), lower cost of debt (Sengupta, 1998), and more timely earnings (Gelb & Zarowin, 2002; Lundholm & Myers, 2002). Disclosures are also a major source of shareholder lawsuits, more so those that forecast future events. A survey by Tillinghast, for example, shows that disclosure-related lawsuits account for 46.4% of all claims filed against U.S. registrants in 2002. Such lawsuits, in turn, discourage firms from making disclosures that forecast future events (Frost, 1998; Suijs, 2007). The American Stock Exchange (1994), for example, reports that 79% of managers avoid disclosure to reduce their exposure to shareholder litigation. Baginski, Hassell, and Kimbrough (2002) find that litigation risk affects not only the frequency but also the precision of management forecast. They note that voluntary forecasts are relatively low among U.S. firms due to the Security and Exchange Commission (SEC) Rule 10b-5 that permits shareholders to bring actions against firms when the firms’ managers are perceived to have provided misleading or overly optimistic disclosures (Johnson, Kasznik, & Nelson, 2001). 2
The preceding studies and anecdotes raise the prospect that, absent protection from the litigation risks, executives can be expected to avoid or withhold disclosures that forecast events, even when such disclosures can enhance long-run value of the firm. Studies on voluntary disclosure also predict that cutting back on disclosures imposes costs on a firm by raising the perceived information gap and, thus, making it harder for the firm to obtain external capital at reasonable costs (Healy et al., 1999; Sengupta, 1998). A potential solution to the problem based on the agency theory is to lower the risk imposed on the managers (e.g., Lambert, 1986). Interestingly, such a solution appears to characterize the D&O insurance process. Under the existing D&O policies, coverage is provided precisely to protect the personal wealth of officers and lower the officers’ exposure to third-party lawsuits. From this standpoint, abnormal coverage more fully insulates the officers from costs of lawsuits that stem from allegations that the firm inflated its estimates or issued overly optimistic outlook. The coverage, in effect, shields managers more fully from financial liability in the event of disclosure-related lawsuits. Under such conditions, managers will be less averse to providing more disclosures, including those that anticipate future events. In line with this view, we predict that abnormal coverage has a positive effect on the number of forward-looking statements in the MD&A section of their financial statements.
Aggressive investing activities
Another potential implication of abnormal coverage relates to investment activities. Officers are risk-averse by nature and tend to reject projects that put their wealth at risk, even when such projects have good profit potentials (Lambert, 1986). Agency literature predicts that officers will be encouraged to undertake risky projects if adequately compensated for the additional risk and effort (Smith & Watts, 1992). There is also evidence that managers put greater emphasis on enterprise actions and investments that have long-run profit potentials when their wealth (e.g., bonus) are shielded from the short-term effects of their actions (Dechow, Huson, & Sloan, 1994; Duru, Iyenhar, & Thevaranjan, 2002; Gaver & Gaver, 1995). Theoretical support for this view is provided by Lambert (1986) who shows that reducing the risk imposed on executives can enhance shareholder welfare by incentivizing the executives to seek out and select projects with high profit prospects. In the present case, abnormal D&O insurance provides greater assurance that the wealth of executives are not at risk in the event that the firm is sued for its investment activities. Under optimal contracting, such coverage that more fully insulates officers against legal penalties arising from the firm’s investment actions can be expected to act as an incentive for the executives to adopt more aggressive investment strategy. To the extent that this view describes the role of abnormal coverage, we expect a positive association between abnormal coverage and abnormal investments. The corresponding hypothesis is as follows:
Aggressive profit performance
We also examine the association between abnormal D&O coverage and profit performance. We focus on the possibility that abnormal coverage is provided as an extra inducement for officers to take actions that enhance profit performance. In an environment where directors and officers face increased risk of lawsuits for disappointing outcomes, risk-averse executives may be reluctant to take action when the risk of poor results is high. Jenter (2002), for example, shows that executives will be reluctant to provide effort, especially when they are uncertain about the impact of their effort on performance. Commenting on the risk imposed on executives by SOX, Carter et al. (2009) and Cohen et al. (2009) note that such risks alter the incentives among the executives to take actions that have great upside potentials. Given the potential profit effect of lowering risks on managers, a firm may increase the level of coverage as a means of reducing the officers’ risks and inducing actions that create value for shareholders. The key benefit to the firm is in raising the probability that projects with strong profit potentials are selected (Lambert, 1986). Application of this view to D&O insurance policy raises the prospect that abnormal D&O coverage is offered to motivate officers to devote greater effort toward generating information and selecting investments that have superior profit prospects. To the extent that D&O insurance plans function in this manner, abnormal D&O coverage will be positively associated with profit performance. The corresponding hypothesis is as follows:
Despite the optimal contracting view of abnormal coverage, a possibility exists that such coverage is driven by managerial opportunism. The managerial opportunism view assumes that directors and officers, in general, favor organizational systems that allow them to act in their self-interest, even when such actions undermine shareholders’ interests. Under this latter view, abnormal coverage is unlikely to have a positive effect on firm performance or on disclosure practices that reduce information asymmetry between the firm and outsiders.
Sample Selection
We begin our sample selection using the Lexis-Nexis search tool. In this respect, we search company filings, including Form 10-K, DEF-14, S-8, and 10-Q from 2004 to 2008 for D&O insurance disclosures using the key words “D&O,” “liability insurance,” “directors’ insurance,” “officers’ insurance,” “D&O insurance,” “directors’ liability,” “officers’ liability,” “D&O coverage,” “coverage limit,” and “liability coverage.” We begin data collection in 2004 to avoid possible discontinuities in the firms’ reporting/disclosure environment that may stem from the passage of the SOX of 2002. The filings compiled from the key word search are then read manually to identify those with valid D&O premium and coverage information. This procedure resulted in an initial sample of 449 firms.
To construct the test variables, we merge the hand-collected data with Compustat and Risk Metrics. Compustat is the source of financial data and Risk Metrics is the primary source of corporate governance variables. After merging the databases, we lose several observations due to missing governance data in the Risk Metrics. 3 To improve the sample size, we supplement the governance data from Risk Metrics with hand-collected data from the proxy statements (Form DEF 14). The hand-collected data include number of shares owned by the CEO, number of outside directors on the board, and total board size. Next, we obtain the number of shares held by institutions from Thompson–Reuters institutional holding data. Several firms are further dropped from the sample because they are foreign, traded over the counter, and mutual funds whose governance data and firm-specific data are missing. Our final sample consists of 196 firms.
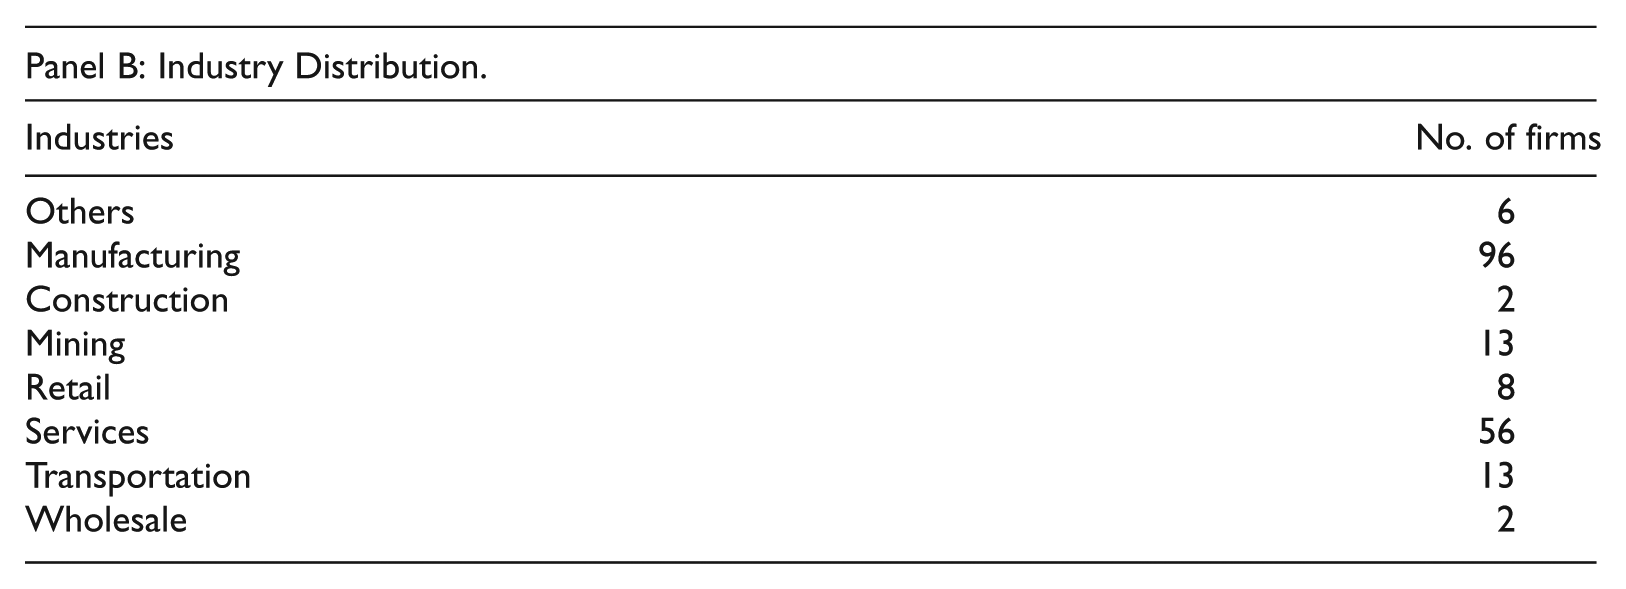
Panel A of Table 1 summarizes the sampling process and sources of data. Panel B presents the industry distribution of firms that disclose D&O insurance information. Notably, the sample firms are spread evenly across the industries. The manufacturing industry (Standard Industrial Classification [SIC] between 2,000 and 3,999) has the maximum number of firms (96), while the wholesale industry (SIC between 5,000 and 5,199) and construction industry (SIC between 1,500 and 1,999) have the minimum number of firms (only 2 firms). We further note that the sample contains 32 cross-listed firms and 3 firms incorporated in New York. In our tests, we identify the cross-listed firms because, as in Canada and the United Kingdom, reporting standards in the firms’ home countries may require the disclosure of D&O plans which, in turn, may “self-select” the firms. More important, the underlying features of abnormal coverage for the firms may differ in unspecified ways from those that characterize abnormal coverage for the U.S. firms. In addition, the State of New York requires the disclosure of D&O policies; thus, we identify the firms in our tests.
Sample Selection and Industry Distribution.

The total sample has 349 firm-year observations for 196 firms.
Our sample, however, differs in several respects with the sample used in Cao and Narayanamoorthy (2014). The sampling criteria in Cao and Narayanamoorthy are stringent and yield a sample of firms that are quite large compared with the size of firms in our sample. For instance, their test sample is based on surveys conducted by Tillinghast Towers-Perrin, which cover wider sample. Second, the sample in their study excludes smaller firms, especially those that are not on Risk Metrics, whereas, we hand-collected data for a sizable number of firms (43 firms) that are not on Risk Metrics. This latter sampling difference further biases our sample toward smaller firms. For example, the mean market capitalization of US$1,246 million and mean D&O coverage of US$26.75 million for our sample (Table 2) are small relative to US$2,079 million mean market capitalization and US$63.84 million mean coverage reported in Cao and Narayanamoorthy (Table 3). Our analysis, thus, suffers from size limitation with possible implications for the generalizability of the findings.
Descriptive Statistics and Correlation.

Note. Market Capitalization (PRCC_F × CSHO) and Total assets (AT) are measures of firm size and scale of operation; Coverage is the D&O insurance limit measured in million dollars; Abcoverage = abnormal coverage estimated as the residual from the regression of coverage level on the economic determinants of D&O coverage, based on Core (2000); Abcount = abnormal frequency of forward-looking statements estimated as the ratio of forward-looking statements to total sentences in the firm’s MD&A minus the average of the ratio for the previous 5 years; Abcountt+1 and Abcountt+2 are the 1-year-ahead and 2-years-ahead Abcount, respectively; Abxrd = abnormal research and development expenditures estimated as the ratio of R&D expense (XRD) to total assets (AT) minus the average of the ratio for the previous 5 years; Abxrdt+1 and Abxrdt+2 are the 1-year-ahead and 2-years-ahead Abxrd, respectively; Abcapx = abnormal capital expenditures estimated as the ratio of capital expenditures (CAPX) to total assets (AT) minus the average of the ratio for the previous 5 years; Abcapxt+1 and Abcapxt+2 are the 1-year-ahead and 2-years-ahead Abcapx, respectively; AROA = abnormal profits estimated as the ratio of earnings before interests and taxes (EBIT) to total assets (AT) minus the average of the ratio for the previous 5 years; AROAt+1 and AROAt+2 are the 1-year-ahead and 2-years-ahead AROA, respectively; ARET = abnormal returns estimated as the difference between 12 months holding returns, ending on the fiscal yearend and Center for Research in Security Prices (CRSP) value-weighted returns (vwret) for the year; ARETt+1 and ARETt+2 are the 1-year-ahead and 2-years-ahead ARET, respectively; D&O = Directors and Officers.

Note. Abcoverage+ = Positive abnormal D&O coverage; Abcoverage− = Negative abnormal D&O coverage; R&D = Ratio of R&D expense (XRD) to total assets (AT); CAPX = Ratio of capital expenditure (CAPX) to total assets (AT); MtB = Ratio of the market value of equity (PRCC_F × CSHO) to the book value (CEQ); ROA = Earnings before interest and tax (EBIT) divided by total assets (AT); OANCF = Operating cash flows (in millions); loss = 1 if firm has a loss (Income Before Extraordinary Items [IB] less than zero) in the current and prior year, and 0 otherwise; AT = Total assets (in millions). D&O = Directors and Officers.
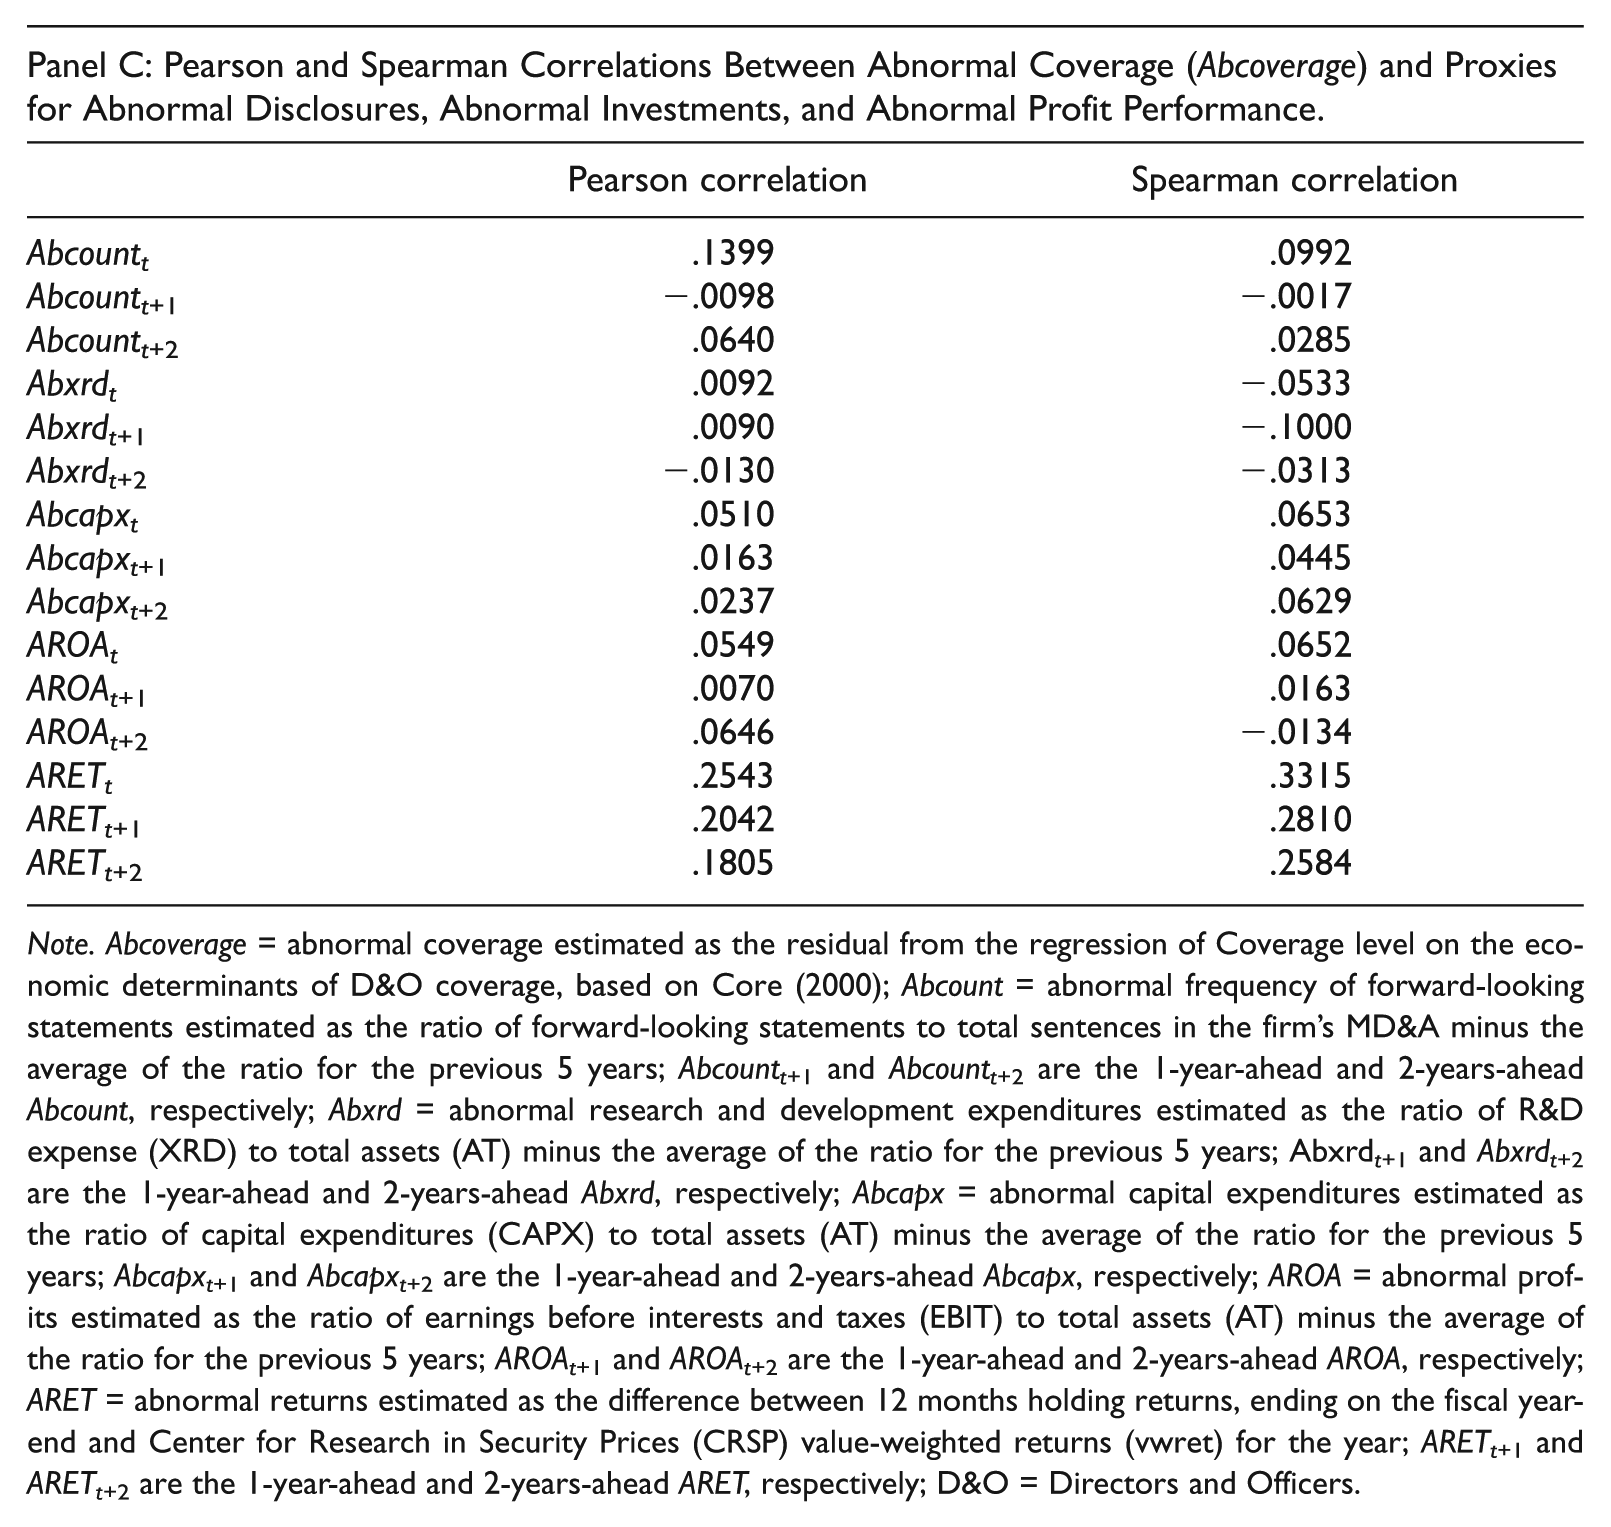
Note. Abcoverage = abnormal coverage estimated as the residual from the regression of Coverage level on the economic determinants of D&O coverage, based on Core (2000); Abcount = abnormal frequency of forward-looking statements estimated as the ratio of forward-looking statements to total sentences in the firm’s MD&A minus the average of the ratio for the previous 5 years; Abcountt+1 and Abcountt+2 are the 1-year-ahead and 2-years-ahead Abcount, respectively; Abxrd = abnormal research and development expenditures estimated as the ratio of R&D expense (XRD) to total assets (AT) minus the average of the ratio for the previous 5 years; Abxrdt+1 and Abxrdt+2 are the 1-year-ahead and 2-years-ahead Abxrd, respectively; Abcapx = abnormal capital expenditures estimated as the ratio of capital expenditures (CAPX) to total assets (AT) minus the average of the ratio for the previous 5 years; Abcapxt+1 and Abcapxt+2 are the 1-year-ahead and 2-years-ahead Abcapx, respectively; AROA = abnormal profits estimated as the ratio of earnings before interests and taxes (EBIT) to total assets (AT) minus the average of the ratio for the previous 5 years; AROAt+1 and AROAt+2 are the 1-year-ahead and 2-years-ahead AROA, respectively; ARET = abnormal returns estimated as the difference between 12 months holding returns, ending on the fiscal yearend and Center for Research in Security Prices (CRSP) value-weighted returns (vwret) for the year; ARETt+1 and ARETt+2 are the 1-year-ahead and 2-years-ahead ARET, respectively; D&O = Directors and Officers.
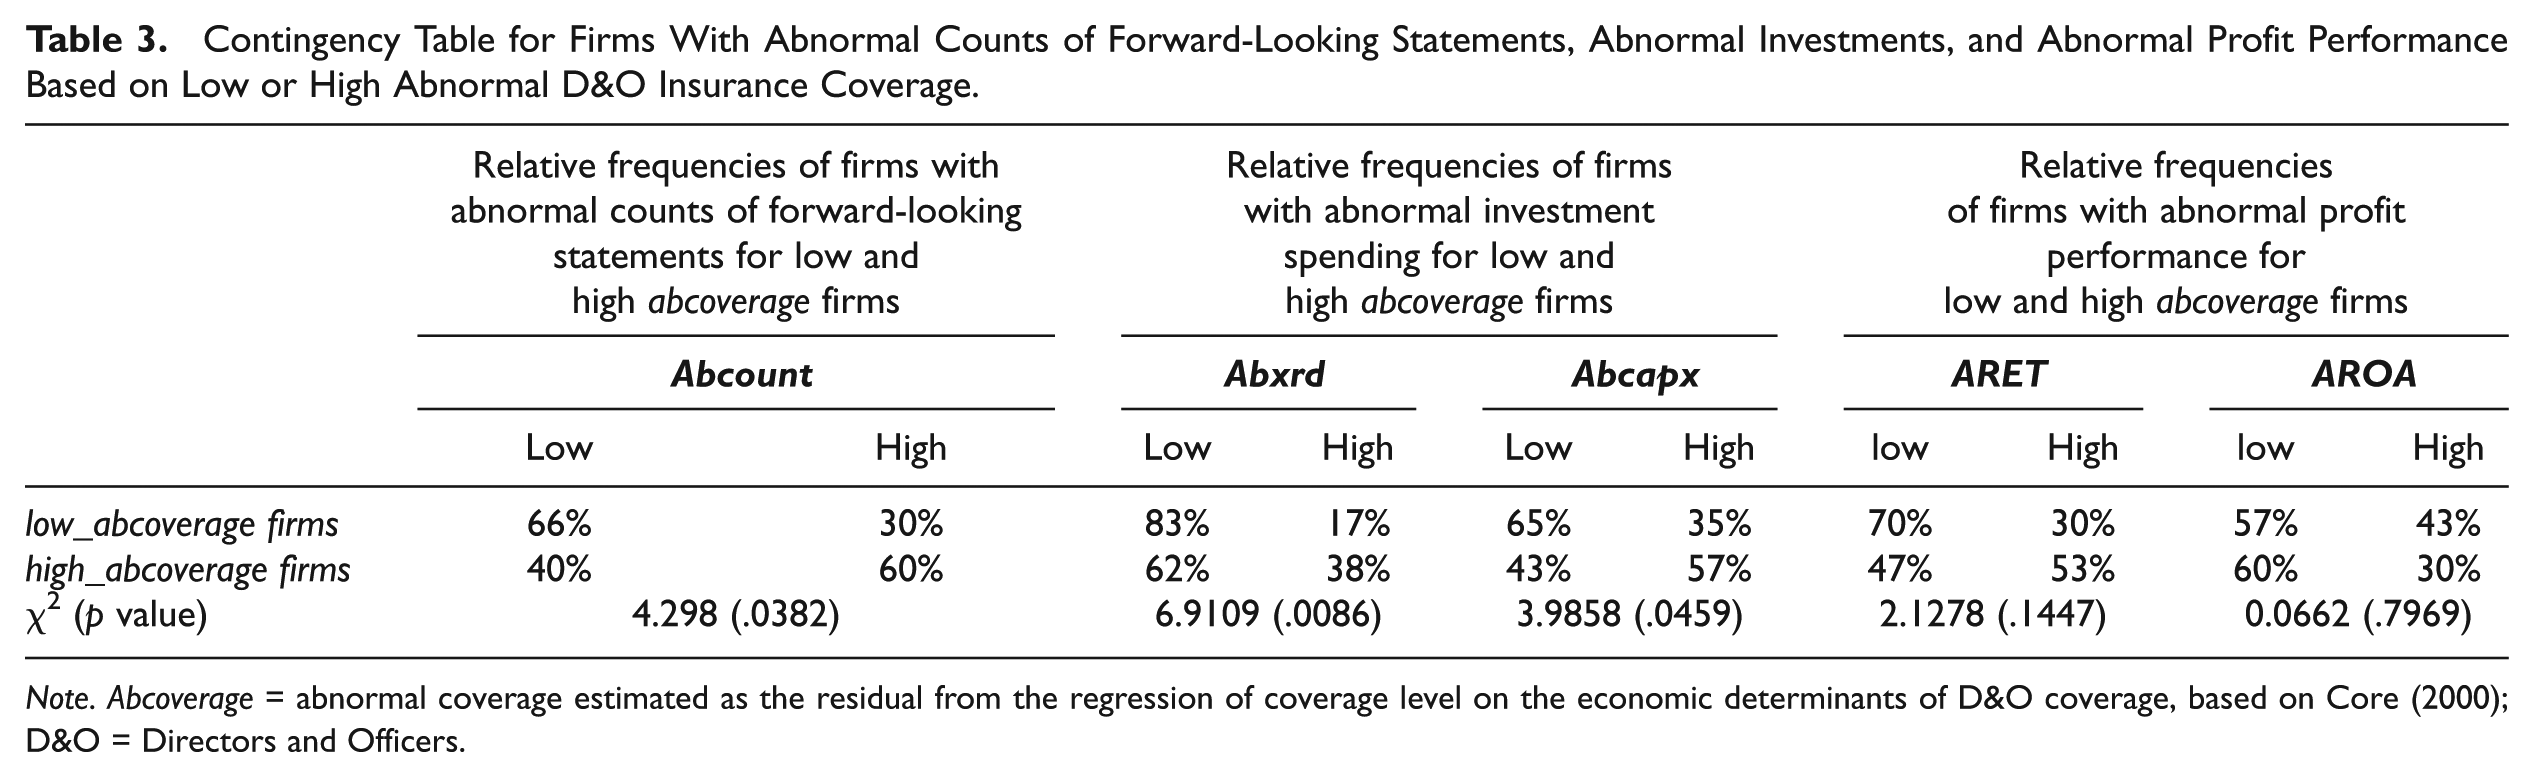
Contingency Table for Firms With Abnormal Counts of Forward-Looking Statements, Abnormal Investments, and Abnormal Profit Performance Based on Low or High Abnormal D&O Insurance Coverage.
Note. Abcoverage = abnormal coverage estimated as the residual from the regression of coverage level on the economic determinants of D&O coverage, based on Core (2000); D&O = Directors and Officers.
Research Design
Abnormal Coverage Model
To test the performance effect of abnormal coverage, we first estimate abnormal coverage using the Core (2000) model. The model expresses D&O coverage as a function of a firm’s litigation risk. Sarath (1991), however, examines litigation–insurance relation and observes that when there is uncertainty in the litigation process, litigation may be determined in part by the principal’s beliefs about the damage award that will accrue from suing the agent (see also Rosen, 1998). In the context of D&O insurance, the analysis suggests that the level of coverage can influence shareholders’ perception of settlement that can accrue from litigation and, in that manner, affect the firm’s litigation risk. Potential endogeneity, thus, exists in the coverage–litigation relation. To control for this possibility, we adopt a two-stage regression method. In the first stage, we obtain a fitted lawsuit risk via a probit model that expresses lawsuit risk as a function of coverage and industry exposure to litigation. The model is given as follows:

Lawsuit equals 1 if a firm has been sued in the past 3 years, and 0 otherwise. This proxy for lawsuit risk is motivated by Romano (1991) who reports that firms with prior lawsuits, generally, have higher litigation risk due to the negative reputation that trails prior lawsuits. Several studies also use prior lawsuits as a proxy for the likelihood of lawsuit (e.g., Field, Lowry, & Shu, 2005; Johnson, Nelson, & Pritchard, 2007; Kim & Skinner, 2012). As an alternative, we replace the 1/0 indicator with a litigation risk index derived from a vector of variables noted to affect a firm’s legal exposure (see “Control for self-selection: The Heckman model” section). Results based on this latter proxy for lawsuit risk (not reported for brevity) are qualitatively similar to those based on 1/0 indicator of firms that are sued/not-sued previously. Coverage is the natural log of the level of coverage; Ind_exposure equals 1 if a firm operates in highly litigious industries based on the classification by Francis, Philbrick, and Schipper (1994), and 0 otherwise. The industries noted to have high legal exposure include biotech (SIC codes 2833-2836 and 8731-8734), computer (3570-3577 and 7370-7374), electronics (3600-3674), or retail (5200-5961). The fitted value of Lawsuit, Pred_Lawsuit, is input in the coverage model.
In the second model, we regress Coverage on Pred_lawsuit and other measures of risk noted to affect insurance. The model is given as follows:

where Size = natural log of total assets and captures the litigation risk associated with the scope and complexity of a firm’s operations; MVE = natural log of the market value of equity and captures the litigation risk associated with the net benefits of shareholder lawsuit; MtB = ratio of the market value of equity to book value of equity and reflects the litigation risk linked to a firm’s growth activities; Acquiror is an indicator of acquisition activity set to 1 if the firm’s assets increase by 10% compared with the previous year, and 0 otherwise; following O’Sullivan (2002), we include the ratio of inventory to total assets, INVtAT, as our proxy for distress risk. Loss and ROA are accounting profit measures predicted to affect litigation risk (Core, 1997; O’Sullivan, 2002); Loss equals 1 for firms that experience a loss in the current or previous year, and 0 otherwise; ROA is the return on assets calculated as ratio of earnings before interest and taxes to total assets. We also include another indicator of lawsuit risk, Ret_vol, that equals the standard deviation of monthly stock returns for 12 months ending on the month of fiscal yearend.
Leverage, Lev, is the ratio of total debt to equity; it is included on the premise that highly levered firms are less vulnerable to shareholder lawsuits (Kim, 2005). We include a 1/0 indicator of firms with/without earnings restatement (Restatement) in the current or prior year to control for lawsuit risk linked to accounting risk (e.g., Cao & Narayanamoorthy, 2014). Shareholder lawsuit is also linked to prior settlements. Hence, we include the logarithm of total settlement (Settlement) in the past 5 years. Following Kim and Skinner (2012), we include sales growth (Sgrowth) and exchange listing (New York Stock Exchange [NYSE]) to control for the associated litigation risk. We measure Sgrowth as change in sales scaled by lagged sales; NYSE is set to 1 if the firm is listed on the NYSE, and 0 otherwise. For governance risk, we include three variables—the proportion of outside directors on the board (Outdir); CEO duality (Dual) that equals 1 if the CEO is also chairman of the board, and 0 otherwise; and CEO ownership (CEO_own) computed as the log of the proportion of shares held by the CEO. The residual, ϵ, estimated as actual coverage minus the fitted value based on (1b) is our proxy for abnormal coverage, Abcoverage.
Control for Self-Selection: The Heckman Model
To test our three hypotheses, we focus on firms that disclose D&O coverage information. Because disclosure of D&O insurance is voluntary, the analysis omits valuable information about other insured firms that choose to not disclose their coverage information. To control for the self-selection bias, we first obtain the inverse Mills ratio (MILLS) via the Heckman (1979) procedure and include the ratio in models that test the impact of D&O coverage on firm activity and performance. In particular, we run a probit model that expresses the disclosure of D&O insurance plan as a function of several factors noted to influence voluntary disclosure. Following the literature on voluntary disclosure, we express the disclosure choice as a function of the level of competition in a firm’s labor market, threat of lawsuit, strength of internal governance, cross-listing status, and state of incorporation. 4
Competition
A firm may withhold its D&O insurance information out of concern that its strategic opponents may exploit such information to lure key officers of the firm. Such concern can be strong in industries with intense competition for skilled officers. To measure competition in the market for officers/directors, we use a proxy for competition in a firm’s product market. We assume that firms facing strong competition in their product markets will compete intensely for talented officers. In other words, we expect competition in the product market to correlate highly with the demand for talented officers. Hence, we set an indicator, HINDEX, to equal 1 if a firm is in the top quintile of Herfindahl–Hirschman Index, and 0 otherwise. Herfindahl–Hirschman Index is the market share for the four largest firms in the firm’s four-digit SIC.
Litigation risk
To index litigation risk, we draw from Kim and Skinner (2012) and define a firm’s exposure to litigation in terms of the firm’s financial performance, financial distress status, growth opportunities, and reporting quality. We use ROA and Altman (1968) z score as proxies for a firm’s financial performance and distress, respectively. Proxies for growth opportunities are ratio of working capital to total assets (WC), market-to-book ratio (MtB), R&D intensity (XRD) defined as the ratio of R&D costs to total assets, and fixed investments (PPE) defined as the ratio of property, plant, and equipment to total assets. Next, we include the ratio of goodwill to total assets (Goodwill) to control for the possible effects of merger and acquisition activity on litigation risk. Our proxy for reporting quality is discretionary accruals (DAC) estimated as the residual from cross-sectional regression of total accruals on the determinants of accruals based on the modified Jones model. We also include leverage (Lev) on the argument that it is negatively associated with shareholder lawsuit (Kim, 2005).
To incorporate the various dimensions of litigation risk, we convert each proxy discussed above into a 1/0 indicator of high/low litigation risk and sum the binary scores into an aggregate measure of a firm’s litigation risk. We use the formula, LIT = LIT_ROA + LIT_Z-Score + LIT_WC + LIT_MtB + LIT_XRD + LIT_PPE + LIT_Goodwill + LIT_ DAC + LIT_Lev where, for every firm-year, each indicator to the right of the formula, except LIT_ROA and LIT_Lev, is equal to 1 if the value of the corresponding variable is greater than the median value for firms in the same two-digit SIC code, and 0 otherwise. For example, LIT_ROA for a firm-year is set to 1 if ROA for the firm-year is lower than the industry median; similarly, LIT_Lev for a firm-year equals 1 if Lev for the firm-year is lower than the industry median.
Although litigation risk is determined by the factors noted above, there is evidence that large firms are at higher risk of lawsuits. Baker and Griffith (2007b) note that large firms attract more lawsuits because they attract more attention in the press and offer higher payoffs for plaintiffs’ lawyers. Alexander (1991) and Bohn and Choi (1996) similarly observe that plaintiffs often target large firms because of the latter’s ability to pay. The Watson–Wyatt (Watson Wyatt Worldwide, 1997) survey affirms this view and shows that firms with assets less than US$100 million had 12% susceptibility, whereas firms with assets greater than US$10 billion had 63% susceptibility to claims against their directors or officers. Based on this view, we include Size as another determinant of litigation risk.
Internal governance
A number of studies report that corporate governance plays a role in improving corporate transparency. These studies argue that firms with strong governance disclose both voluntary and mandatory information on time. Two governance factors noted to have a consistent effect on disclosure are the presence of independent directors (Barako, 2007) and CEO ownership (Craswell & Taylor, 1992; Hossain, Lin, & Adams, 1994; Raffournier, 1995). Thus, we include the proportion of outside directors on the board (Outdir) and CEO ownership (CEO_own) measured as the log of the proportion of shares held by the CEO.
Cross-listing status and state of incorporation
Core (1997, 2000), Boyer (2005), and O’Sullivan (1997, 2002) document that firms incorporated in countries such as Canada and the United Kingdom must disclose D&O insurance in their financial statements. Such firms may continue to provide the same disclosures in their filings with the SEC. To control for such effects, we include an indicator variable, Crosslist, set to 1 for firms cross-listed in the United States, and 0 otherwise. We also control for firms incorporated in New York because the state law requires such firms to disclose their D&O coverage (Linck et al., 2009). The indicator variable, State, is set to 1 if the firm is incorporated in New York, and 0 otherwise. The disclosure model is given as follows:

Disclose is an indicator variable that takes a value of 1 if the firm discloses D&O insurance, and 0 otherwise. The remaining variables are as defined above. The residuals obtained from the probit model are used to construct the inverse Mills ratio (MILLS) that reflects the effects of all unmeasured characteristics related to coverage disclosure.
Aggressive Reporting Behavior
To examine the relationship between abnormal D&O insurance and the firm’s aggressive reporting behavior, we use firm’s forward-looking disclosure in MD&A to proxy for firm’s reporting behavior. To identify the forward-looking statements, we download Form10-K from the Lexis-Nexis database. Next, we identify the MD&A section for each firm-year. We then use the Perl program to index the forward-looking statements. We use key phrases such as “believe,” “estimate,” “anticipate,” “plan,” “predict,” “may,” “hope,” “can,” “will,” “should,” “expect,” “intend,” “is designed to,” “with the intent,” and “potential” to identify prospective forward-looking statements. To identify a statement, we use notations such as “period,” “question mark,” and “exclamation mark.” This procedure yields counts of forward-looking statements for each firm-year. We further obtain total counts of all statements in the MD&A for each firm-year and define a variable, Count, as the ratio of forward-looking statements to total statements.
Next, we estimate abnormal counts of forward-looking statements, Abcount, thus, Abcount = Count − E(Count), where E(Count) is the expected count calculated as the mean Count for the prior 5 years. We then regress Abcount on abnormal coverage and several control variables noted to influence the disclosure of forward-looking statements including firm size (Size), profit performance (ROA), incidents of loss (Loss), merger and acquisitions (MnA), and operating risk (ROA_vol) that equals the standard deviation of the return on assets for the previous 5 years (see Li, 2010; Muslu, Radhakrishnan, Subramanyam, & Lim, 2011, for the influence of these factors on the disclosure of forward-looking statements).
There is also a possibility that litigation and a firm’s reporting behavior are jointly determined (e.g., Field et al., 2005). This possibility arises because it is unclear that protection from litigation costs via abnormal coverage leads firms to provide greater forward-looking statements or that the need for supplementary information leads firms to provide higher coverage. To mitigate possible simultaneity problem, we include a lagged value of Abcount (Abcountt−1) in the model. The model is given as follows:

For our test, we focus on α1 that captures the effect of abnormal coverage on abnormal coverage; we expect the coefficient to be positive and significant to the extent that abnormal coverage is associated with greater amounts of forward-looking statements.
Abnormal D&O Coverage and Aggressive Investing Activities
To test the effect of abnormal coverage on investments, we regress abnormal capital expenditures (Abcapx) and abnormal R&D expenses (Abxrd) alternately on abnormal coverage and several control variables. Abcapx (Abxrd) is the difference between yearend capital expenditures (R&D expenses) and average capital expenditure (average R&D expenses) for the past 5 years. The control variables are Size, MtB, and ROA and are expected to be positively associated with investments (Coles, Daniel, & Naveen, 2006; Du & Lin, 2011). We control for possible simultaneity between abnormal coverage and aggressive investments by adding the lagged value of abnormal investment. This follows from the possibility that, on one hand, firms use abnormal coverage to encourage aggressive investments and, on the other hand, firms buy abnormal coverage in response to their aggressive investment policy. The model is given as follows:

where Abinvest = (Abcapx or Abxrd). The slope, b1, on our main test variable will be positive to the extent that Abcoverage is associated with abnormal spending on the investment variable.
Abnormal Firm’s Profit Performance
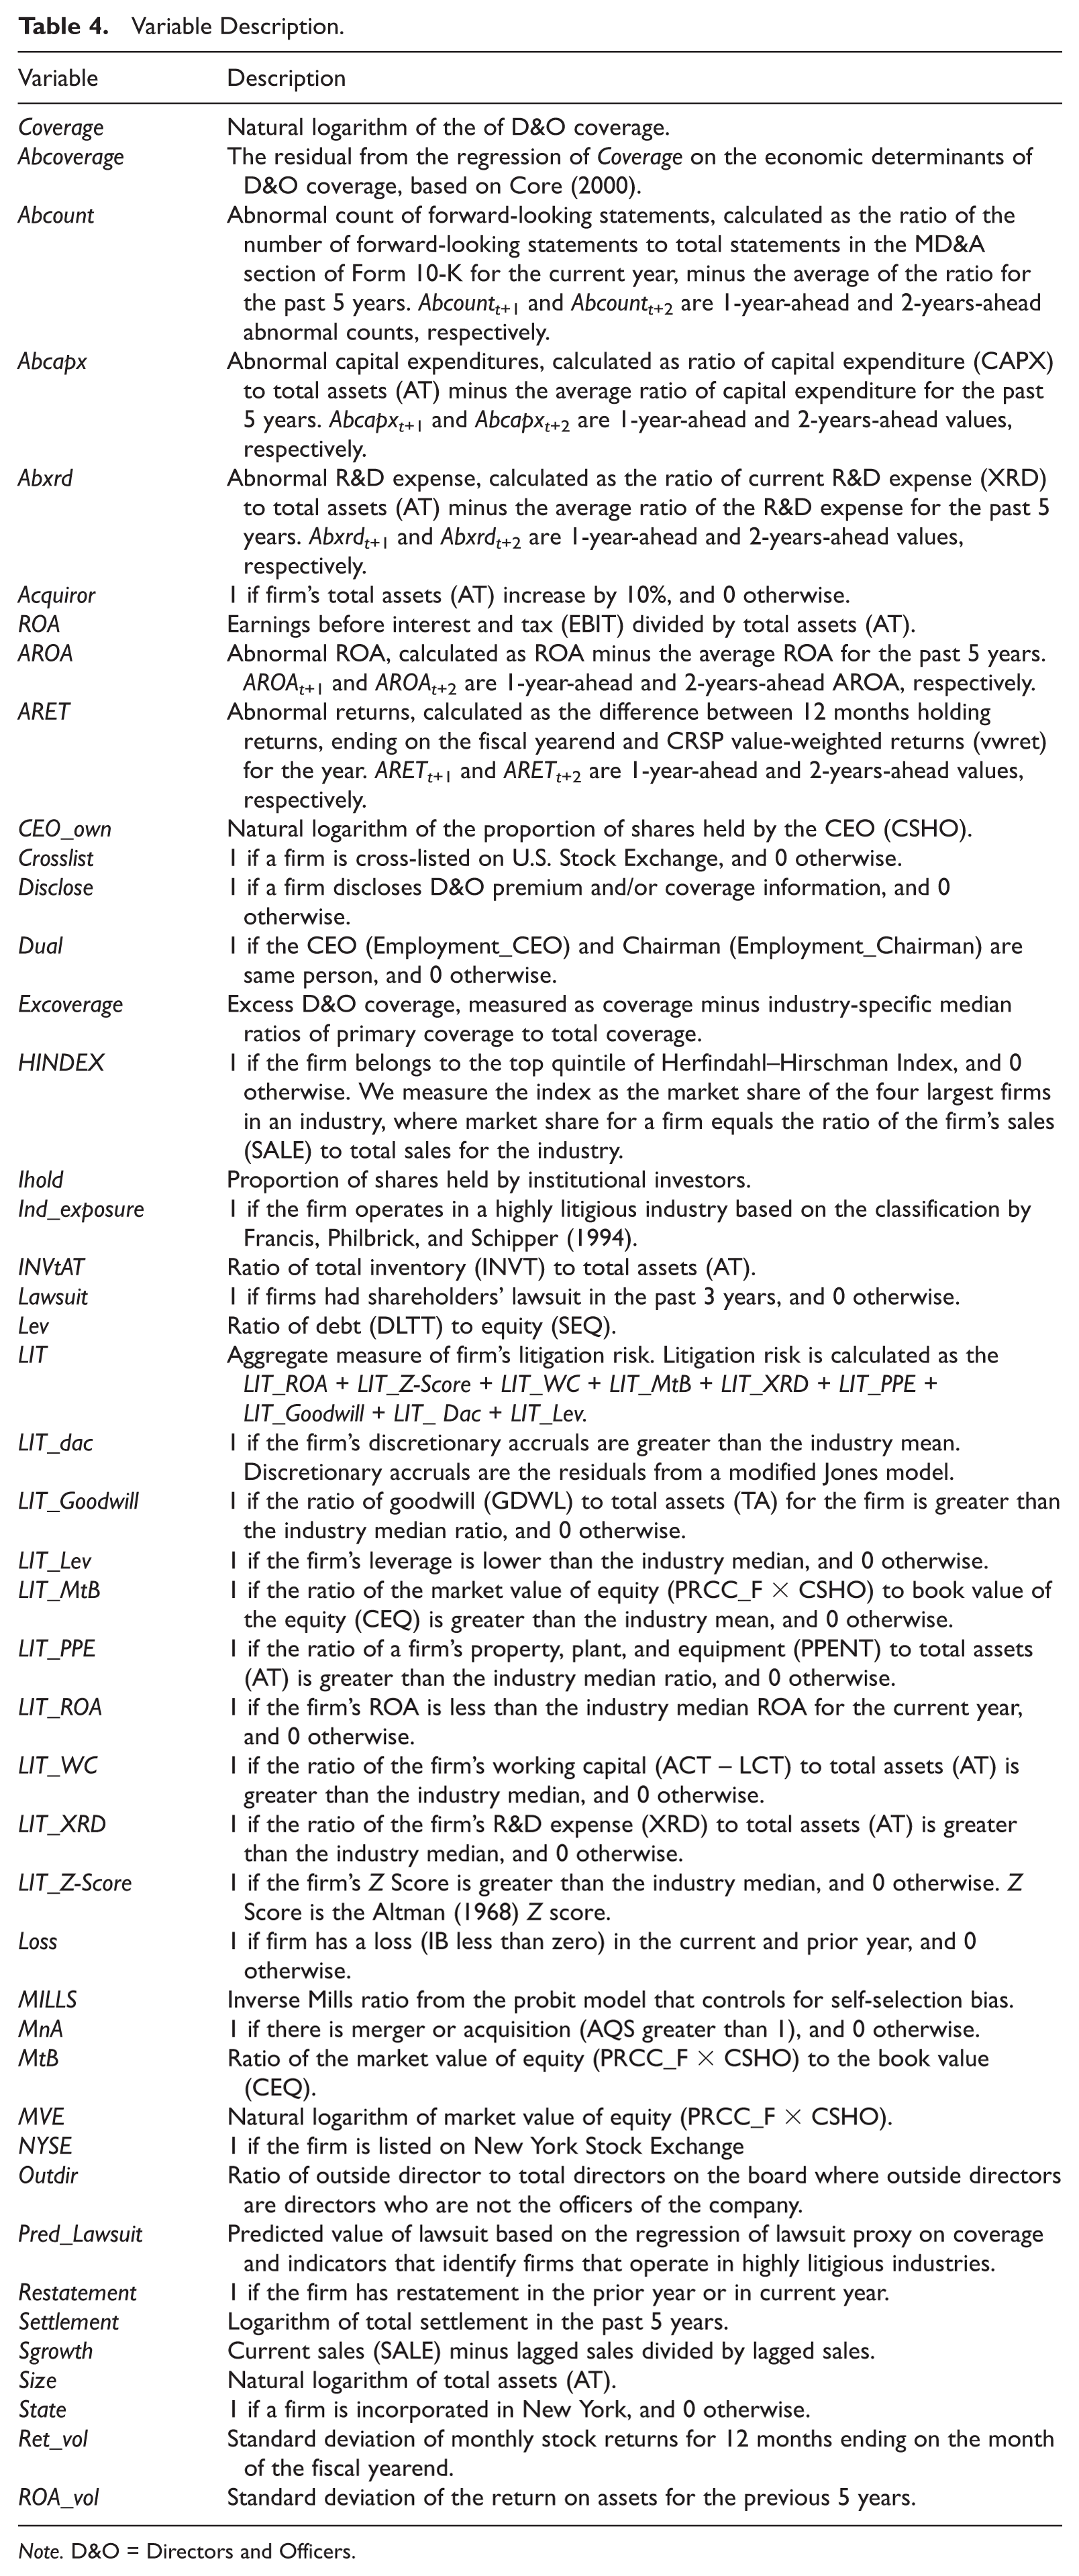
To assess the impact of abnormal coverage on profitability, we regress two measures of abnormal profit performance—abnormal return on asset (AROA) and abnormal stock returns (ARET)—on abnormal coverage. AROA is the difference between yearend ROA and average ROA for the past 5 years; ARET is the difference between 12 months holding returns, ending on the fiscal yearend and Center for Research in Security Prices (CRSP) value-weighted returns (vwret) for the year. Our model includes several control variables that affect profits and stock returns—firm size (Size), market-to-book ratio (MtB), and corporate governance. Our proxies for corporate governance are the proportion of shares held by the CEO (CEO_own), proportion outside directors on the board (Outdir), 1/0 indicator of whether the CEO is also chairman of the board (Dual), and proportion of shares held by institutions (Ihold) (see the description of variables in Table 4). The model is given as follows:

where Aprofit = AROA or ARET. g1 evaluates the impact of abnormal coverage on Aprofit; it will be positive to the extent that abnormal coverage has a positive effect on profit performance.
Variable Description.
Note. D&O = Directors and Officers.
Results
Univariate Analysis
In Panel A of Table 2, we present the descriptive statistics for the main variables. Notably, the sample comprises large and medium-sized firms: The mean (median) total assets and market capitalization are US$1.98 billion (US$215 million) and US$1.25 billion (US$172.14 million), respectively. The mean (median) coverage is US$26.75 million (US$20 million), which is close to the mean (median) value of US$30.73 million (US$20 million) in the 2007 survey report by Tillinghast Towers-Perrin. The mean (median) abnormal coverage of 0.0497 (−0.0793) is derived from the regression residuals. The mean (median) Abcountt is 0.0081 (0.0055). The mean (median) value of Abxrdt is negative (zero) for all 3 test years; the value of Abxrdt is, however, positive for the upper half of the observations. The mean of abnormal capital expenditures is positive for all 3 test years. Similarly, the mean and median profits are positive for all 3 test years.
The median abnormal coverage is negative, which indicates that a higher proportion of the firms have D&O coverage below the predicted normal coverage. Under the efficiency view of D&O insurance, abnormally low coverage is expected to identify firms with poor profit prospects and/or absence of profitable investment projects, and conversely. Although we do not pursue the issue in this article, we compare our key profit and investment measures between the two groups of firms for some insights into factors that distinguish firms with positive and negative abnormal coverage. The results are in Panel B of Table 2. In general, both groups of firms are similar in terms of their investment spending (CAPX and abnormal R&D) and market-to-book ratio. However, the firms with positive abnormal coverage are more profitable, possess stronger cash flow power, and are larger.
Panel C presents the Pearson and Spearman correlations between the Abcoverage and the main test variables—abnormal disclosure, abnormal investing activity, and abnormal profit performance. With Abcountt, the Pearson (Spearman) correlation is .1399 (.0992). With Abxrdt and Abcapxt, the correlations are .009 (−.0533) and .0510 (.0653), respectively. The correlations are also positive for AROAt (Pearson corr. = .0549; Spearman corr. = .0652) and for ARETt (Pearson corr. = .2543; Spearman corr. = .3315), Overall, the univariate results show that abnormal coverage is positively correlated with more aggressive disclosure of forward-looking statements, higher investment spending, and higher profit performance.
In another preliminary test of the possible impact of D&O coverage on firm activities and profit performance, we present a contingency table of the relative frequencies of high and low disclosure of forward-looking statements, high and low investments, and high and low profit performance for High-coverage and Low-coverage firm-years. High (low) disclosure group comprises firm-years in the upper (bottom) 25% of all observations ranked by Abcount; High (low) investment group comprises firm-years in the upper (bottom) 25% of all observations ranked by Abinvest; High (low) profit group comprises firm-years in the upper (bottom) 25% of all observations ranked by Aprofit. High-coverage (Low-coverage) group identifies firm-years in upper (bottom) 25% of all observations ranked by Abcoverage. Table 3 shows the results.
Generally, the level of coverage affects all three factors—disclosure of forward-looking statements, investment spending, and profit performance. Firms with low coverage, on average, provide fewer forward-looking statements and have lower levels of investments, in line with the argument that inadequate coverage discourages officers from taking actions that impose lawsuit risk. A majority of such firms also exhibit lower profitability. However, a majority of firms with higher abnormal coverage provide more forward-looking statements, spend more on capital projects, and exhibit higher abnormal returns. Altogether, this preliminary analysis suggests that abnormal coverage affects not only firms’ disclosure and investment activities but also their profit performance, in line with optimal contracting view of abnormal D&O insurance.
Multivariate Analysis
Abnormal coverage result
Table 5 reports the results from estimating the model of Coverage. The effect of factors previously shown to affect litigation risk is generally positive. For example, Pred_Lawsuit, Size, MVE, and MtB are positively associated with Coverage. As in Kim (2005), INVtAT (Lev) loads positively (negatively) on Coverage. Loss also loads positively on coverage. The slope for Ret_vol is insignificant. This result may be related to the presence of Pred_Lawsuit and Loss that may encompass the litigation exposure that derives from return volatility. Prior restatement loads positively on coverage, although the effect is not significant. The coefficient on CEO_own is positive and NYSE firms also tend to purchase higher coverage; the coefficients on the remaining variables are indistinguishable from 0.
Regression Analysis of the Determinants of D&O Insurance Coverage.

Note. Coverage is the natural log of D&O coverage; Size is the logarithm of total assets (AT); MVE is the logarithm of market value of equity (PRCC_F × CSHO); MtB is the ratio of market value of equity (PRCC_F × CSHO) to book value of equity (CEQ); Acquiror is 1 if firm’s assets (AT) increase by 10%, and 0 otherwise; INVtAT is the ratio of total inventory (INVT) to total assets (AT); Loss is 1 if firm has negative earnings (IB less than zero) in the current and prior year, and 0 otherwise; ROA is the ratio of earnings before interest and tax (EBIT) to total assets (AT); Ret_vol is standard deviation of monthly stock returns for 12 months ending on the month of the fiscal yearend; Lev is the ratio of debt (DLTT) to shareholders’ equity (SEQ); Pred_Lawsuit is the predicted value of lawsuit where lawsuit is regress on coverage and indicator variables that identify firms that operate in industries that are prone to litigation; Restatement is 1 if the firm restated earnings in the prior and current year; Settlement is the logarithm of total settlements in the past 5 years; Sgrowth is change in sales scaled by the lagged sales; NYSE takes value 1 if the firm is listed on the New York Stock Exchange, and 0 otherwise; Outdir is proportion of outside directors on board; Dual is 1 if CEO (Employment_CEO) and Chairman (Employment_Chairman) are the same individual; CEO_own = proportion of shares held by CEO; D&O = Directors and Officers; NYSE = New York Stock Exchange.
Heckman model result
The results of the probit model we use to construct the MILLS ratio are in Table 6. The slopes on measures of competition, litigation risk, and firm size are all negative and significant (p < .01). These results confirm prior evidence that competition, litigation risk, and firm size generally create disincentive for disclosure. The slope on Outdir is 1.065, which affirms the view that firms with strong internal governance provide greater disclosure of D&O coverage. Crosslist and State are positive and significant at 1%. We use the residual from the model to compute the inverse Mills ratio, MILLS.
Probit Model to Obtain Inverse Mills Ratio.

Note. The dependent variable Disclose takes value 1 if the firm discloses D&O insurance. The independent variables are the choice variables. Disclose = 1 if firm disclosed D&O insurance premium, coverage, or both, and 0 otherwise. HINDEX = 1 if the firm belongs to top quintile of Herfindahl–Hirschman Index, and 0 otherwise; LIT = aggregate litigation risk. Litigation risk is calculated as the LIT_ROA + LIT_Z-Score + LIT_WC + LIT_MtB + LIT_XRD + LIT_PPE + LIT_GOODWILL + LIT_DACC + LIT_LEV; Size = logarithm of total assets (AT); Outdir = proportion of outside directors on the board; CEO_own = proportion of shares held by the CEO; Crosslist = 1 if firms are cross-listed on U.S. Stock Exchange, and 0 otherwise; State = 1 if firms are incorporated in New York, and 0 otherwise; D&O = Directors and Officers.
Aggressive firm reporting behavior
In Table 7, we present the results of the impact of abnormal coverage on firms’ reporting behavior. Consistent with H1, the association between Abcount and Abcoverage is positive and significant (Coeff. = 0.006; p < .05). This result obtains after we control self-selection bias, simultaneity, and other factors noted to affect the disclosure of forward-looking statements. As an additional analysis, we re-run Model 3 using Abcountt+1 and Abcountt+2 alternately to test the impact of abnormal coverage on future-period disclosures. The results, presented in columns 2 and 3 of Table 7, show that Abcoverage has a positive, although insignificant, effect on future-period Abcount. In general, the results suggest that abnormal coverage motivates managers to provide more aggressive disclosures of forward-looking statements.
To test the robustness of the above results, we obtain a different proxy for Abcoverage. Typically, total coverage for a firm comprises primary coverage and one or more secondary layers viewed collectively as excess coverage. When there is a claim, the primary coverage is exhausted before any payments under excess coverage (Baker & Griffith, 2007b), leading to a view that this coverage type reflects managerial opportunism (Chung & Wynn, 2008). Our analysis in this respect sheds light on the extent to which the excess coverage is in line with rent extraction. Firms, however, rarely provide disaggregated data on the layers. However, with access to proprietary data on D&O insurance, Cao and Narayanamoorthy (2014) report industry-specific median ratios of primary coverage to total coverage. Using the ratios, we estimate excess coverage, Excoverage, for each firm-year in our sample as the actual coverage minus the median primary coverage implied by the ratio. We then replace the regression-based abnormal coverage with the excess coverage and re-estimate Model 3. The results are in Panel B of Table 7.
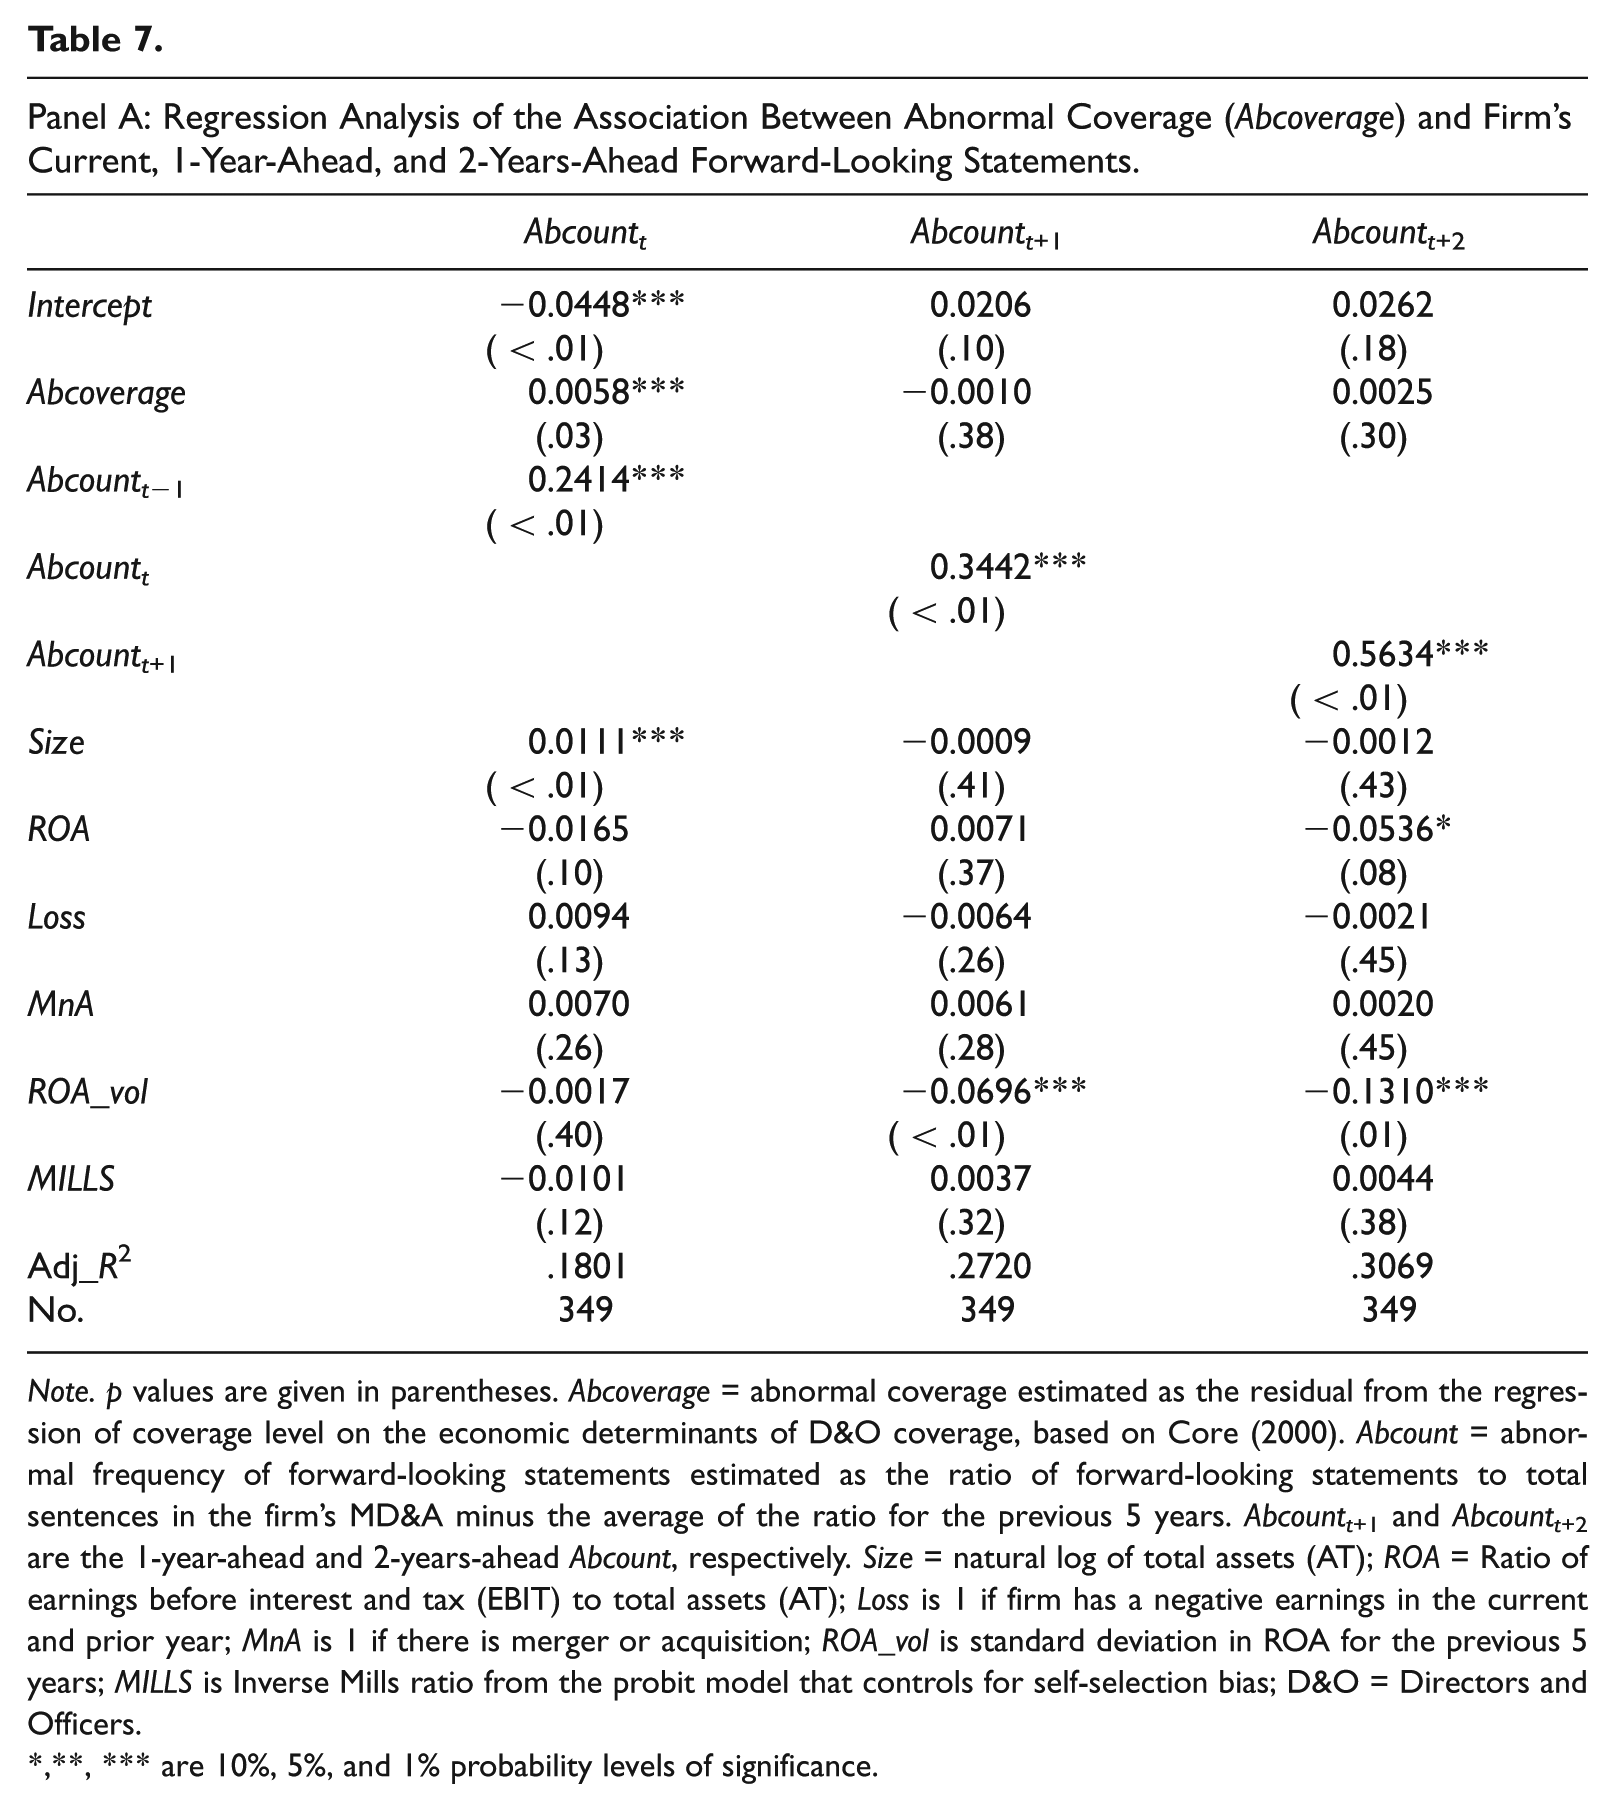
Note. p values are given in parentheses. Abcoverage = abnormal coverage estimated as the residual from the regression of coverage level on the economic determinants of D&O coverage, based on Core (2000). Abcount = abnormal frequency of forward-looking statements estimated as the ratio of forward-looking statements to total sentences in the firm’s MD&A minus the average of the ratio for the previous 5 years. Abcountt+1 and Abcountt+2 are the 1-year-ahead and 2-years-ahead Abcount, respectively. Size = natural log of total assets (AT); ROA = Ratio of earnings before interest and tax (EBIT) to total assets (AT); Loss is 1 if firm has a negative earnings in the current and prior year; MnA is 1 if there is merger or acquisition; ROA_vol is standard deviation in ROA for the previous 5 years; MILLS is Inverse Mills ratio from the probit model that controls for self-selection bias; D&O = Directors and Officers.
,**, *** are 10%, 5%, and 1% probability levels of significance.
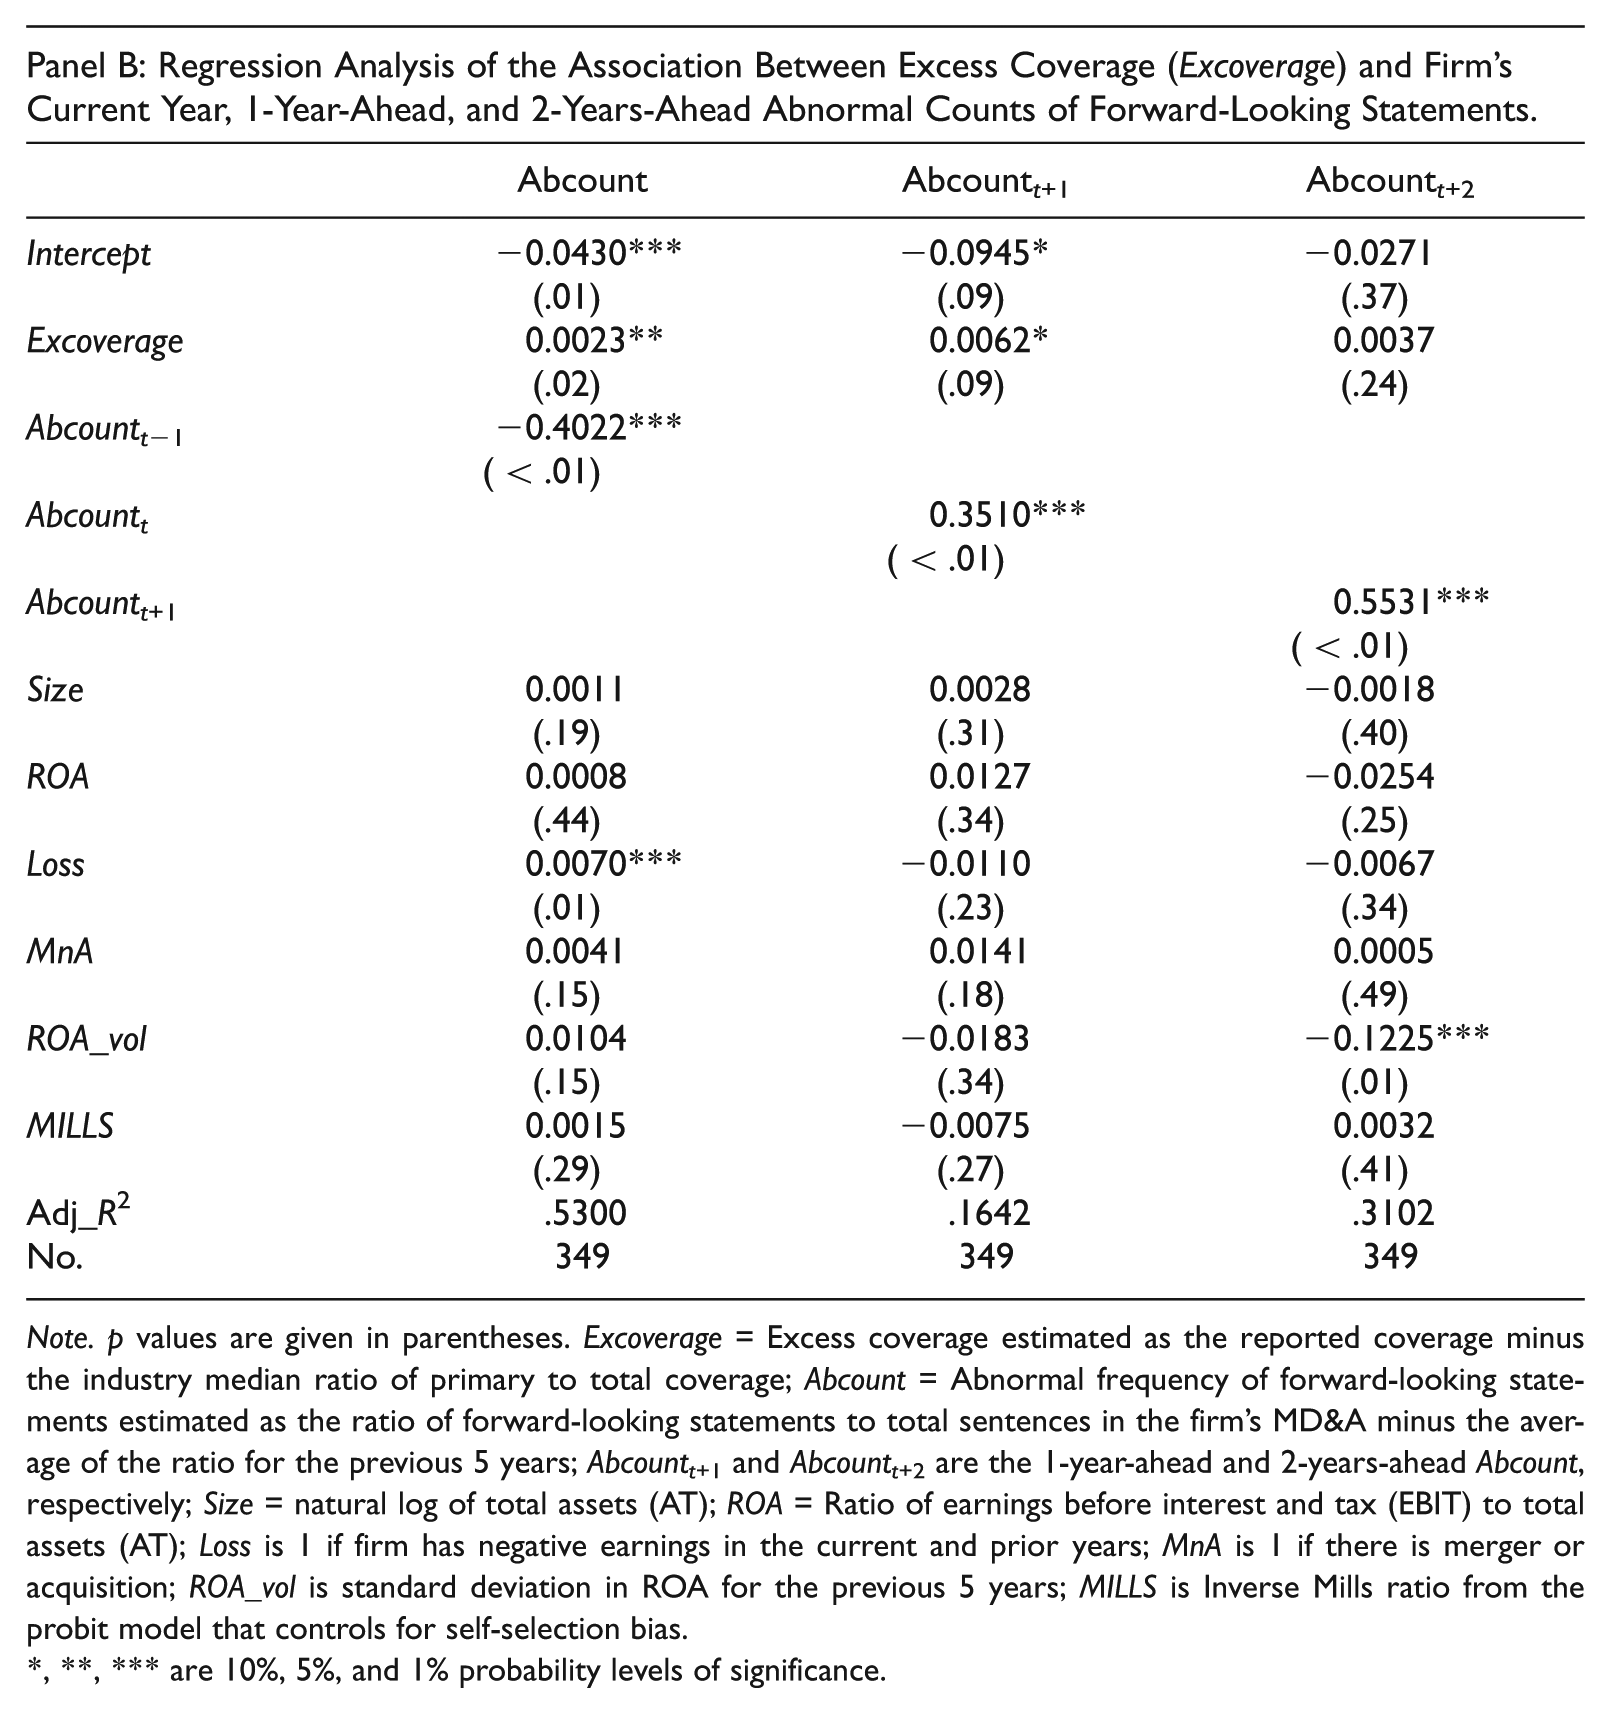
Note. p values are given in parentheses. Excoverage = Excess coverage estimated as the reported coverage minus the industry median ratio of primary to total coverage; Abcount = Abnormal frequency of forward-looking statements estimated as the ratio of forward-looking statements to total sentences in the firm’s MD&A minus the average of the ratio for the previous 5 years; Abcountt+1 and Abcountt+2 are the 1-year-ahead and 2-years-ahead Abcount, respectively; Size = natural log of total assets (AT); ROA = Ratio of earnings before interest and tax (EBIT) to total assets (AT); Loss is 1 if firm has negative earnings in the current and prior years; MnA is 1 if there is merger or acquisition; ROA_vol is standard deviation in ROA for the previous 5 years; MILLS is Inverse Mills ratio from the probit model that controls for self-selection bias.
, **, *** are 10%, 5%, and 1% probability levels of significance.
The results are similar to those in Panel A. In particular, the association between Abcount and Excoverage is positive and significant at 5% probability for the current year and at 10% probability for 1-year ahead. Results for the remaining variables are generally similar to those reported in Panel A. This latter result further suggests that Excoverage, an alternate proxy for abnormal coverage, is positively associated with the frequency of forward-looking statements. The results further support H1 and argue for the view that abnormal coverage is provided to an officer to encourage greater risk taking and more aggressive disclosures.
Abnormal coverage and aggressive investments
In Table 8, we report the results of Model 4. Columns 1 and 4 test our primary hypothesis, H2, that abnormal coverage is positively associated with abnormal investments. The coefficient for Abcoverage in Abxrd model (column 1) is positive and significant (p < .05). In other words, abnormal coverage is associated with greater R&D activity. Its effect on current abnormal capital expenditures, Abcapx (column 4), is insignificant. In columns 2 and 5, we report the results of re-estimating Model 4 with Abxrdt+1 and Abcapxt+1, respectively, as the dependent variables; columns 3 and 6 report similar results for Abxrdt+2 and Abcapxt+2. In these models, the coefficient for Abcoverage is positive and significant only in Abcapxt+2 model (p < .05). The coefficient is positive, although insignificant, in Abcapxt+1 model. The results, however, are in line with H2 that aggressive investments are linked to abnormal coverage: Firms use abnormal coverage to induce managers to invest more aggressively.

Note. p values are given in parentheses. Abcoverage = abnormal coverage estimated as the residual from the regression of coverage level on the economic determinants of D&O coverage, based on Core (2000). Size = natural log of total assets (AT); MtB is the ratio of market value of equity (PRCC_F × CSHO) to book value of equity (CEQ); ROA = Ratio of earnings before interest and tax (EBIT) to total assets (AT). MILLS is Inverse Mills ratio from the probit model that controls for self-selection bias. Abxrd = abnormal research and development expenditures estimated as the ratio of R&D expense (XRD) to total assets (AT) minus the average of the ratio for the previous 5 years; Abxrd t+1 and Abxrdt+2 are the 1-year-ahead and 2-years-ahead Abxrd, respectively. Abcapx = abnormal capital expenditures estimated as the ratio of capital expenditures (CAPX) to total assets (AT) minus the average of the ratio for the previous 5 years. Abcapxt+1 and Abcapxt+2 are the 1-year-ahead and 2-years-ahead Abcapx, respectively; D&O = Directors and Officers.
, **, and *** are 10%, 5%, and 1% probability levels of significance, respectively.
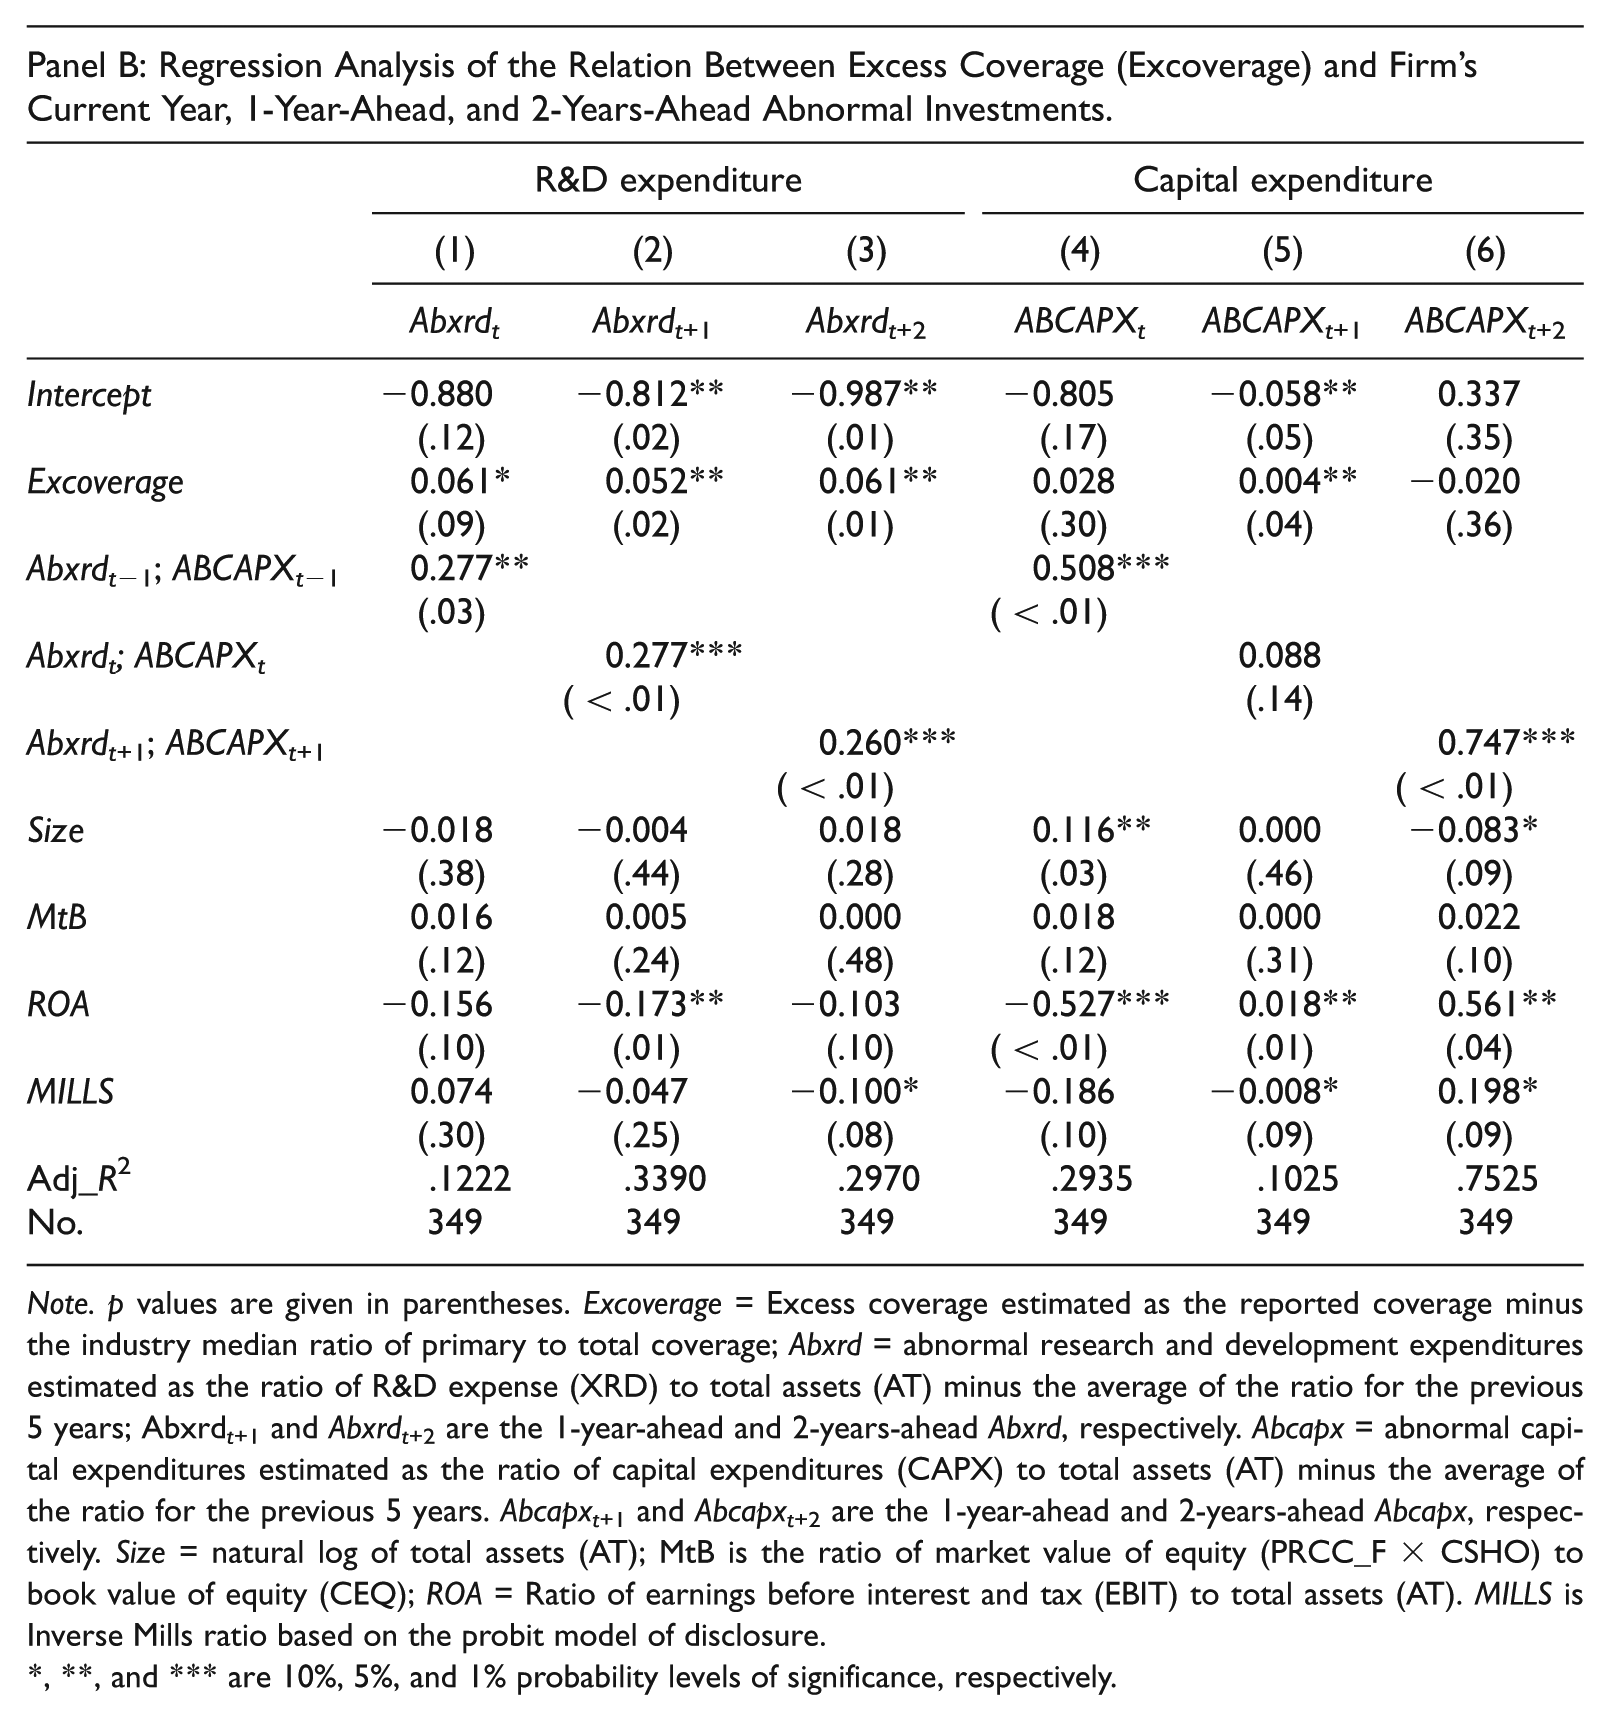
Note. p values are given in parentheses. Excoverage = Excess coverage estimated as the reported coverage minus the industry median ratio of primary to total coverage; Abxrd = abnormal research and development expenditures estimated as the ratio of R&D expense (XRD) to total assets (AT) minus the average of the ratio for the previous 5 years; Abxrd t+1 and Abxrdt+2 are the 1-year-ahead and 2-years-ahead Abxrd, respectively. Abcapx = abnormal capital expenditures estimated as the ratio of capital expenditures (CAPX) to total assets (AT) minus the average of the ratio for the previous 5 years. Abcapxt+1 and Abcapxt+2 are the 1-year-ahead and 2-years-ahead Abcapx, respectively. Size = natural log of total assets (AT); MtB is the ratio of market value of equity (PRCC_F × CSHO) to book value of equity (CEQ); ROA = Ratio of earnings before interest and tax (EBIT) to total assets (AT). MILLS is Inverse Mills ratio based on the probit model of disclosure.
, **, and *** are 10%, 5%, and 1% probability levels of significance, respectively.
Panel B shows the results after replacing Abcoverage with Excoverage. In the specification, Excoverage has a positive and significant effect on abnormal research and development spending in the current and 2 subsequent years (p < .10). Its effect on abnormal capital expenditures is positive both in the current and subsequent years, but significant only in the subsequent year. These latter results provide even stronger support for our hypothesis, H2, that D&O coverage beyond normal levels is associated with aggressive investment spending.
Profit performance
The results of the impact of abnormal coverage on profit performance are shown in Table 9. As predicted, Abcoverage is positively and significantly associated with abnormal ROA in all three test periods (current year, 1-year ahead, and 2-years ahead). These results are obtained after controlling for the persistence in abnormal ROA (via the lagged value of AROA) and other noted determinants of profit performance (Size, growth, and corporate governance). In columns 4, 5, and 6, we present similar analysis using stock returns as the measure of profit performance. The coefficient on Abcoverage is positive and significant for the current year; it is positive and but insignificant for 1-year ahead. We interpret these results as evidence that abnormal coverage has positive profit effects, consistent with H3.
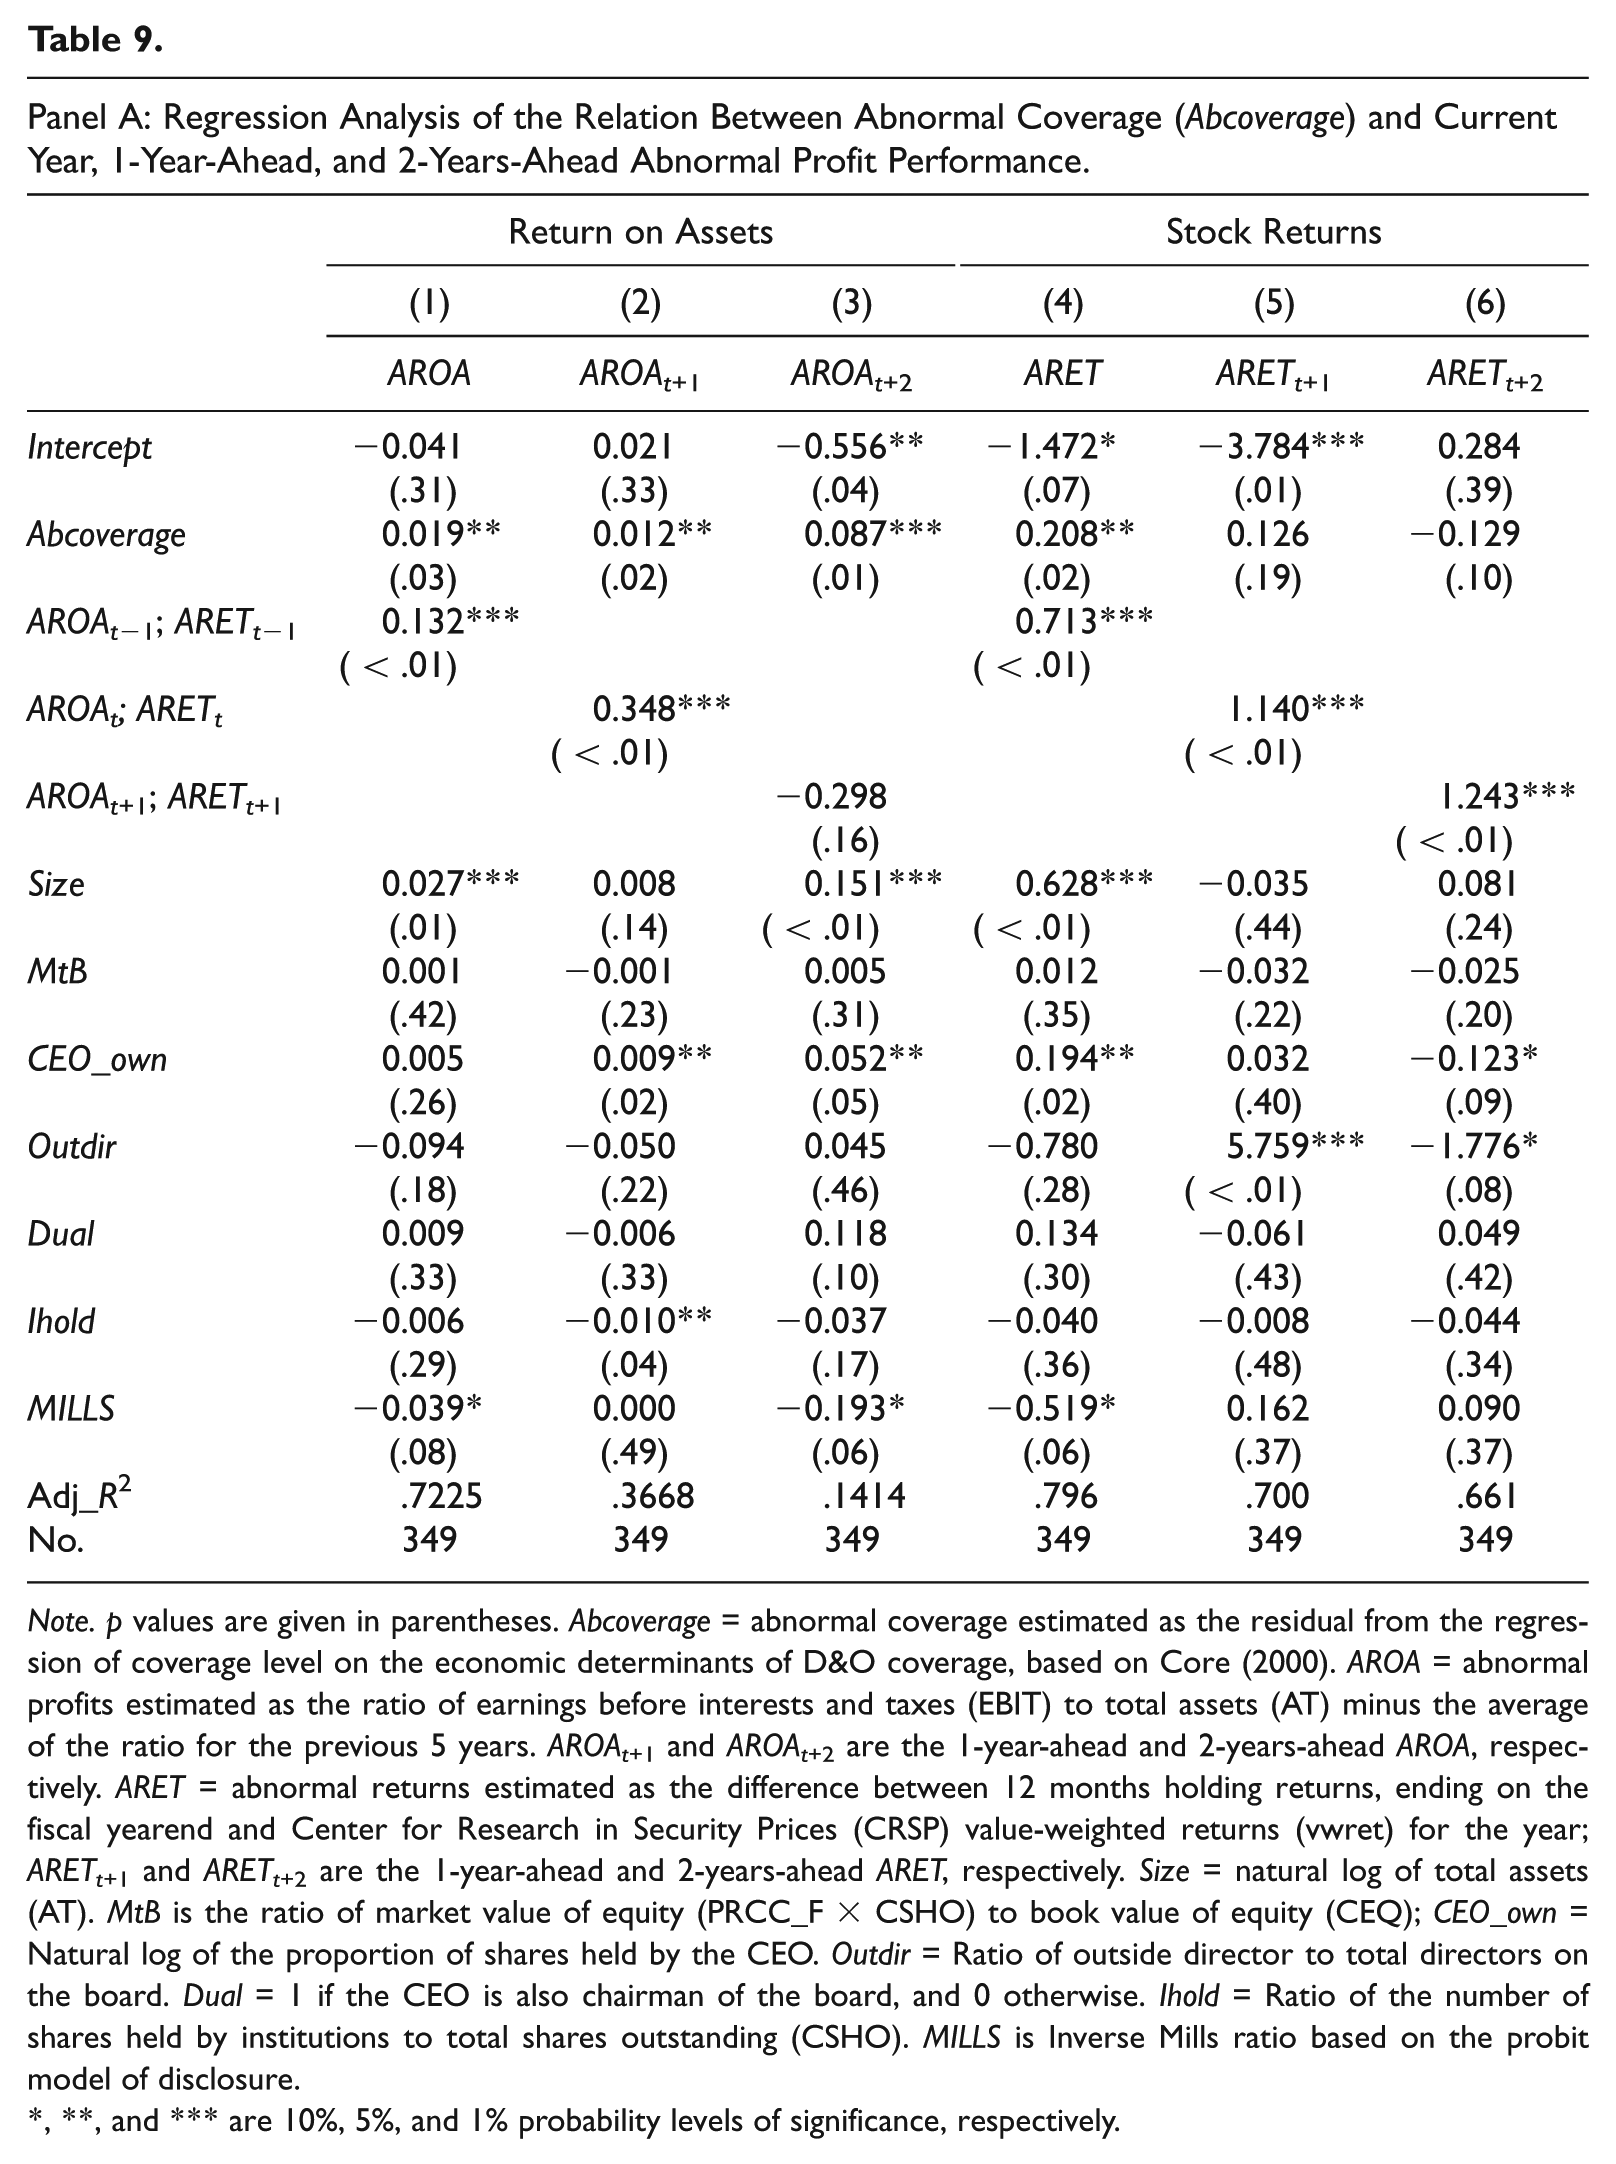
Note. p values are given in parentheses. Abcoverage = abnormal coverage estimated as the residual from the regression of coverage level on the economic determinants of D&O coverage, based on Core (2000). AROA = abnormal profits estimated as the ratio of earnings before interests and taxes (EBIT) to total assets (AT) minus the average of the ratio for the previous 5 years. AROAt+1 and AROAt+2 are the 1-year-ahead and 2-years-ahead AROA, respectively. ARET = abnormal returns estimated as the difference between 12 months holding returns, ending on the fiscal yearend and Center for Research in Security Prices (CRSP) value-weighted returns (vwret) for the year; ARETt+1 and ARETt+2 are the 1-year-ahead and 2-years-ahead ARET, respectively. Size = natural log of total assets (AT). MtB is the ratio of market value of equity (PRCC_F × CSHO) to book value of equity (CEQ); CEO_own = Natural log of the proportion of shares held by the CEO. Outdir = Ratio of outside director to total directors on the board. Dual = 1 if the CEO is also chairman of the board, and 0 otherwise. Ihold = Ratio of the number of shares held by institutions to total shares outstanding (CSHO). MILLS is Inverse Mills ratio based on the probit model of disclosure.
, **, and *** are 10%, 5%, and 1% probability levels of significance, respectively.
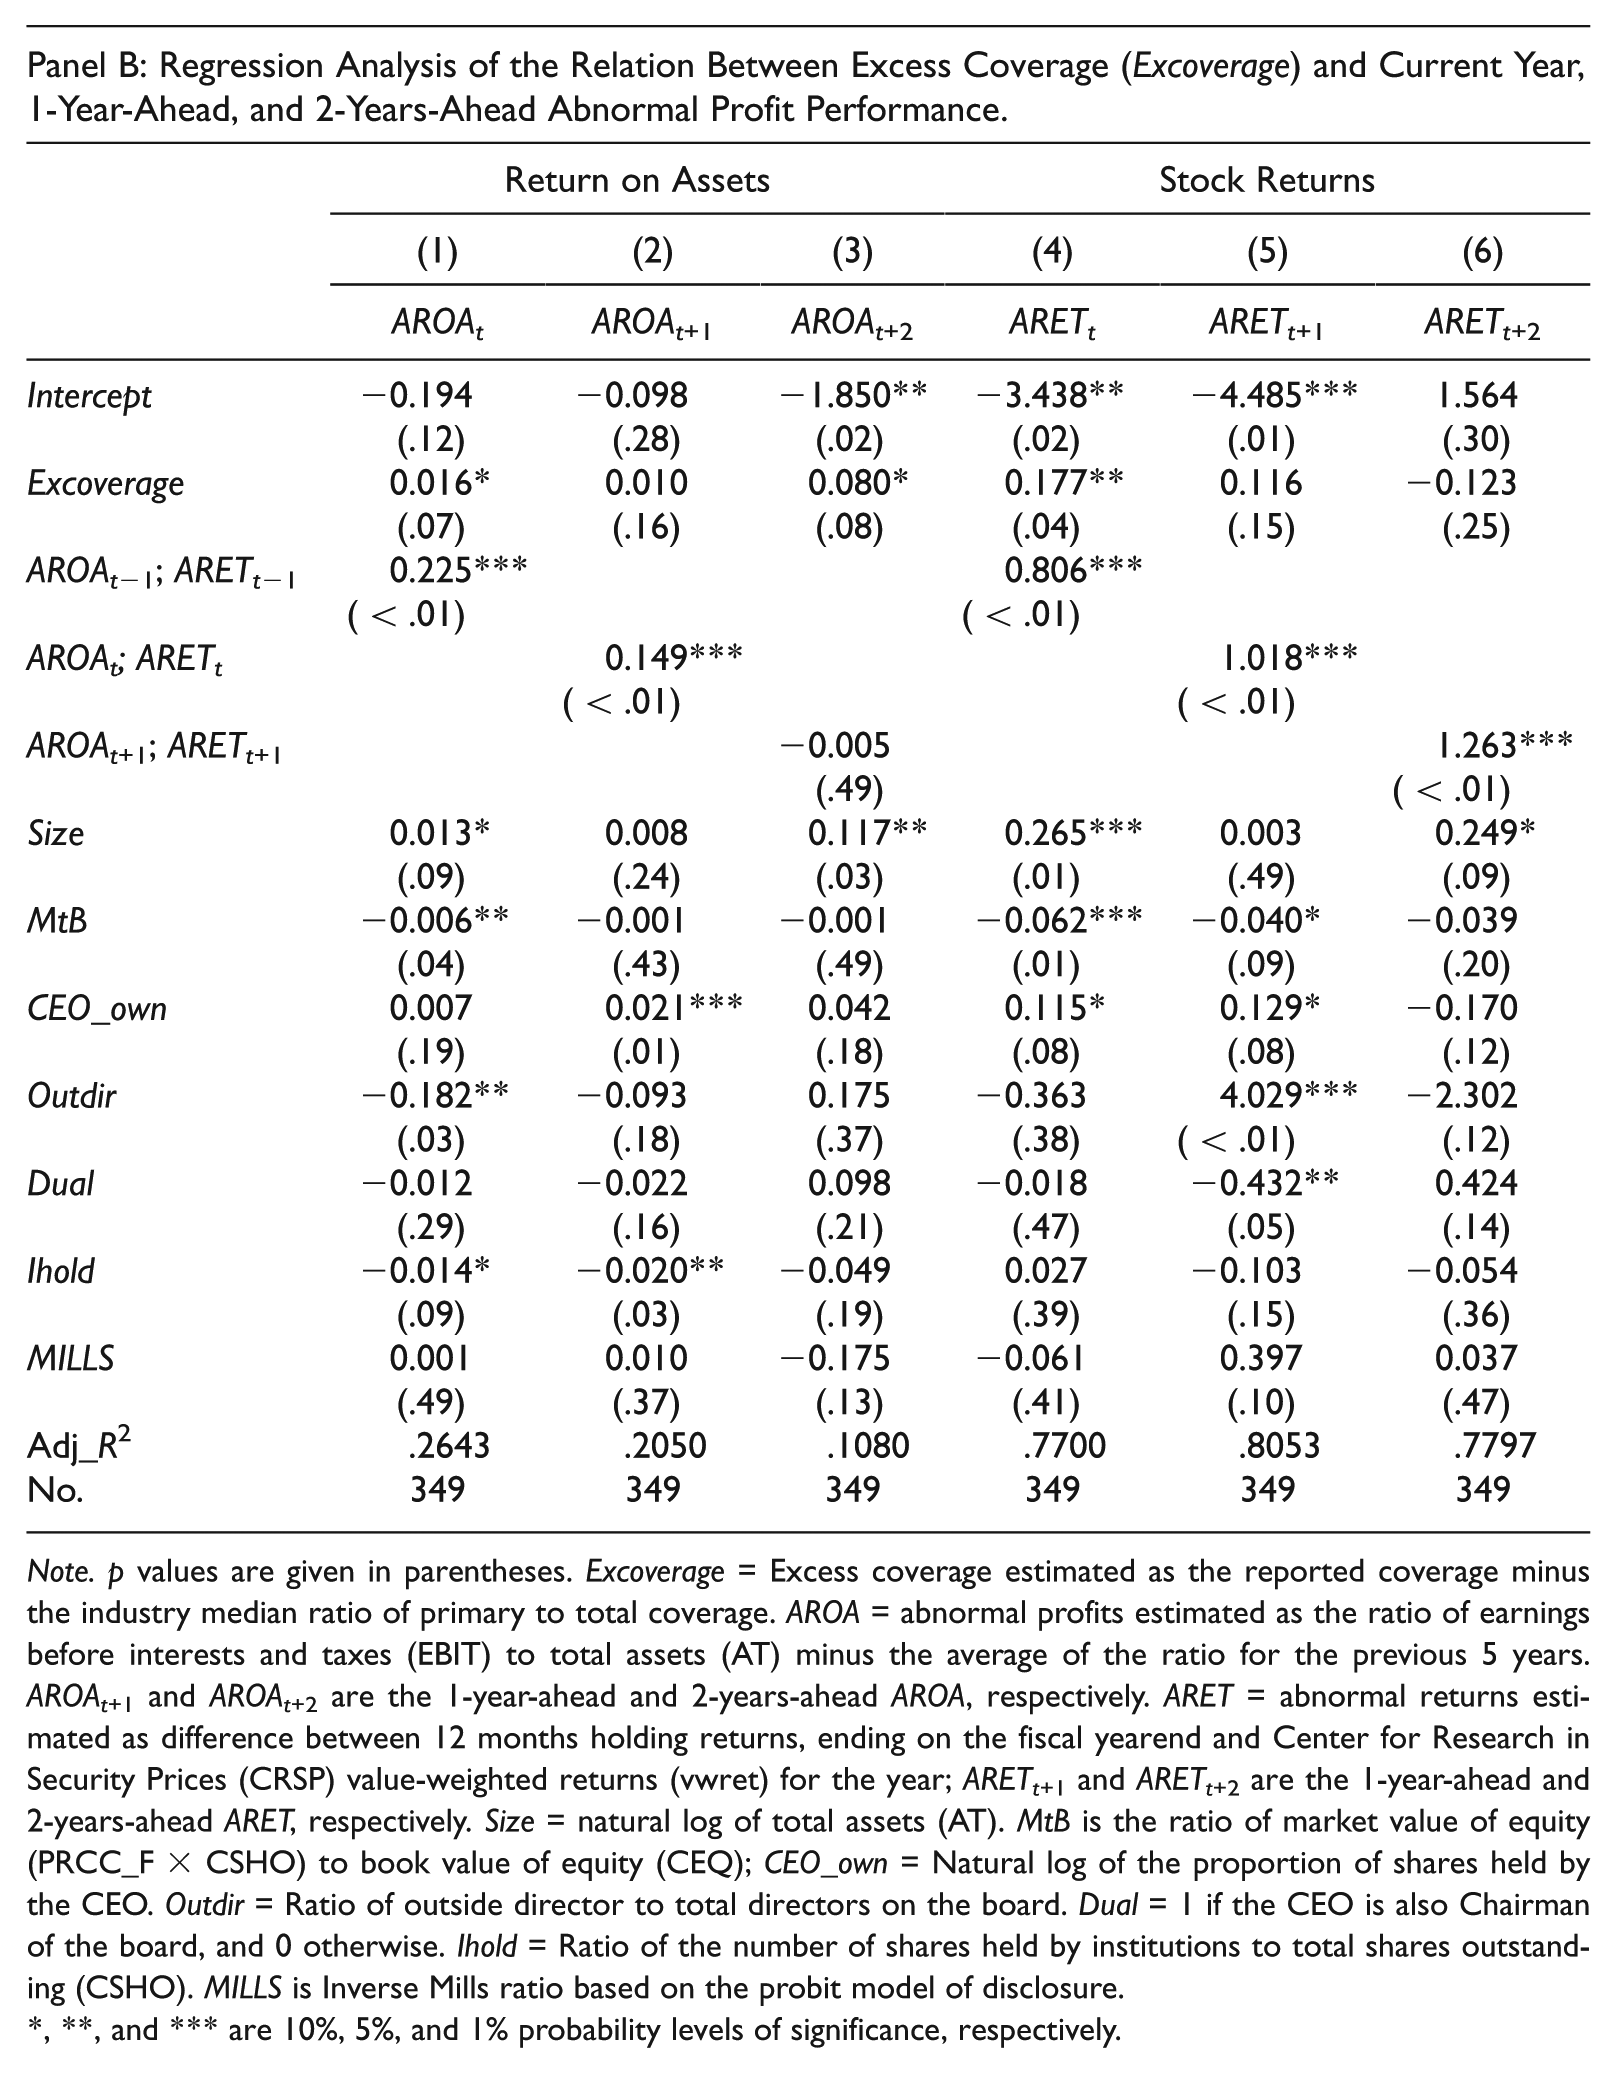
Note. p values are given in parentheses. Excoverage = Excess coverage estimated as the reported coverage minus the industry median ratio of primary to total coverage. AROA = abnormal profits estimated as the ratio of earnings before interests and taxes (EBIT) to total assets (AT) minus the average of the ratio for the previous 5 years. AROAt+1 and AROAt+2 are the 1-year-ahead and 2-years-ahead AROA, respectively. ARET = abnormal returns estimated as difference between 12 months holding returns, ending on the fiscal yearend and Center for Research in Security Prices (CRSP) value-weighted returns (vwret) for the year; ARETt+1 and ARETt+2 are the 1-year-ahead and 2-years-ahead ARET, respectively. Size = natural log of total assets (AT). MtB is the ratio of market value of equity (PRCC_F × CSHO) to book value of equity (CEQ); CEO_own = Natural log of the proportion of shares held by the CEO. Outdir = Ratio of outside director to total directors on the board. Dual = 1 if the CEO is also Chairman of the board, and 0 otherwise. Ihold = Ratio of the number of shares held by institutions to total shares outstanding (CSHO). MILLS is Inverse Mills ratio based on the probit model of disclosure.
, **, and *** are 10%, 5%, and 1% probability levels of significance, respectively.
The results in Panel B show that Excoverage has a positive and significant impact on the current year AROA (coeff. = 0.016, p < .10) and on 2-years-ahead AROA (coeff. = 0.08, p < .10). Its impact on 1-year ahead AROA is positive, although not significant. In the abnormal returns regression, the coefficient is positive and significant for the current year (coeff. = 0.177, p < .05). The latter results provide further support for hypothesis, H3, that D&O coverage beyond the normal level is positively associated with profit performance.
Sensitivity Analysis
The data used in the analysis could be serially correlated across time. Although serial correlation does not affect the consistency of ordinary least squares (OLS) estimators, it understates the standard errors, with the consequence that the null hypothesis could be falsely rejected. To control for the effect of serial correlations in test parameters, we re-estimate the models that examine the effect of abnormal coverage on firm reporting behavior, investing activities, and profit performance after controlling for the effects of cross-sectional and serial dependencies (via explicit control for time effect and firm clusters). The results of the analysis (not shown for brevity) parallel those presented in Tables 7, 8, and 9, and do not change any conclusions about the effect of abnormal coverage on firm reporting behavior, investment activity, or profit performance.
As another alternative to the regression-based measure of abnormal coverage, we estimate abnormal coverage as the difference between the firm-year coverage and the median coverage for firms in the same two-digit SIC, and re-run Models 3, 4, and 5. For this analysis, we assume that the median coverage reflects the minimum coverage required to entice officers to accept their various roles. Our results, not separately tabulated, are similar to those reported in Tables 7, 8, and 9. For instance, the effect of this latter proxy for Abcoverage on Abcountt is 0.008 (p < .05); its effect on Abcapxt is 0.057 (p < .10); and its effects on AROAt and ARETt are 0.002 (p < .10) and 0.159 (p < .10), respectively.
Next, we dropped the 32 cross-listed firms and the three firms incorporated in New York, and re-run our Models 3, 4, and 5. Our goal is to re-estimate the models without the possible biases that may be introduced by including cross-listed firms and firms for which disclosure of D&O policies is required. The results from the revised specifications (omitted from the text for brevity) are remarkably similar to those based on the full models that are discussed in the text: The impact of abnormal coverage on the disclosure of forward-looking statements, investment spending, and profit performance is positive, consistent with our predictions.
Conclusion
Our study focuses on a sample of U.S. firms from 2004 to 2008 to examine the implication of abnormal D&O coverage for managerial behavior and firm performance. In particular, we examine how abnormal D&O insurance affects managers’ behavior with respect to disclosures in the MD&A, investing activities, and profit performance. Using the Core (2000) model, we obtain abnormal coverage for 196 firms that disclosed their D&O insurance coverage information between 2004 and 2008. First, we find a positive association between abnormal coverage aggressive financial disclosures, which we measure as the frequency of forward-looking statements in the MD&A above the average frequency. We also document a positive association between abnormal coverage and abnormal capital spending for the current and future periods. Last, the results on the impact of abnormal coverage on a firm’s performance show that abnormal coverage has a positive impact on current as well as future profit performance. These results are insensitive to several specification checks and remain strong even with the inclusion of several control variables in the model.
The analysis of the implications of abnormal D&O insurance has some limitations. First, we use voluntary disclosures of D&O insurance information, which do not have standard format. Differences in the disclosure practices could potentially induce an unspecified bias in the results. Second, the sample used in the analysis is relatively small. For this reason, caution is needed in interpreting the results in more general contexts. Despite these caveats, the analysis sheds some light on the economic effects of D&O insurances and raises the prospect that abnormal D&O insurance is motivated by efficiency considerations rather than by managerial opportunism.
Footnotes
Acknowledgements
This article has benefited from comments and suggestions by Sharad Asthana, Jeff Boone, Dana Forgione, Jim Groff, Carlos Jimenez, Palani-Rajan Kadappakam, Mohinder Parkash, Jennifer Yin, and workshop participants at the Oakland University, University of Houston–Victoria, and University of Texas–San Antonio.
Declaration of Conflicting Interests
The author(s) declared no potential conflicts of interest with respect to the research, authorship, and/or publication of this article.
Funding
The author(s) received no financial support for the research, authorship, and/or publication of this article.