
Abstract
Previous research shows that accounting conservatism facilitates debt contracting. Extending this line of literature, we examine whether the role of accounting conservatism in accessing external debt to attain firm growth varies with its maturity. We find evidence of a positive relationship between conservatism and debt maturity. We also observe a positive relationship between conservative accounting and future growth funded by all classes of debt, but this relation is due to long-term rather than short-term debt, which is less prone to agency risk. Furthermore, the associations between conservatism and debt maturity and conservatism and growth financed by long-term debt are mostly observed for firms with fewer anti-takeover provisions in place. These findings suggest that the demand for accounting conservatism is not uniform across different debt maturity horizons.
Introduction
The primary objectives of this study are to examine whether accounting conservatism is associated with debt maturity structure and how the horizon of debt financing interacts with conservatism in influencing the growth of the firm through the use of external debt. 1 Prior studies have documented that accounting conservatism facilitates access to external capital (e.g., Ahmed, Billings, Morton, & Stanford-Harris, 2002; Beatty, Weber, & Yu, 2008), lowers costs of capital (e.g., Ahmed et al., 2002; Garcia Lara, Garcia Osma, & Penalva, 2011), and improves investment efficiency (e.g., Ahmed & Duellman, 2011; Garcia Lara, Garcia Osma, & Penalva, 2010). Given their asymmetric payoffs, it is likely that early loss recognition is particularly useful to debt holders. Accordingly, Ball, Robin, and Sadka (2008) find that the demand for conservatism originates from the debt markets. However, the utility of accounting conservatism as an early warning mechanism might not be uniform across debts with different maturity. Specifically, the demand for alternative monitoring mechanisms (such as conservative accounting) might be lower for short-term debt that matures before an investment option is to be exercised and hence enables debt holders to renegotiate the contract on a more frequent basis (Myers, 1977).
We extend the accounting conservatism literature by providing some insights on how the demand for conservative accounting and externally financed firm growth varies with debt maturity. The agency theory literature suggests that the separation of ownership and control in modern diffused ownership corporations generates economic conflicts (Fama & Jensen, 1983; Jensen & Meckling, 1976). Agency costs can also result from conflicts of interest between stockholders and debt holders. For example, the “asset substitution” problem arises when a firm exchanges its low-risk assets for high-risk investments, transferring value from the bondholders to the shareholders (Jensen & Meckling, 1976). Another agency cost of debt, debt overhang, occurs when stockholders choose to forgo potentially profitable projects if too much of the benefits will accrue to existing debt holders (Myers, 1977). To the extent that conservative accounting enables debt holders to better monitor managers by preventing them from transferring wealth to shareholders, the firm is likely to have better access to debt capital when accounting is more conservative (e.g., Ahmed et al., 2002).
However, the demand for conservative accounting may vary based on the horizon of debt contracting. Myers (1977) argues that one way of reducing agency conflicts is to shorten the maturity of outstanding debt. Short maturity can improve monitoring as it offers more frequent opportunities to renegotiate the debt. While renegotiations entail costs, it offers capital providers opportunities to ensure that the managers are not making sub-optimal investment decisions. Therefore, debt maturity can be utilized to minimize the effect of private information on financing costs. Firms with greater information asymmetry will issue short-term debt to avoid locking in higher cost of financing with long-term debt because they expect to be able to borrow under more favorable terms later (e.g., Diamond, 1993; Flannery, 1986; Kale & Noe, 1990). Given the reduction in the consequences of information asymmetry when the debt horizon is shorter, the demand for conservative accounting as an alternative monitoring device might be lower for short-term creditors than for long-term capital providers.
Utilizing three proxies for accounting conservatism, that is, the Khan and Watts (2009)C-Score, a measure based on Callen, Segal, and Hope (2010) as adjusted by Biddle, Ma, and Song (2011), and an accrual-based measure proposed by Givoly and Hayn (2000), we compute a composite measure of accounting conservatism. We first examine the association between accounting conservatism and debt maturity. Using the percentage of debt maturing in more than 1, 3, and 5 years as our measures of debt maturity structure (e.g., Barclay & Smith, 1995), we find evidence of a positive relationship between accounting conservatism and debt maturity. Following the methodology developed by Demirguc-Kunt and Maksimovic (1998, 2002) to estimate externally funded growth, we find that conditional conservatism is positively associated with firm growth from external debt. We also find evidence of a positive relationship between accounting conservatism and investment associated with long-term debt (e.g., Ball et al., 2008). However, we do not observe a similar association between short-term debt and reporting conservatism. We further find that the associations between accounting conservatism and debt maturity and conservatism and externally funded growth are mainly observed for firms with fewer anti-takeover provisions in place.
Our study makes some important contributions to the existing literature and has broad implications for standard setters and financial statement users. First and foremost, we demonstrate that the demand for accounting conservatism varies with debt maturity (i.e., short term or long term), consistent with the inherent monitoring effect associated with short-term debt (Myers, 1977). Additional analysis shows that the association is stronger for long-term debt than for equity, in line with the idea that accounting conservatism is more beneficial to creditors than to shareholders (Ball et al., 2008). Combined, these results advance our understanding of the role of accounting conservatism in capital markets by showing that the demand for conservative accounting varies not only with the mode of financing (debt vs. equity) but also with the horizon of debt contracting (short term vs. long term). Our investigation also responds to the call for research studying the relation between financial reporting attributes and firms’ financing decisions (Armstrong, Guay, & Weber, 2010).
In addition, our study extends the prior literature on agency costs and the determinants of firm growth (e.g., Demirguc-Kunt & Maksimovic, 1998; Rajan & Zingales, 1998) by providing evidence of a relationship between the characteristics of financial reporting and firms’ ability to grow through external financing. Specifically, we provide evidence showing that the negative effects of information asymmetry on firm growth (Stein, 2003) may be (partially) alleviated through the use of greater conditional conservatism in financial reports.
The remainder of the article proceeds as follows: “Related Studies and Hypotheses Development” section reviews the relevant literature and develops the hypotheses; “Methodology and Sample” section presents our methodology and describes our sample; “Regression Results” section discusses our results; and “Conclusion” section presents our conclusions.
Related Studies and Hypotheses Development
Modigliani and Miller (1958) argue that perfect capital markets allow for the separation of financing and investment decisions. However, the agency theory literature has established the existence of frictions in the relationship between investment and financing due to the presence of information asymmetry across market participants. 2 Accounting conservatism can act as a mechanism that can help reduce the agency costs resulting from asymmetric information and conflicting interests. Early loss recognition is particularly useful to debt holders as it can trigger detect covenant violations in a timelier manner allowing lenders to veto major decisions that could further erode debt quality (Ball et al., 2008).
While the prior empirical literature indicates a strong association between conservatism and debt, it has not examined whether this relationship will vary based on the maturity structure of the debt. In theory, firms with greater information asymmetry will issue short-term debt to avoid locking in higher cost of financing with long-term debt because they expect to be able to borrow under more favorable terms later (e.g., Diamond, 1993; Flannery, 1986; Kale & Noe, 1990). Barclay and Smith (1995) and Berger, Espinosa-Vega, Frame, and Miller (2005) find evidence that firms with higher information asymmetry use more short-term debt, and Custodio, Ferreira, and Laureano (2013) find that the increase in the use of short-term debt in recent decades is driven primarily by firms with greater information asymmetry.
Overall, many of the potential effects of conservatism on agency costs could also be accomplished by shortening the maturity of the firm’s debt. Given the potential costs associated with both conservative accounting and the use of short-term debt, it is possible that the two mechanisms operate as substitutes for addressing the various agency costs. Therefore, we predict that the demand for alternative corporate monitoring mechanisms such as conservative financial reporting primarily exists for external debts with long-term maturity. We formulate our first hypothesis (in alternate form) as follows:
We next examine whether the role of accounting conservatism in facilitating firm growth through external debt varies based on the maturity of the debt. If equity holders and debt holders withhold capital from firms due to potential agency problems, firms may be unable to obtain the external capital necessary to fund all positive net present value (NPV) projects, which makes them more likely to utilize internal resources to fund growth (Myers & Majluf, 1984). If firms do not have the requisite internal resources available to fund investment opportunities, they may forgo making investments in positive NPV projects. As a result, asymmetric information can hamper a firm’s growth through its negative impact on the efficiency of the firm’s investments (Stein, 2003).
Consistent with this prediction, prior studies show that information asymmetry due to agency conflicts limits a firm’s ability to pursue potentially profitable projects by constraining access to lower cost external financing. Many of these studies examine country-level institutional factors associated with information asymmetry and external monitoring. For example, Demirguc-Kunt and Maksimovic (1998) argue that well-developed legal and financial systems help limit the opportunistic behavior of corporate insiders and provide information about the firm’s activities. They provide evidence that firms from countries with a well-developed legal system and active stock market are better able to attract external financing and grow faster than firms from less developed countries. Rajan and Zingales (1998) provide evidence that financial development reduces the costs of external financing and increases the growth of firms in financially constrained industries. There is also evidence that the extent of corporate disclosure facilitates externally financed growth (Khurana, Martin, & Pereira, 2008; Khurana, Pereira, & Martin, 2006).
If conservatism is an effective monitoring mechanism, it should allow firms to more easily attract the needed financing to fund potentially profitable projects, as it reduces investors’ reluctance to supply firms with capital to fund profitable projects and allow firms to fund more positive NPV projects (the monitoring hypothesis). As a result, accounting conservatism might facilitate growth through external capital by alleviating the capital rationing problem as it ensures potential capital providers that existing “bad news” is already incorporated in the stock price. However, this prediction is not entirely obvious as the association might not be observed if conservative accounting, which leads to an understatement of net assets and hence an overstatement of the leverage ratio (i.e., debt to assets), makes external capital less accessible. 3
While we expect a positive relationship between conservatism and growth financed with long-term debt, an expectation regarding the association between conservatism and growth through short-term financing is less clear. As discussed above, shortening the maturity of the firm’s debt can address many of the same agency issues addressed by conservative financial reporting. Because more growth options in the firm’s investment opportunity set lead to greater conflict between equity holders and debt holders (Myers, 1977), absent any alternate monitoring mechanisms, firms with greater growth opportunities will issue debt with a shorter maturity. Consistent with this intuition, Barclay and Smith (1995) find that debt maturity is negatively related to the firm’s growth opportunities. Therefore, we predict that the demand for conservative financial reporting is greater for growth financed through long-term debt. We formulate our second hypothesis (in alternate form) as follows:
Next, we examine the role of anti-takeover provisions as a governance mechanism (Shleifer & Vishny, 1997) in these posited associations. Debt covenants written on accounting numbers are typically triggered earlier under conservative accounting. However, the commitment to using conditional conservatism is credible only under strong corporate governance. If long-term creditors share this view, the posited associations between accounting conservatism and debt maturity and between conservatism and long-term external debt-financed growth will be concentrated in firms with stronger governance. This reasoning leads us to the following hypotheses:
Methodology and Sample
Measures of Conservatism
Due to the lack of a single generally accepted empirical proxy for conservatism, we utilize three different conservatism measures that have been proposed and tested in the previous literature. The first conservatism measure, CON_KW, is C-Score. C-Score, developed by Khan and Watts (2009), is a firm-year measure that is based on the Basu (1997) model of asymmetric timeliness. The Khan and Watts model expresses each of the coefficients in the Basu model as a linear function of firm size, market-to-book ratio, and leverage:

where X is earnings, R is returns, D is a dummy variable that equals 1 when R is negative and 0 otherwise, Size is the natural log of the market value of equity, M/B is the market-to-book ratio, and Lev is the long-term and short-term debt deflated by the market value of equity.
C_Score, which equals to (λ1+λ2Sizei+λ3M/Bi+λ4Levi), is a firm-year measure of the incremental timeliness of bad news over good news or conservatism. To calculate CON_KW, we follow Khan and Watts (2009) and delete firms with price per share less than US$1 and firms in the top and bottom 1% of earnings, returns, size, market-to-book ratio, and leverage. We also delete firms with negative book value of equity. We calculate annual returns by cumulating monthly returns starting from the fourth month after the firm’s fiscal year-end.
Our second measure of conservatism, CON_CR, is based on the conservatism ratio introduced by Callen et al. (2010) and adapted by Biddle et al. (2011). This measure uses the return decomposition model of Vuolteenaho (2002) to construct a conservatism ratio that measures the proportion of the total shock to the firm’s expected current and future cash flows that are recognized in the firm’s current year’s earnings. The measure is computed by estimating a log-linear vector autoregressive (VAR) model consisting of a system of three equations:


where r is the log of stock return (computed as the annual return in excess of 1 plus the risk-free rate starting 9 months before fiscal year-end), roe is the log of 1 plus ROE (calculated as income before extraordinary items divided by beginning stockholders equity), and bm is the log book-to-market ratio. To control for industry effects, the VAR system is estimated for each Fama and French (1997) industry group using weighted least squares with one pooled regression per equation. Each annual cross-section is weighted equally by deflating the data by the number of firms in that year (Callen et al., 2010; Garcia Lara et al., 2011). Also consistent with the prior studies, we drop firms from the financial industry (Standard Industry Classification [SIC] 6000-6999); firms with missing values for current and lagged ROE, returns, and book-to-market; and firms with market value less than US$10 million, and delete the top and bottom 1% of all variables used to estimate the VAR model.
Earnings news is the component of stock returns due to shocks to current and expected future dividends, which can be replaced by earnings under the clean surplus relation (Campbell, 1991; Vuolteenaho, 2002). Specifically, earnings news can be expressed as follows:

where p is the constant discount rate term and it is equal to the log of 1 plus the risk-free rate measured as the annualized 3-month Treasury bill rate (Callen et al., 2010; Campbell, 1991; Vuolteenaho, 2002). Then, the conservatism ratio is measured as follows:

CR measures how much of the total earnings shock is incorporated into unexpected earnings for the current period. For a negative shock, CR reflects the firm’s level of conservatism as the earnings of more conservative firms will incorporate more of the negative shock to current and future earnings. Following Biddle et al. (2011), we do not delete observations, where CR is less than 0, and multiply CR by −1 when earnings news is positive, so that the measure will have a consistent interpretation for both good news and bad news scenarios.
Our third conservatism proxy, CON_ACC, is based on Givoly and Hayn (2000) and measures the extent to which earnings include negative non-operating accruals. This measure is calculated as the average of non-operating accruals to total assets over a 3-year period. Operating accruals are calculated as net income before extraordinary items plus depreciation minus cash flow from operations. 4 Non-operating accruals are then calculated as operating accruals minus the change in accounts receivable minus the change in inventories minus the change in prepaid expenses plus the change in accounts payable plus the change in taxes payable. As more negative average non-operating accruals indicate greater conservatism, the average is multiplied by −1, so that the measure will also be increasing in conservatism.
To perform our empirical tests, we calculate decile ranks for each measure of conservatism for each year in our sample and then average the ranks for each measure over the 3-year period from time t− 2 to time t. We then compute a fourth measure, CON_AVG, by averaging the ranks for the three conservatism measures over the same 3-year period. We use this composite measure as the explanatory variable in our empirical tests.
Dependent Variables
Following the literature on debt maturity (e.g., Barclay & Smith, 1995), we use the percentage of debt maturing in more than 3 years as our primary dependent variable to examine whether conservatism is associated with the use of long-term debt. We also include results using the percentage of debt maturing in more than 1 year and more than 5 years. Our measures of externally financed growth are based on the model introduced in Demirguc-Kunt and Maksimovic (1998). This model estimates the maximum level of growth a firm can obtain under different levels of financing constraints and then examines whether the firm’s growth exceeds these constrained growth rates. The external financing need for the firm is expressed as follows:

where gt is the firm’s growth (measured by sales growth), At is the firm’s total assets, Et is the earnings after interest and taxes, and bt is the proportion of earnings retained for reinvestment. The right-hand side of the equation measures the difference between the required investment for a firm growing at a rate of gt and the amount of internally generated funds available for investment.
Based on this relationship, Demirguc-Kunt and Maksimovic generate estimates of the maximum rate of growth a firm could achieve under different levels of financing constraints. The first measure, the internally financed growth rate (IG), estimates the maximum growth rate the firm can obtain by utilizing only its internal resources, maintaining a constant dividend payout, and not utilizing any external financing. IG is obtained by setting the EFN in Equation 5 equal to 0 and solving for the level of growth (gt):

where ROAt is the ratio of the firm’s earnings after interest and taxes to total assets.
The second measure, the maximum short-term financed growth rate (SFG), is an estimate of the maximum growth the firm can achieve if it reinvests all earnings and attracts enough short-term credit to maintain a constant ratio of short-term borrowing to assets. In other words, this is an estimate of the maximum growth rate that can be achieved utilizing only internal resources and short-term financing without any long-term borrowing or equity issuance. To compute this measure, b is set equal to 1 as it is assumed that all earnings are retained and reinvested. In addition, total assets in Equation 5 are replaced by the value of assets not financed by short-term debt. These assets, termed “long-term capital,” are obtained by multiplying the firm’s total assets by 1 minus the ratio of short-term liabilities to total assets. SFGt is obtained by again setting EFNt equal to 0 and solving for the growth rate:

where ROLTCt is the ratio of the firm’s earnings after interest and taxes to the firm’s long-term capital.
Following Demirguc-Kunt and Maksimovic (1998), we calculate two sets of measures for externally financed growth. The first set measures the difference between the firm’s sales growth rate and the estimates of constrained growth, IGt, and SFGt. We calculate the average of this excess growth over a 3-year period and denote these two measures by EXCESS_IG and EXCESS_SFG. To reduce the effect of outliers, we also create an indicator variable that equals 1 if the firm exceeds the constrained growth level and 0 otherwise. For this set of measures, we calculate the proportion of years over a 3-year period that the firm’s sales growth rate exceeds the estimate of constrained growth. These variables are denoted by PROP_IG and PROP_SFG.
Corporate Governance Measure
We proxy for the quality of the firm’s corporate governance using the index created by Gompers, Ishii, and Metrick (2003). Gompers et al. measure the level of a firm’s external monitoring by creating an anti-takeover index compiled by adding 1 point for every provision that reduces the firm’s vulnerability to a takeover. 5 Higher values of the index are associated with less risk of takeover, which reduces the level of external monitoring. To perform our empirical tests examining the effect of corporate governance, we partition our sample based on the median value of the Gompers et al. score. Firms with a score greater than the median are designated as “Low Governance” firms, and firms with a score lower than the median are designated as “High Governance” firms.
Empirical Models
To examine the relationship between conservatism and debt maturity, we estimate the following model based on Barclay and Smith (1995):

LT3 is defined as the percentage of debt due in more than 3 years. 6 CON_AVG is the average of the ranks of the three conservatism measures over a 3-year period (from time t− 2 to time t). MARKET-TO-BOOK is the estimated market value of assets divided by the book value of assets, FIRM SIZE is the natural log of market value of equity, ABNORMAL EARNINGS is earnings per share in year t (excluding extraordinary items and discontinued operations) minus earnings per share in year t− 1 divided by the firm’s market value, and TERM STRUCTURE is the difference between the yield on 6-month government bonds and the yield on 10-year government bonds at time t. We also control for time and industry fixed effects.
MARKET-TO-BOOK proxies for the firm’s investment opportunity set, as well as (the inverse of) unconditional/balance sheet conservatism. We expect the coefficient for MARKET-TO-BOOK to be negative because firms with more growth opportunities are likely to issue more short-term debt (e.g., Myers, 1977) and because unconditional conservatism can also have a similar positive effect on debt maturity. 7 Smaller firms are more likely to use shorter maturity private debt because they cannot take advantage of the economies of scale associated with the issuance of long-term debt. As a result, we expect the coefficient for FIRM SIZE to be positive. Abnormal earnings proxy for firm quality (Barclay & Smith, 1995). If high-quality firms signal their quality by issuing more short-term debt, the coefficient for ABNORMAL EARNINGS will be positive. Finally, the coefficient for TERM STRUCTURE could be positive if firms utilize maturity structure to minimize their tax liability (Barclay & Smith, 1995; Brick & Ravid, 1985) or negative if managers time the market and issue more short-term debt when the difference between short-term rates and long-term rates is greater.
To examine the relationship between conservatism and externally financed firm growth, we estimate the following model:

where EFG is one of the measures of externally financed growth over the examined time period, CON_AVG is the average of the ranks of the three conservatism measures over a 3-year period (from time t − 2 to time t), LOG_TA is the natural log of total assets, Tobin’s Q is calculated as the market value of equity plus assets less the book value of equity divided by total assets, DIV/TA is the total dividends divided by total assets, ΔNI/NSit is the change in earnings after interest and taxes divided by sales, and ΔNS/TAit is the change in sales divided by total assets. We also control for time and industry fixed effects.
In addition to the variable of interest for our hypotheses (i.e., the conservatism measure), we also include variables that control for the need and ability to obtain external financing as well as for the firm’s growth opportunities. Larger firms are less likely to rely on external financing to fund growth because they are likely to be less financially constrained. Therefore, we expect larger firms to display less externally financed growth. As a result, we expect the coefficient on LOG_TA to be negative. We include Tobin’s Q to proxy for the firm’s growth opportunities. On average, we expect firms with greater growth opportunities to utilize more external financing to fund those opportunities. Therefore, we expect a positive relationship between Tobin’s Q and externally financed growth.
We also control for the effect of dividends on the firm’s externally financed growth. As firms that pay dividends are more likely to have increased cash available for investment (Demirguc-Kunt & Maksimovic, 1998), they are less likely to depend on external financing to fund growth. Therefore, we expect a negative relationship between the firms’ dividend payments and their externally financed growth. Following Khurana et al. (2006), we also include changes in profit margin and changes in asset turnover to control for changes in the performance of the firm. As noted by Khurana et al. (2006), changes in profitability could affect the availability of internal funds and the need for external financing. However, changes in profitability could also reflect changes in growth opportunities for the firm. As a result, we do not form a prediction for the coefficients on the change in the firm’s profit margin or asset turnover.
Sample and Descriptive Statistics
Our sample period covers the time period from 1987 to 2008. We include all firms that have the necessary data in COMPUSTAT North America to calculate all variables used in our models. To perform our empirical tests, we calculate decile ranks for each measure of conservatism for each year in our sample. We average the ranks for each measure over a 3-year period (from time t− 2 to time t). We then compute a composite measure (CON_AVG) by averaging the ranks for the three conservatism measures over the same 3-year period. We report regression results utilizing this composite measure. Data requirements and availability vary greatly across the three measures. The sample for the measure utilizing the average rank across the three measures (CON_AVG) includes only those firms with data available to compute all three measures. We winsorize each continuous variable at the top and bottom 1% of its distribution to reduce the effect of extreme values on our estimates.
The data for the index constructed by Gompers et al. (2003) that we utilize for our tests examining the effect of corporate governance were obtained from Andrew Metrick’s website. The index is constructed based on the data from surveys conducted by the Investors Responsibility Research Center (IRRC). The IRRC data are only available for 1990, 1993, 1995, 1998, 2000, 2002, 2004, and 2006. For the years between surveys, we assume that the index score is the same as in the most recent survey year. As the sample of firms available for the tests examining the effect of corporate governance is limited to the coverage of the IRRC data, the sample size for these tests is smaller relative to the sample used in the initial tests (which include all firms with data available in COMPUSTAT North America).
Table 1 provides descriptive statistics (Panel A) and correlations (Panel B) for variables used in the models examining debt maturity and externally financed growth. The mean (0.086) and median (0.083) of CON_KW (the C-Score measure) are similar to the mean (0.105) and median (0.097) reported in Khan and Watts (2009). 8 The mean (−0.241) of CON_CR is similar to the mean (−0.310) reported in Biddle et al. (2011). 9 The mean (0.021) of our other conservatism measure, CON_ACC (the average of non-operating accruals based on Givoly & Hayn, 2000), is very similar to the mean reported in previous studies. 10
Descriptive Statistics.

Note. This table contains descriptive statistics (Panel A) and correlations (Panel B) for variables utilized in our regression models. CON_KW is the Khan and Watts (2009)C-Score measure of conservatism, CON_CR is the conservatism measure based on Callen, Segal, and Hope (2010) as adjusted by Biddle, Ma, and Song (2011), CON_ACC is the conservatism measure based on Givoly and Hayn (2000) calculated as the average of non-operating accruals divided by total assets from over a 3-year period (t− 2 to t), and CON_AVG is the average rank of the three conservatism measures over 3 years. LT1, LT3, and LT5 are the percentage of debt due in more than 1, 3, and 5 years, respectively. MARKET-TO-BOOK is the estimated market value of assets divided by the book value of assets, FIRM SIZE is the natural log of market value of equity, ABNORMAL EARNINGS is earnings per share in year t minus earnings per share in year t − 1 divided by the firm’s market value, and TERM STRUCTURE is the difference between the yield on 6-month government bonds and the yield on 10-year government bonds at time t. PROP_IG is the proportion of years from t+ 1 to t+ 3 that the firm’s sales growth exceeds the internally financed growth rate (IG), PROP_SFG is the proportion of years from t+ 1 to t+ 3 that the firm’s sales growth exceeds the maximum short-term financed growth rate (SFG). EXCESS_IG and EXCESS_SFG are the average sales growth in excess of the IG and SFG from t+ 1 to t+ 3. LOG_TA is the natural log of total assets, TOBIN’S Q is calculated as the market value of equity plus assets less the book value of equity scaled by total assets, DIV/TA is the total dividends divided by total assets, ΔNI/NS is the change in earnings after interest and taxes divided by sales, and ΔNS/TA is the change in sales divided by total assets.
The mean for our primary measure of debt maturity (LT3) is 0.507, which indicates that half of the debt for the average firm in our sample matures in more than 3 years. The means of LT1 and LT5 are 0.751 and 0.323, respectively. Not surprisingly, the correlations presented in Panel B indicate that these variables are highly correlated. As expected, the debt maturity variables are negatively correlated with MARKET-TO-BOOK and positively correlated with FIRM SIZE. However, the correlation between the debt maturity structure variables and ABNORMAL EARNINGS is positive. Although this is not consistent with the signaling hypothesis, it is consistent with recent studies (e.g., Custodio, Ferreira, & Laureano, 2013). Surprisingly, the univariate results indicate a negative association between the debt maturity measures and the conservatism measures.
The means and medians of the growth measures utilizing IG and SFG indicate that the growth of the typical firm exceeds its internally financed growth rate and maximum short-term financed growth. The univariate results presented in Panel B indicate a mostly significant positive relationship between the four conservatism measures and the growth measures. However, there is evidence of a negative relationship between CON_KW and PROP_IG (growth in Excess of the Internally Financed Growth Rate). As expected, there is evidence of a negative relationship between the growth measures and firm size and a positive relationship between the growth measures and Tobin’s Q.
Regression Results
Conservatism and Debt Maturity
We first examine the relationship between conservatism and debt maturity. These results are provided in Table 2. Panel A provides results for pooled cross-sectional tests. Because the residuals may be correlated across observations in a pooled sample, it can lead to inconsistent estimates of standard errors. This could lead to overstated or understated t statistics, which could affect inferences. To address this potential issue in the pooled sample, we cluster standard errors by both firm and year. In addition, we also estimate yearly regressions and calculate test statistics based on Bernard (1987). 11 We provide results for the yearly cross-sectional regressions in Panel B. 12
Debt Maturity and Conservatism.
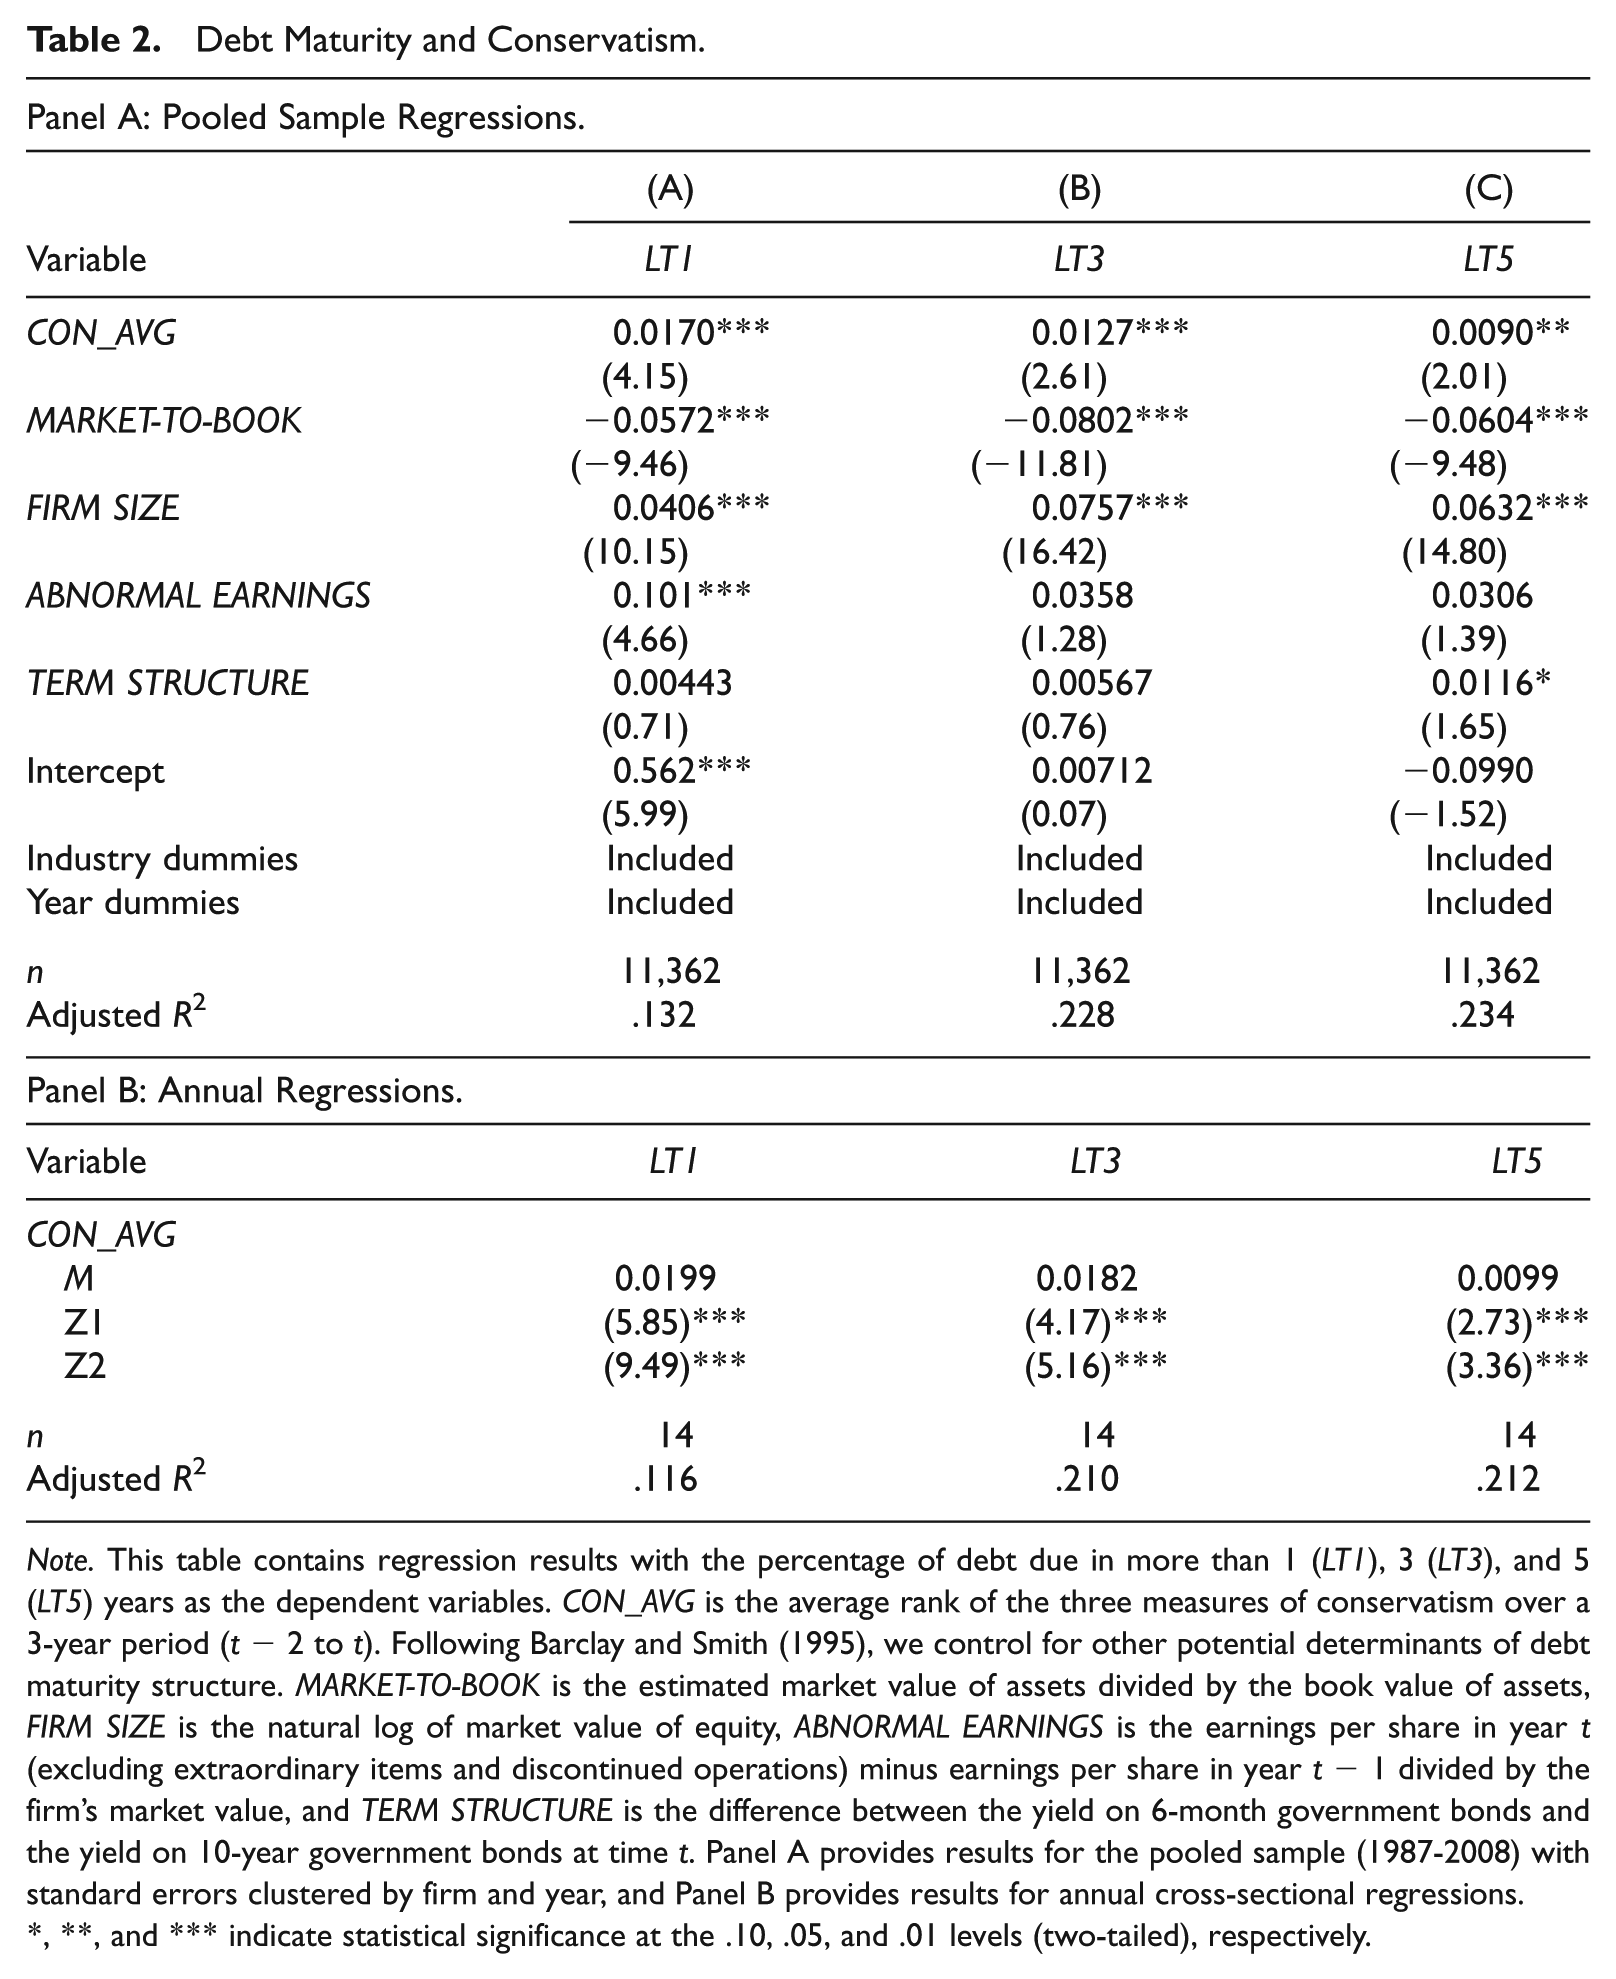
Note. This table contains regression results with the percentage of debt due in more than 1 (LT1), 3 (LT3), and 5 (LT5) years as the dependent variables. CON_AVG is the average rank of the three measures of conservatism over a 3-year period (t− 2 to t). Following Barclay and Smith (1995), we control for other potential determinants of debt maturity structure. MARKET-TO-BOOK is the estimated market value of assets divided by the book value of assets, FIRM SIZE is the natural log of market value of equity, ABNORMAL EARNINGS is the earnings per share in year t (excluding extraordinary items and discontinued operations) minus earnings per share in year t− 1 divided by the firm’s market value, and TERM STRUCTURE is the difference between the yield on 6-month government bonds and the yield on 10-year government bonds at time t. Panel A provides results for the pooled sample (1987-2008) with standard errors clustered by firm and year, and Panel B provides results for annual cross-sectional regressions.
, **, and *** indicate statistical significance at the .10, .05, and .01 levels (two-tailed), respectively.
Our dependent variables are the percentage of debt maturing in more than 1 (LT1), 3 (LT3), and 5 (LT5) years. If the demand for conservative financial reporting primarily exists for external debts with long-term maturity, we would expect a positive coefficient for the composite conservatism measure (CON_AVG). As expected, CON_AVG is positive and significant for all three debt maturity variables. 13 In terms of the control variables, consistent with the univariate results, the coefficients for MARKET-TO-BOOK are negative and significant, and the coefficients for FIRM SIZE are positive and significant across all of the models. Although the coefficients for ABNORMAL EARNINGS and TERM STRUCTURE are positive in all three columns, they are mostly insignificant. The coefficients for CON_AVG are also positive and significant in the yearly cross-sectional regression results reported in Panel B. These findings are in contrast with the univariate results, and confirm the importance of controlling for other potential determinants of debt maturity structure. Overall, these results provide evidence in support of H1.
Conservatism and Externally Financed Growth
We next examine the relationship between conservatism and the firm’s ability to grow in excess of its estimated internally financed growth rate (IG) and its maximum short-term financed growth rate (SFG). IG measures the maximum growth rate the firm can obtain by utilizing only its internal resources. Therefore, any growth in excess of the firm’s internally financed growth rate reflects growth financed through all external sources, including short-term debt, long-term debt, and equity. SFG provides an estimate of the maximum growth rate that can be achieved utilizing only internal resources and short-term financing without any long-term borrowing or equity issuance.
Table 3 provides regression results for models with dependent variables based on IG and SFG. Column (A) provides the results for PROP_IG (the proportion of years from t+1 to t+3 that the firm’s sales growth exceeds IG), and Column (B) contains results for EXCESS_IG (the average of the firm’s sales growth in excess of IG from t+1 to t+3). Column (C) provides regression results for models utilizing PROP_SFG (the proportion of years from t+1 to t+3 that the firm’s sales growth exceeds SFG) and Column (D) provides results for EXCESS_SFG (the average of a firm’s sales growth in excess of SFG from t+1 to t+3 as the dependent variables).
Externally Financed Growth and Conservatism.
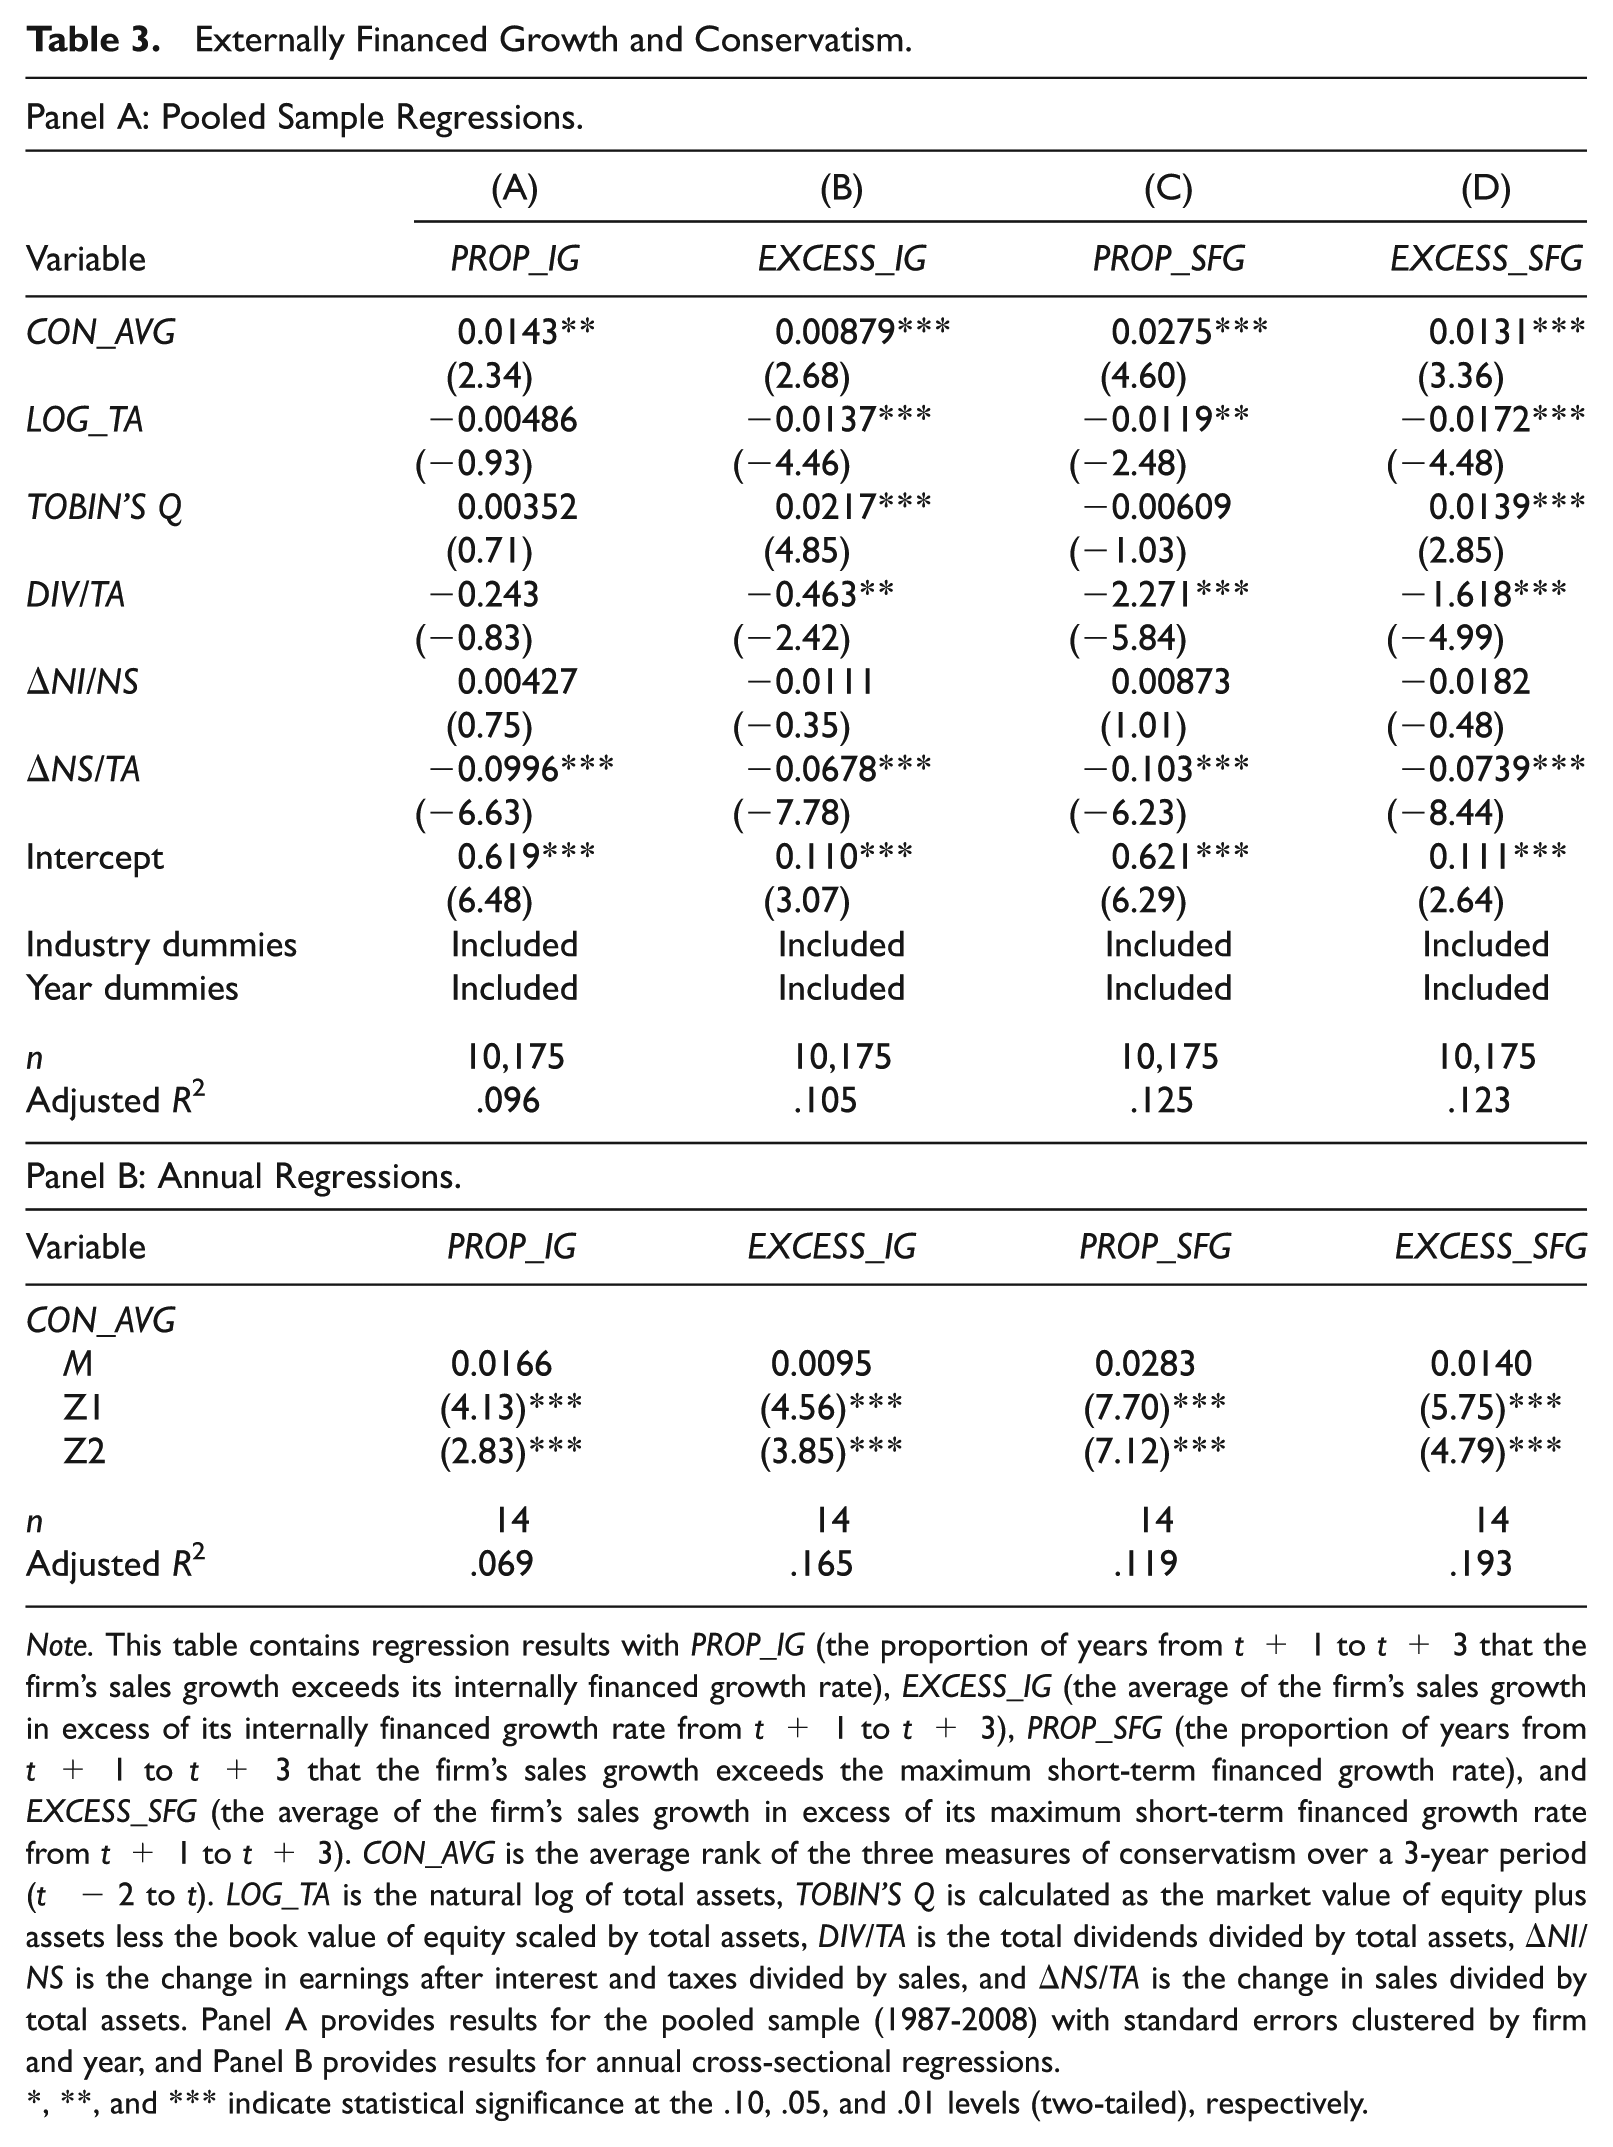
Note. This table contains regression results with PROP_IG (the proportion of years from t+ 1 to t+ 3 that the firm’s sales growth exceeds its internally financed growth rate), EXCESS_IG (the average of the firm’s sales growth in excess of its internally financed growth rate from t+ 1 to t+ 3), PROP_SFG (the proportion of years from t+ 1 to t+ 3 that the firm’s sales growth exceeds the maximum short-term financed growth rate), and EXCESS_SFG (the average of the firm’s sales growth in excess of its maximum short-term financed growth rate from t+ 1 to t+ 3). CON_AVG is the average rank of the three measures of conservatism over a 3-year period (t − 2 to t). LOG_TA is the natural log of total assets, TOBIN’S Q is calculated as the market value of equity plus assets less the book value of equity scaled by total assets, DIV/TA is the total dividends divided by total assets, ΔNI/NS is the change in earnings after interest and taxes divided by sales, and ΔNS/TA is the change in sales divided by total assets. Panel A provides results for the pooled sample (1987-2008) with standard errors clustered by firm and year, and Panel B provides results for annual cross-sectional regressions.
, **, and *** indicate statistical significance at the .10, .05, and .01 levels (two-tailed), respectively.
Panel A provides results for the pooled cross-sectional tests. 14 The coefficients on LOG_TA are negative and mostly significant (p < .01), which is consistent with larger firms being less constrained and, therefore, less dependent on external financing. DIV/TA is negative and significant, which supports dividend paying firms having excess cash and being less dependent on external financing. The coefficients on the change in asset turnover are significantly negative across models. The coefficients for TOBIN’S Q and the change in profit margin vary in both sign and significance across the models. The estimated coefficients for CON_AVG are positive and strongly significant (p < .01) for all four dependent models. 15 Consistent with the results from the pooled sample, the coefficients for the yearly regression (Panel B) are positive and significant (p < .01) across all four models. Overall, our results are consistent with a positive relationship between conditional conservatism and externally financed growth.
Overall, the results are consistent with conservatism facilitating access to external financing and allowing firms to grow in excess of rates utilizing internally generated resources and short-term debt. However, as discussed previously, the expected relationship between short-term financing and conservatism is less clear. The measures of growth utilizing internally generated resources (IG) estimate the firm’s ability to grow using all external financing sources. This includes both short-term and long-term debt as well as equity. Therefore, while the dependent variable includes growth through short-term financing, it does not allow us to examine the effect of conservatism on growth associated with short-term debt directly. To better examine the relationship between conservatism and short-term debt, we construct a measure of firm growth associated with short-term financing (STF). This measure is computed as the difference between growth in excess of the internally financed growth rate (IG) and growth in excess of the maximum short-term financed growth rate (SFG). For example, PROP_STF (equal to PROP_IG−PROP_SFG) measures the proportion of years over the 3-year period that the firm exceeds its internally financed growth rate (IG) but does not exceed its maximum short-term financed growth rate (SFG). EXCESS_STF (equal to EXCESS_IG−EXCESS_SFG) measures the difference between the average growth in excess of the internally financed growth rate and the amount of growth in excess of the maximum short-term financed growth rate. This provides a measure of the growth in excess of the internally financed growth rate that is not associated with long-term borrowing or equity issuance.
The regression results for this measure are provided in Table 4. For the model with PROP_STF as the dependent variable (Column (A)), the coefficient for CON_AVG is negative and strongly significant (p < .01) for both the pooled sample (Panel A) and the annual regressions (Panel B). In the results utilizing EXCESS_STF (the difference in average growth over 3 years) as the dependent variable (Column (B)), the coefficient on CON_AVG is also negative and significant (p < .01) for both the pooled sample and the yearly regressions. Overall, there is evidence supporting a negative relationship between conservatism and firm growth associated with short-term financing. These results are consistent with a potential trade-off between the use of short-term financing and accounting conservatism for mitigating the effects of information asymmetry. The results are also consistent with firms utilizing conservative accounting in response to the need for long-term external financing. 16
Firm Growth Associated With Short-Term Financing and Conservatism.
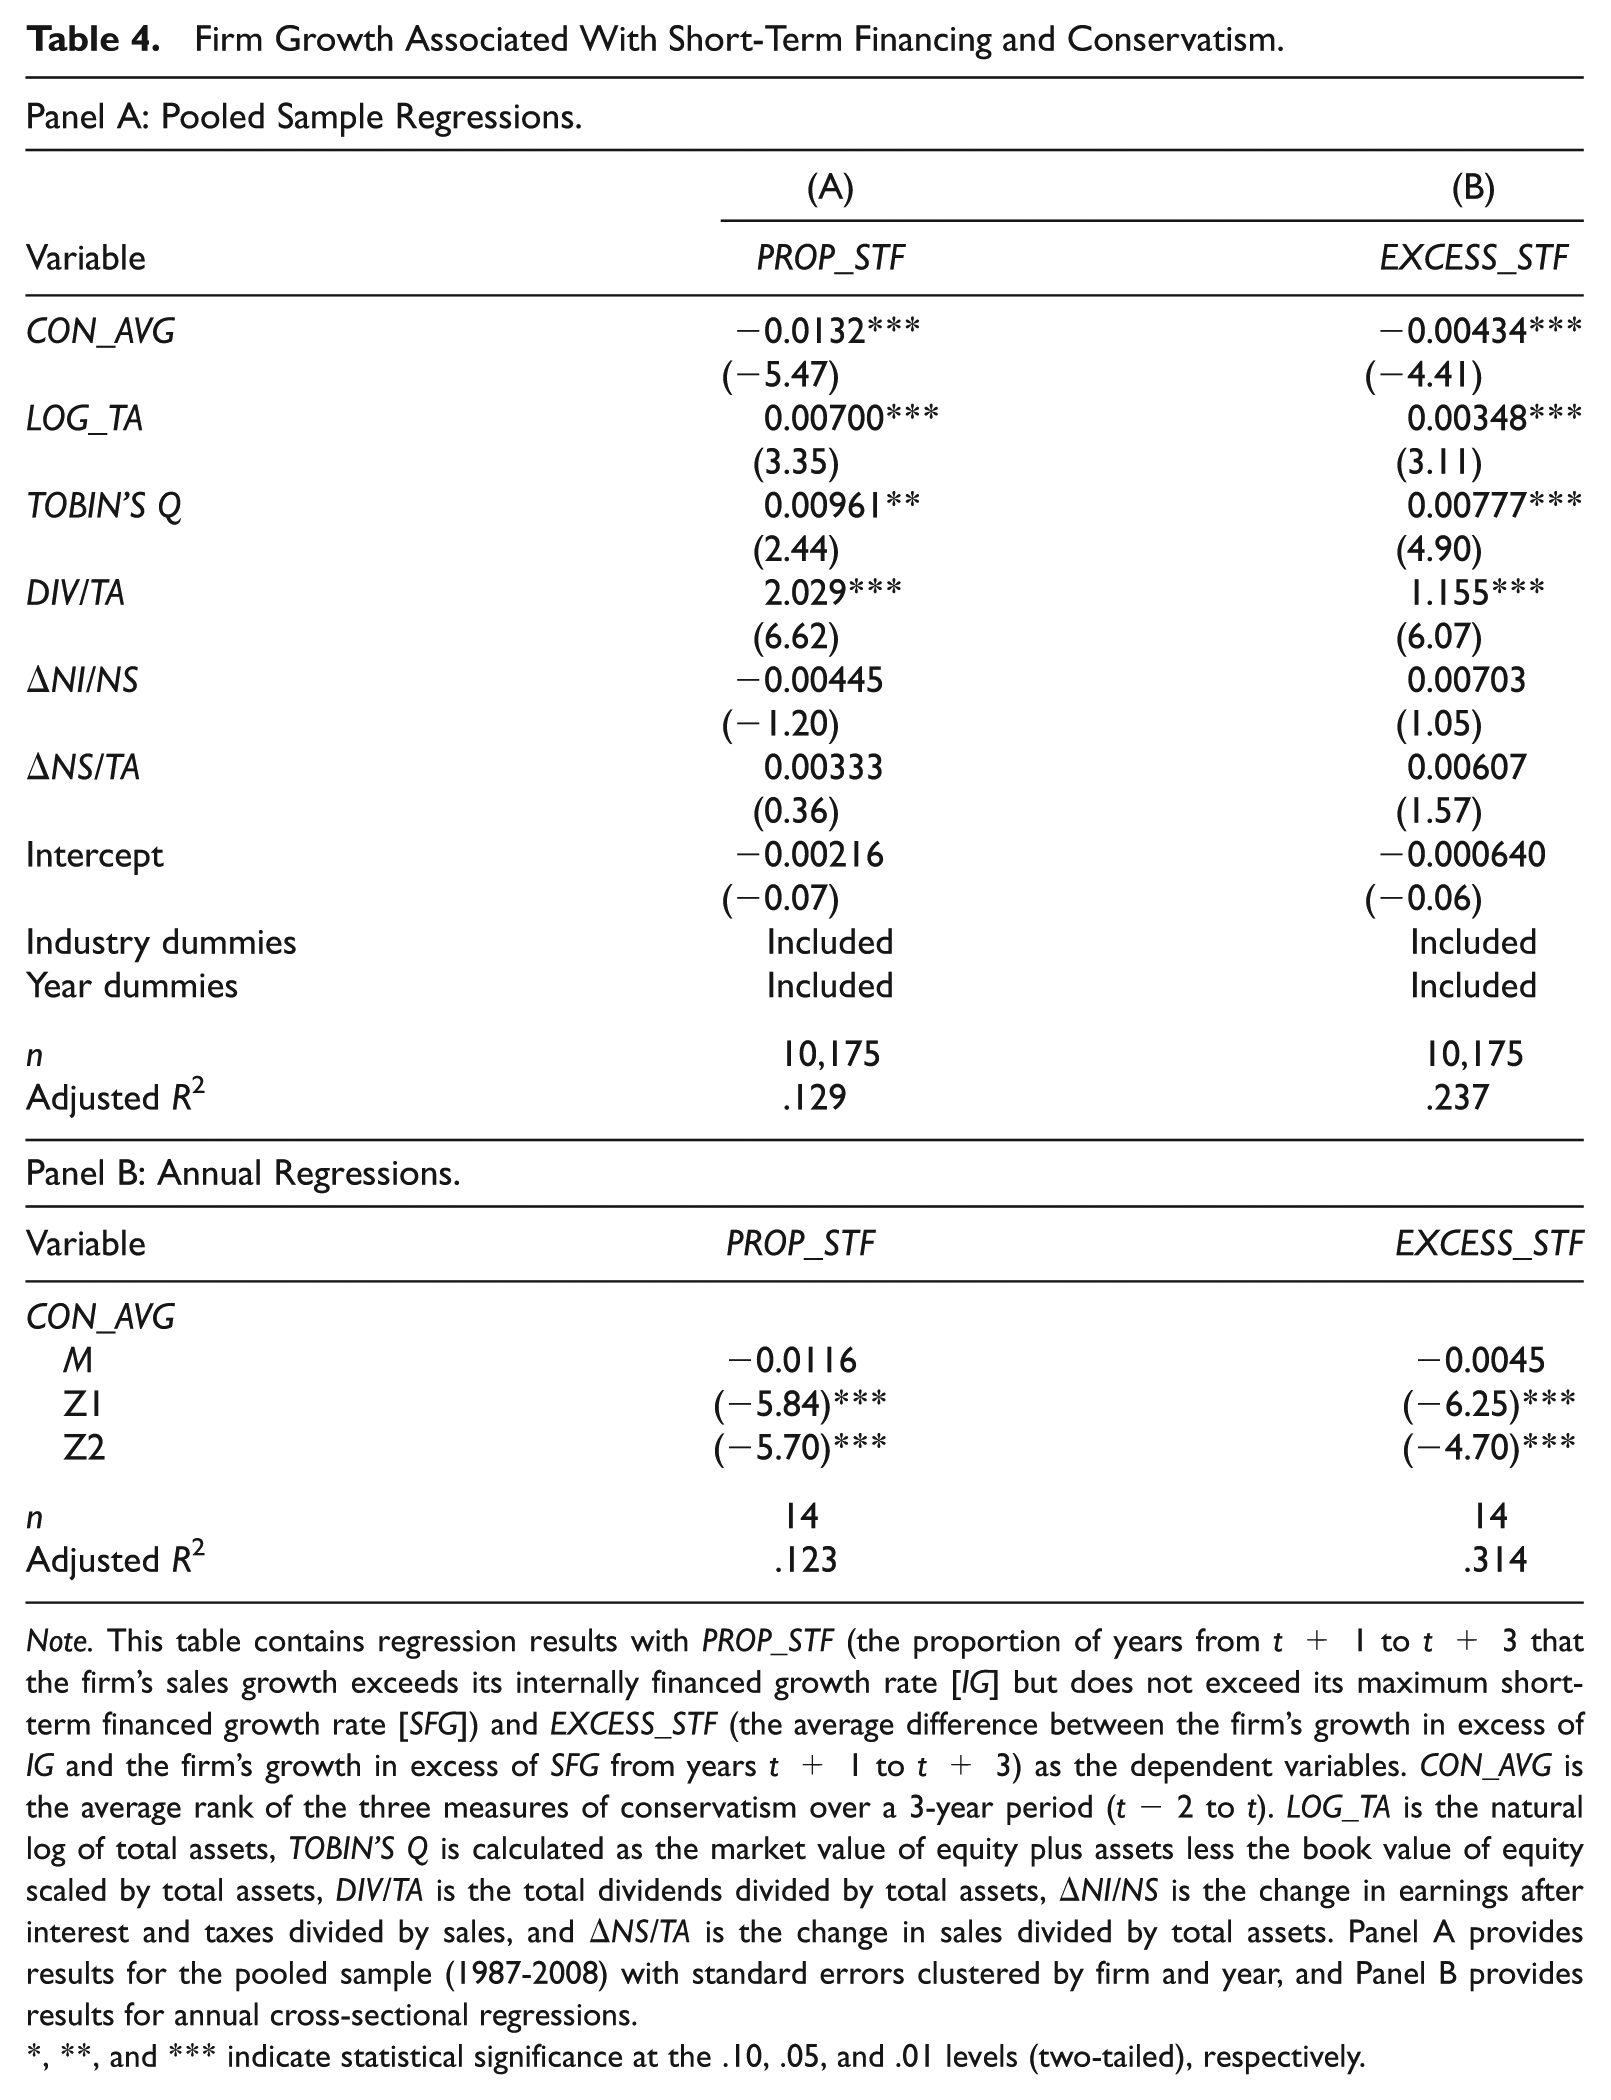
Note. This table contains regression results with PROP_STF (the proportion of years from t+ 1 to t+ 3 that the firm’s sales growth exceeds its internally financed growth rate [IG] but does not exceed its maximum short-term financed growth rate [SFG]) and EXCESS_STF (the average difference between the firm’s growth in excess of IG and the firm’s growth in excess of SFG from years t+ 1 to t+ 3) as the dependent variables. CON_AVG is the average rank of the three measures of conservatism over a 3-year period (t− 2 to t). LOG_TA is the natural log of total assets, TOBIN’S Q is calculated as the market value of equity plus assets less the book value of equity scaled by total assets, DIV/TA is the total dividends divided by total assets, ΔNI/NS is the change in earnings after interest and taxes divided by sales, and ΔNS/TA is the change in sales divided by total assets. Panel A provides results for the pooled sample (1987-2008) with standard errors clustered by firm and year, and Panel B provides results for annual cross-sectional regressions.
, **, and *** indicate statistical significance at the .10, .05, and .01 levels (two-tailed), respectively.
Following Demirguc-Kunt and Maksimovic (1998), we also examine two direct measures of debt-financed growth: PERSTD measures the proportion of increase in total assets financed by short-term debt and PERLTD measures the proportion of increase in total assets financed by long-term debt. Unlike the previous growth measures, PERSTD and PERLTD do not impose any financing constraints on firm growth. Both variables are measured over a 3-year period (t+1 to t+3). As there is evidence that the demand for conservatism is primarily driven by debt markets (e.g., Ball et al., 2008) and it helps alleviate agency problems specific to the firms’ creditors such as excess dividend payments and the “asset substitution” problem (e.g., Ahmed et al., 2002; Beatty et al., 2008; Kothari, Ramanna, & Skinner, 2010), we expect a positive relationship between conservatism and the proportion of increase in total assets financed by long-term debt (PERLTD). Based on H1 and the results for the models utilizing PROP_STF and EXCESS_STF in the previous section, we do not expect a positive relationship between PERSTD and the conservatism measure.
Table 5 provides results for models with PERSTD (Column (A)) and PERLTD (Column (B)) as the dependent variables. As expected, PERSTD is not significant in either the pooled sample results or the annual regressions. For the tests examining PERLTD, the coefficients for CON_AVG are positive and strongly significant (p < .01) for both the pooled sample and the annual regressions. We also perform a test comparing the coefficients for CON_AVG across the two models and find evidence that the coefficient in the PERLTD model is significantly larger than the coefficient in the PERSTD model (p < .01). These results are consistent with the association between conservatism and debt-financed growth being more pronounced for long-term debt relative to short-term debt. Overall, we find evidence in support of H2.
Debt-Financed Growth and Conservatism.
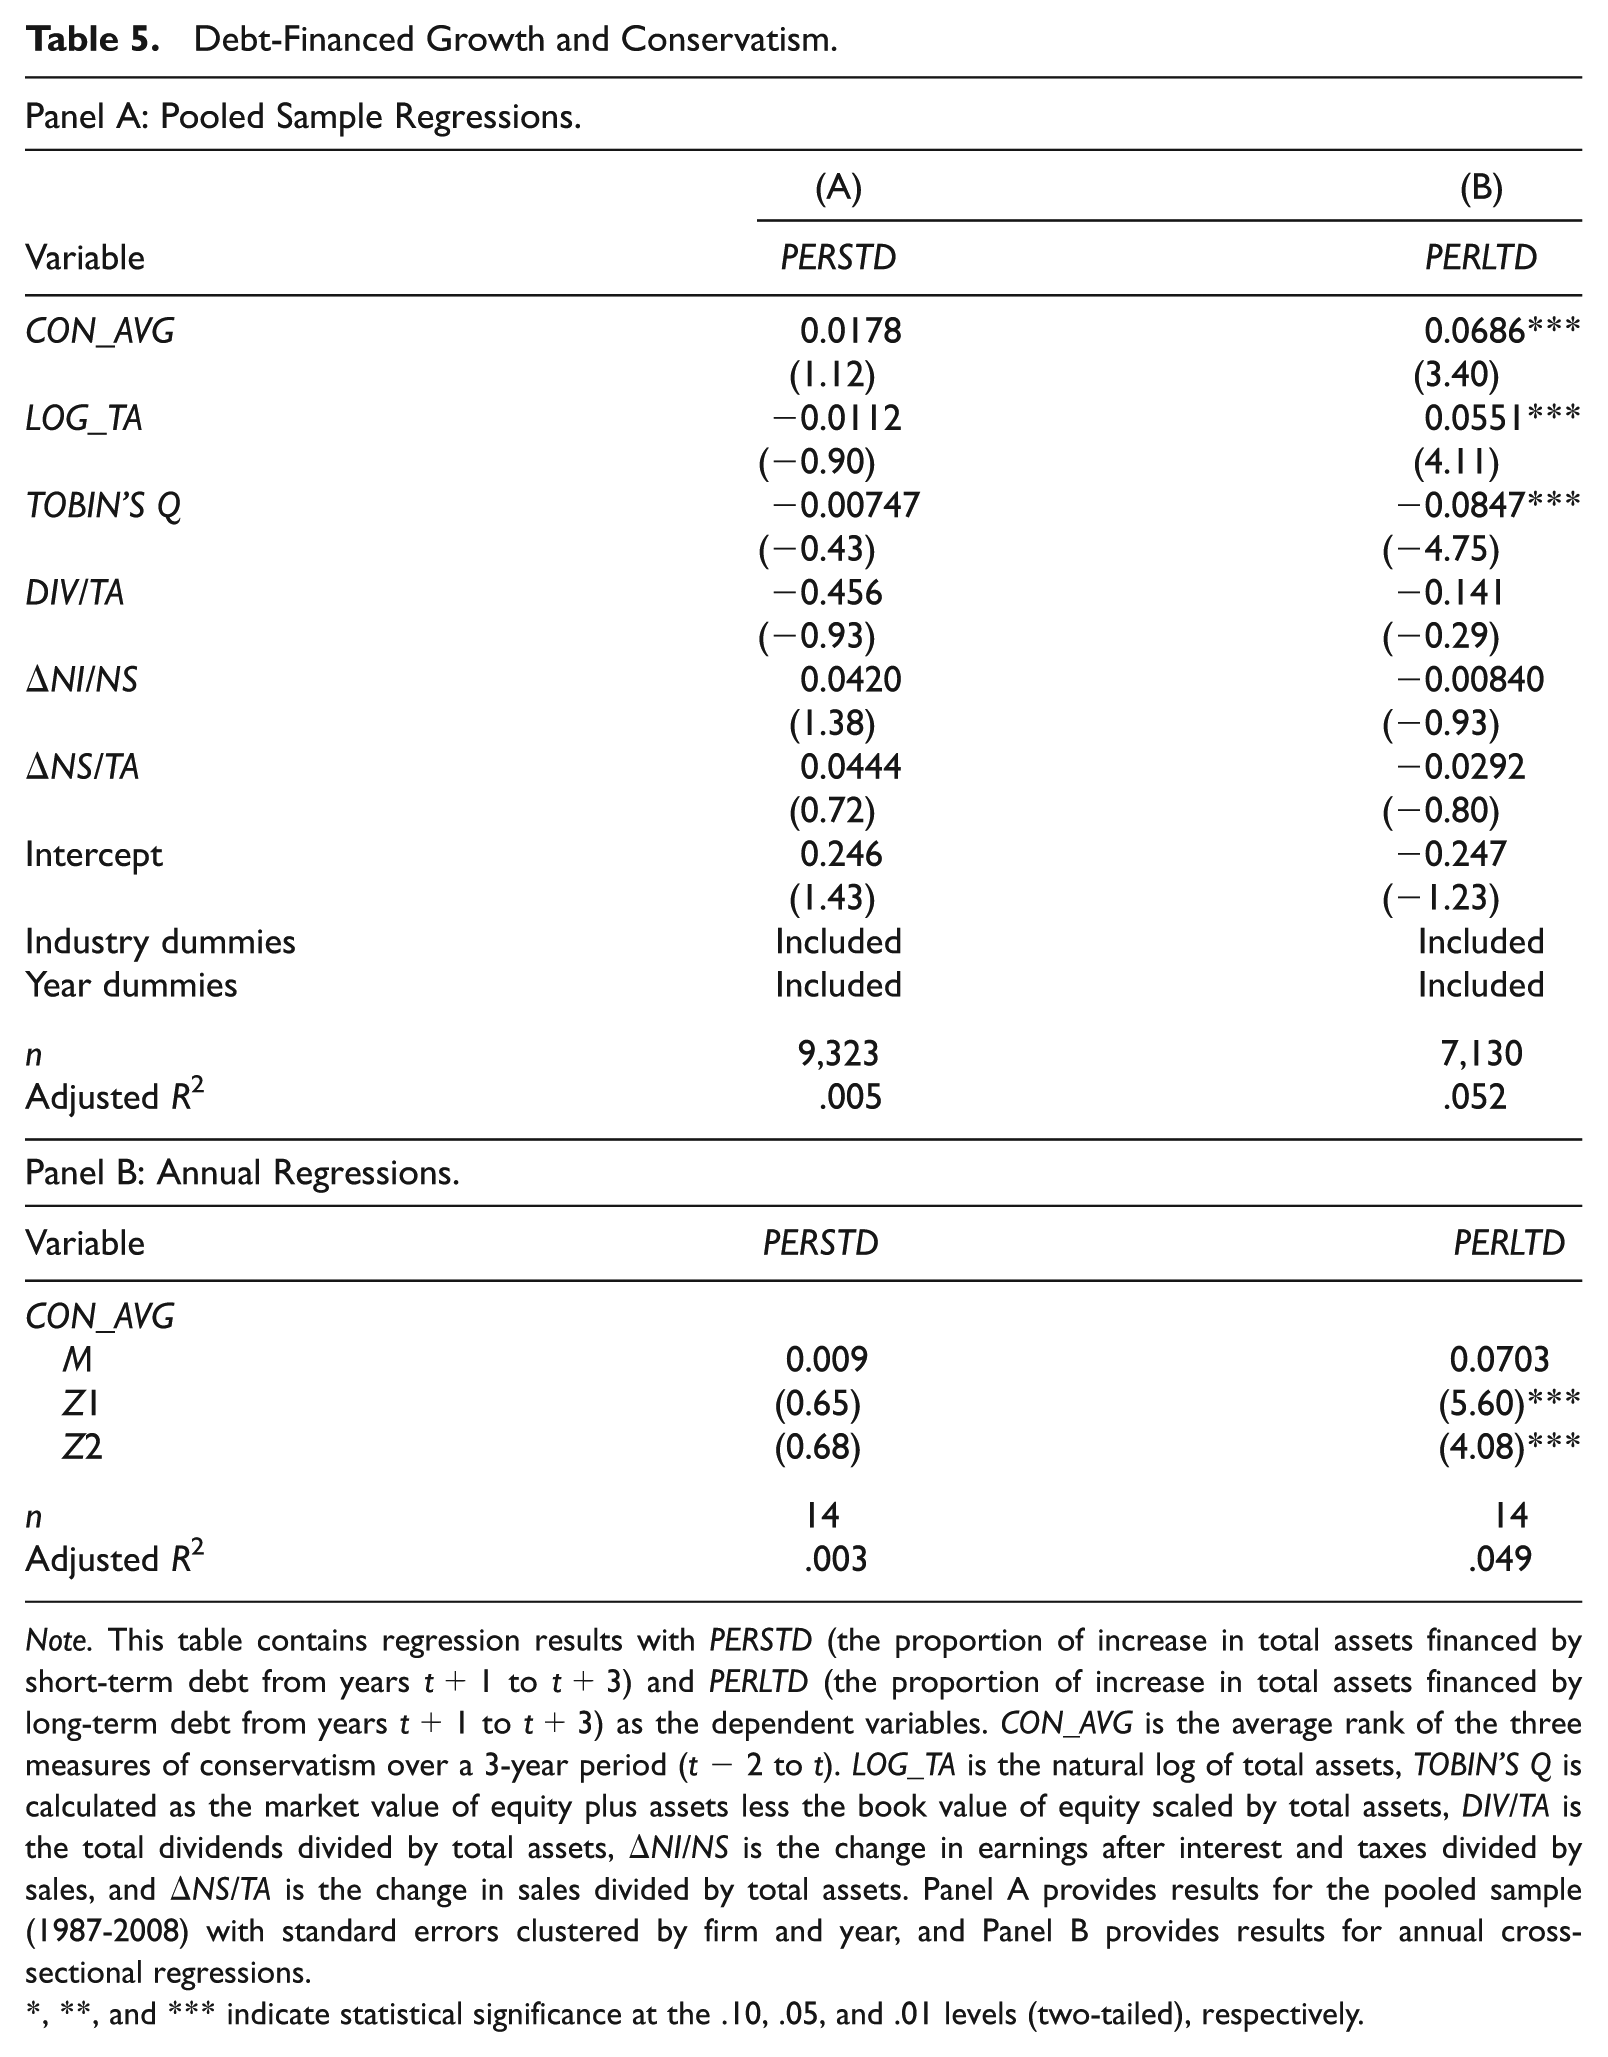
Note. This table contains regression results with PERSTD (the proportion of increase in total assets financed by short-term debt from years t+1 to t+3) and PERLTD (the proportion of increase in total assets financed by long-term debt from years t+1 to t+3) as the dependent variables. CON_AVG is the average rank of the three measures of conservatism over a 3-year period (t− 2 to t). LOG_TA is the natural log of total assets, TOBIN’S Q is calculated as the market value of equity plus assets less the book value of equity scaled by total assets, DIV/TA is the total dividends divided by total assets, ΔNI/NS is the change in earnings after interest and taxes divided by sales, and ΔNS/TA is the change in sales divided by total assets. Panel A provides results for the pooled sample (1987-2008) with standard errors clustered by firm and year, and Panel B provides results for annual cross-sectional regressions.
, **, and *** indicate statistical significance at the .10, .05, and .01 levels (two-tailed), respectively.
The Effect of Corporate Governance
We next examine the effect of the quality of the firm’s corporate governance on the observed results. H3 predicts that the observed associations between conservatism and debt maturity and conservatism and growth associated with long-term debt will be concentrated in stronger governance firms. To perform these tests, we partition our sample into “High Governance” and “Low Governance” firms based on the sample median of the Gompers et al. (2003) index score. 17 Firms with a Gompers et al. score lower than the sample median are designated as “High Governance,” and firms with a score greater than the median are designated as “Low Governance.”
We first examine the effect of corporate governance on the association between conservatism and debt maturity. Table 6 provides results with the percentage of debt maturing in more than 3 years (LT3) as the dependent variable. For the Low Governance firms (Column (A)), the coefficient on the composite conservatism measure is positive in both the pooled sample (Panel A) and annual regression (Panel B) results. However, it is only significant for the annual regressions (p < .05). For the High Governance firms, the conservatism measure is positive and significant in both the pooled sample (p < .01) and annual regression results (p < .01).
The Effect of Corporate Governance on the Relation Between Debt Maturity and Conservatism.
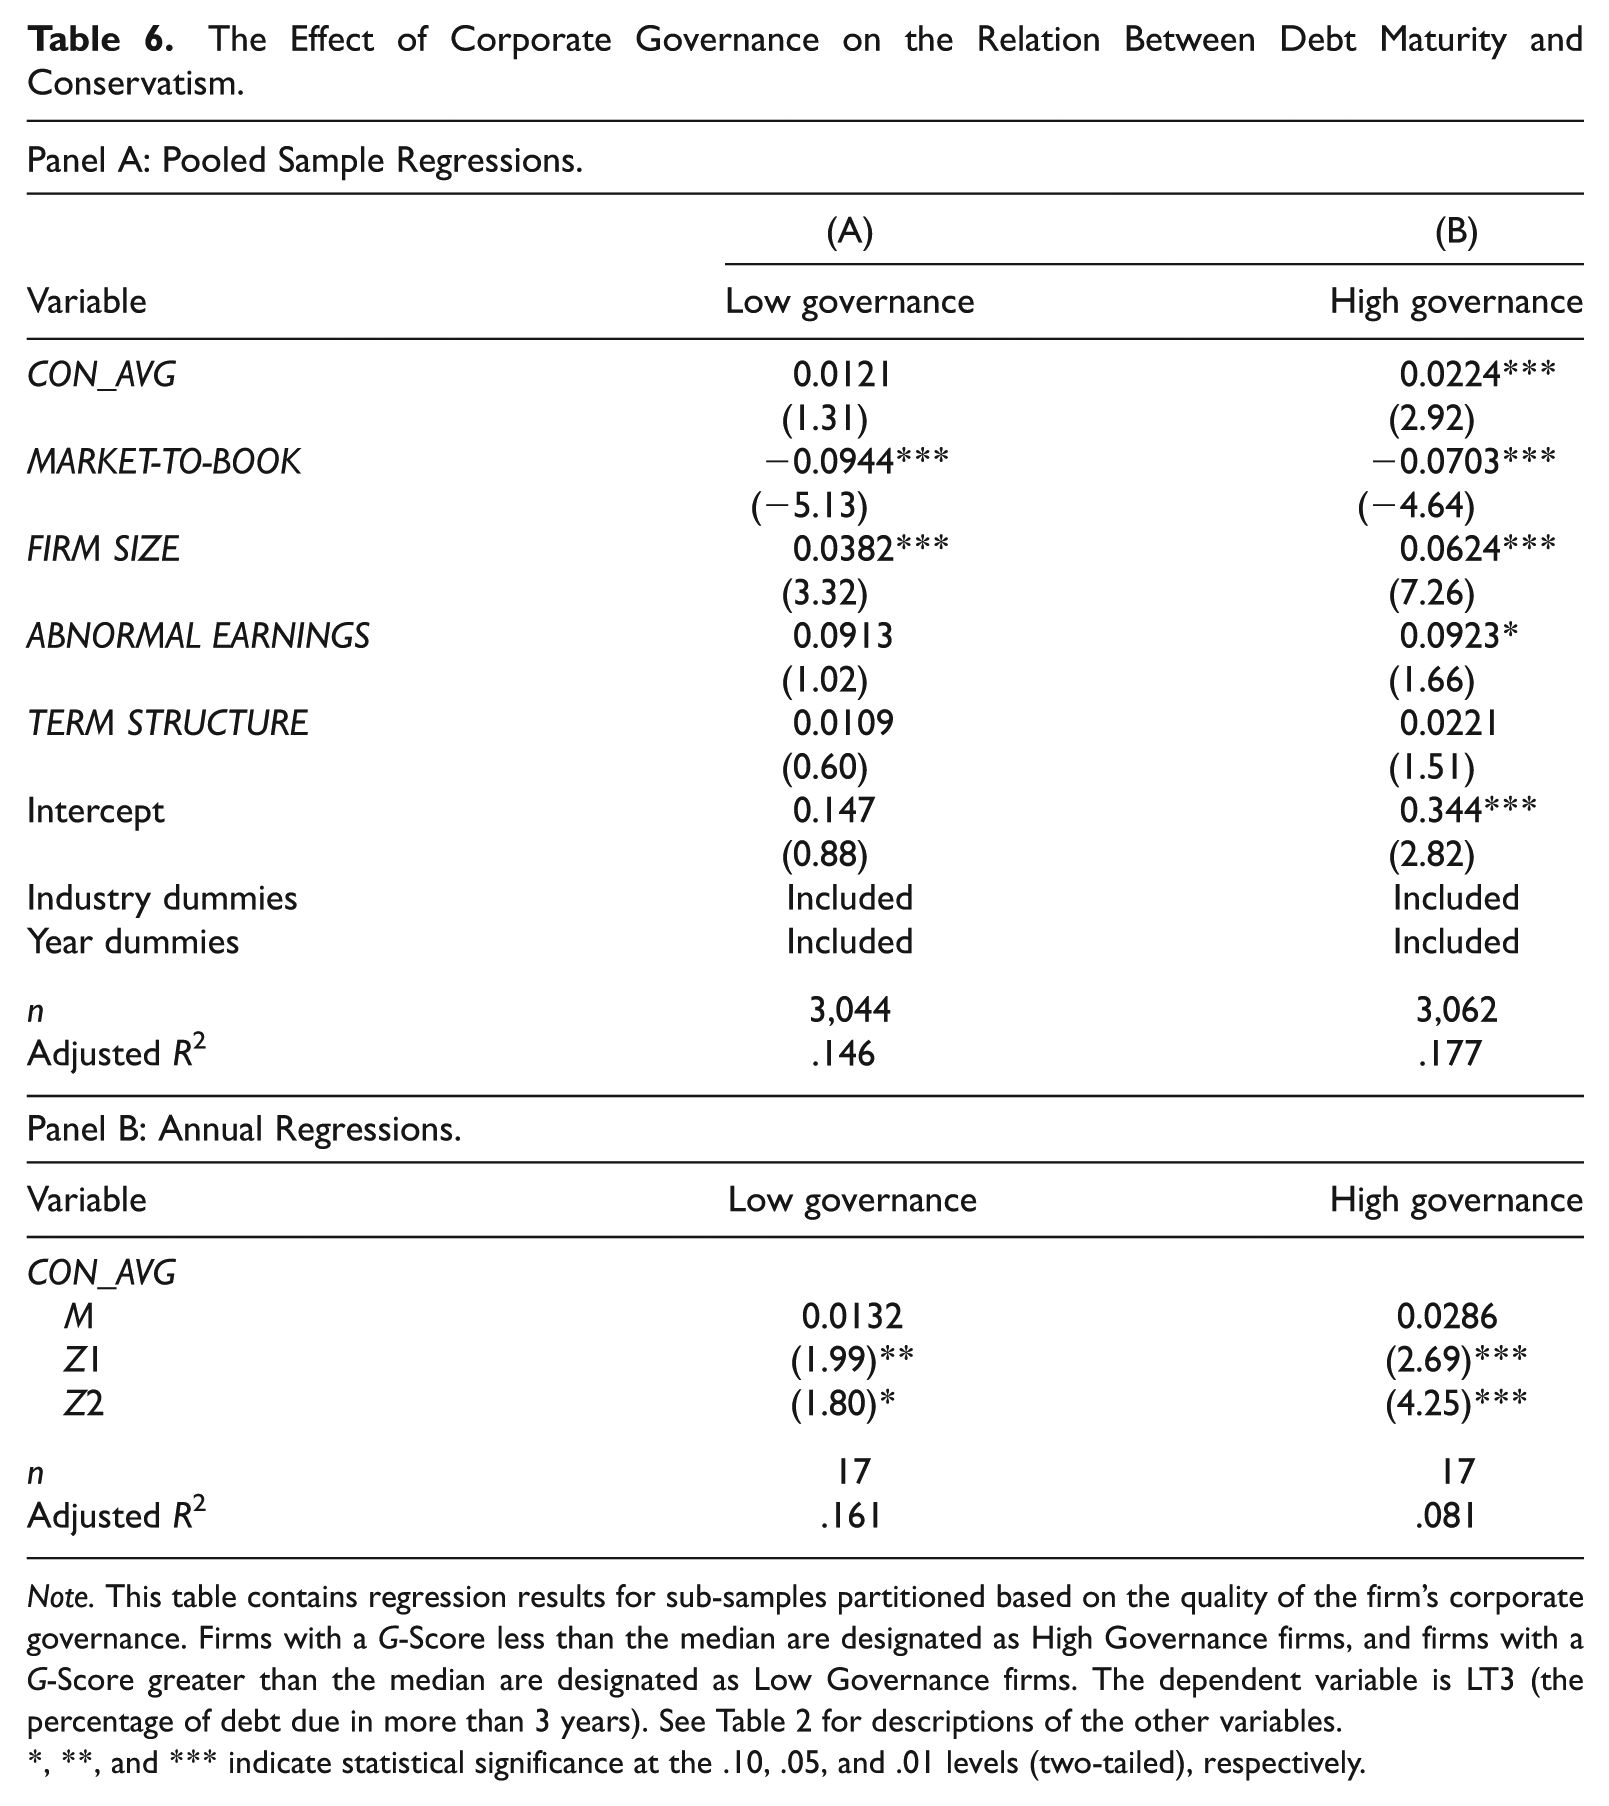
Note. This table contains regression results for sub-samples partitioned based on the quality of the firm’s corporate governance. Firms with a G-Score less than the median are designated as High Governance firms, and firms with a G-Score greater than the median are designated as Low Governance firms. The dependent variable is LT3 (the percentage of debt due in more than 3 years). See Table 2 for descriptions of the other variables.
, **, and *** indicate statistical significance at the .10, .05, and .01 levels (two-tailed), respectively.
Table 7 provides the results with PROP_IG and PROP_SFG as the dependent variables. For Low Governance firms (Columns (A) and (B)), the conservatism measure is not significant in either the pooled sample (Panel A) or the yearly regressions (Panel B). For High Governance firms (Columns (C) and (D)), the conservatism measure is positive and significant for PROP_IG in both the pooled sample results (p < .05) and the yearly regressions (p < .01). For the model with PROP_SFG as the dependent variable, the results are strongly significant in both Panel A and Panel B (p < .01).
The Effect of Corporate Governance on the Relation Between Externally Financed Firm Growth and Conservatism.
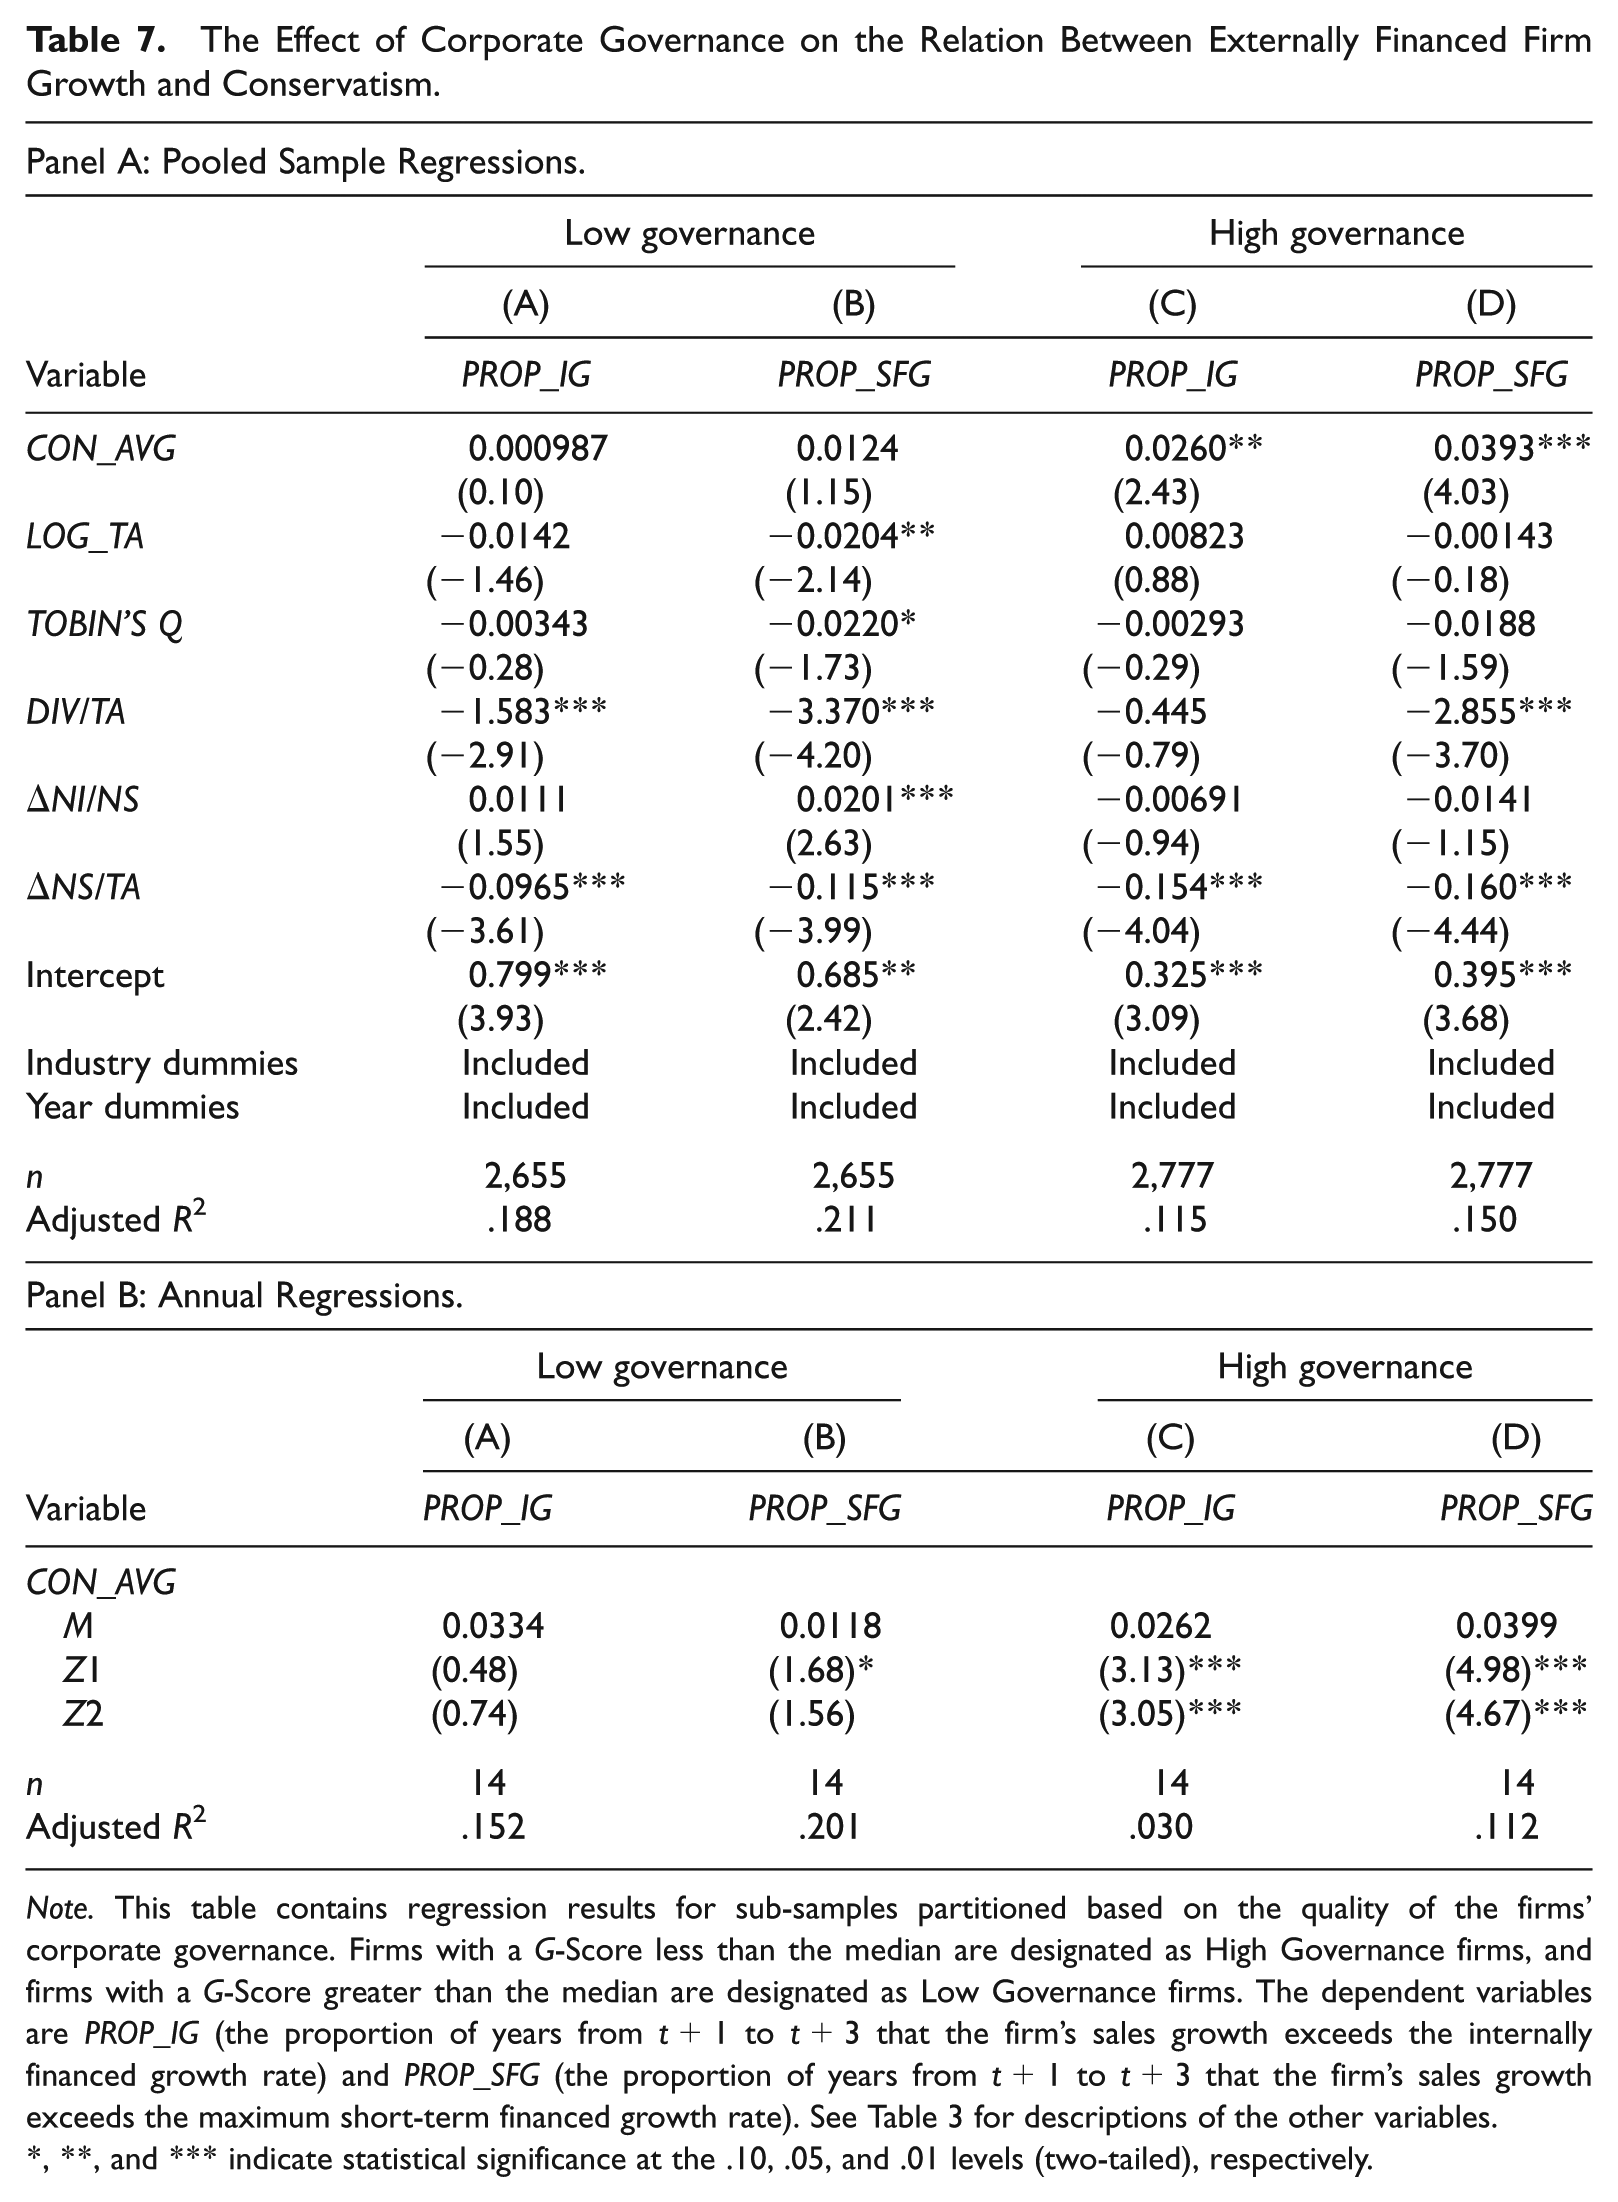
Note. This table contains regression results for sub-samples partitioned based on the quality of the firms’ corporate governance. Firms with a G-Score less than the median are designated as High Governance firms, and firms with a G-Score greater than the median are designated as Low Governance firms. The dependent variables are PROP_IG (the proportion of years from t+1 to t+3 that the firm’s sales growth exceeds the internally financed growth rate) and PROP_SFG (the proportion of years from t+1 to t+3 that the firm’s sales growth exceeds the maximum short-term financed growth rate). See Table 3 for descriptions of the other variables.
, **, and *** indicate statistical significance at the .10, .05, and .01 levels (two-tailed), respectively.
Table 8 provides empirical results for tests examining the effect of corporate governance quality on the relationship between conservatism and the two measures of debt-financed growth (PERSTD and PERLTD). For Low Governance firms, the conservatism variable is positive but not significant for growth associated with both short-term debt (Column (A)) and long-term debt (Column (B)). For High Governance firms, the conservatism measure is not significant for growth related to short-term debt (Column (C)). However, the conservatism variable is positive and significant in the model with PERLTD as the dependent variable (Column (D)). In statistical tests comparing the difference between High and Low Governance firms for PERSTD and the difference between High and Low Governance firms for PERLTD, we do not find evidence that the difference is statistically larger for PERLTD. Overall, most of our results are consistent with the associations between conservatism and debt maturity and conservatism and growth associated with long-term debt being concentrated in stronger governance firms, which provides support for H3.
The Effect of Corporate Governance on the Relation Between Debt-Financed Growth and Conservatism.
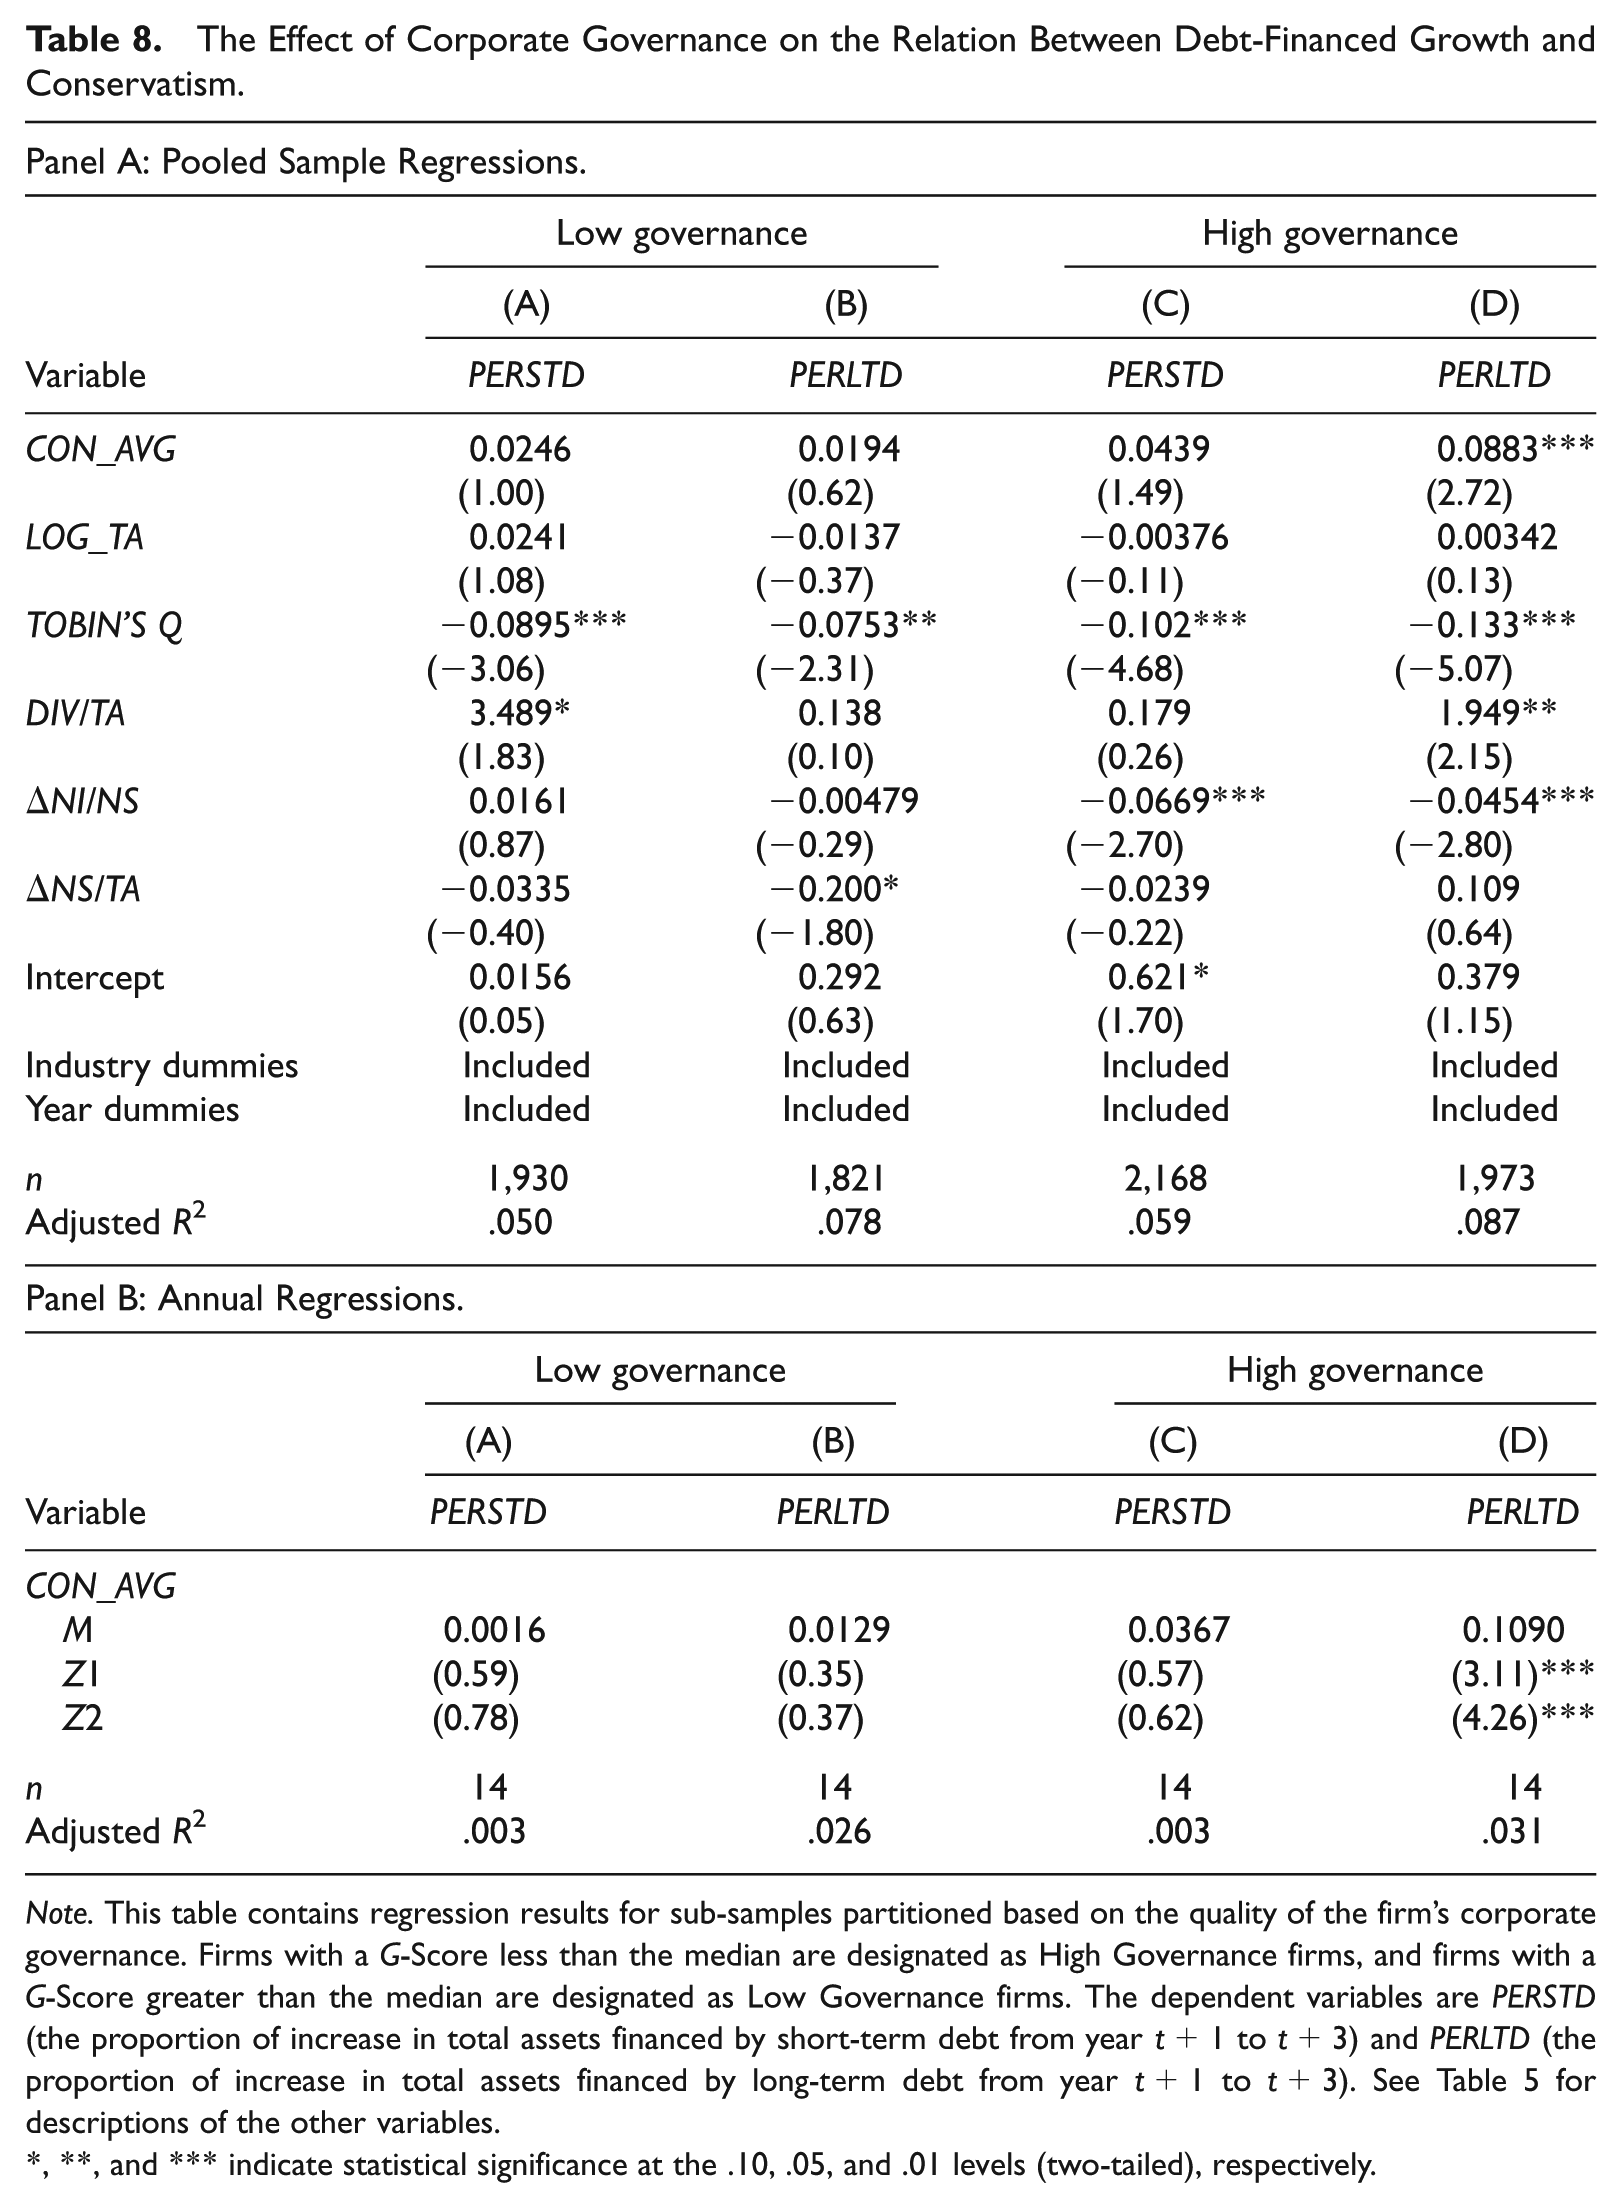
Note. This table contains regression results for sub-samples partitioned based on the quality of the firm’s corporate governance. Firms with a G-Score less than the median are designated as High Governance firms, and firms with a G-Score greater than the median are designated as Low Governance firms. The dependent variables are PERSTD (the proportion of increase in total assets financed by short-term debt from year t+1 to t+3) and PERLTD (the proportion of increase in total assets financed by long-term debt from year t+1 to t+3). See Table 5 for descriptions of the other variables.
, **, and *** indicate statistical significance at the .10, .05, and .01 levels (two-tailed), respectively.
Equity-Financed Growth and Conservatism
We also examine the relationship between conservatism and the proportion of the increase in total assets from year t+1 to t+3 financed by equity issuance (PEREQ). Watts (2003) argues that conditional conservatism benefits both debt and equity holders and increases firm value through a reduction in the costs associated with contracting, litigation, regulation, and taxation. Ball et al. (2008) also suggest that both debt and equity markets demand conservative accounting but that the demand for conservative accounting originates primarily from debt markets. Gox and Wagenhofer (2009) provide analytical evidence that conservative accounting is an optimal result for firms seeking to obtain debt or equity financing to fund a risky project.
Table 9 provides results with PEREQ as the dependent variable. The coefficient for the conservatism measure is positive and significant in the pooled sample (p < .10) but is not significant in the results using annual regressions. In addition, the t statistics are generally smaller than what is observed for PERLTD in Table 5. Overall, while there is some evidence of a positive relationship between accounting conservatism and investment financed with equity, the results are much stronger for conservatism facilitating investment financed with long-term debt.
Equity-Financed Growth and Conservatism.
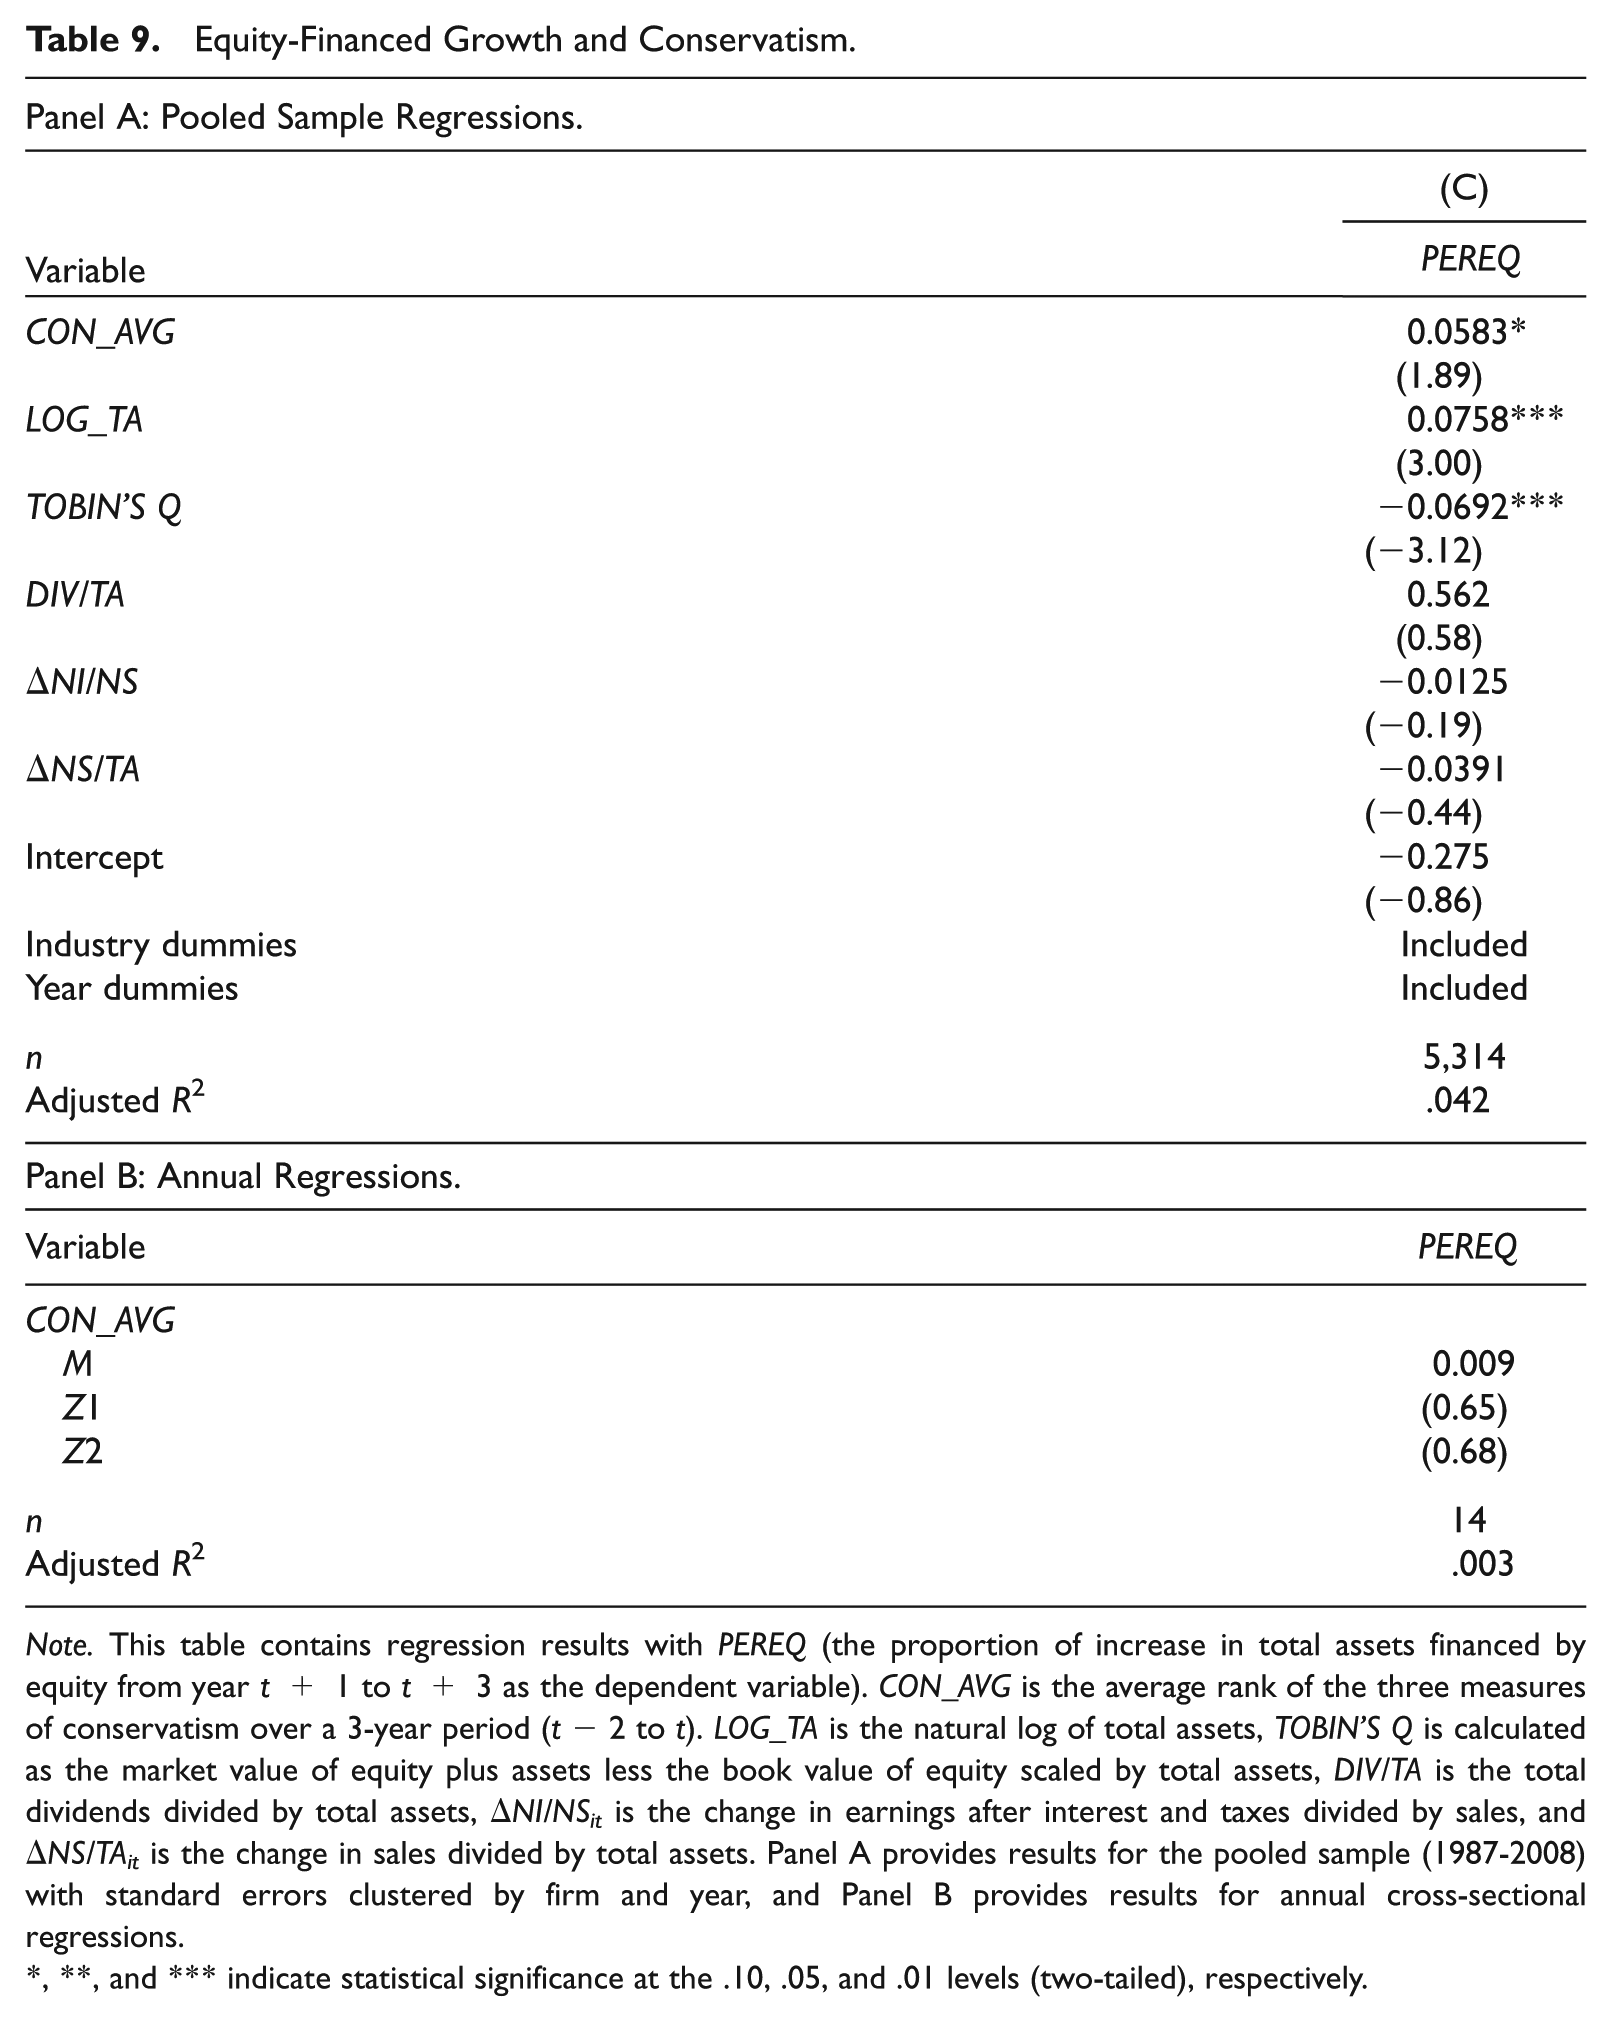
Note. This table contains regression results with PEREQ (the proportion of increase in total assets financed by equity from year t+ 1 to t+ 3 as the dependent variable). CON_AVG is the average rank of the three measures of conservatism over a 3-year period (t− 2 to t). LOG_TA is the natural log of total assets, TOBIN’S Q is calculated as the market value of equity plus assets less the book value of equity scaled by total assets, DIV/TA is the total dividends divided by total assets, ΔNI/NSit is the change in earnings after interest and taxes divided by sales, and ΔNS/TAit is the change in sales divided by total assets. Panel A provides results for the pooled sample (1987-2008) with standard errors clustered by firm and year, and Panel B provides results for annual cross-sectional regressions.
, **, and *** indicate statistical significance at the .10, .05, and .01 levels (two-tailed), respectively.
Conclusion
We examine whether accounting conservatism is associated with debt maturity structure and whether the role of accounting conservatism in facilitating firm growth through external debt varies with its maturity. Prior studies have identified the presence of various agency costs resulting from the separation of investing and financing decisions. The prior evidence is also consistent with accounting conservatism helping to address these various agency costs. As shortening the maturity of debt is also a potential mechanism for addressing many of these costs, we predict that the demand for conservative accounting as a monitoring mechanism is expected to be greater for long-term debt.
In a sample of U.S. firms over the time period from 1987 to 2008, we find a positive relationship between conservatism and debt maturity. We also observe that conservative accounting is positively related to future externally financed growth and that this association is concentrated in long-term external capital. Our results contribute to the debate on the role of conservative accounting in financial markets by demonstrating that debt maturity (short term vs. long term) and type of external financing (debt vs. equity) are linked to conservatism. Statement of Financial Accounting Concepts No. 8 does not include conservatism as a desirable quality of accounting information due to its perceived inconsistency with neutrality (Financial Accounting Standards Board [FASB], 2010). Our results suggest that though there may be some drawbacks to the conservatism principle, it continues to play an important role in facilitating efficient contracting in the market for long-term debt.
Footnotes
Acknowledgements
We thank Bill Elliott, Wenxia Ge, Giorgio Gotti, Ole-Kristian Hope, Yen-Jung Lee, James Myers, Manuel Sanchez, Bharat Sarath (the editor), and seminar participants at National Taiwan University, University of Arkansas, and University of Texas at El Paso for helpful suggestions to improve the article.
Declaration of Conflicting Interests
The author(s) declared no potential conflicts of interest with respect to the research, authorship, and/or publication of this article.
Funding
The author(s) received no financial support for the research, authorship, and/or publication of this article.