




Abstract
Prior studies find that analysts tend to bias their forecasts upward in poor information environments and downward in rich information environments, consistent with attempts to curry favor with management. We find that investors anticipate this behavior by reducing their response to upward forecasts in poor information environments and downward forecasts in rich information environments. Using Hugon and Muslu’s measure of analyst conservatism as an ex ante indicator of individual analysts’ forecast bias tendencies, we show that the stronger return response they find to conservative analysts’ forecast revisions is restricted to poor information environments, where optimistic analyst bias is prevalent. Our results suggest that analysts pay a price in market influence when their forecasts reinforce analysts’ typical forecast bias for the firm’s information environment. Conversely, analysts whose forecasts conflict with the typical bias for the firm are rewarded with larger than average return responses.
Introduction
Security prices respond strongly to analysts’ earnings forecasts, suggesting that investors view the forecasts as highly relevant for valuing securities. Prior research reveals, however, that individual analyst forecasts tend to be biased upward for some firms and downward for others. Such bias may reduce the information content of the analyst’s forecast revision. If investors anticipate this effect, then they will reduce their response to forecast revisions that are likely to be biased. In this study, we examine the effect of analysts’ forecast-biasing behavior on their market influence. We predict that investors assess the quality of analysts’ private information when they respond to analysts’ forecast revisions and reduce their response when they believe that an analyst’s forecast is distorted by bias. Analysts’ earnings forecasts are an important source of information in the stock market, and our study sheds light on how market participants evaluate their information content. 1
Prior studies find that analysts’ forecast optimism varies with the difficulty of predicting earnings, that is, the firm’s information environment (Das, Levine, & Sivaramakrishnan, 1998). A number of studies show analytically that forecast dispersion is related to the firm’s information environment (Abarbanell, Lanen, & Verrecchia, 1995; Barron, Kim, Lim, & Stevens, 1998; Barry & Jennings, 1992). Later studies use forecast dispersion as a proxy for earnings uncertainty and show that forecast optimism increases with dispersion (Gu & Wu, 2003; Zhang, 2006). Specifically, prior research documents that analyst forecasts are optimistically biased for firms with high analyst forecast dispersion and pessimistically biased for firms with low analyst forecast dispersion (Keskek, Rees, & Thomas, 2013; Tse & Yan, 2008). We label firms as having poor information environments when their analyst forecast dispersion is high and rich information environments when forecast dispersion is low. We conjecture that investors anticipate analysts’ forecast-biasing behavior in poor and rich information environments and are therefore skeptical about forecast revisions that reinforce analysts’ typical forecast bias for the firm’s information environment. Thus, we predict that in poor information environments where analyst forecasts are generally optimistic, returns respond more strongly to downward forecast revisions than to upward forecast revisions. Correspondingly, we predict that in rich information environments where analyst forecasts are generally pessimistic, return responses are higher for upward forecast revisions than for downward forecast revisions. For conciseness and to emphasize the type of bias typical of the information environments, we refer to them as poor/optimistic and rich/pessimistic information environments.
We test our predictions using high and low analyst forecast dispersion as indicators of poor and rich firm-specific information environment, respectively, and separately investigate the market’s response to individual analysts’ forecast revisions across information environments. We first verify that analyst forecasts are optimistically biased for firms with high analyst forecast dispersion and pessimistically biased for firms with low analyst forecast dispersion. Consistent with our expectations, we find lower return responses to analyst forecast revisions that reinforce analysts’ typical forecast bias for the firm’s information environment than to revisions that conflict with that bias. In poor/optimistic information environments, return responses are higher for downward forecast revisions than for upward forecast revisions. Correspondingly, in rich/pessimistic information environments, returns respond more strongly to upward forecast revisions than to downward forecast revisions.
Next, we consider the effects of Regulation Fair Disclosure (FD) and the Global Analyst Research Settlement of 2002. Prior research finds reduced analyst optimism following these regulations (e.g., Guan, Lu, & Wong, 2012; Herrmann, Hope, & Thomas, 2008; Hovakimian & Saenyasiri, 2010; Kadan, Madureira, Wang, & Zach, 2009). We find that analysts’ forecasts are much less optimistic in poor information environments in the post-regulation period than previously, confirming prior evidence that the regulations were effective in reducing optimism. Consistent with the reduced optimistic bias in poor information environments, we find no significant difference in return responses to downward and upward forecast revisions for firms in poor information environments in the post-regulation period.
In contrast to the reduced optimism in poor information environments in the post-regulation period, we find that analysts issue pessimistic forecasts in rich information environments throughout the sample period, indicating that their tendency to be pessimistic in rich information environment is not affected by the regulations. Consistent with this finding, we find lower return responses to downward forecast revisions than to upward revisions in both the pre- and post-regulation periods. We interpret these results as evidence that investors are aware of analysts’ overall tendency to issue optimistic forecasts in poor information environments and pessimistic forecasts in rich information environments. Consequently, investors are skeptical about analyst forecast revisions that contribute to the type of bias prevalent in the firm’s information environment. In contrast, investors view forecast revisions that are against analysts’ typical forecast-biasing incentives as relatively informative and therefore respond more strongly to those forecast revisions.
The analysis described above assumes that investors view all analysts as equally likely to issue biased forecasts. However, it is likely that investors would seek to identify analysts who are especially likely to bias their forecasts. Hugon and Muslu (2010) measure analysts’ conservatism using the direction of their prior-period forecast revisions relative to those of other analysts and find that return responses to forecast revisions increase with the level of the analyst’s conservatism. They argue that investors are aware that analysts on average emphasize good news and suppress bad news, leading to optimistically biased forecasts (Dugar & Nathan, 1995; Easterwood & Nutt, 1999; Hayes, 1998; Hong & Kubik, 2003; Lin & McNichols, 1998). They conclude that investors view conservative analysts as credible because their behavior is against analysts’ typical self-interest. We use Hugon and Muslu’s measure of conservatism as an observable ex ante indicator of the analyst’s propensity to issue lower forecasts than their peers. If our conjectures are correct, then the value of forecasts by conservative analysts should vary with the firm’s information environment. In particular, we expect investors to value analyst conservatism highly in poor/optimistic information environments but to attach little value to analyst conservatism in rich/pessimistic information environments.
We first verify that the conservatism measure is negatively associated with analysts’ optimism in the current period, evidence that this measure is potentially informative to investors. We then show that investors respond more strongly to forecasts by conservative analysts in the full sample, consistent with Hugon and Muslu (2010). Consistent with our predictions, we find that in poor/optimistic information environments, return responses to forecasts are stronger for conservative analysts than for non-conservative analysts. We find no difference in investor responses to forecasts by conservative and non-conservative analysts in rich/pessimistic information environments. Furthermore, in poor/optimistic information environments, the stronger response to conservative analysts is restricted to upward forecast revisions, suggesting that in poor/optimistic information environments, investors are skeptical about upward forecast revisions and use analyst conservatism to assess their credibility. Investors appear to view downward forecast revisions as credible regardless of analyst conservatism as they conflict with the forecast bias typical of poor information environments. Overall, our findings suggest that the value of analyst conservatism varies with the information environment and forecast direction.
Our study makes several contributions. First, we show that investors respond to analysts’ forecast revisions as if they view forecast revisions that reinforce analysts’ typical forecast bias for the firm’s information environment as a reflection of analysts’ self-interest. Prior studies mainly focus on identifying the factors associated with analysts’ optimism and assess investors’ ability to use these factors to infer analysts’ optimism (e.g., Agrawal & Chen, 2007; Hugon & Muslu, 2010; Kadan et al., 2009). Our results suggest that investors also anticipate analysts’ tendency to issue pessimistic forecasts in rich information environments and reduce their response to downward forecast revisions that reinforce analysts’ pessimism.
Second, we extend Hugon and Muslu’s (2010) finding that return responses to analyst forecast revisions are stronger for conservative analysts. We show that the stronger return responses are mainly for firms whose analysts tend to be optimistically biased. For firms whose forecasts tend to be predictably biased downward, we find no difference in return responses to forecasts by conservative analysts and other analysts. Third, our results suggest that to the extent that analysts indeed bias their forecasts, they pay a price in market influence because investors anticipate this behavior. Thus, analysts must weigh the potential benefits of issuing biased forecasts against the accompanying loss of market influence.
The rest of the article is organized as follows. We summarize prior literature and state our hypotheses in “Related Literature and Hypothesis Development” section and describe our sample selection procedures in “Sample Selection” section. We describe our research methods and report our results in “Research Methods, Specification of Empirical Tests, and Results” section. We conclude in the final section.
Related Literature and Hypothesis Development
Analyst Incentives and Forecast Bias
Analysts may bias their forecasts for several reasons. Prior studies suggest that they bias their forecasts upward to please management and thereby increase their access to information (Bradshaw, Richardson, & Sloan, 2006; Francis & Philbrick, 1993; Ke & Yu, 2006; Lim, 2001; Richardson, Teoh, & Wysocki, 2004; Tse & Yan, 2008). A second motivation for issuing optimistic forecasts is to increase trading commissions and improve existing or potential investment banking ties with firms (Beyer & Guttman, 2011; Cowen, Groysberg, & Healy, 2006; Dugar & Nathan, 1995; Hayes, 1998; Hong & Kubik, 2003; Kolasinski & Kothari, 2008; Lin & McNichols, 1998; Lin, McNichols, & O’Brien, 2005). Consistent with the income-generating motivation for optimistic bias, brokerage houses appear to retain and promote optimistic analysts (Cole, 2001; Hansell, 2001; Hong & Kubik, 2003).
Prior studies also find that analysts tend to walk down their earnings to beatable levels over the course of the year. We conjecture that analysts face two conflicting incentives in walking down their forecasts over the course of the year. The first incentive is to please management by increasing the likelihood that the firm reports good news at the earnings announcement (Ke & Yu, 2006; Keskek et al., 2013; Richardson et al., 2004; Tse & Yan, 2008). Matsumoto (2002) argues that firms appreciate pessimistic analysts who issue forecasts that are easier to beat, consistent with the well-established evidence that firms meeting or beating analysts’ forecasts realize a market premium (Bartov, Givoly, & Hayn, 2002; Lopez & Rees, 2002). Bartov et al. (2002) argue that managers actively engage in expectations management to walk down analysts’ forecasts to a beatable level. Consistent with this argument, Cotter, Tuna, and Wysocki (2006) find that managers tend to issue pessimistic earnings guidance and that analysts quickly respond to management guidance, and their forecasts convergence upon the guidance. Clement, Frankel, and Miller (2003) document similar evidence that analysts’ forecasts tend to converge to management earnings guidance and, hence, have less dispersion. 2 Overall, the empirical evidence suggests that firms with rich information environments tend to have pessimistic analyst forecasts.
A second objective is to avoid delivering unfavorable news about the firms the analyst covers (Hong, Lim, & Stein, 2000; McNichols & O’Brien, 1997; Scherbina, 2008). Hong et al. (2000) find that poorly performing firms are reluctant to share bad news with the market, thus simultaneously increasing forecast bias and contributing to a poor information environment. Scherbina (2008) shows that analysts are pressured to withhold bad news by management and their own employers who wish to preserve investment banking relations with the covered firm. Similarly, Zhang (2006) finds that analysts’ underreaction to new information is stronger for bad news than for good news. As a consequence of firms’ withholding bad news and analysts’ sluggishness in revealing bad news, forecasts in poor information environments tend to be optimistic. In contrast, firms in rich information environments tend to be profitable with relatively little bad news to disclose. Their managers and analysts therefore face little conflict related to news revelation and can focus on walking down forecasts to beatable levels. In summary, analysts’ conflicting incentives in walking down their forecasts in poor and rich information environments results in a positive relation between information uncertainty and analyst forecast optimism.
Hypotheses
Prior studies find that analyst forecast bias is systematically related to firms’ information environments, suggesting that analysts respond to information environment-related incentives by adding price-irrelevant bias to their forecasts. This behavior would increase the noise in analysts’ forecast revisions and reduce their value-relevance. We conjecture that investors seek to obtain unbiased earnings estimates. We further assume that investors cannot identify forecast bias ex ante, but are aware of the typical bias in rich and poor information environments. We expect investors to use the bias in analyst forecasts that is typical for the firm’s information environment to assess the quality of the information in analyst forecast revisions and reduce their response to forecast revisions that are likely to reinforce the typical forecast bias. Forecasts tend to be optimistic in poor information environments, and we conjecture that investors would view upward forecast revisions as more likely to reinforce optimistic bias. We therefore predict stronger return responses to downward forecast revisions than to upward forecast revisions in poor/optimistic information environments. Correspondingly, forecasts tend to be pessimistic in rich information environments, and we expect that investors would view downward forecast revisions as more likely to reinforce pessimism. Thus, we predict stronger return responses for upward forecast revisions than downward forecast revisions in rich/pessimistic information environments. This leads us to Hypotheses 1 and 2, stated in alternate form:
In practice, noisy forecast-biasing behavior is likely to be related to numerous factors such as low analyst ability, inexperience, and investment banking incentives. These factors collectively contribute to an analyst’s tendency to issue forecasts that are higher or lower (more conservative) than those of their peers. Hugon and Muslu (2010) derive a summary measure of analysts’ conservatism based on the direction of their prior-period forecast revisions relative to those of other analysts and find a negative association between the level of analysts’ conservatism and optimism in analysts’ forecasts. They predict that investors evaluate forecasts with the knowledge that analysts on average emphasize good news and suppress bad news, leading to optimistically biased forecasts. Consistent with this argument, they find that the strength of return responses to forecast revisions increases with the level of analysts’ conservatism. Their findings suggest that investors view revisions by conservative analysts as credible because their behavior is against analysts’ typical self-interest. Our evidence shows, however, that the direction of analysts’ overall forecast bias varies with the firms’ information environment, as measured by analyst forecast dispersion. We therefore conjecture that the value of forecasts by conservative analysts will also vary with the firm’s information environment. In particular, we predict that the return responses to forecast revisions will increase with the level of analysts’ conservatism in poor/optimistic information environments, but will decrease with the level of analysts’ conservatism in rich/pessimistic information environments. This leads us to Hypotheses 3 and 4, stated in alternate form:
Sample Selection
We obtain annual earnings forecast data from the I/B/E/S Detail File. We base our empirical tests on fiscal-year data from 1995 through 2008, but collect data from 1984 to measure analyst characteristics such as experience that are based on an analyst’s forecasting history. We follow prior studies in imposing several restrictions to arrive at our final sample (e.g., Clement & Tse, 2003; Sinha, Brown, & Das, 1997). We begin by collecting all forecasts issued within the fiscal year for which the forecast is made and no more than 180 days before the fiscal-year end. Next, we require that each forecast be preceded by a consensus forecast, calculated as the mean of the most recent forecasts issued within 90 days before the forecast revision day by any analyst following the firm. We further require that the analyst’s forecast differ from the preceding consensus, so that the forecast revision is different from zero. Third, we delete observations with no prior-year forecasts, because we include prior forecast accuracy in our regression models. Fourth, we obtain returns data from the Center for Research in Security Prices (CRSP), and eliminate observations if there are no data on stock returns in the 3 trading days around the forecast revision. We also require that the firm have stock prices available 2 days before the forecast (to deflate the forecast revision) and at the beginning of the fiscal year (to deflate the forecast dispersion measure). Fifth, we require information on several individual-analyst characteristics for our return response model (forecast age, prior-period accuracy, brokerage size, firm experience, forecast frequency, industries and companies followed, and the distance of the forecast from the year-end consensus). We include these variables in the returns model to control for analyst and forecast characteristics that prior studies find to be associated with returns. Finally, we eliminate firm-years with fewer than three analysts to allow reasonable calculation of the forecast dispersion measure. These procedures yield a sample of 488,957 analyst-firm-year observations from 28,416 firm-years.
In Table 1, we report the distributions of the analyst and forecast characteristics variables we use in the regression analyses. We follow Clement and Tse (2003) and scale analyst and forecast characteristics to range from 0 to 1. The distributions for the scaled and unscaled measures are consistent with those reported in prior studies.
Descriptive Statistics for Regression Variables (N = 488,957).
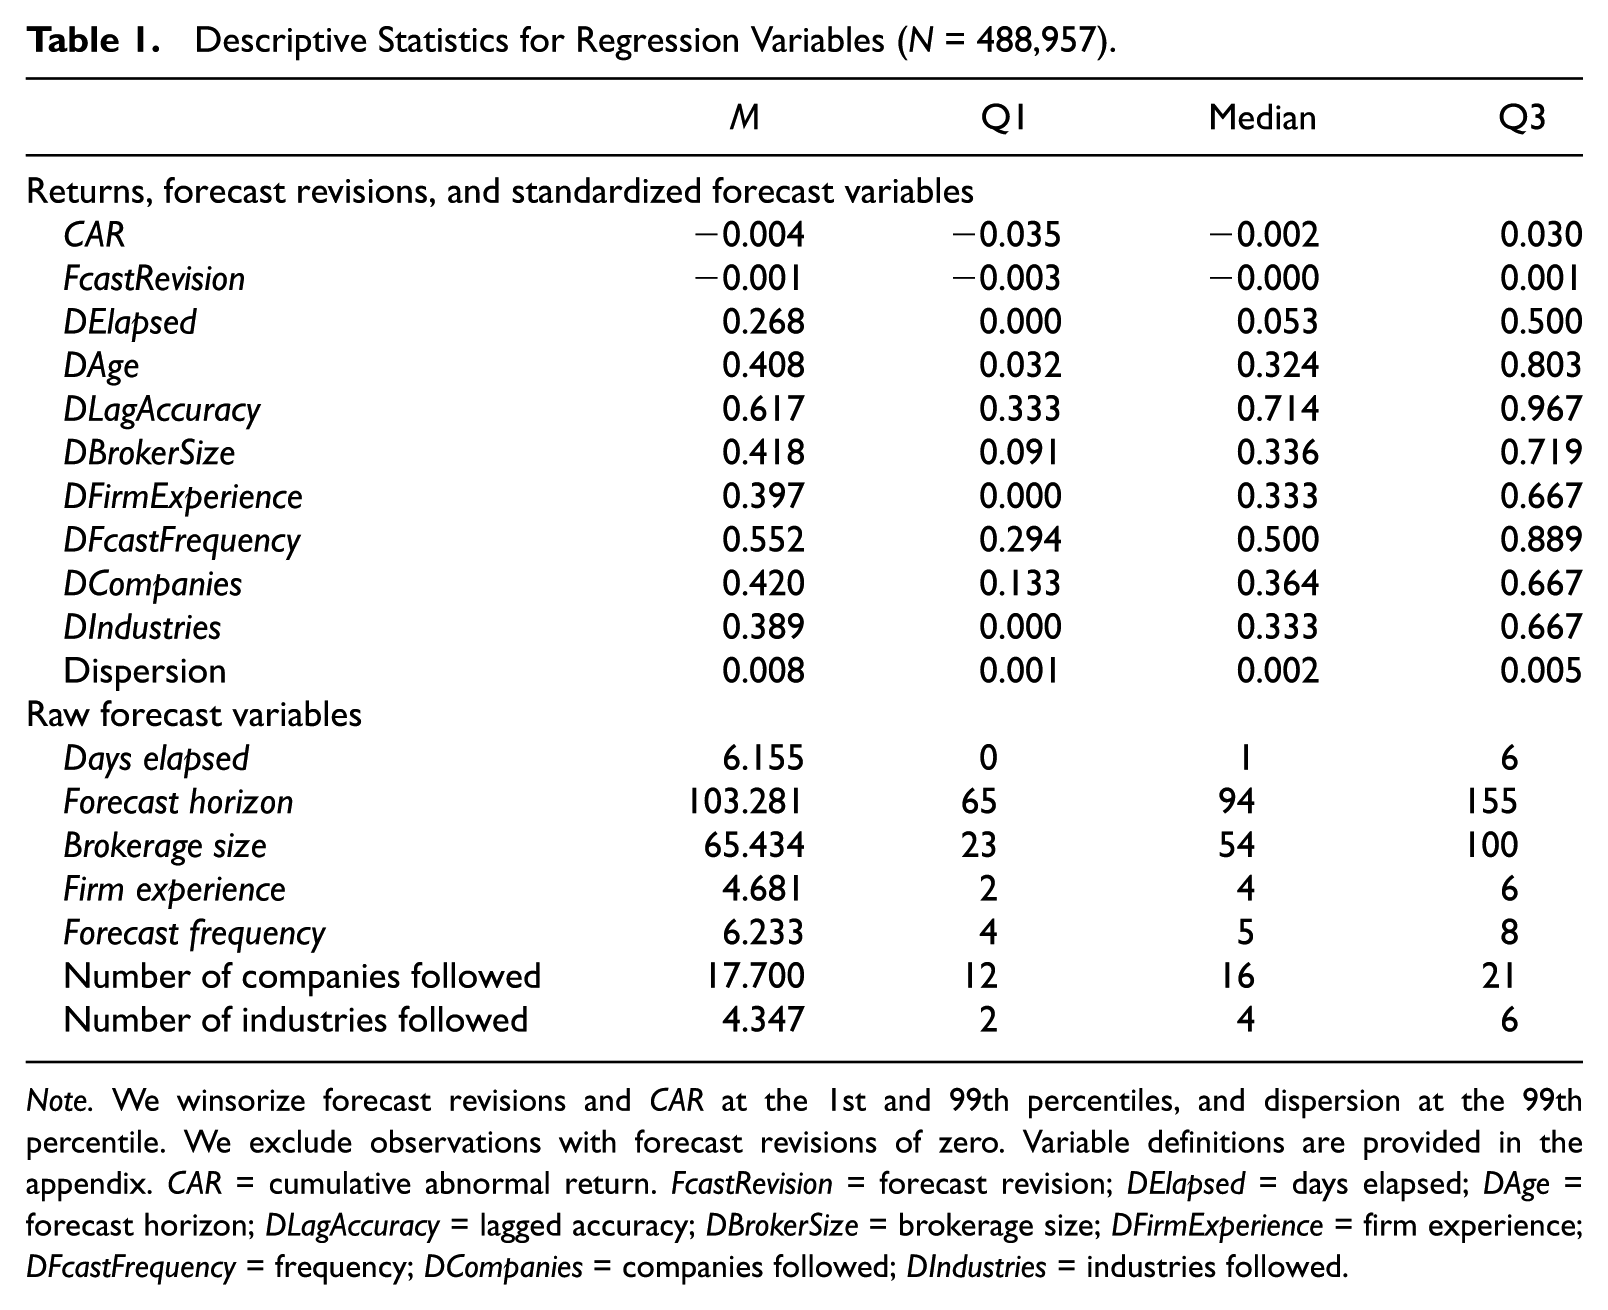
Note. We winsorize forecast revisions and CAR at the 1st and 99th percentiles, and dispersion at the 99th percentile. We exclude observations with forecast revisions of zero. Variable definitions are provided in the appendix. CAR = cumulative abnormal return. FcastRevision = forecast revision; DElapsed = days elapsed; DAge = forecast horizon; DLagAccuracy = lagged accuracy; DBrokerSize = brokerage size; DFirmExperience = firm experience; DFcastFrequency = frequency; DCompanies = companies followed; DIndustries = industries followed.
Research Methods, Specification of Empirical Tests, and Results
Information Environments and Forecast Bias
We use the dispersion in price-deflated analyst forecasts to define rich and poor information environments. We rely on prior studies that show that forecast dispersion reliably reflects uncertainty surrounding inflation forecasts (Bomberger, 1996; Zarnowitz & Lambros, 1987). Other studies extend this interpretation to the relation between analyst forecast dispersion and the firm’s information environment (Abarbanell et al., 1995; Barron et al., 1998; Barry & Jennings, 1992). Gu and Wu (2003) and Zhang (2006) show that forecast optimism increases with dispersion. Collectively, these studies suggest that forecast dispersion is indicative of information available to investors about a firm and support its use as a measure of the firm’s information environment.
We measure dispersion using each analyst’s last forecast for the firm-year in the sample and scale the standard deviation of these firm-year forecasts by the firm’s price at the beginning of the current fiscal period to arrive at our dispersion measure. 3 We classify firms whose forecast dispersion is in the three highest deciles of firm-year dispersion in the poor information group and firms in the three lowest deciles in the rich information group. There are 8,531 firm-year observations in the poor information environment, with 145,627 analyst-firm-year observations, and 8,517 firm-year observations in the rich information environment with 137,410 analyst-firm-year observations. The remaining 205,920 analyst-firm-year observations for 11,368 firm-years are in the middle information environment. 4
We report analysts’ forecast bias by information environment in Table 2. We measure bias using the consensus forecast for each firm-year calculated from the last forecast each analyst provides in the 180-day period before the fiscal-year end for that firm-year. In the poor information environment, 35.9% of the consensus forecasts are pessimistic (i.e., below actual earnings) and 63.6% are optimistic. We observe the opposite pattern in the rich information environments, where 65.0% of the consensus forecasts are pessimistic and 33.7% are optimistic. The proportions of pessimistic and optimistic observations in the neutral information environment are 51.0% and 48.3%, respectively. A chi-square test indicates that there is a significant relation between analyst forecast optimism and the information environment (p < .001). The results are consistent with prior findings and suggest that analyst forecasts are optimistically biased in poor information environments and pessimistically biased in rich information environments (Tse & Yan, 2008). 5
Consensus-Forecast Optimism Across Firms’ Information Environments.

Note. This table reports analyst optimism across information environments. Percentages of firm-years in each information group with pessimistic, optimistic, and accurate consensus forecasts are in parentheses. Analysts’ consensus forecasts are classified as pessimistic if they are below realized earnings and optimistic if they are above realized earnings. The consensus forecast is the mean of individual analysts’ most recent forecasts for the firm-year issued 1 to 180 days before the fiscal-year end. The firm’s information environment in a given year is defined using the dispersion in individual analysts’ last earnings forecasts for the firm-year issued 1 to 180 days before the fiscal-year end. Analyst forecast dispersion is scaled by price at the beginning of the current fiscal period. Firms are classified in the poor information environment sample if their scaled forecast dispersion is in the top three deciles for a given year and in the rich information environment sample if their forecast dispersion is in the bottom three deciles for the year. The remaining firms are classified in the middle information environment.
Prior research finds a significant decrease in analysts’ forecast optimism following the Global Settlement of 2002 (e.g., Guan et al., 2012; Herrmann et al., 2008; Hovakimian & Saenyasiri, 2010; Kadan et al., 2009). In Figure 1, we document that analysts’ forecast optimism in poor information environments declines substantially after 2002 and is less than 50% in 2003 and 2004, with the lowest of 47.7% in 2003. This trend reversed in the last 3 years of the sample period, with optimistic percentages of 54.5 in 2006, 59.8 in 2007, and 74.3 in 2008, suggesting some reversion in analysts’ forecast-biasing behavior to the patterns prevalent before the Global Settlement. In contrast, individual analysts’ forecasts in rich environments are pessimistic in all years, with optimism ranging from 24% to 33% from 1996 to 2007, respectively.
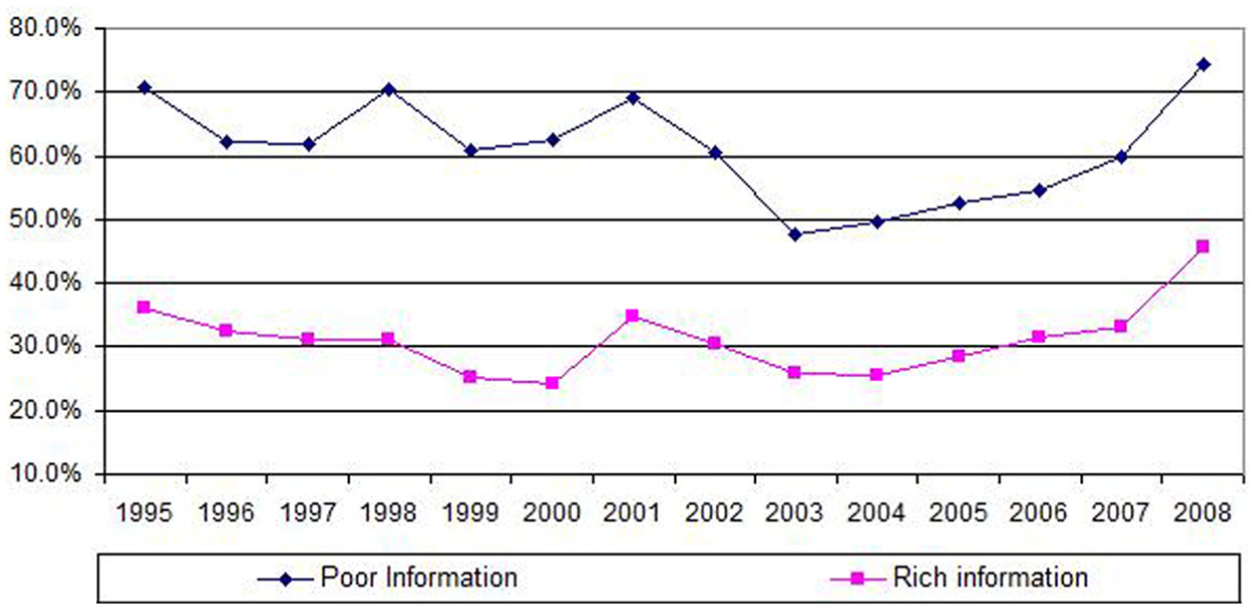
Percentage of forecasts in poor and rich information environments that is optimistic, by year.
Market Responses to Forecast Revisions by Revision Direction Across Information Environments
In this section, we provide descriptive statistics on the return responses associated with forecast revisions by revision direction in rich and poor information environments. This analysis indicates whether investors respond to forecast revisions as if they are aware of the prevailing bias in each environment. We measure forecast revision as the difference between an analyst’s forecast for the firm and the preceding consensus forecast, which is the mean of the most recent forecasts issued by any analyst following the firm within 90 days before the forecast day. We classify forecast revisions as upward and downward if they are above or below the preceding consensus forecasts, respectively. 6 We expect investors to assess the likelihood that a forecast revision contains price-irrelevant bias based on the forecast direction and the firm’s information environment.
Table 3 Panel A reports univariate statistics for the full sample period and for the pre- and post-regulation periods. We estimate forecast revisions and returns around the revision by revision direction, along with the mean of the ratio of returns to forecast revisions, which we refer to as the return ratio. For the full sample period, the return ratio is about 3.849 for the downward forecast revisions and 4.371 for the upward revisions. We also estimate the relation between forecast revisions and returns in the pre- and post-regulation periods. The return ratios in the pre-regulation period (3.238 and 3.148, for downward and upward revisions, respectively) are lower than those in the full sample period and those in the post-regulation period (4.460 and 5.594 for downward and upward revisions, respectively) are higher than those in the full sample period. 7
Mean Abnormal Return and Forecast Revisions by Direction of Forecast Revision and Firm’s Information Environment.
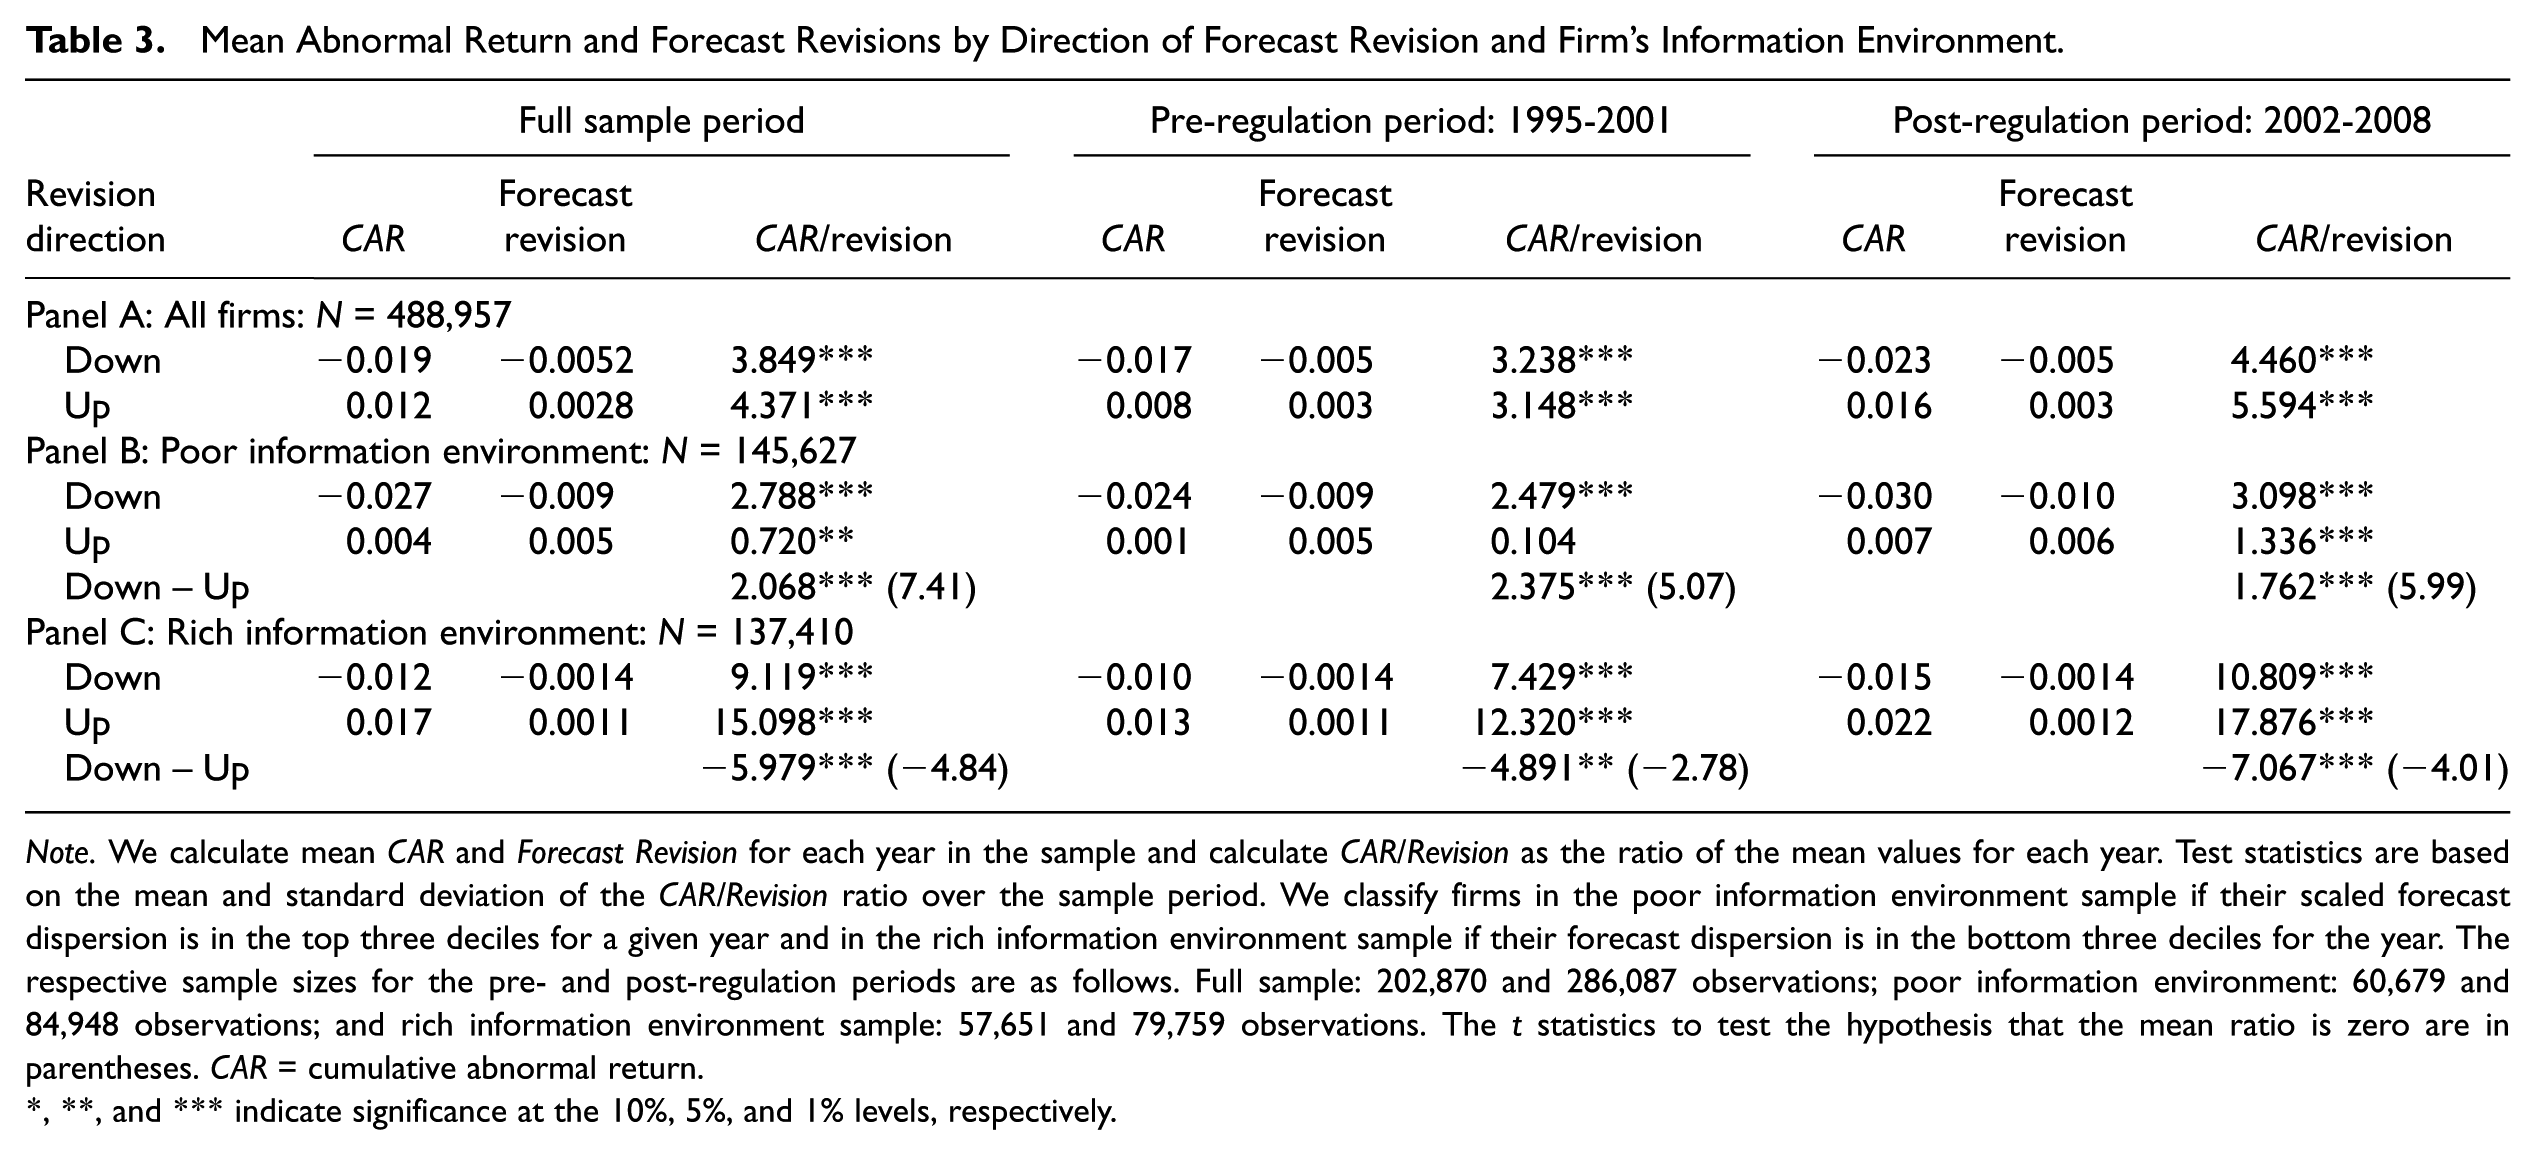
Note. We calculate mean CAR and Forecast Revision for each year in the sample and calculate CAR/Revision as the ratio of the mean values for each year. Test statistics are based on the mean and standard deviation of the CAR/Revision ratio over the sample period. We classify firms in the poor information environment sample if their scaled forecast dispersion is in the top three deciles for a given year and in the rich information environment sample if their forecast dispersion is in the bottom three deciles for the year. The respective sample sizes for the pre- and post-regulation periods are as follows. Full sample: 202,870 and 286,087 observations; poor information environment: 60,679 and 84,948 observations; and rich information environment sample: 57,651 and 79,759 observations. The t statistics to test the hypothesis that the mean ratio is zero are in parentheses. CAR = cumulative abnormal return.
*, **, and *** indicate significance at the 10%, 5%, and 1% levels, respectively.
We report results for firms in poor information environments in Panel B. If investors evaluate forecasts based on the bias typical of a firm’s information environment, then we should observe differential responses to upward and downward forecast revisions across information environments. In the poor/optimistic information environment, the return ratio for the full sample period is 2.788 for downward forecast revisions and 0.720 for upward forecast revisions. The difference is statistically significant at the 1% level, consistent with our expectations. Because we find a significant decrease in analysts’ forecast optimism in poor information environments in the post-regulation period, we expect the difference in return response to upward and downward forecast revisions to be smaller in that period. We provide evidence on variation over time in the return ratio by plotting the ratio in poor information environments by year in Figure 2. Although the return ratio for downward revisions is consistently higher than the ratio for upward revisions throughout the sample period, the figure suggests that the differences in response to upward and downward forecast revisions are smaller in 2001 and later years than in the preceding years. We test this formally in Panel B by comparing the excess of the downward-revision return ratio over the upward-revision ratio. The excess is 2.375 in the pre-regulation period and 1.762 in the post-regulation period, and the difference is significant at the 5% level. Nevertheless, both ratios are significantly different from zero at better than the 1% level. 8 These results suggest that investors respond more strongly to downward forecast revisions that contradict the optimistic bias that is typical of firms in the poor information environment than to upward forecast revisions that reinforce the optimistic bias.
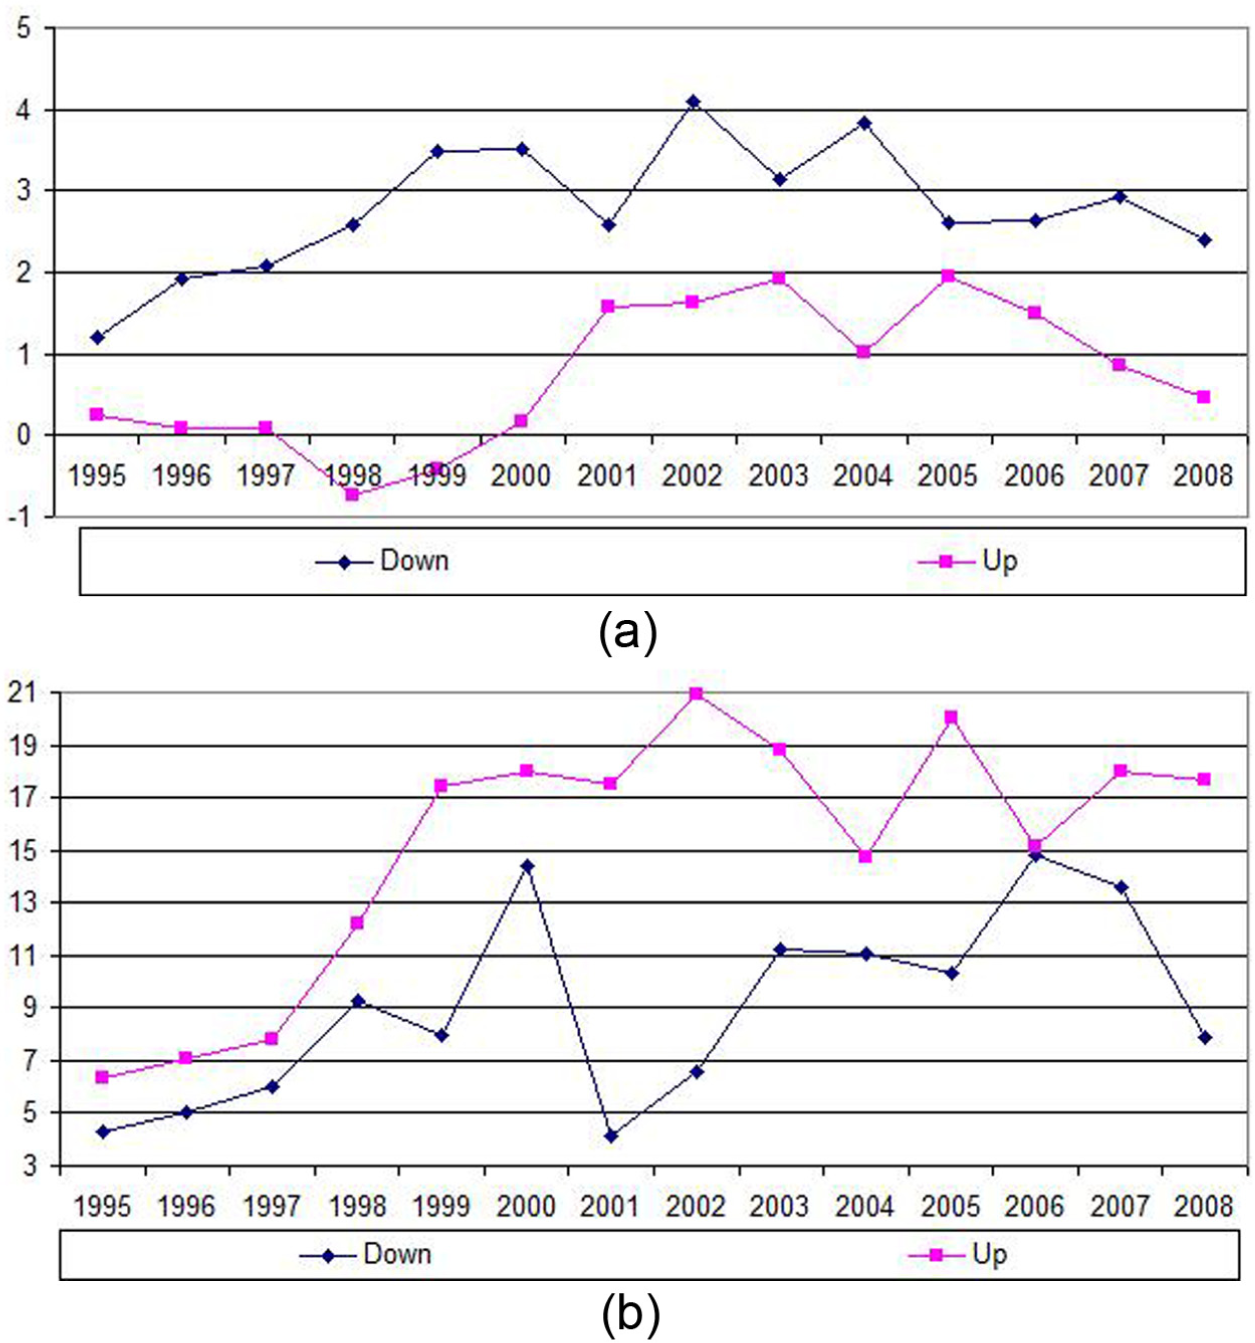
Mean yearly ratio of returns around forecast revisions to forecast revisions (CAR/Rev).
We estimate return ratios for firms in rich information environments and report the results in Panel C. In contrast to the results for firms in poor information environments, we find that return ratios are higher for upward revisions than for downward revisions for firms in the rich/pessimistic information environment. The return ratio is 9.119 for downward forecast revisions and 15.098 for upward forecast revisions, significantly different at the 1% level. We find similar results in the pre- and post-regulation periods. Specifically, the difference between upward and downward revisions is 4.891 in the pre-regulation period and 7.067 in the post-settlement period, and this difference is statistically significant. The plot of yearly return ratios in Figure 2 shows that the ratios for upward forecast revisions consistently exceed those for downward revisions throughout the sample period. Thus, returns respond more strongly to upward forecast revisions that contradict the overall tendency toward pessimism in rich information environments than to downward revisions that reinforce the pessimistic bias. 9
Multivariate Analysis
The univariate statistics above support H1 and H2 and suggest that investors respond more strongly to forecast revisions that are inconsistent with analysts’ forecast-biasing motivations. To examine this question more formally, we estimate the relation between market-adjusted returns and forecast revisions by forecast revision direction in poor and rich information environments. We include controls for variables that are likely to affect the association of forecast revisions with returns to arrive at the estimation model: 10

Variable definitions are provided in the appendix.
We report the results for firms in poor information environments in Table 4, Panel A for the full sample period as well as for the pre- and post-regulation periods. The forecast response coefficients for the full sample period are 1.765 for downward forecast revisions and 1.608 for upward forecast revisions. The difference in coefficients is statistically significant at the 10% level. Figure 1 shows that consensus analyst forecasts are more optimistic in the pre-regulation period than afterward. Consistent with that pattern, we find a larger difference in response coefficients for upward and downward forecast revisions in the pre-regulation period than in the later period. In the pre-regulation period, the return response coefficients to downward and upward forecast revisions in poor information environments are 1.795 and 1.075, respectively, and the difference in coefficients is significant at better than the 1% level. This finding is consistent with H1 and indicates that investors anticipate optimism in analysts’ consensus forecasts in poor information environment in the pre-regulation period and reduce their responses to upward forecast revisions. Consistent with a substantial decline in analysts’ forecast optimism in poor information environments in the post-regulation period, the return response coefficients in that period are 1.904 and 2.023 for downward and upward forecast revisions, respectively. The difference is statistically insignificant.
Analysts’ Forecast Type and Market Response to Forecast Revisions in Poor and Rich Information Environments.
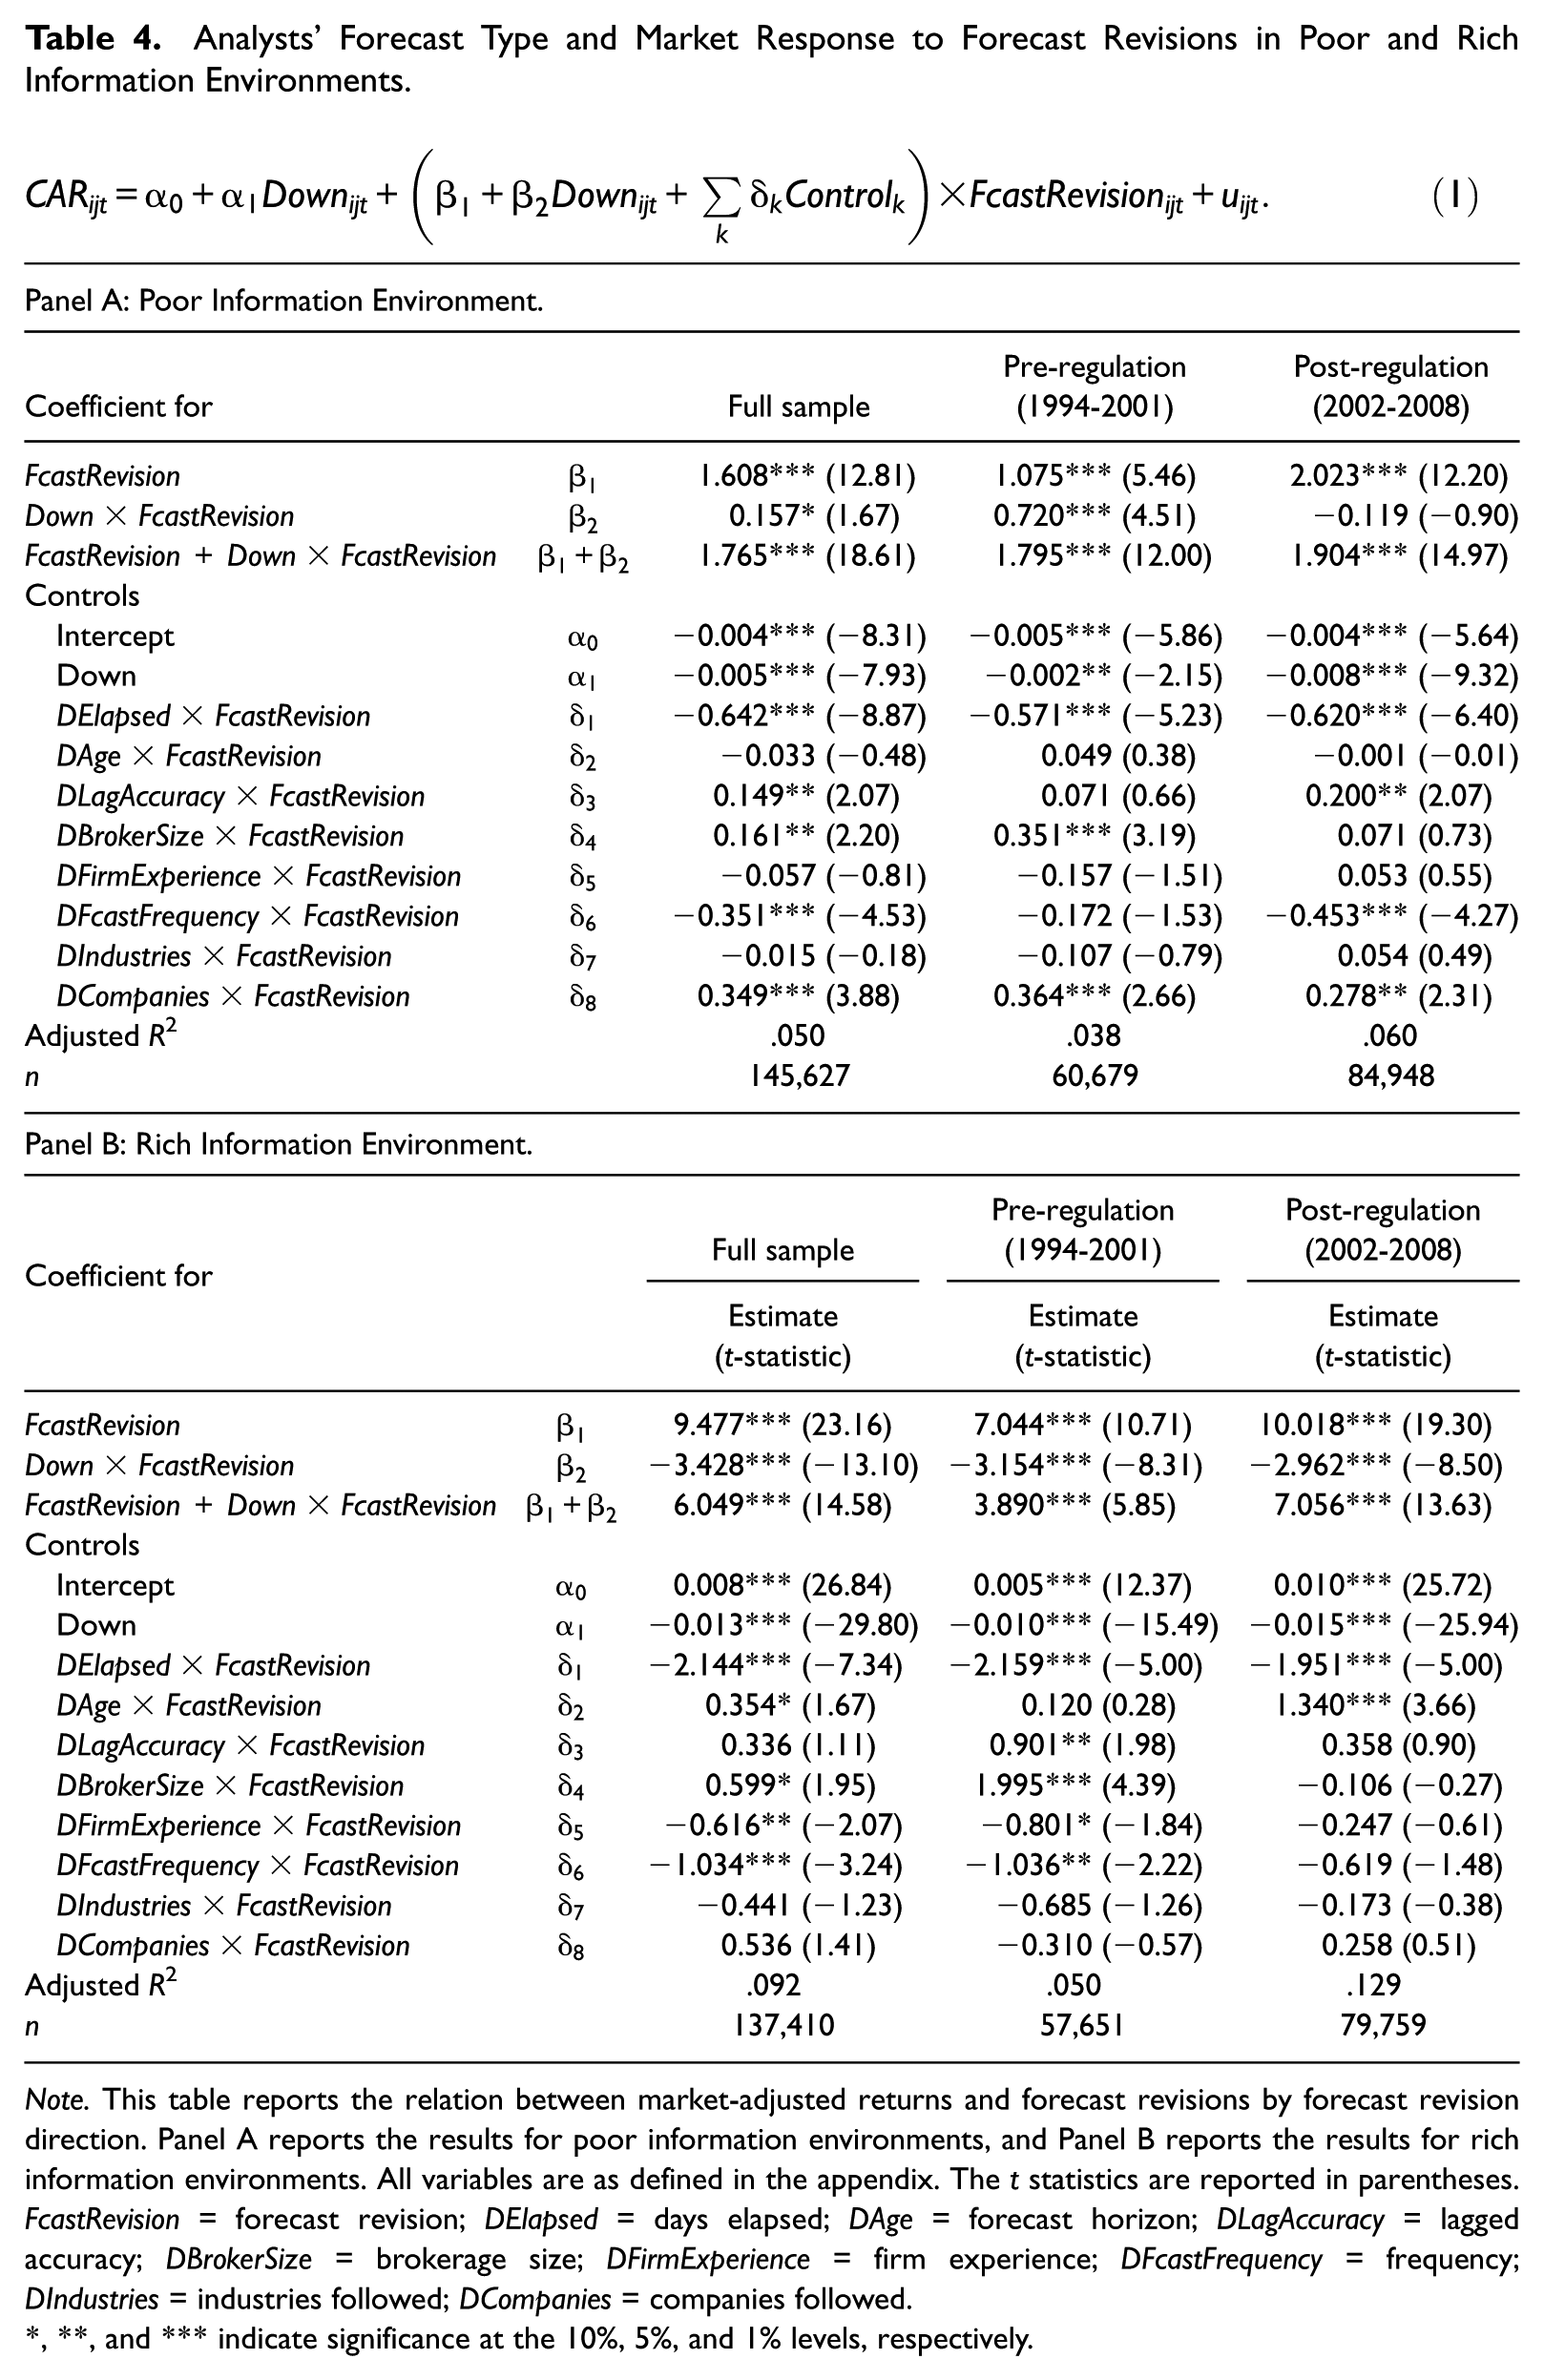
Note. This table reports the relation between market-adjusted returns and forecast revisions by forecast revision direction. Panel A reports the results for poor information environments, and Panel B reports the results for rich information environments. All variables are as defined in the appendix. The t statistics are reported in parentheses. FcastRevision = forecast revision; DElapsed = days elapsed; DAge = forecast horizon; DLagAccuracy = lagged accuracy; DBrokerSize = brokerage size; DFirmExperience = firm experience; DFcastFrequency = frequency; DIndustries = industries followed; DCompanies = companies followed.
*, **, and *** indicate significance at the 10%, 5%, and 1% levels, respectively.
We report results for firms in rich information environments in Table 4, Panel B. The forecast response coefficients for the full sample period, presented in the first column, are 6.049 and 9.477 for downward and upward forecast revisions, respectively, and the difference in coefficients is significant at better than the 1% level. We also estimate the forecast model separately in the pre- and post-regulation periods and find lower return responses to downward forecast revisions than to upward revisions in both sub-periods, consistent with the evidence that analysts’ consensus forecasts are generally pessimistic in rich information environments throughout the sample period. Our findings support H2, suggesting that investors anticipate analysts’ pessimism in rich information environments and reduce their response to downward forecast revisions. Overall, the results suggest that investors assess the information content of analysts’ forecasts based on the bias typical of a firm’s information environment and reduce their response to forecasts that are likely to reinforce analysts’ typical forecast bias.
The Effect of Individual Analysts’ Propensity to Issue-Biased Forecasts on Their Market Influence
In this section, we examine whether investors differentiate among analysts by identifying analysts who are especially likely to bias their forecasts. We use the analyst’s conservatism (Hugon & Muslu, 2010) as an observable ex ante indicator of the analyst’s propensity to be optimistically biased. Hugon and Muslu (2010) measure the consistency of an analyst’s forecast revision with those of other analysts who revise their forecasts at about the same time. They use the closest forecast revisions before and after the analyst’s forecast to proxy for peer analysts’ forecast revisions. Following Hugon and Muslu, we estimate the following model to obtain our conservatism measure:

Variable definitions are provided in the appendix.
As in Hugon and Muslu (2010), we measure analysts’ conditional conservatism by the ratio of their response to bad news versus good news,
We report the distribution of the conservatism measure for the full sample and by information environment in Table 5, Panel A. The distribution is similar in all samples, so we expect the conservatism measure to be equally effective in measuring the effects of conservatism on returns in poor and rich information environments. The conservatism measure is significantly negatively correlated with the analyst’s contemporaneous optimism score, suggesting that it is potentially informative to investors (the correlation coefficient is −0.034, and is not reported in the tables). 11
Analysts’ Conservatism and the Market Response to Forecast Revisions by Information Environment.
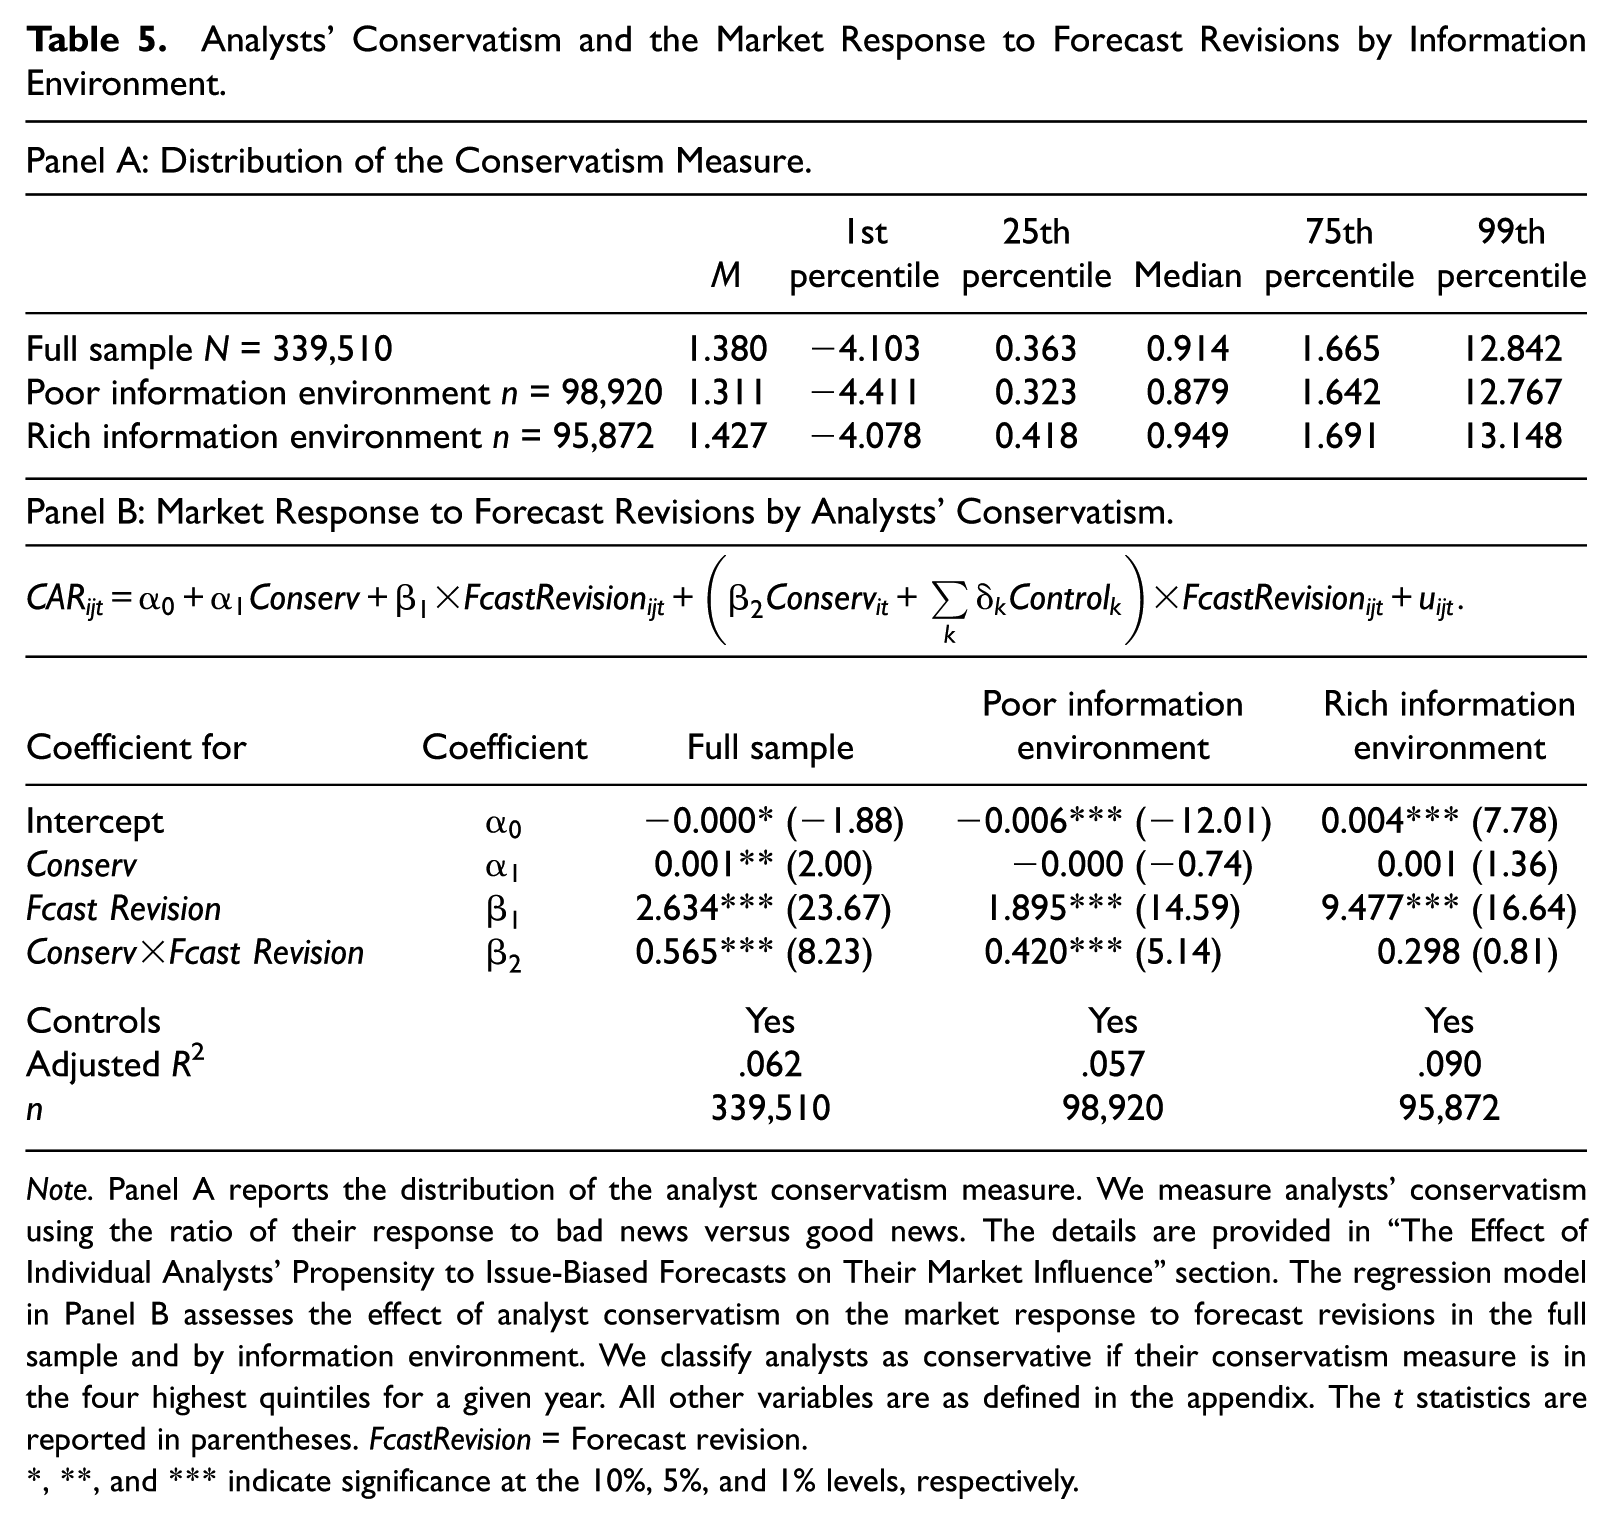
Note. Panel A reports the distribution of the analyst conservatism measure. We measure analysts’ conservatism using the ratio of their response to bad news versus good news. The details are provided in “The Effect of Individual Analysts’ Propensity to Issue-Biased Forecasts on Their Market Influence” section. The regression model in Panel B assesses the effect of analyst conservatism on the market response to forecast revisions in the full sample and by information environment. We classify analysts as conservative if their conservatism measure is in the four highest quintiles for a given year. All other variables are as defined in the appendix. The t statistics are reported in parentheses. FcastRevision = Forecast revision.
*, **, and *** indicate significance at the 10%, 5%, and 1% levels, respectively.
We estimate the relation between market-adjusted returns and forecast revisions using differential coefficients for conservative analysts in Panel B of Table 5. We classify analysts as conservative if their conservatism measure is in the four highest quintiles for a given year. 12 The first column is for the full sample and is a replication of Hugon and Muslu (2010). Consistent with their results, we find a positive differential coefficient on forecast revisions by conservative analysts, indicating stronger return response to conservative analysts’ forecast revisions. Next, we estimate the model separately for firms in poor and rich information environments. The differential forecast response coefficient for conservative analysts is positive and significant in poor information environments, consistent with H3. The differential coefficient is statistically insignificant in rich information environments, inconsistent with H4. Thus, investors appear to value conservatism in poor/optimistic information environments but not in rich/pessimistic environments.
Analysts’ overall optimism changed in the post-regulation period, particularly for firms in poor information environments, so we estimate the model separately in the pre- and post-regulation periods (results are in the online appendix). We expect analyst conservatism to be more valuable in the pre-regulation period than in the post-regulation period for firms in poor information environments, but expect no change for firms in rich information environments. In poor information environments, we find positive differential response coefficients on forecast revisions by conservative analysts in both the pre- and post-regulation periods, consistent with H3. Consistent with our expectation, the differential forecast-revision coefficient on conservatism is smaller in the post-regulation period. In rich information environments, the differential coefficient on forecast revisions by conservative analysts is economically small and only marginally significant in the pre-regulation period and statistically insignificant in the post-regulation period. This finding suggests that conservatism is relatively unimportant for distinguishing among analysts in rich information environments, inconsistent with Hypothesis 4.
Overall, our results suggest that investors place a premium on forecasts by conservative analysts when conservatism contravenes the type of bias typical of the firm’s information environment. We find that investors do not differentiate between forecast revisions by conservative and non-conservative analysts in rich information environments. We attribute this result to the low forecast dispersion that, by construction, prevails in rich information environments. In rich information environments, the median price-deflated forecast range is 0.002, corresponding to an earnings per share difference between the highest and lowest forecast of 5 cents on a stock with the median price in our sample of US$25. 13 The small forecast range suggests that all analyst forecasts for a given firm are clustered so that investors are unable to differentiate conservative and non-conservative analysts. In contrast, the median price-deflated forecast range in poor information environments is 0.04, corresponding to an earnings per share difference of US$1 on a US$25 stock. This wide range enables conservative and non-conservative analysts to cluster separately and allows analysts to differentiate between analyst types.
Sensitivity Analysis
In this section, we describe our analysis of the effect of forecast direction, forecast horizon, alternative proxies for the firm’s environment, and the role of management earnings guidance. We report these results in the online appendix.
Forecast direction
We expect investors in poor/optimistic information environments to be particularly skeptical about non-conservative analysts’ upward forecast revisions because they increase the bias typical of poor information environments. Since downward forecast revisions tend to mitigate the typical bias in poor information environments, we expect investors to view them as credible in that environment regardless of the analyst’s conservatism. We find results consistent with these predictions (details are in the online appendix). Specifically, the coefficient on downward forecast revisions is about 16% higher (the difference is significant at the 5% level) for conservative analysts than for other analysts, but the coefficient on upward forecast revisions is about 55% higher (the difference is significant at the 1% level) for conservative analysts than for other analysts. We also find evidence that conservatism has a stronger effect in the pre-regulation period than in the post-regulation period, consistent with the decrease in analysts’ overall optimism in the post-regulation period. In contrast to the results for the poor information environments, none of the differential coefficients for conservative analysts are statistically significant in rich information environments. Thus, the value of analyst conservatism is highest for upward forecast revisions in poor information environments.
The relation between forecast horizon and bias across information environments
Prior studies find extensive evidence that analysts generally reduce their forecasts over the course of the year, consistent with managers’ apparent preference for long-term optimistic forecasts and short-term beatable forecasts. Because analyst forecast dispersion should decline over the course of the year, we wish to establish that the effects of forecast horizon are distinct from the role of dispersion in classifying firms in rich and poor information environments. We estimate forecast optimism at long forecast horizons (91-180 days) and short forecast horizons (1-90 days). In the poor information environment, 67.1% of firms have optimistic forecasts in the long horizon and 51.1% have optimistic forecasts in the short horizon. In the rich information environment, 35.1% of firms have optimistic forecasts in the long horizon and 26.7% have optimistic forecasts in the short horizon. Thus, while analysts generally become less optimistic over time, there are persistent differences over the year for firms in rich and poor environments. We conclude that our information environment classification is not confounded by the horizon effect.
We use within-year trends in forecast optimism to further validate our results. Optimism is strongest early in the year, when 67.1% of firms have optimistic forecasts, but close to zero at the end of the year, when 51.1% of firms have optimistic forecasts. In contrast, pessimism is strongest near the end of the year, when only 26.7% of firms have optimistic forecasts, and relatively small at the beginning of the year, when 35.1% of firms have optimistic forecasts. We base our primary analysis on the conjecture that investors’ response to analysts’ forecast revisions is related to the prevailing forecast bias for the firm’s information environment. This implies that the difference in investors’ response to upward versus downward forecast revisions should be higher early in the year than late in the year for firms in poor information environments and should be higher late in the year than early in the year for firms in rich information environments. Because analysts’ forecast optimism in poor information environments declines substantially in the post-regulation period, we examine the horizon effect separately for the pre- and post-regulation periods.
Consistent with our predictions, we find a larger difference in response coefficients for upward versus downward forecast revisions early in the year than late in the year when the information environment is poor. Thus, investors are more skeptical about upward forecast revisions early in the year than late in the year. This result is restricted to the pre-regulation period, however. In the post-regulation period, the difference in return response coefficients to downward and upward forecast revisions is insignificant both early and late in the year, consistent with a substantial decline in analysts’ forecast optimism in poor information environments in the post-regulation period. In rich information environments, we find that investors are more skeptical about downward forecast revisions late in the year than early in the year, consistent with the increase in pessimism late in the year. These results corroborate our conjectures about the effect of forecast bias on investor responses to analyst forecast revisions.
Alternative proxies for the firm’s information environment
We investigate the sensitivity of our results to our primary measure of the firm’s information environment. We expect analysts’ access to information to increase with firm size (Atiase, 1985), and therefore classify firms in the lowest size quintile in the poor information environment and firms in the highest size quintile in the rich information environment. Median firm sizes are US$255.5 million and US$23,227.1 million in the low and high firm size quintiles, respectively. Over the sample period, 57.2% of the forecasts are optimistic for the small-firm group compared with 40.3% for the large-firm group, consistent with the pattern we observe when we define information environment using forecast dispersion. We replicate the analyses using firm size as our proxy for the information environment and find consistent results. Specifically, consistent with the results in Table 4, investors respond more strongly to downward forecast revisions than to upward revisions in poor information environments and respond more strongly to upward forecast revisions than to downward revisions in rich information environments. In addition, we find that in poor information environments, the stronger response to conservative analysts is restricted to upward forecast revisions, suggesting that investors are skeptical about these upward forecast revisions and use analyst conservatism to assess their credibility.
The role of management guidance
Our results may be partly induced by management guidance behavior if managers simultaneously guide analysts to beatable forecasts and reduce the analysts’ forecast dispersion by providing a credible earnings estimate. If so, the rich/poor information environment classification could mirror the guidance/no guidance subsamples. We address this issue in two ways. First, we show that the characteristics of the no-guidance sample are similar to those of the full sample, indicating that the rich/poor classification is distinct from the guidance/no guidance classification. For firms that provide no guidance, we find that 59.7% of forecasts in poor information environments are optimistic while only 32.7% of forecasts in rich information environments are optimistic. These statistics are similar to those for the full sample. Second, we conduct our analysis on the no-guidance subsample and obtain consistent results across the subsample and for the overall sample.
Conclusion
Market responses indicate that investors find forecast revisions informative. Prior studies suggest, however, that analysts are subject to incentives that induce them to issue optimistically biased forecasts in poor information environments and pessimistically biased forecasts in rich information environments. We find that investors appear to anticipate analysts’ forecast optimism in poor information environment and reduce their response to upward forecast revisions in poor/optimistic information environments. Moreover, the difference in return responses to upward and downward forecast revisions is larger before Regulation FD and the Global Settlement went into effect (the pre-regulation period) than afterward, consistent with a decrease in analysts’ overall forecast optimism in the post-regulation period. We also find that investors anticipate analysts’ incentive to pessimistically bias their forecasts in rich information environments and reduce their response to downward forecast revisions.
We conjecture that investors identify analysts who are especially likely to bias their forecasts and respond skeptically to those analysts’ bias-reinforcing forecast revisions. We use Hugon and Muslu’s (2010) conservatism measure as an ex ante indicator of analysts’ forecast bias tendencies. Hugon and Muslu find that return responses to forecast revisions increase with analysts’ conservatism, suggesting that investors view these revisions as credible. We find that investors’ differential reaction to conservative analysts’ forecasts is strong in poor/optimistic information environments, particularly for upward forecast revisions, but is insignificant in rich/pessimistic information environments.
Overall, our results suggest that analysts pay a price in market influence when their forecasts are likely to be compromised by their attempts to please management rather than to provide value-relevant private information. Thus, analysts must weigh the potential benefits of providing biased forecasts against the loss of market influence. Prior studies suggest that analysts’ market influence is related to their career prospects (Hong & Kubik, 2003), so the costs to analysts of losing market influence may indeed be considerable and act against other incentives to bias forecasts.
Footnotes
Appendix
Variable Definitions.

| The three-trading-day cumulative market-adjusted abnormal return centered on analyst i’s earnings forecast revision date for firm j on day t, computed by subtracting value-weighted market returns from firm j’s return. | |
| Analyst i’s forecast revision for firm j on day t calculated as the analyst’s earnings forecast less the mean consensus forecast and scaled by the end-of-day stock price 2 days prior to the revision; the consensus forecast is the mean of individual analysts’ most recent forecasts for the firm-year issued 1-90 days before the before analyst i’s forecast revision. | |
| Indicator variable taking a value of one when analyst i’s forecast revision for firm j on day t is below the preceding consensus forecast and zero otherwise. | |
| Indicator variable taking a value of one when analyst i’s forecast revision for firm j on day t is above the preceding consensus forecast, and zero otherwise. | |
| Analyst i’s forecast revision for firm j at time t calculated as the analyst’s earnings forecast less the consensus forecast and scaled by the price at the end of the month preceding the revision; the consensus forecast is the mean of the last forecast by each analyst for firm j issued within 30 days prior to analyst i’s forecast revision at time t. | |
| M revision of analyst i’s closest two neighbors (one preceding and the other following the analyst), where each revision is calculated as the analyst’s forecast less the consensus forecast and is scaled by the price at the end of the month preceding the revision. | |
| Indicator variable taking value of one when is negative and zero otherwise. | |
| Control variables | |
| Days elapsed since the last forecast by any analyst following firm j on day t, calculated as the days between analyst i’s forecast of firm j’s earnings on day t and the most recent preceding forecast of firm j’s earnings by any analyst, minus the minimum number of days between two adjacent forecasts of firm j’s earnings by any two analysts on day t, with this difference scaled by the range of days between two adjacent forecasts of firm j’s earnings on day t. | |
| Analyst i’s forecast horizon for firm j for the year in which day t falls, calculated as the forecast horizon (days from the forecast date to the fiscal-year end) for analyst i following firm j that year minus the minimum forecast horizon for analysts who follow firm j that year, with this difference scaled by the range of forecast horizons for analysts following firm j that year. | |
| Analyst i’s prior forecast accuracy for firm j for the year in which day t falls, calculated as the maximum ACCURACY for analysts who follow firm j in the preceding year minus the ACCURACY for analyst i following firm j in the preceding year, with this difference scaled by the range of ACCURACY for analysts following firm j in the preceding year. | |
| The analyst’s broker size in the year in which day t falls, calculated as the number of analysts employed by the broker employing analyst i following firm j that year minus the minimum number of analysts employed by brokers for analysts following firm j that year, with this difference scaled by the range of brokerage size for analysts following firm j that year. | |
| Analyst i’s firm-specific experience for firm j for the year in which day t falls, calculated as the number of years of firm-specific experience for analyst i following firm j that year minus the minimum number of years of firm-specific experience for analysts following firm j that year, with this difference scaled by the range of years of firm-specific experience for analysts following firm j that year. | |
| Analyst i’s forecast frequency for firm j for year in which day t falls, calculated as the number of firm-j forecasts made by analyst i following firm j that year minus the minimum number of firm-j forecasts for analysts following firm j that year, with this difference scaled by the range of number of firm-j forecasts issued by analysts following firm j in that year. | |
| The number of industries analyst i follows in the year in which day t falls, calculated as the number of two-digit SICs followed by analyst i following firm j that year minus the minimum number of two-digit SICs followed by analysts who follow firm j that year, with this difference scaled by the range in the number of two-digit SICs followed by analysts following firm j that year. | |
| The number of companies analyst i follows in the year in which day t falls, calculated as the number of companies followed by analyst i following firm j that year t minus the minimum number of companies followed by analysts who follow firm j that year, with this difference scaled by the range in the number of companies followed by analysts following firm j that year. | |
Note. SIC = Standard Industrial Classification.
Acknowledgements
We received useful comments from Anwer Ahmed, Lynn Rees, Shiva Sivaramakrishnan, and Chris Wolfe, and from workshop participants at Texas A&M University and the University of Texas at San Antonio. We are also grateful to workshop participants at the 2013 American Accounting Association (AAA) Annual Meeting for helpful comments and suggestions.
Declaration of Conflicting Interests
The author(s) declared no potential conflicts of interest with respect to the research, authorship, and/or publication of this article.
Funding
The author(s) received no financial support for the research, authorship, and/or publication of this article.