
Abstract
We examine earnings manipulation via discretionary accruals and real earnings management prior to the release of cash reserves back to shareholders. Previous research indicates that firms manage earnings upward when they increase dividends, creating a coordinated signal to the market. We study earnings management surrounding dividend initiation to determine whether management is manipulating earnings downward to avoid the discipline imposed by dividends in the years ahead or whether they are signaling to the market. We suggest that the aim of earnings management is not to reduce earnings but that earnings are more likely managed to preserve financial flexibility, create earnings reserves, and postpone shareholders’ expectations for initiating recurring dividends. Rather than signaling with upward earnings management, we find that dividend initiating firms manage earnings downward, consistent with the free cash flow theory. Our results explain findings in prior literature for the surprisingly stable earnings performance and accrual quality in the period just after dividend initiation. Furthermore, the market day stock price reaction is inversely related to earnings management, contradicting the purpose of signaling. We provide evidence that the managerial inertia for initiating dividends represents unique agency concerns compared with an increase in existing dividend payout and to the extent that downward real earnings management does not reverse, we identify a cost to shareholders for the quasi contract of recurring dividend payout.
Keywords
Introduction
Prior research suggests two theories that might motivate management to increase dividends. The first is that increased dividends act as a signal to the market regarding future prospects of the firm, while the other argues that such increases act as a credible commitment to mitigate agency problems associated with free cash flows. The purpose of this article is to investigate earnings management prior to dividend initiation in light of these two theories.
It is possible that dividend initiation should not be attributed to the same motivational theory as a dividend increase. One reason is that firms that are already paying dividends may have negotiated compensation packages (such as substituting stock grants, which pay dividends, for stock options which typically do not accrue dividends) so that management and directors receive bonuses for maintaining or increasing dividend payout (White, 1996). So, although management in a dividend paying firm may be financially rewarded for increasing the dividend, management in a nonpaying firm typically has not yet negotiated dividend-based compensation.
Kale, Kini, and Payne (2012) refer to dividend initiation as a “milestone” in the life cycle of a firm and argue that management is averse to the initiation of inflexible dividends. Management’s reluctance to initiate dividends is further supported in a survey by Brav, Graham, Harvey, and Michaely (2005) wherein managers express a preference for repurchasing shares rather than initiating dividends. Share repurchases, unlike dividends, are not perceived as recurring activities and represent a more flexible commitment for management. Blau and Fuller (2008) investigate dividends from a managerial perspective and argue that management values financial flexibility to take on projects that shareholders do not like. In their model, dividends increase the value of the firm, but management trades firm value for financial flexibility.
Management’s reluctance to initiate dividends provides an incentive to manage earnings downward thereby postponing shareholders’ expectations of dividend payout, reducing the amount of dividend expected and, as shareholder demand for dividends becomes compelling, creating “cookie jar” reserves of real earnings to protect their financial flexibility in the years ahead. Therefore, the motivation for dividend initiation might be better explained by examining cash flows rather than informational signals. We differentiate dividend initiations from dividend increases and evaluate earnings management by considering both discretionary accruals and real activities. Prior research found that firms increasing dividends use earnings management as a coordinated signal to the market. Our objective is to determine whether dividend initiations are similarly motivated by signaling or whether they represent the agency cost of free cash flow. We are not aware of any prior studies that evaluate both real and accrual earnings management surrounding dividend initiations.
To determine whether dividend initiating firms manage earnings upward as a coordinated signal in the same way dividend increasing firms have been shown to do, we perform tests for signaling by assessing discretionary accruals and real earnings management in the year of dividend initiation. Next, we examine accrual and real earnings management leading up to dividend initiation as a test of the free cash flow theory, with the expectation that dividend increasing firms will manage earnings upward (signaling) and dividend initiating firms will manage earnings downward (free cash flow). Finally, we perform an event study to determine whether the market acknowledges a signal from discretionary accrual and real earnings management when firms initiate dividends.
Contributing to the research on signaling and the free cash flow theory, our results indicate that dividend initiating firms are not signaling with earnings management like their dividend increasing peers. An effective signal conveys private information to elicit a market response. Cross-sectional tests of abnormal return support our hypothesis that dividend initiating firms are not signaling because the use of upward earnings management is determined to be value decreasing, inconsistent with the motivation for signaling.
To determine the total effects of combined real and accrual earnings management, we aggregate them into a single proxy following Badertscher (2011). The results of our cumulative earnings management analysis provide empirical evidence that agency theory differentiates dividend initiators from dividend increasers. Our finding that management is reluctant to commit to dividend initiation is consistent with the conclusions made by Kale et al. (2012) and Brav et al. (2005).
An important outcome of our findings is the distinction between dividend initiations and increases. Specifically, dividend initiating firms use cumulative earnings management activities in a similar magnitude but in an opposite direction from dividend increasing firms, where initiators are creating earnings reserves, and dividend increasing firms are expending them. This differentiation of dividend initiations from dividend increases is in contrast to much of the dividend policy literature which aggregates the events in samples as though they are indistinguishable.
Another contribution of this research is that we isolate a new motivation for downward earnings management, which is to lower shareholders’ expectations for the timing and/or magnitude of initiation of recurring dividends. Most of the literature, especially for real earnings management, relates to income increasing activities (Badertscher, 2011; Cohen & Zarowin, 2010; Roychowdhury, 2006; Zang, 2012). Yet CFOs surveyed by Dichev, Graham, Campbell, and Rajgopal (2013) estimate that 40% of earnings management is income-decreasing. Roychowdhury (2006) and Zang (2012) test firms with earnings just over zero, but they caution that some firms in their sample with higher earnings may be managing profits down. Chi, Lisic, and Pevzner (2011) note that further investigation is needed relating to downward real earnings management.
Although two recent articles in this area address the evidence of downward real earnings management (Francis, Hasan, & Li, 2016) and the related motivations (Badertscher, Phillips, Pincus, & Rego, 2014), our research shows that there are differences in the methods used by firms to manage earnings up versus down. We find that dividend initiating firms are manipulating sales and production levels to reduce reported performance. Dividend increasing firms also manipulate sales and production levels to achieve upward earnings management, in addition to using discretionary accruals and cutting discretionary expenses.
The remainder of the article is organized as follows. “Literature Review and Hypothesis Development” section discusses the relevant literature and hypotheses development. “Data and Method” section provides a description of the data and method, and we discuss our empirical results in “Empirical Results” section. “Conclusion” section concludes the article.
Literature Review and Hypothesis Development
Literature Review
Jensen’s (1986) free cash flow theory shows that agency conflicts are exacerbated when cash flow exceeds the amount required to fund all the positive net present value projects. Managers have the incentive to continue investing in value-decreasing projects or to overspend on perquisites. Dividends can be a solution to provide market discipline for overinvestment and the free cash flow problem (Jensen, 1986) because the announcement of recurring dividends creates a quasi contract with shareholders to return excess cash. Shareholders place a higher value on the firm when the potential misuse of cash flows is restrained with recurring dividends. In instances when a high-dividend paying firm reports an increase in earnings, the market reacts more favorably than for a low-dividend paying firm (Kallapur, 1994) because there is a greater likelihood that this additional value will be returned to shareholders.
Management ideally would prefer to avoid the restriction that recurring dividends impose, and therefore, CEOs may be reluctant to pay dividends (Kale et al., 2012). In a survey of 384 financial executives, Brav et al. (2005) determine that management prefers share repurchase to dividends because it allows management to retain more control over the timing of payout. The commitment to recurring dividend payout provides a restriction on overspending that is desirable for shareholders but not for management.
Under perfect and complete markets, the pattern of dividend payouts has no effect on firm value (Miller and Modigliani). Given informational and other market frictions, the relationship between dividends and earnings is unclear. According to Healy and Palepu (1988), dividend changes provide a signal that functions as management’s forecast of future earnings. The authors examine earnings and stock returns for the years surrounding the announcement of dividend initiations or omissions. Firms that initiate dividends have earnings increases in the years just before, during, and after initiation. The authors also find a significant market reaction to the dividend initiation announcement, implying that such announcements convey new information to the market. Based on these results, they conclude that dividend initiations predict an earnings increase for the subsequent 2 years. Another study of signaling by Michaely, Thaler, and Womack (1995) documents positive excess returns for 3 years after dividend initiation.
Benartzi, Michaely, and Thaler (1997) also ask whether dividends contain information. Their results provide only minimal support that dividends can predict future earnings. Rather, they document that dividends signal the permanence of current earnings because for firms in their sample that increase dividends, there is less likely to be a drop in earnings for the next 3 years. The authors also test the market reaction to dividends to identify support for signaling, and they suggest that the market did not adequately interpret the dividend signal.
Chen, Shevlin, and Tong (2007) look beyond the earnings proxy to determine the quality of reporting around dividend changes and the market reaction to such changes. They quantify the firm’s accrual quality in the years surrounding dividend changes as a measure of information risk. By adding their new information risk proxy to the Fama–French three-factor model, they determine how accurately the market prices the information. Their results show that dividend initiating firms experience a decrease in pricing of information risk. Chen et al. (2007) also affirm that dividend paying firms have higher earnings persistence than nondividend paying firms.
Hypotheses Development
Based on the literature described earlier in this section, we develop two competing hypotheses to predict earnings management surrounding dividend initiation. The signaling theory states that management uses dividends to signal future positive earnings to investors. The alternate explanation is that dividend initiation acts as an implicit commitment mechanism to reduce agency costs. We discuss the theories and the relevant literature to present our hypotheses below.
Signaling theory
Subramanyam (1996) reports support for signaling with the use of accrual earnings management around dividend changes. Stating that management uses accruals to signal future earnings to the market, he finds that discretionary accruals predict or signal future profitability and dividend changes. He examines the change in current year and the change in next year’s dividends and finds that in both estimations, accruals are positively related to dividend changes. In other words, when dividends increase, they are accompanied by upwardly managed earnings through positive accruals. Noting that Fama and Babiak (1968) and Watts (1973) found evidence against signaling (that dividend changes represent earnings with a lag, as opposed to forecasting future earnings), Subramanyam (1996) argues that a partial explanation for this finding can be that managers signal using accruals in conjunction with dividends. Koerniadi and Tourani-Rad (2011) also find support for the signaling theory. According to their results, firms that increase dividends also use positive accruals to manage earnings upward. The accruals are shown to be positively correlated with the future three quarters’ profitability, supporting the signaling motive.
There is also evidence that some firms may be using real earnings management instead of accrual earnings management. Cohen, Dey, and Lys (2008) suggest that due to restrictions by Sarbanes-Oxley Act of 2002 (SOX), more firms are substituting real earnings management. Ewert and Wagenhofer (2005) also report that real and accrual earnings management are substitutes. As reporting standards tighten, management shifts from accrual to real earnings management. Chan, Chen, Chen, and Yu (2015) examine whether compensation recovery policies (clawbacks) lead to a substitution between reduced accruals management and increased real transactions management. They suggest that while clawbacks may constrain accruals management, this may also result in the unintended consequence of encouraging real transactions management. According to Cohen and Zarowin (2010), one can identify firms using more real than accrual earnings management by examining the firm’s net operating assets. Firms with higher net operating assets are more likely to be using real earnings management. Since some firms may be substituting real for accrual earnings management, we include real earnings management in the hypothesis.
If dividend initiators are signaling like their dividend increasing peers, we should detect the same upward earnings management for dividend initiating firms. Based on the studies described above, our signaling hypothesis is as follows.
Earnings management includes accruals and real activities
Firms can manage earnings with accruals or real activities, and prior literature documents that some firms use both. Moreover, increased transparency makes it risky to manipulate earnings through accruals because of potential litigation. Management may substitute real earnings management for accrual under certain circumstances because real earnings management is more difficult to detect, not as likely to result in legal action, and this practice has increased in the post-SOX period (Bartov & Cohen, 2009; Cohen & Zarowin, 2010). In a survey of over 400 executives, 78% admitted to making decisions that sacrificed long-term value to smooth earnings (Graham, Campbell, & Rajgopal, 2005). Furthermore, the same study finds that managers prefer the reduced litigation risk of real earnings management to accrual. Zang (2012) includes regulatory scrutiny as a cost of earnings management. To choose real earnings management, firms must be in good financial health and must have available resources to accomplish earnings management through real activities (Badertscher, 2011; Cohen & Zarowin, 2010; Zang, 2012).
Previous literature tests earnings management surrounding dividend initiation only with accrual earnings management (Chen et al., 2007). We predict that firms initiating dividends have high cash flow and earnings in the years leading up to dividend initiation, providing them with the ability to use real, rather than accrual earnings management. Therefore, when testing earnings management for firms initiating dividends, it is important to include an evaluation of real earnings management.
Several research articles focused on the degree to which firms substitute real versus accrual earnings management (Chan et al., 2015; Cohen et al., 2008; Cohen & Zarowin, 2010; Ewert & Wagenhofer, 2005; Zang, 2012). Our research question is to determine whether firms are signaling to the market or responding to agency negotiation, which is determined by whether the firm is managing earnings upward or downward. The purpose for including both types of earnings management in our analysis is to capture the cumulative, directional effect.
Agency theory
According to agency theory, management continues to invest free cash flow to maximize their own compensation. When contracts do not properly align the interests of managers and shareholders, an excess of free cash flows could lead to more value-destroying investments. For this reason, managers may seek to reassure shareholders that they will not misuse free cash flows through dividend initiation, preempting other more restrictive methods of controlling agency problems. However, when faced with the proposition of initiating dividends, management also has an incentive to suggest that agency problems are less severe by managing earnings downward to avert or postpone the initiation of dividends. We refer to these managers as “reluctant initiators.”
Reluctant initiators are not using earnings management to signal future profitability to the market. Reducing earnings with discretionary accruals or real earnings management activities creates cookie jar reserves of earnings. These reserves allow management to meet future earnings targets as well as future dividend obligations. At initiation, management is aware of the future earnings requirements to meet the continuing dividend obligation. Stable earnings are even more important after dividend initiation for firms, especially if debt covenants restrict dividend payout to a percentage of reported earnings. Daniel, Denis, and Naveen (2008) document that firms manage earnings upward in the years where they would otherwise miss the debt covenant restriction. Firms not meeting the earnings requirement are forced to cut or omit dividends, causing them to incur large, negative abnormal returns. Furthermore, when firms are forced to cut dividends due to missing the earnings requirement, there is evidence that the firm uses a “big bath” so they are better able to meet earnings targets in the future (Daniel et al., 2008). 1 Thus, management has an incentive to ensure the outcome of future earnings prior to initiation.
Dyl and Weigand (1998) compile earnings per share data for dividend initiators and find a sharp increase in earnings leading up to the quarter of initiation and significant earnings stability postinitiation. The prospect of downward earnings management at time 0 in Dyl and Weigand’s (1998) study is plausible. The authors report a period of sharply increasing earnings per share which drops markedly in the period of initiation, then stabilizes at a moderate level in the following periods. Similarly, Chen et al. (2007) find that earnings have higher persistence, tend to be more stable, and are improved in quality following dividend initiation. These studies imply a higher likelihood of earnings management or manipulation prior to dividend initiation, which builds reserves to smooth earnings over subsequent periods. Based on the literature, our free cash flow hypothesis is as follows.
We evaluate real earnings management with three measures (Gunny, 2010; Roychowdhury, 2006), and each has different ramifications. Abnormal cash flows from operations indicate that management of revenue activities related to timing of sales, credit policies, or pricing. Revenue has a high inherent risk and is the most often used account to manipulate earnings (Messier, Glover, & Prawitt, 2014). If dividend initiating firms use revenue activities to manage earnings downward, they will have abnormally high cash flow from operations.
Abnormally low production levels reduce current period cost of goods sold because of the higher overhead allocation. As inventory levels are depleted, an opportunity for the firm to shift allocation of overhead to a future period is generated where production can be stepped up, reducing future cost of goods sold. We expect that dividend initiators will use abnormally low production levels to shift higher cost of goods to the current period and preserve the ability to overproduce in future periods. From the standpoint of upward earnings management, overproduction has a limitation subject to the expense and availability of excess inventory storage. Alternatively, from the perspective of downward earnings management, underproduction has a firm, downside limitation because inventory levels cannot decrease below 0. This may reduce the opportunity for management to use underproduction to affect earnings. Downward earnings management can also be achieved by increased pricing or delayed timing of sales, and these would affect production levels (Roychowdhury, 2006).
Discretionary expenses do not necessarily reverse in future operating periods. Furthermore, abnormal discretionary expenses are contradictory in that increasing cash flows by cutting discretionary expenses to an abnormally low level manages reported earnings up rather than down. Francis et al. (2016) find that when firms are trying to reduce reported net income, for instance, in advance of stock buybacks or at the time of CEO option grants, firms do overspend in discretionary expenses to achieve that objective. However, we expect that management’s objective in the case of dividend initiation is primarily to preserve financial flexibility, so although abnormally high discretionary expenses would manage earnings down consistent with operating cash flows and production, we leave the determination of abnormal discretionary expenses to empirical testing.
Market pricing of earnings management has been tested in prior literature by Chen et al. (2007). They use the capital asset pricing model to demonstrate that the market does price accrual quality. Furthermore, they find that accrual quality improves after dividend initiation.
Our third hypothesis extends the work of Chen et al. (2007) by testing market reaction to real earnings management surrounding dividend initiation. They tested accrual quality surrounding the event using monthly returns and accrual earnings management. Our test uses a daily returns and more compact windows to better isolate the impact of the dividend announcement. Following the Chen et al.’s (2007) study, we expect that discretionary accruals and real earnings management will be recognized by the market. If the abnormal return is significant in the announcement event window, then this emphasizes the finding that the market applies revised pricing of the earnings quality in light of the specific announcement. If firms signal with earnings management, then tests of market reaction should reveal that the market rewards the signal.
Data and Method
Data
The sample is composed of all firms listed in the Center for Research in Security Prices (CRSP) that initiated a regular dividend between 1990 and 2009. Although dividend payments are identified in both the CRSP and Compustat databases, we use CRSP as our source because this database is more specific in identifying each firm payment by code, even if there are multiple payments with different codes during a given period. 2 Firms must not have paid a dividend in the prior 3 years to be included as an initiator. Firms that initiate a dividend under these terms more than once are only included for the earliest initiation. Similar to Zang (2012), we eliminate the regulated industries and do not include financial firms (SIC Codes 4400-4999 and 6000-6999). To be included in our initial sample, firms must have share code 10 or 11 and be actively traded on one of the three major U.S. exchanges (NYSE, AMEX, or NASDAQ). Furthermore, we require that firms have sufficient financial data in Compustat to calculate earnings management proxies for 3 years prior to and the year of dividend initiation. We identify 1,087 initiators between 1990 and 2009 with both CRSP and Compustat data available. Table 1 provides a summary of the sample selection.
Sample Selection.
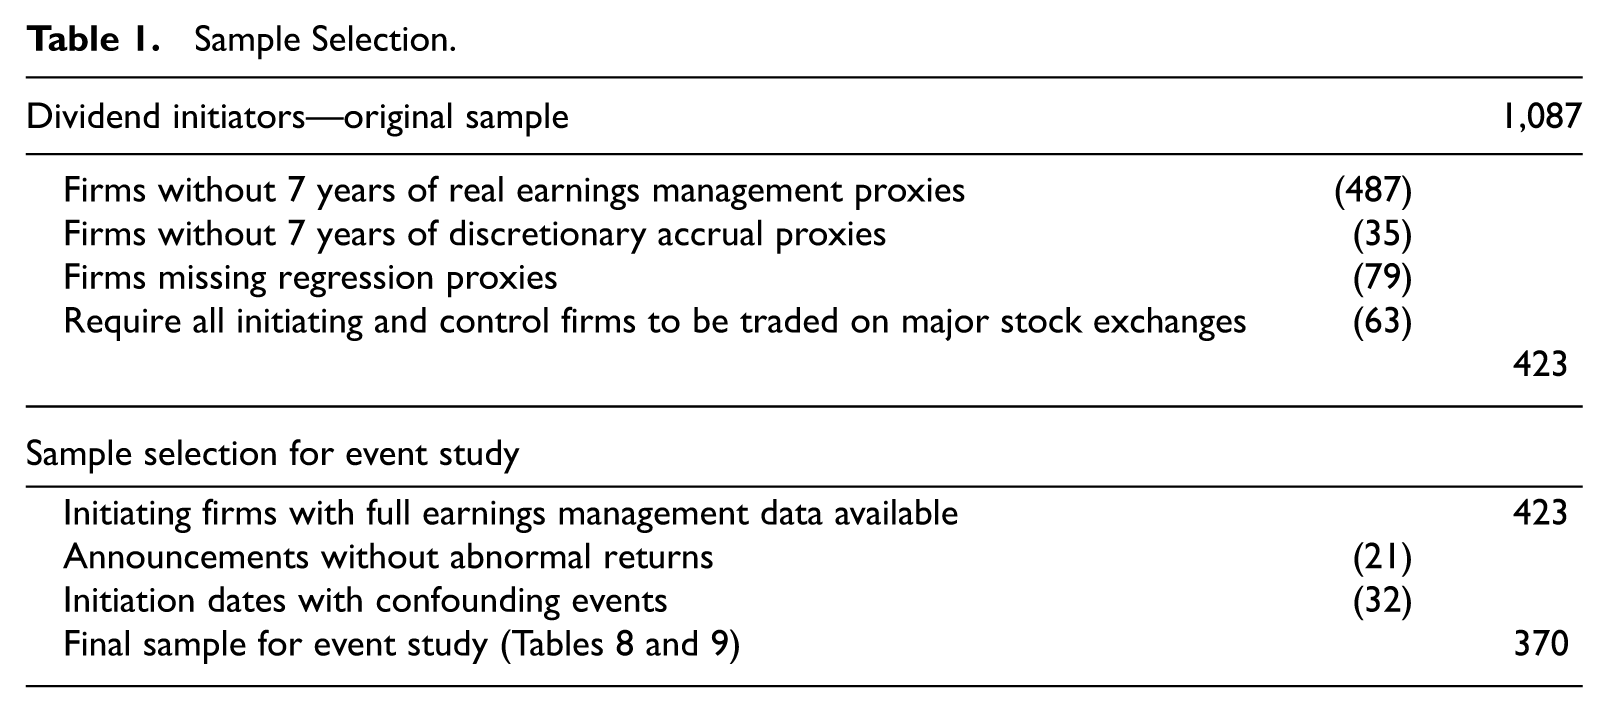
We start with the CRSP/Compustat-Merged Database and calculate earnings management proxies for all firms. Firms are required to have 7 years (3 years prior, the event year, and 3 years post) of abnormal cash flows, abnormal production, abnormal discretionary expenses, and discretionary accruals. If any proxy is missing, the firm-year is excluded. The requirement of financial variables for 3 years prior and postinitiation reduces the sample size, and there is the possibility of survivorship bias in our sample, in as much as some of the financially weaker firms may have exited our sample.
As mentioned earlier, previous research in this area examines recurring dividends, and we argue that the agency issues surrounding the decision to initiate are different than those revolving around continuing dividends. To that end, we want to compare our sample of initiating firms with dividend increasers to test whether there are differences in the earnings management activities between the two sets of firms. To clearly define the agency issues surrounding initiation versus increases, we identify firms that increase dividends if the Compustat variable for cash paid on common shares in the current year is higher than the cash paid on common shares in the prior year. This results in a sample of 423 dividend initiators, 8,015 firm-years of dividend increasing firms, and 21,917 additional firm-years (firms that are not increasing or initiating dividends), for a total of 30,355 firm-years.
To calculate real earnings management, we extract the following variables from Compustat. In addition to the CFO variable described above, we obtain cost of goods sold (COGS, annual Compustat Data Item 41) and inventories (annual Compustat Data Item 3) to compute production levels (PROD). We calculate discretionary expense (DISX) as the combination of R&D expenses (annual Compustat Data Item 46), SG&A expenses (annual Compustat Data Item 189), and advertising expenses (annual Compustat Data Item 45). We also extract total assets, ATi,t (annual Compustat Data Item 6), Sales (Compustat Data Item 12), gross value of property, plant and equipment (Compustat Data Item 7), INT (internal funds; Compustat Data Items 18, 46, and 14), Tobin’s Q (Compustat {[(Data 199 × Item 25) + Data 130 + Data 9 + Data 34] / Data 6}, market value (Data 199 × Data 25), and DD, a dummy variable equal to 1 if the current year sales are less than prior year. We calculate total accruals to compute accrual-based earnings management as TAi,t = EBXIi,t− CFOi,t—CFO is the operating cash flows from the statement of cash flows (annual Compustat Data Item 308 minus annual Compustat Data Item 124); EBXI is the earnings before extraordinary items and discontinued operations (annual Compustat Data Item 123).
We report the descriptive statistics and univariate t statistics for the sample of initiating firms and the control sample in Table 2.
Sample Description.
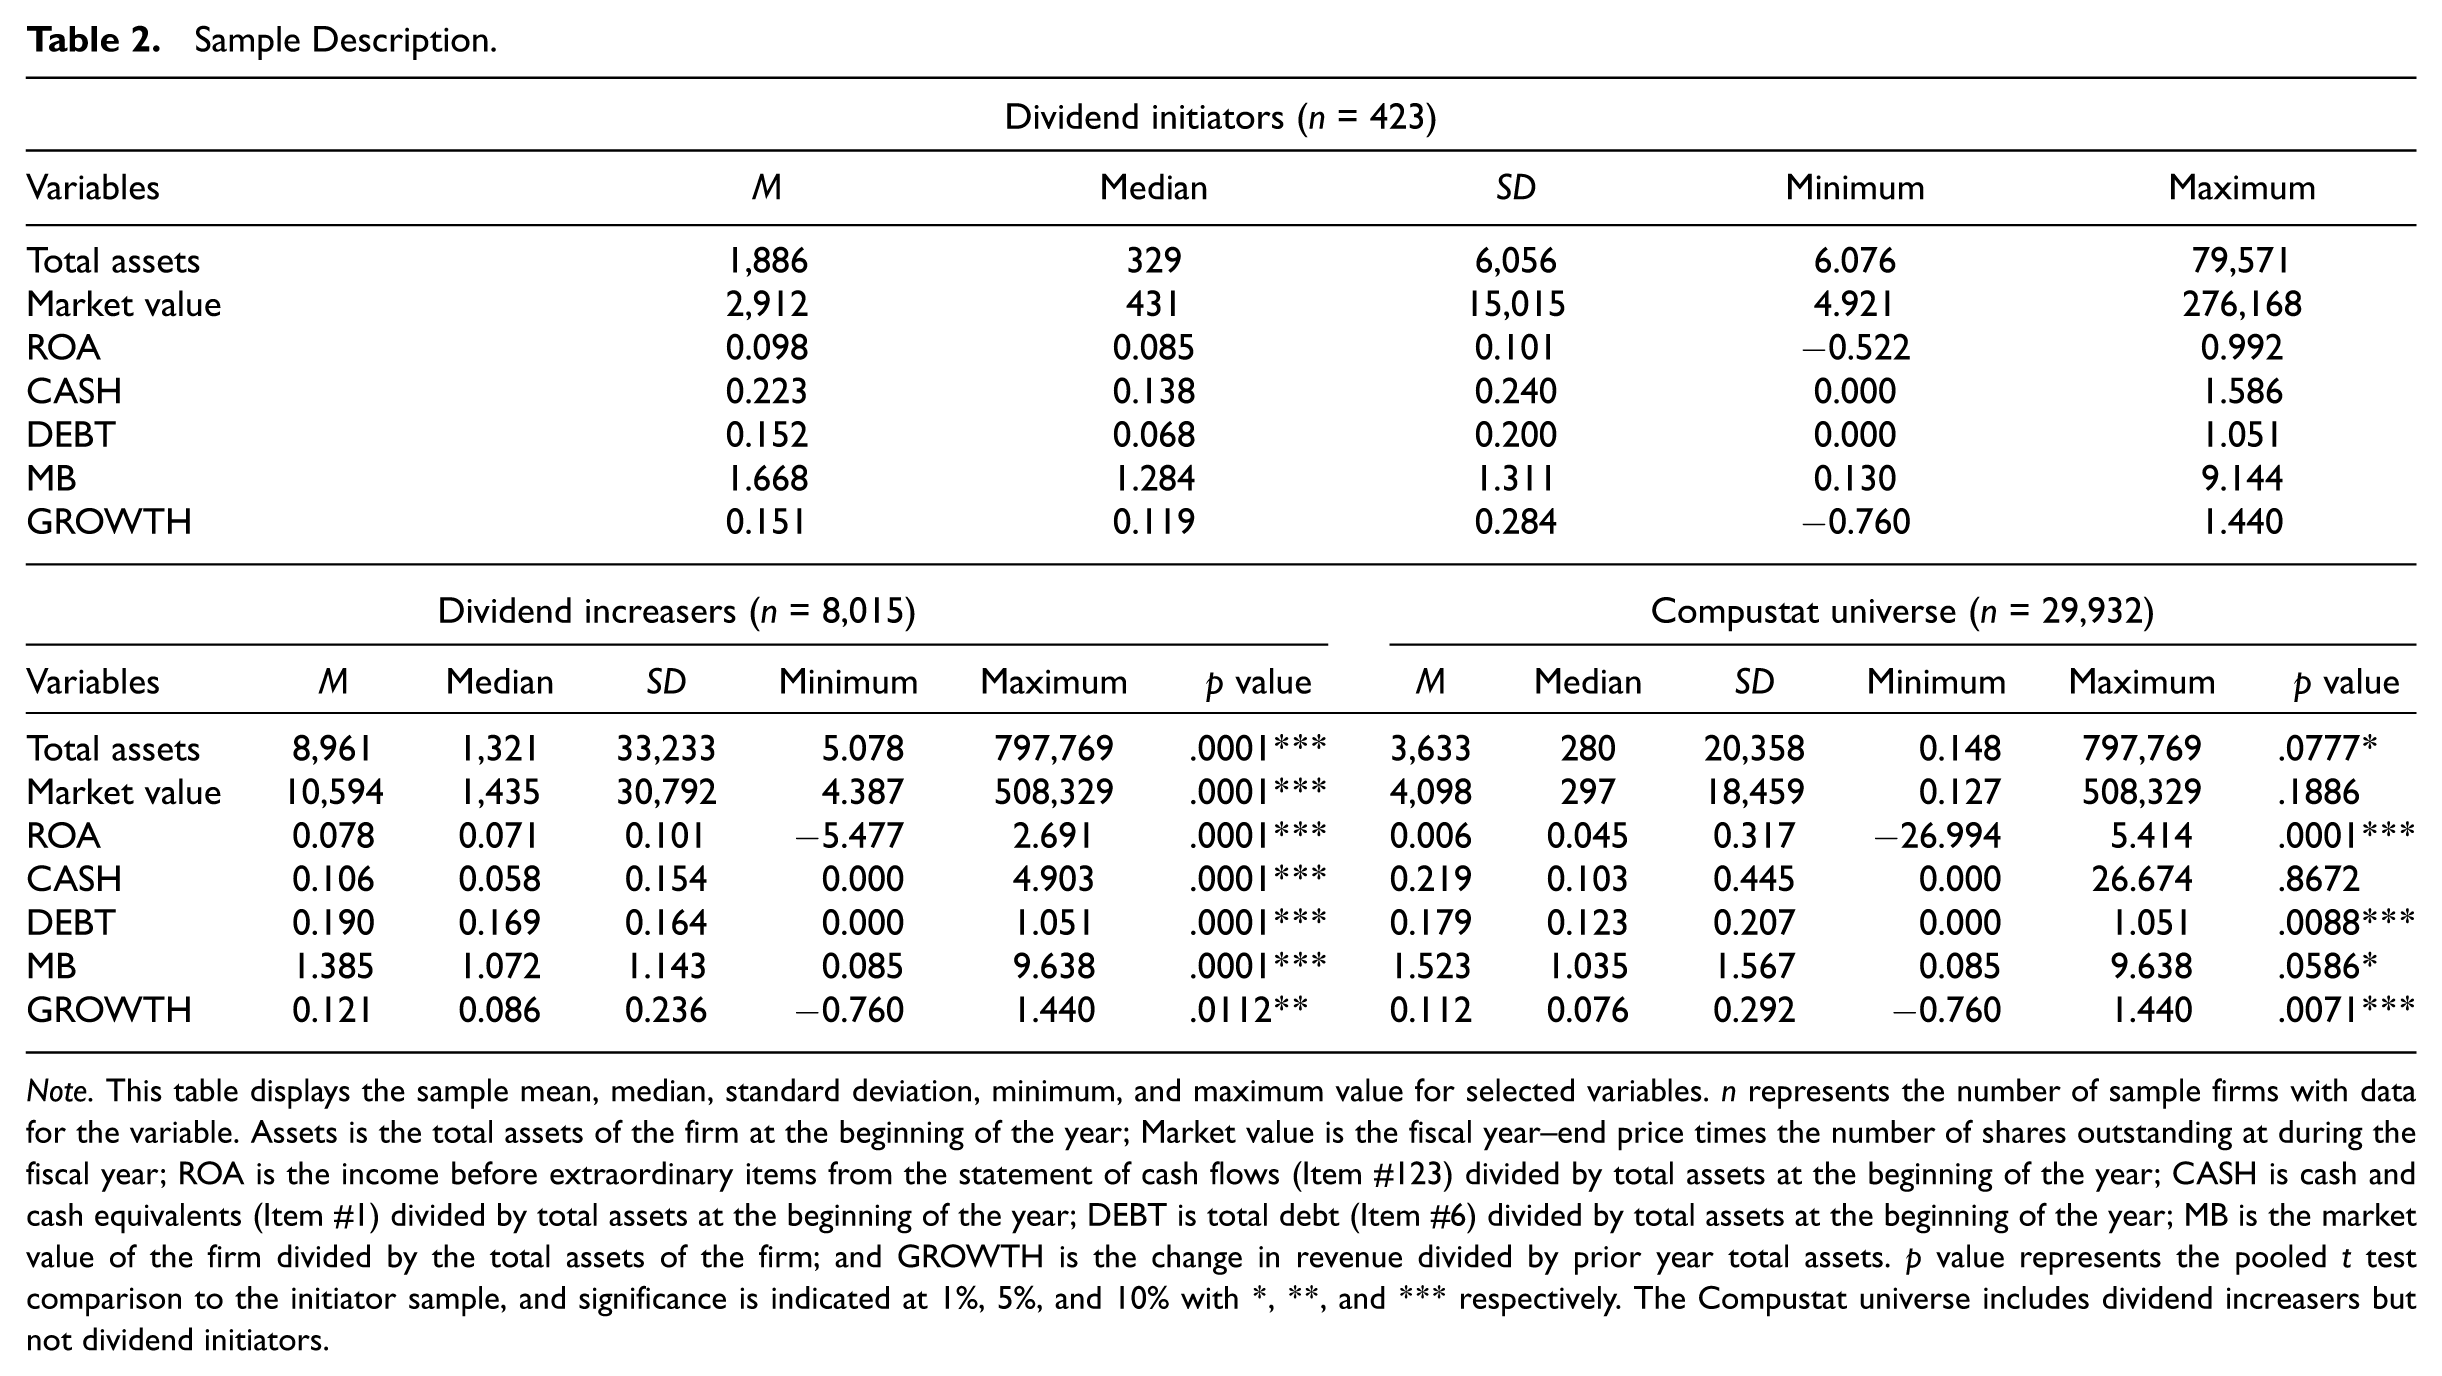
Note. This table displays the sample mean, median, standard deviation, minimum, and maximum value for selected variables. n represents the number of sample firms with data for the variable. Assets is the total assets of the firm at the beginning of the year; Market value is the fiscal year–end price times the number of shares outstanding at during the fiscal year; ROA is the income before extraordinary items from the statement of cash flows (Item #123) divided by total assets at the beginning of the year; CASH is cash and cash equivalents (Item #1) divided by total assets at the beginning of the year; DEBT is total debt (Item #6) divided by total assets at the beginning of the year; MB is the market value of the firm divided by the total assets of the firm; and GROWTH is the change in revenue divided by prior year total assets. p value represents the pooled t test comparison to the initiator sample, and significance is indicated at 1%, 5%, and 10% with *, **, and *** respectively. The Compustat universe includes dividend increasers but not dividend initiators.
Compared with dividend increasing firms, initiating firms have smaller mean assets, US$1,886 million for initiators versus US$8,961 for increasers. Compared with the more general Compustat universe (which includes dividend increasers but not dividend initiators), initiating firms also have a lower mean size (US$1,886 versus US$3,633) but have larger median assets (US$329 versus US$280) than the Compustat universe.
Initiating firms have a significantly higher mean ROA (9.8%) than increasing firms (7.8%). The mean ROA for the Compustat sample (0.6%) is significantly lower than initiators. Initiating firms have significantly higher mean cash ratios than increasers and the Compustat universe sample and lower mean debt ratios than increasers. Mean market to book ratio is also significantly higher for initiators (1.668) when compared with dividend increasers (1.385). Dividend initiators spend significantly less on R&D than the Compustat universe firms and are significantly younger than both sets of control sample firms.
The frequency breakdown of dividend payouts by year and by SIC codes for initiating firms and the control sample is presented in Table 3.
Distribution of Initiators and Increasers.
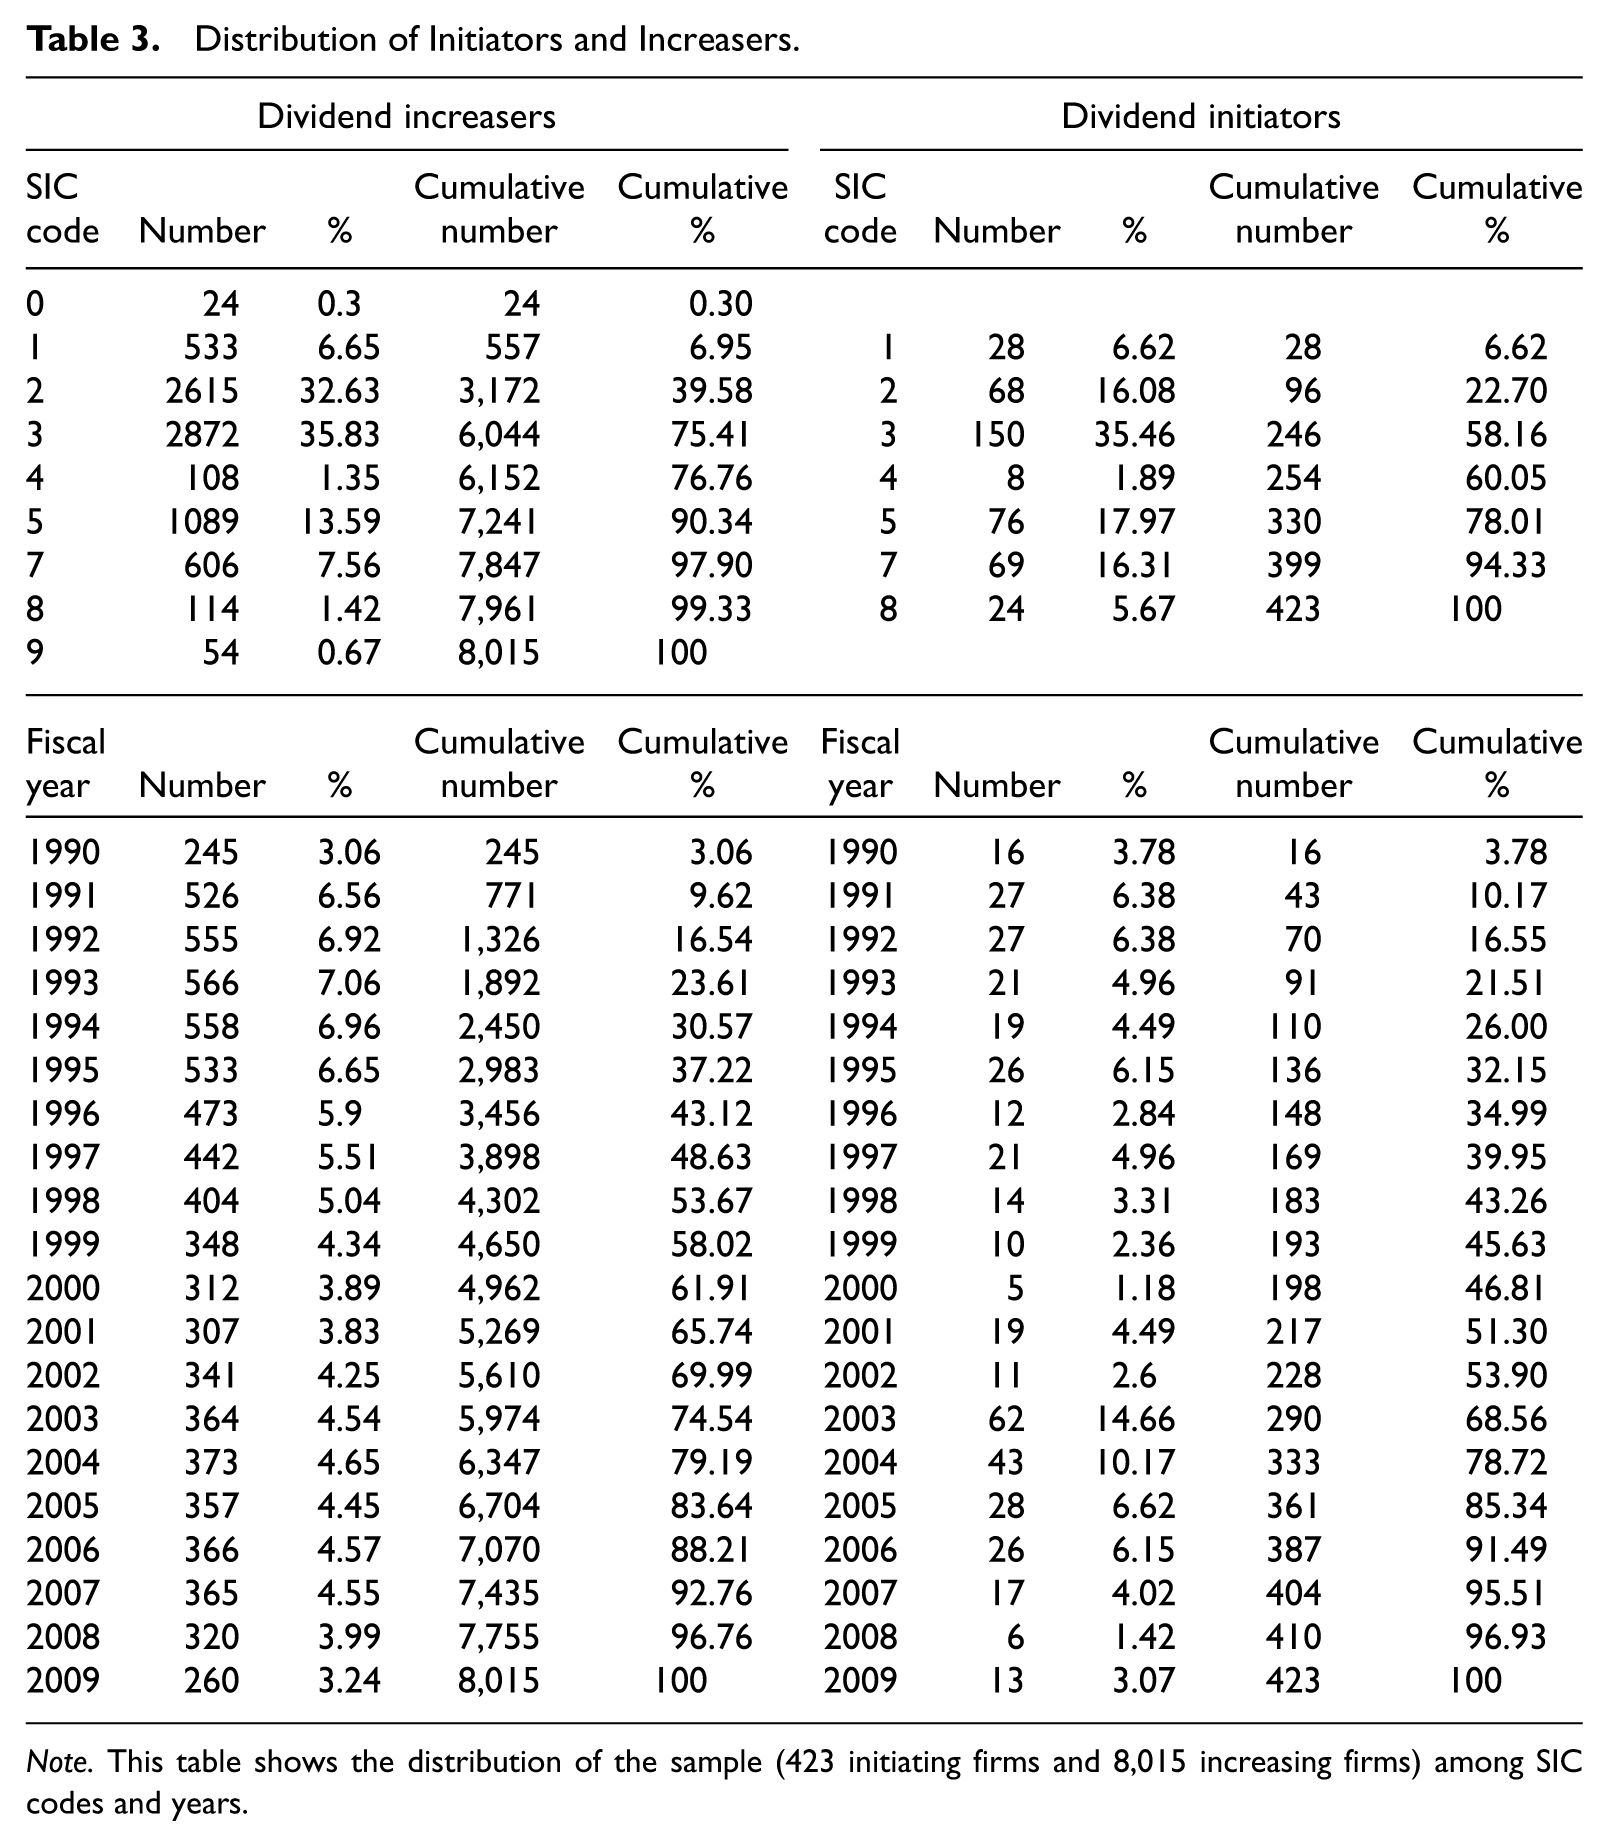
Note. This table shows the distribution of the sample (423 initiating firms and 8,015 increasing firms) among SIC codes and years.
Examining dividend initiation by industry code, we find that 150 firms (35.46%) are from SIC code 3000 (Manufacturing), followed by 76 initiators (17.97%) from SIC code 5000 (Retail Trade). No initiating firms are found from the Agricultural sector and from the Public Administration sector (SIC codes 0-900 and 9000, respectively). For the sample period of 1990-2009, we find that that a high of 62 firms (14.66%) initiated dividends in 2003, followed by 43 firms (10.17%) in 2004. The lowest number for initiating firms is five firms (1.18%) in 2000 and six firms (1.42%) in 2008.
Method
Accrual-based earnings management
We begin our analysis by examining accrual-based earnings management. We follow the methodology used by Cohen and Zarowin (2010) and Zang (2012) to test the use of accrual-based and real earnings management (Jones model). The methodology is applied to the years leading up to dividend initiation, from 3 years prior to the year of dividend initiation. This method controls for the industry and economic effects on accruals over time. For each industry and year combination, the following model is estimated:

Using the coefficients for industry effects from Equation 1, we use the model to calculate firm-specific normal accruals (NAit) for all firms in the sample.
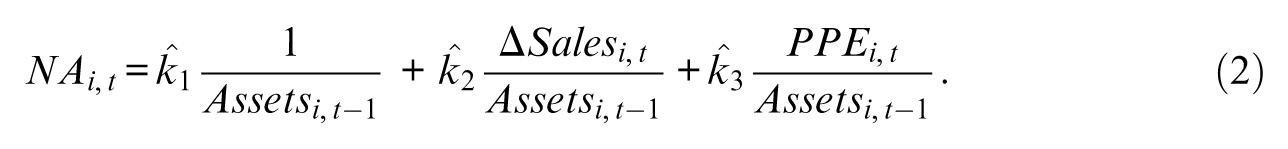
We then arrive at the discretionary accruals which are the difference between the fitted accruals and the firm-specific normal accruals.
Real earnings management
We next examine real earnings management as it applies to dividend initiation. The real asset management model was developed by Dechow, Kothari, and Watts (1998) and used by Roychowdhury (2006), Cohen and Zarowin (2010), and Zang (2012). Each respective category (cash flow from operations, cost of goods sold, change in inventory, and discretionary expense) of potential real earnings management is estimated as a linear function of sales and change in sales, and we add to the models with growth variables from Gunny (2010). 3 We calculate estimates for each industry and year using the equations below. The coefficients from these regressions are applied at the firm level to determine an expected value for cash flow from operations, cost of goods sold, change in inventory, and discretionary expense. The difference between the actual value for the firm and the expected value for the firm is the abnormal cash flow. Discretionary expense (DISX) is the combination of advertising, R&D, and SG&A expenses.
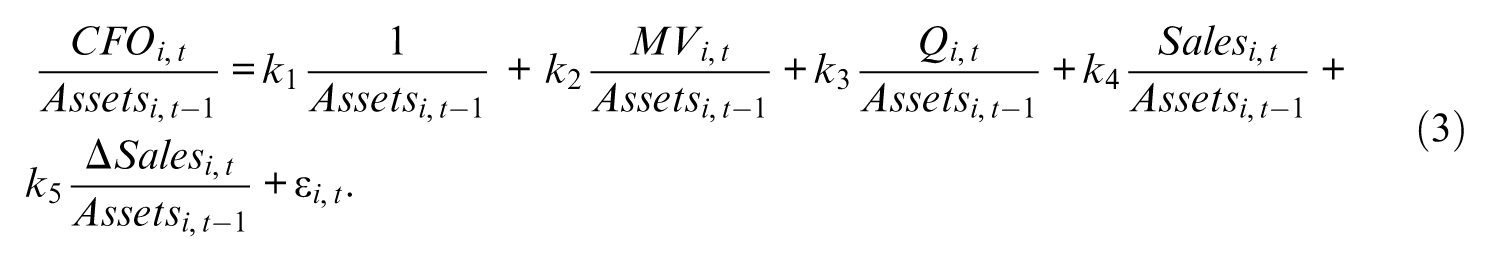
Abnormal cash flow is the difference between actual cash flow and estimated cash flow.
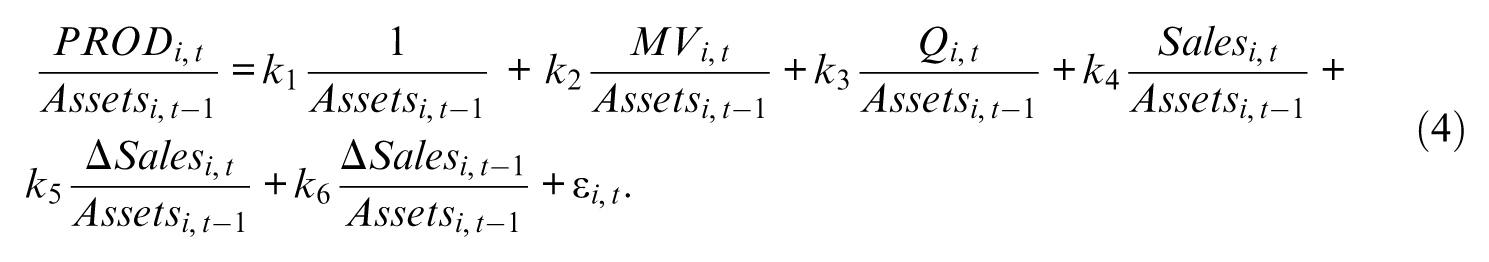
Abnormal production cost is the difference between actual and estimated production cost.
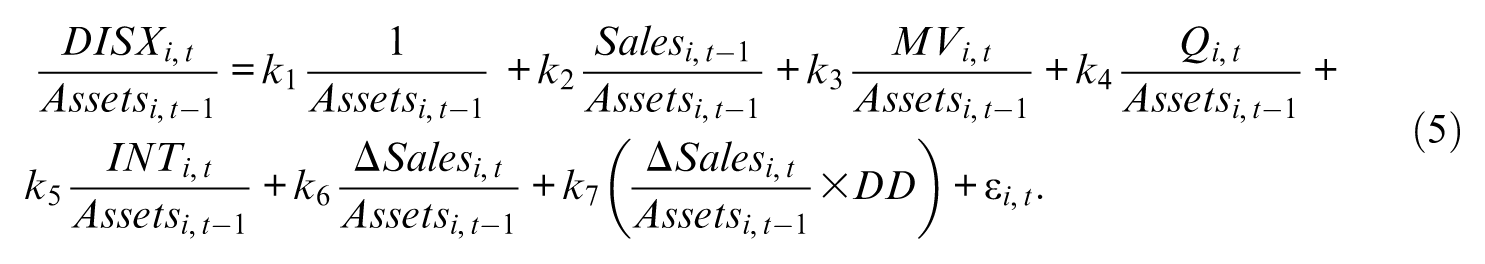
Abnormal discretionary expenses are the difference between actual and estimated discretionary expenses.
We refer to our regression proxies as CFO, for abnormal cash flow from operations, PROD, for abnormal production levels, DISX, for abnormal discretionary expenses, and AM, for abnormal discretionary accruals. Following Zang (2012), we use 48 Fama and French (1997) industry identifiers with at least 15 observations per industry and year for our cross-sectional estimations. Furthermore, although the individual proxies outlined above provide in-depth information on the evidence of earnings management practices by the firm, we also are interested in the aggregate impact of these proxies. Therefore, we calculate a combination proxy, EM, following Badertscher (2011) to incorporate the total within-GAAP (generally accepted accounting principles) earnings management. We calculate EM by first multiplying CFO and DISX by negative one, so that a positive value indicates upward earnings management, and add them to PROD and AM. For a more consistent interpretation, we multiply the CFO and DISX proxies by negative one in all instances, so that a positive (negative) coefficient implies upward (downward) earnings management for all five earnings management proxies.
Once the earnings management proxies have been calculated, we use them in our estimations similar to Roychowdhury (2006) and Zang (2012) as follows:

where Y is the measure of earnings management (CFO, PROD, DISX, AM, or EM), Initiator is a dummy variable equal to 1 if the firm announced a recurring dividend initiation or 0 otherwise; Increaser is a dummy variable equal to 1 if the firm increased cash dividend payments on common stock or 0 otherwise; SIZE is the natural log of the market value of the firm; ROA is the income before extraordinary items divided by total assets at the beginning of the year; and MB is the market value of the firm divided by the book value. Since the dependent variable is in terms of an industry differential (i.e., it is the difference between the firm’s value compared with the value of industry peers in the same year), the dependent variables are expressed as the difference of the mean of industry peers in the same year (Roychowdhury, 2006; Zang, 2012).
We estimate this regression for the 4-year period from 3 years prior to dividend initiation through the year of dividend initiation announcement. Both the dependent and independent variables are calculated for all 4 years. To capture the total trending effect of the earnings management, we also estimate an additional regression that includes all 4 years combined, where Yt is equal to the total earnings management from year minus three through the year of dividend initiation announcement, and the independent variables are from the year of dividend initiation announcement. 4
Market valuation of earnings
We next examine the market reaction to dividend initiations, using standard event study methodology (Brown & Warner, 1985). We omit 32 firms where a LexisNexis search reveals confounding news events that could potentially impact market reaction. The event study is based on five announcement date windows (−2, +2), (−1, +1), (0, +1), (−1, 0), and (0, 0). The ordinary least squares (OLS) market model is used to specify the returns generating process. Daily excess returns (ARs) are computed by estimating the market model parameters over the period from t = −258 to t = −3 relative to the announcement day t = 0. The standardized cross-sectional method (Boehmer, Musumeci, & Poulsen, 1992) with Scholes and Williams’ (1977) betas is used to test for significance. The average excess return for each day is calculated by summing the ARs for the N firms in the sample and dividing by N. The cumulative average excess returns (CARs) over a multiday event period are calculated by summing the average excess returns over the t day event window.
In addition to examining the market reaction to the event window(s) surrounding the initiation, we also examine the cross-sectional determinants of the abnormal return. We include the control proxies, SIZE, MB, CASH, DEBT, and EPS, used by Hull (2013) to explain dividend changes, and our complete model is defined as follows:
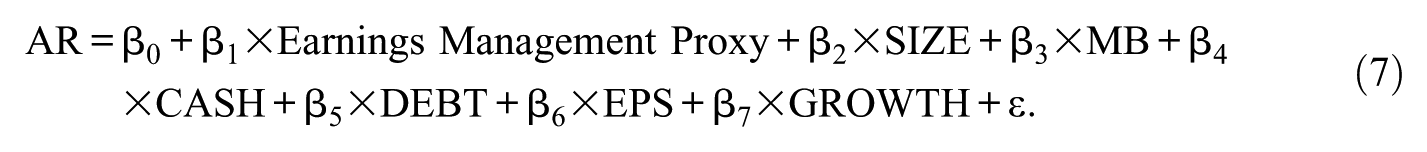
where AR is the abnormal return for the event window (0, 0); SIZE is the natural log of the market value of the firm, calculated as the fiscal year–end price times the number of common shares outstanding during the year; MB is the market value of the firm divided by total assets at the beginning of the year; CASH is cash and cash equivalents (Compustat Item 1) divided by total assets at the beginning of the year; DEBT is the total firm debt (Compustat Item 9) divided by total assets at the beginning of the year; EPS is basic earnings per common share; GROWTH is the change in revenue for the current year divided by total sales at the beginning of the year; If firms use earnings management as a signal, we expect to see a positive coefficient for the earnings management proxies.
Empirical Results
We examine two competing hypotheses to explain earnings management surrounding dividend initiation. The signaling theory predicts that firms use earnings management to increase earnings near the announcement of dividend initiation. Conversely, the free cash flow theory suggests that firms use earnings management to decrease earnings leading up to dividend initiation.
We begin our analyses in Table 4 with a simple test of our signaling hypothesis, H1. If firms are signaling, we expect to find a positive coefficient on the Initiator or Increaser dummy variable as evidence of upward accrual or real earnings management (H1). Our model follows Roychowdhury (2006), Zang (2012), and Gunny (2010) to test for evidence of signaling.
Test of Signaling Theory.
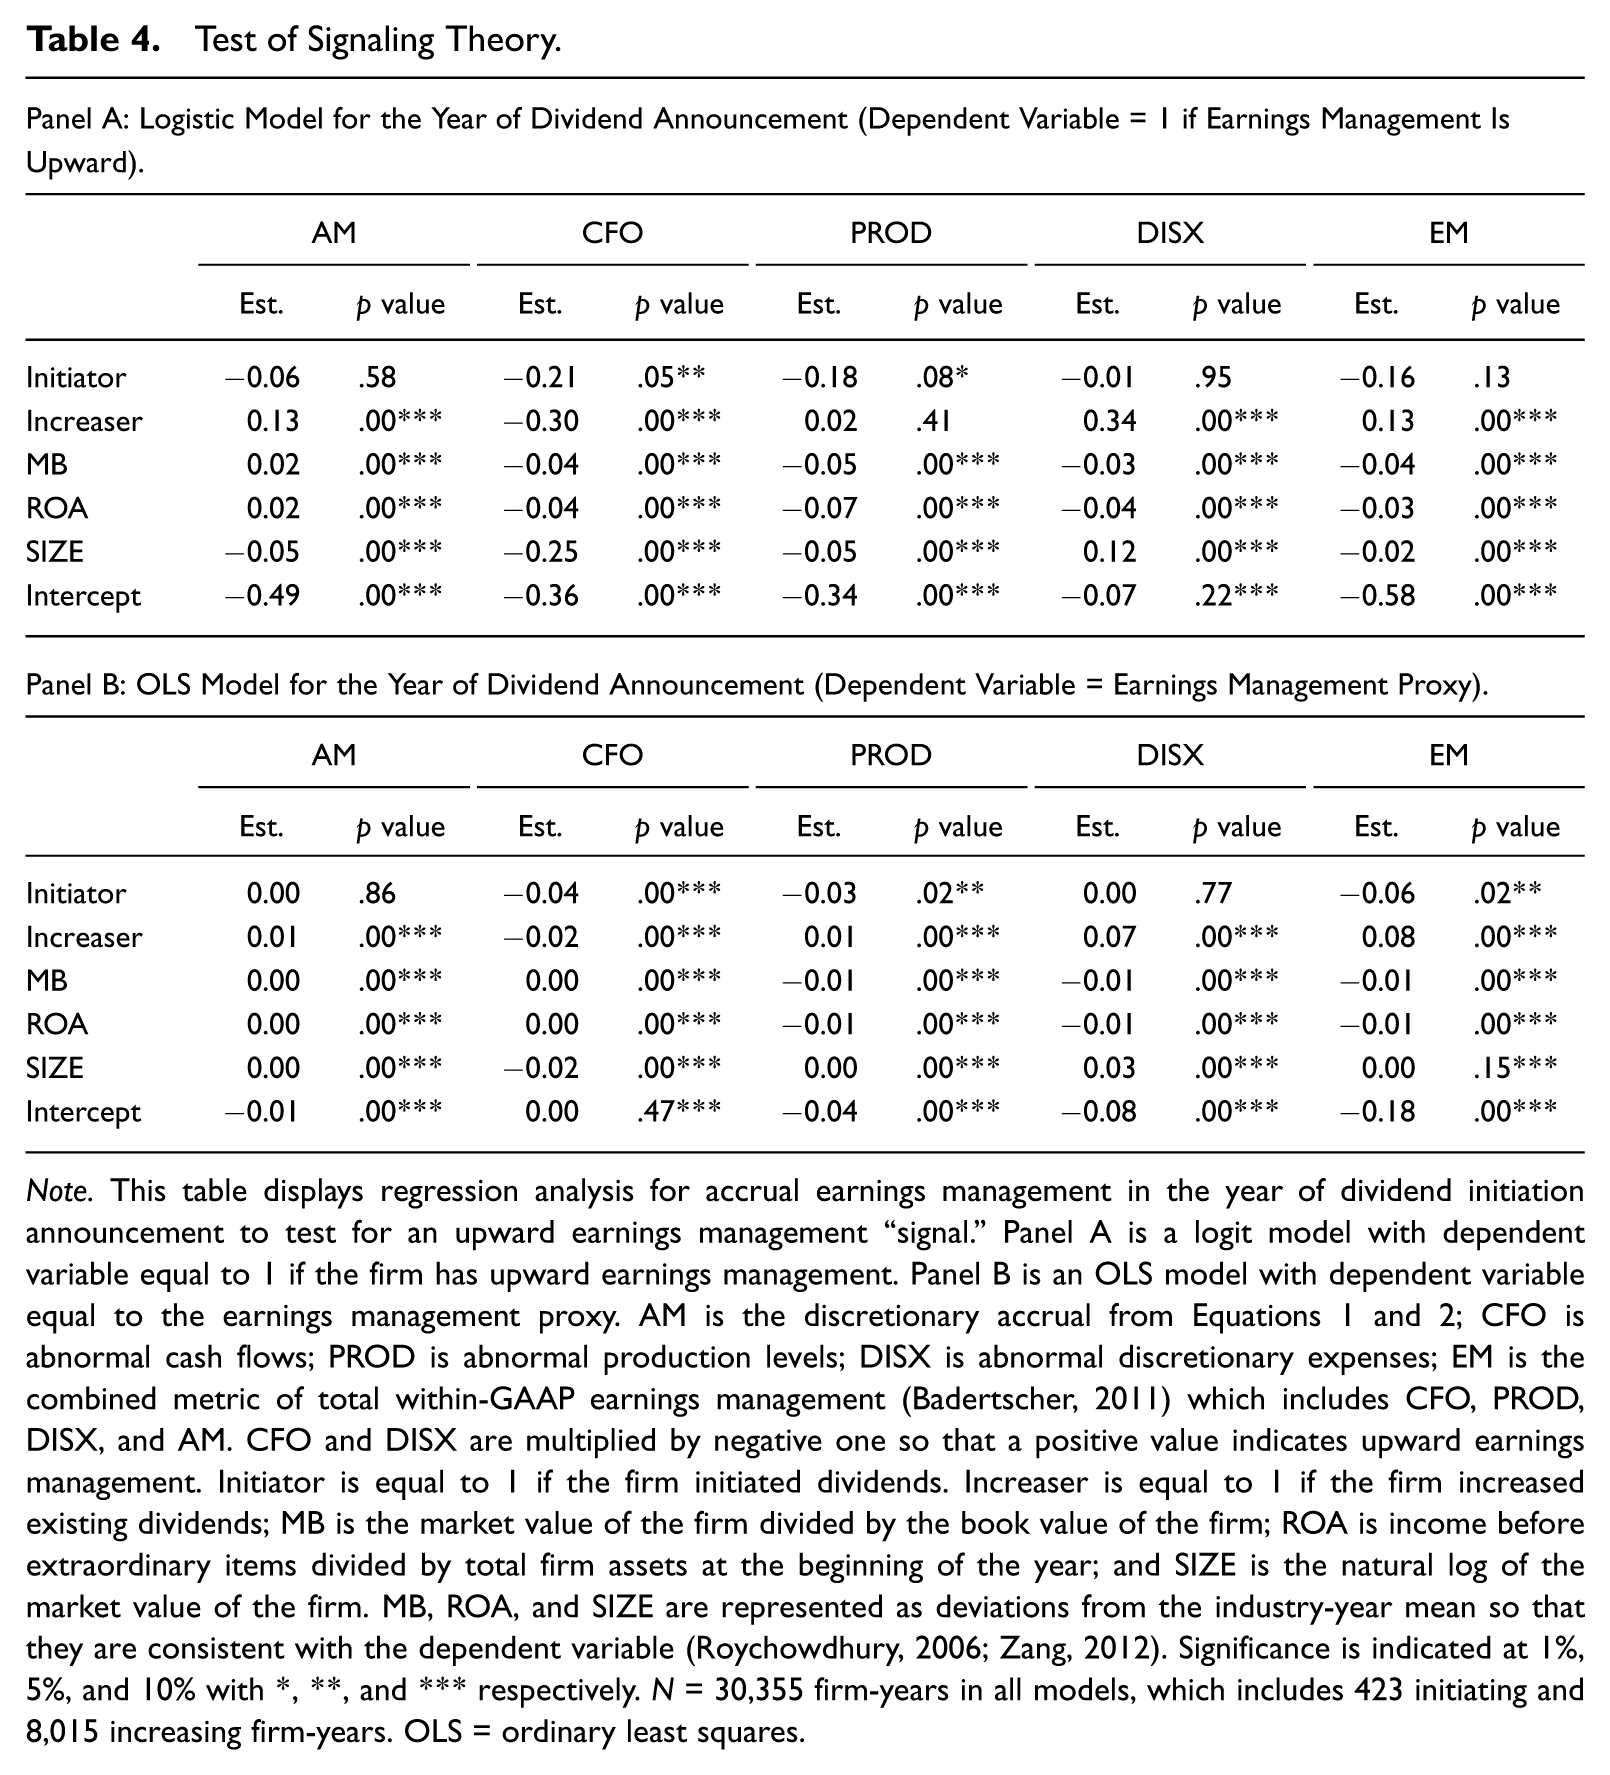
Note. This table displays regression analysis for accrual earnings management in the year of dividend initiation announcement to test for an upward earnings management “signal.” Panel A is a logit model with dependent variable equal to 1 if the firm has upward earnings management. Panel B is an OLS model with dependent variable equal to the earnings management proxy. AM is the discretionary accrual from Equations 1 and 2; CFO is abnormal cash flows; PROD is abnormal production levels; DISX is abnormal discretionary expenses; EM is the combined metric of total within-GAAP earnings management (Badertscher, 2011) which includes CFO, PROD, DISX, and AM. CFO and DISX are multiplied by negative one so that a positive value indicates upward earnings management. Initiator is equal to 1 if the firm initiated dividends. Increaser is equal to 1 if the firm increased existing dividends; MB is the market value of the firm divided by the book value of the firm; ROA is income before extraordinary items divided by total firm assets at the beginning of the year; and SIZE is the natural log of the market value of the firm. MB, ROA, and SIZE are represented as deviations from the industry-year mean so that they are consistent with the dependent variable (Roychowdhury, 2006; Zang, 2012). Significance is indicated at 1%, 5%, and 10% with *, **, and *** respectively. N = 30,355 firm-years in all models, which includes 423 initiating and 8,015 increasing firm-years. OLS = ordinary least squares.
Panel A of Table 4 provides the results for the logistic regression for our sample. The dependent variable is equal to 1 if the firm has upward earnings management in one of five earnings management proxies, discretionary accruals (AM), abnormal cash flows (CFO), abnormal production levels (PROD), abnormal discretionary expenses (DISX), or a cumulative measure of earnings management (EM). If initiating firms are managing earnings up in order to signal to the market, we would expect to see a significantly positive coefficient for the initiator dummy variable. Instead, we find the sign for the Initiator coefficient to be negative and significant for the CFO and PROD estimations, while the Initiator coefficients are insignificant in the other estimations. Moreover, for dividend increasers, we find that the Increaser coefficient is positive and highly significant for four of the five estimations, supporting the previous findings by Subramanyam (1996) and Koerniadi and Tourani-Rad (2011) that dividend increasing firms send a coordinated signal to the market with their upward earnings management.
Panel B of Table 4 shows the coefficients of the OLS regression where the dependent variable is one of five continuous proxies for earnings management. Our results are similar to those found in Panel A. The sign for initiators is negative and significant or close to 0 and insignificant, while the sign for increasers is significant and positive for four of the five estimations. Overall, we find no evidence that dividend initiators are signaling to the market via the use of discretionary accruals or real earnings management. Thus, we do not find evidence to support H1.
We next turn to the tests for the agency hypothesis (H2) and provide these results in Table 5. We use OLS regressions to examine earnings management for firms in the years leading up to and including the year of dividend initiation. We expect to find a significantly negative coefficient on the Initiator variable for CFO, PROD, AM, and EM as initiating firms should be managing cash flows to preserve financial flexibility for the future in anticipation of dividend initiation. In the case of abnormal discretionary expenses, DISX, we do not make an expectation as to the coefficient sign because, while higher discretionary expense is consistent with downward earnings management, overspending would reduce cash available to management for investment.
Test of Free Cash Flow Theory.
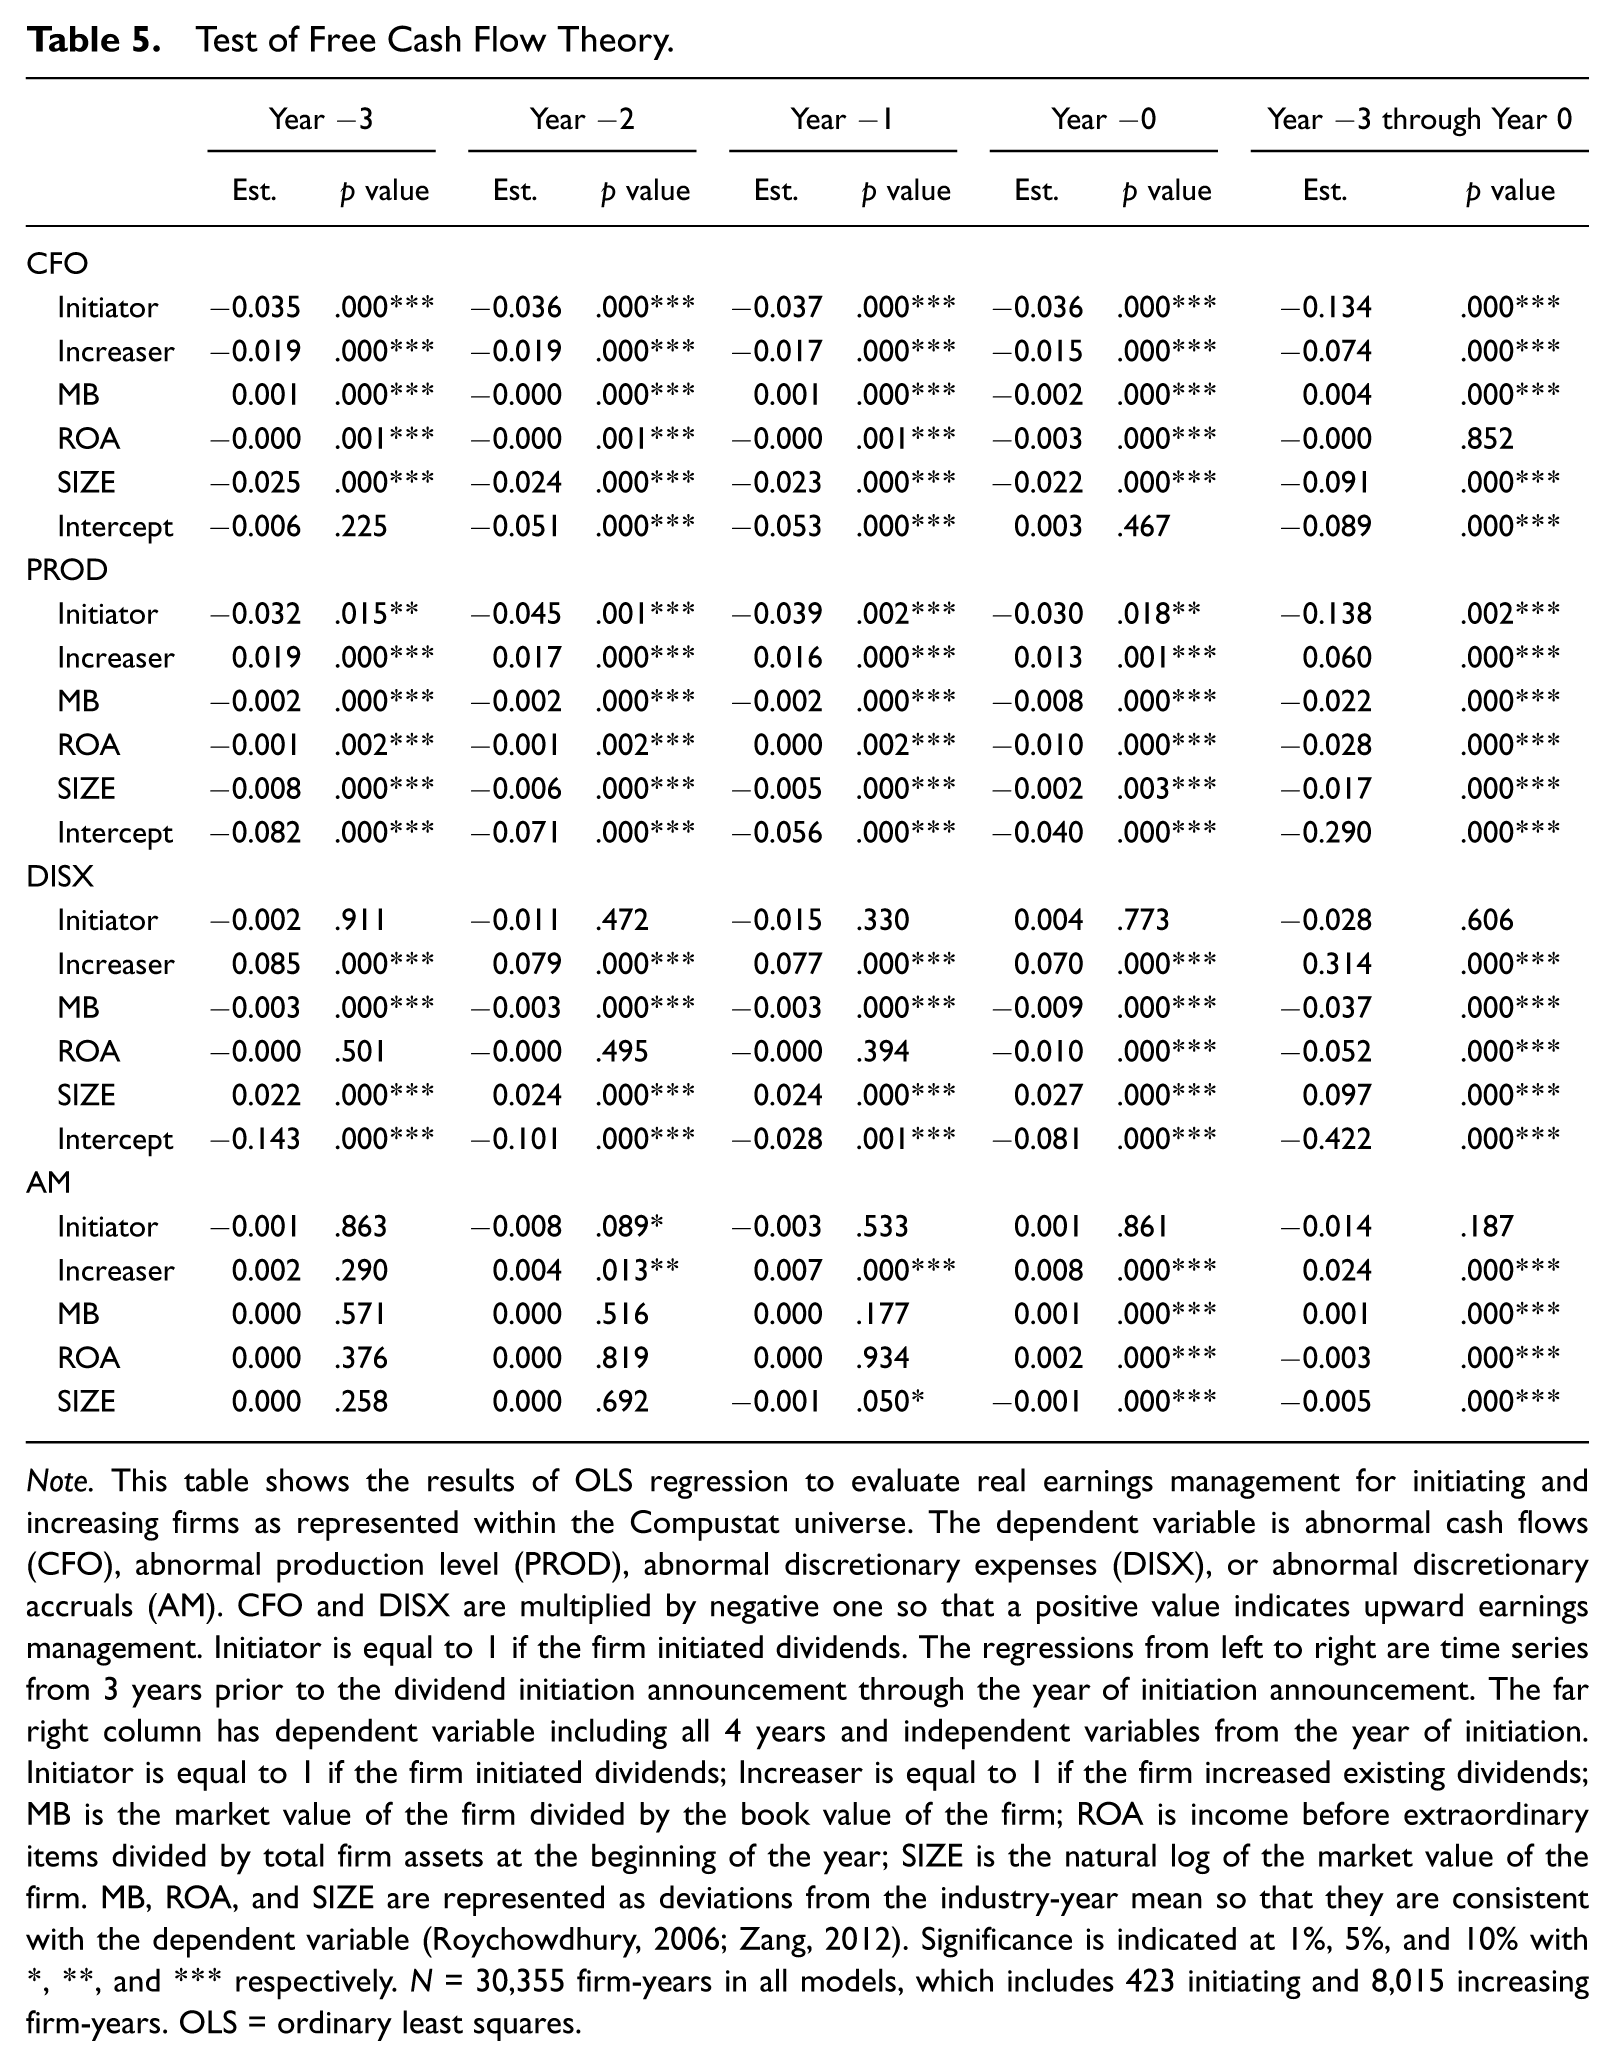
Note. This table shows the results of OLS regression to evaluate real earnings management for initiating and increasing firms as represented within the Compustat universe. The dependent variable is abnormal cash flows (CFO), abnormal production level (PROD), abnormal discretionary expenses (DISX), or abnormal discretionary accruals (AM). CFO and DISX are multiplied by negative one so that a positive value indicates upward earnings management. Initiator is equal to 1 if the firm initiated dividends. The regressions from left to right are time series from 3 years prior to the dividend initiation announcement through the year of initiation announcement. The far right column has dependent variable including all 4 years and independent variables from the year of initiation. Initiator is equal to 1 if the firm initiated dividends; Increaser is equal to 1 if the firm increased existing dividends; MB is the market value of the firm divided by the book value of the firm; ROA is income before extraordinary items divided by total firm assets at the beginning of the year; SIZE is the natural log of the market value of the firm. MB, ROA, and SIZE are represented as deviations from the industry-year mean so that they are consistent with the dependent variable (Roychowdhury, 2006; Zang, 2012). Significance is indicated at 1%, 5%, and 10% with *, **, and *** respectively. N = 30,355 firm-years in all models, which includes 423 initiating and 8,015 increasing firm-years. OLS = ordinary least squares.
Examining the results in Table 5, we find that initiating firms have a negative coefficient on the Initiator variable for CFO in the 3 years prior to and the year of dividend initiation, with a coefficient from −0.035 to −0.037. Significance is at the 1% level in all periods. The cumulative effect is both economically and statistically significant, and the results provide strong evidence that initiators are reducing the appearance of resources available for paying dividends. This confirms H2. Although dividend increasers also appear to be using CFO to manage earnings downward, the magnitude is approximately half that of initiators. The coefficients on the Increaser dummy are between −0.015 and −0.019 over the 4 years tested, significant at the 1% level.
Examining production levels for initiators, we find evidence that initiators are managing production down to maintain financial flexibility, with significant coefficients ranging from −0.030 to −0.045. The strongest evidence of abnormal production is in the 2 years prior to initiation. Dividend increasing firms, the other hand, seem to be increasing production levels in the years preceding such payment. For the 4-year period, the coefficient for dividend initiators managing earnings downward is −0.138, and for dividend increasers, managing earnings upward is 0.060, and both are significant at the 1% level. These results confirm H2 for initiating firms.
We do not find evidence that initiating firms use discretionary expenses to manage earnings prior to initiation; none of the Initiator coefficients are significant. However, dividend increasing firms have abnormally low discretionary expenses (income increasing) for all 4 years, with highly significant coefficients ranging from 0.70 to 0.85. Reducing discretionary expenses increases earnings but contributes to a higher cash flow from operations.
In the last row of Table 5, we report regressions of accrual earnings management, AM. There is weak significance that dividend initiating firms are managing earnings down in Year −2, 2 years prior to initiation, but not in any of the other tested years. Firms that increase dividends are managing earnings upward in the 2 years prior, and the year of, the dividend increase, with coefficients ranging from 0.004 to 0.008.
Overall, the results in Table 5 provide strong support for our hypotheses that initiators use downward real earnings management as evidenced by abnormally high cash flows and abnormally low production levels in the years prior to initiating dividend payment. We find mixed results for dividend increasing firms. Tests of abnormal cash flows suggest that dividend increasers are managing earnings downward, albeit at a much lower magnitude than initiating firms. Tests of abnormal production levels and discretionary expenses indicate that dividend increasing firms are managing earnings upward, consistent with signaling.
Table 6 provides the results of the OLS regressions examining the cumulative effects of real and accruals earnings management.
Total Effects of Earnings Management.
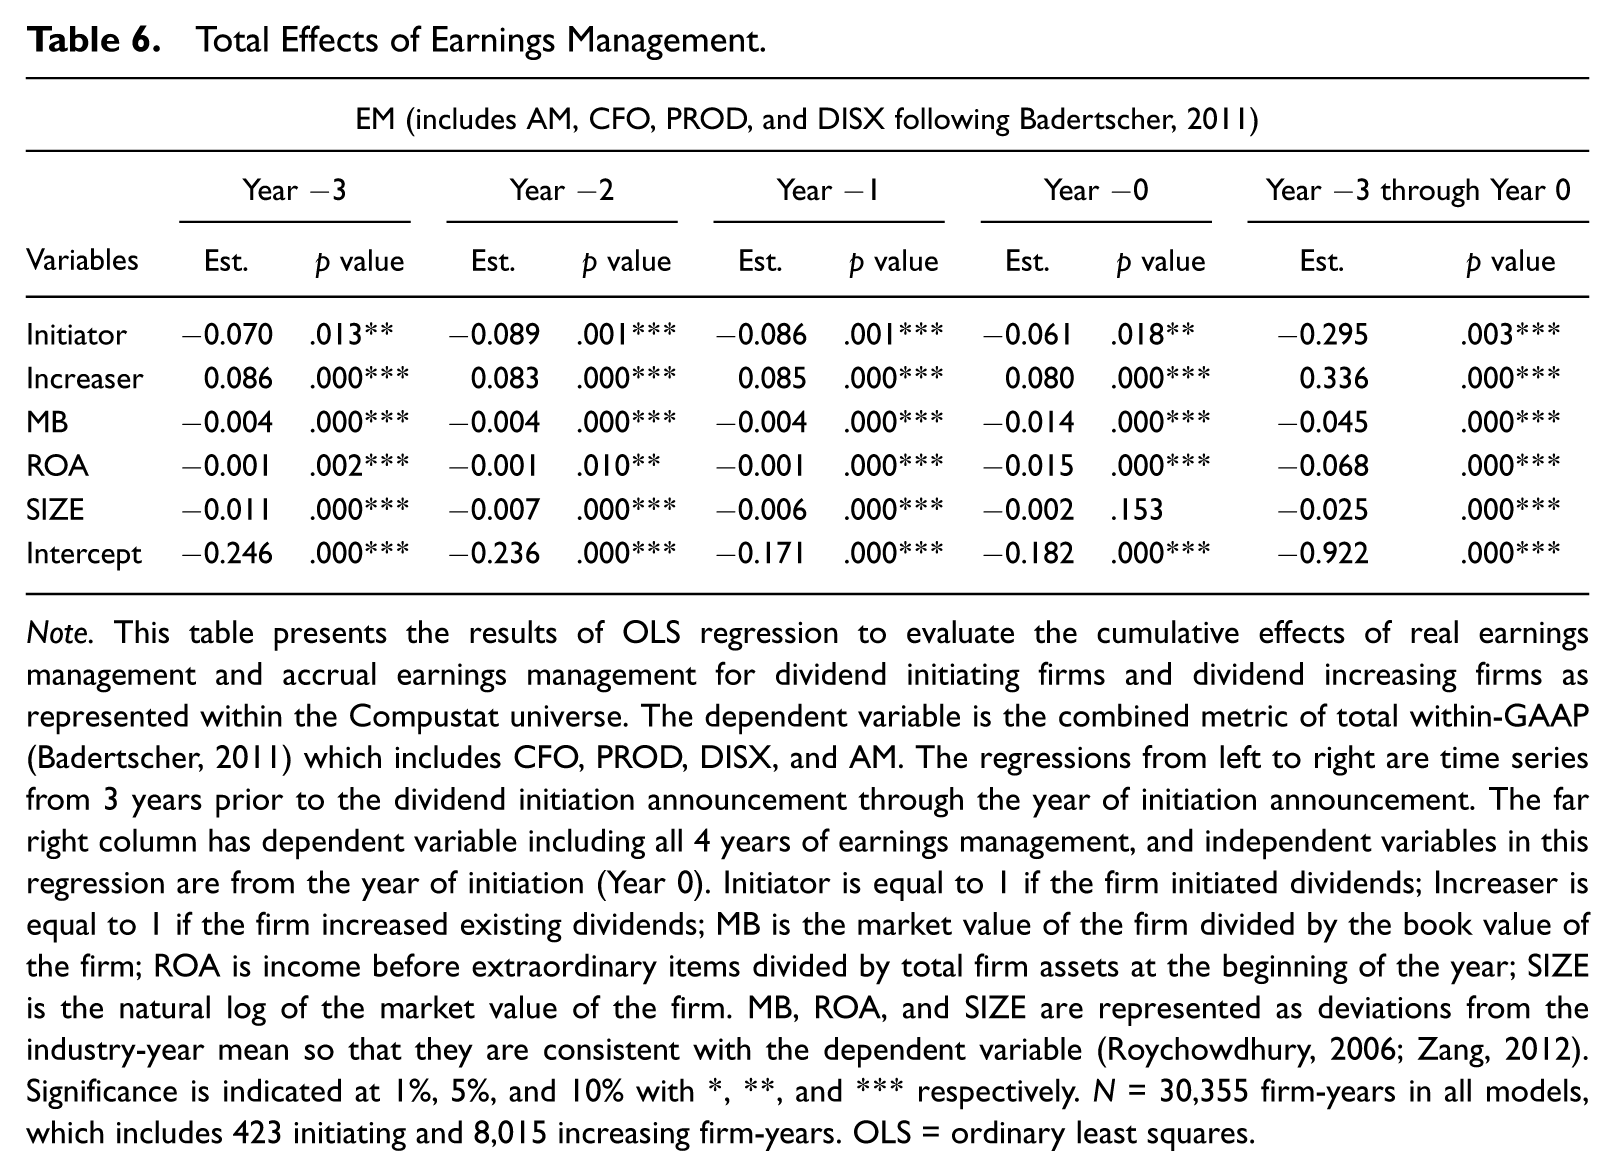
Note. This table presents the results of OLS regression to evaluate the cumulative effects of real earnings management and accrual earnings management for dividend initiating firms and dividend increasing firms as represented within the Compustat universe. The dependent variable is the combined metric of total within-GAAP (Badertscher, 2011) which includes CFO, PROD, DISX, and AM. The regressions from left to right are time series from 3 years prior to the dividend initiation announcement through the year of initiation announcement. The far right column has dependent variable including all 4 years of earnings management, and independent variables in this regression are from the year of initiation (Year 0). Initiator is equal to 1 if the firm initiated dividends; Increaser is equal to 1 if the firm increased existing dividends; MB is the market value of the firm divided by the book value of the firm; ROA is income before extraordinary items divided by total firm assets at the beginning of the year; SIZE is the natural log of the market value of the firm. MB, ROA, and SIZE are represented as deviations from the industry-year mean so that they are consistent with the dependent variable (Roychowdhury, 2006; Zang, 2012). Significance is indicated at 1%, 5%, and 10% with *, **, and *** respectively. N = 30,355 firm-years in all models, which includes 423 initiating and 8,015 increasing firm-years. OLS = ordinary least squares.
Although our estimations thus far examine the impact of either accrual or real earnings management, it is important to evaluate the overall effect. Table 6 provides the most compelling evidence on the cumulative impact of earnings management used by initiators. We follow Badertscher (2011) to examine the impact of total within-GAAP earnings management (CFO, DISX, PROD, and AM) on dividend initiation via the cumulative measure, EM. A positive coefficient for initiators implies that these firms are using upward earnings management. The results in Panel C show a negative relation between initiating firms and EM; indicating that initiating firms are managing earnings downward in the years leading up to initiation. We find this significance holds for all years and that the cumulative 4-year impact is also significantly negative. This supports H2, that dividend initiating firms will manage earnings downward, consistent with the free cash flow theory. Furthermore, we find that the coefficient for dividend increasers is positive and significant for all years prior to and during initiation, demonstrating that dividend increasing firms are managing earnings upward before such increase in payment. Dividend initiating and increasing firms have similar magnitudes of total earnings management but in opposite directions. 5
In general, dividend initiating firms should be high performers in order to provide the additional earnings to payout as dividends. To this end, we evaluate the median-adjusted ROA and profit margin for initiating firms for the 7 years surrounding dividend initiation and provide this in Table 7. The purpose of this test is to evaluate the economic impact of the significant downward earnings management identified in Tables 5 and 6 for dividend initiating firms and upward earnings management for dividend increasing firms.
Industry-Adjusted Return on Assets and Profit Margins Surrounding Initiation.
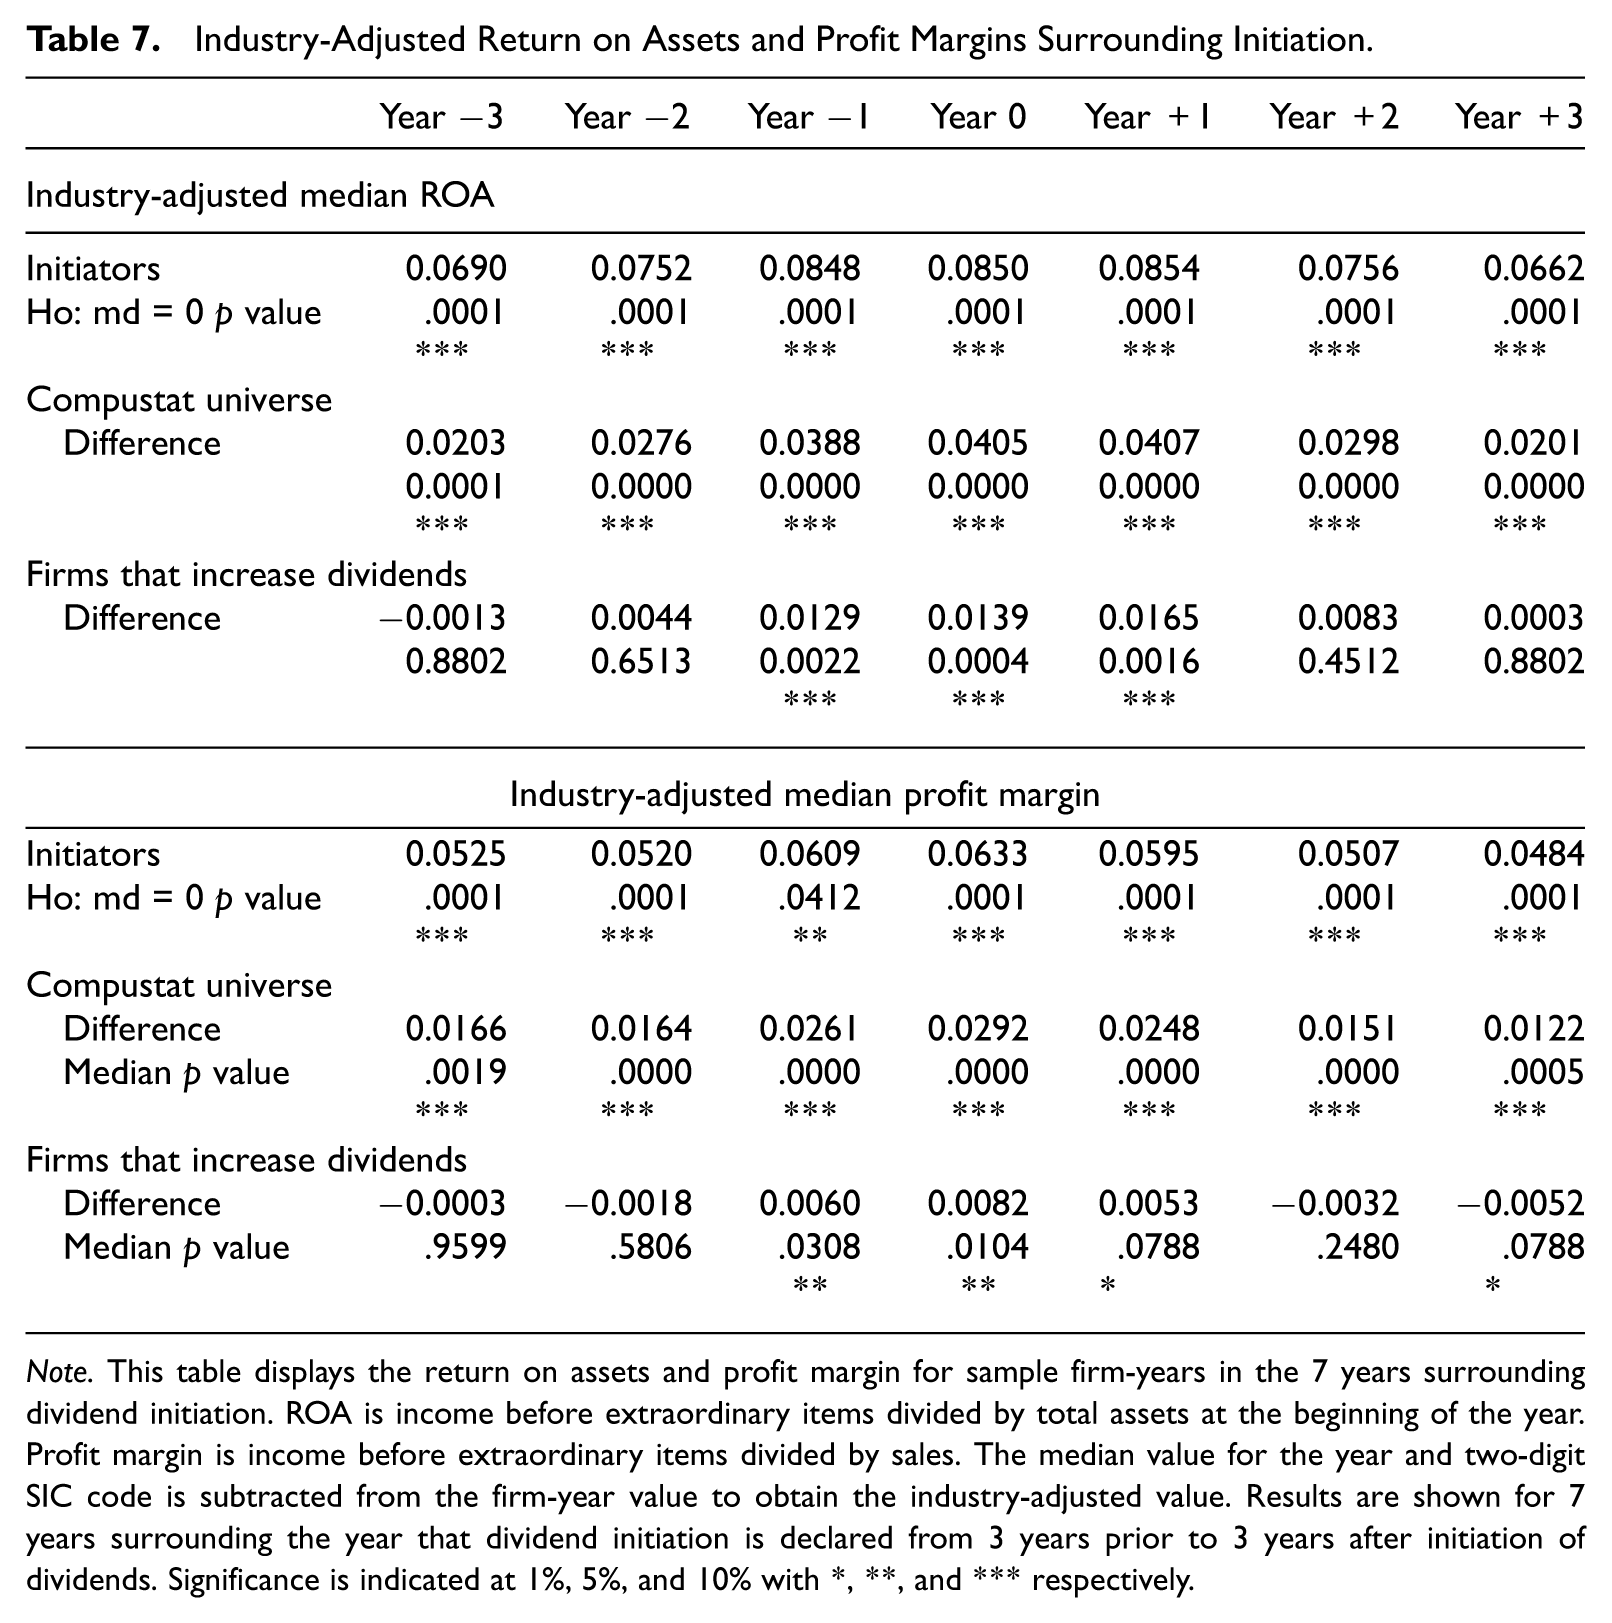
Note. This table displays the return on assets and profit margin for sample firm-years in the 7 years surrounding dividend initiation. ROA is income before extraordinary items divided by total assets at the beginning of the year. Profit margin is income before extraordinary items divided by sales. The median value for the year and two-digit SIC code is subtracted from the firm-year value to obtain the industry-adjusted value. Results are shown for 7 years surrounding the year that dividend initiation is declared from 3 years prior to 3 years after initiation of dividends. Significance is indicated at 1%, 5%, and 10% with *, **, and *** respectively.
Our results show that initiating firms have significantly nonzero (at the 1% level) industry-adjusted ROAs in 7 years surrounding initiation. Moreover, when compared with the Compustat universe control sample, initiators perform very significantly better in all 7 years surrounding initiation. Similarly, they outperform the control sample of firms that increase dividends in the years before, the year of, and the year after initiation, even though initiating firms are managing earnings downward and increasing firms are managing earnings upward leading up to the event.
Initiators also have significantly higher industry-adjusted profit margins in all years except for the year before initiation. Once again, initiators outperform the Compustat universe for all years in terms of industry-adjusted profit margins. However, we find that they do worse than firms that increase dividends in the first 2 years and the last 2 years presented, again showing that such firms are not signaling to the market. Initiating firms have higher profit margins than dividend increasers in the year prior to, during, and postinitiation, even though increasing firms are managing earnings up, and initiating firms are managing earnings down. Thus, in terms of industry-adjusted ROA and profit margins, even though dividend initiating firms are managing earnings downward, they are still significantly outperforming industry peers.
We next turn to the market reaction to dividend initiations. Extant literature documents that real and accrual earnings management is used in conjunction with dividend increases to signal information about future earnings (Koerniadi & Tourani-Rad, 2011; Subramanyam, 1996). Thus, we examine market returns to determine whether real or accrual earnings management is used to convey information to the market when firms initiate dividends. To the extent firms are using earnings management to enhance their signaling to the market, we would expect to see a significant, positive relationship between the extent of earnings management and the abnormal market return.
Table 8 provides the results of the event study surrounding dividend initiations for the 370 initiating firms with sufficient market history to calculate the announcement returns.
Abnormal Returns on Dividend Initiation Announcement.
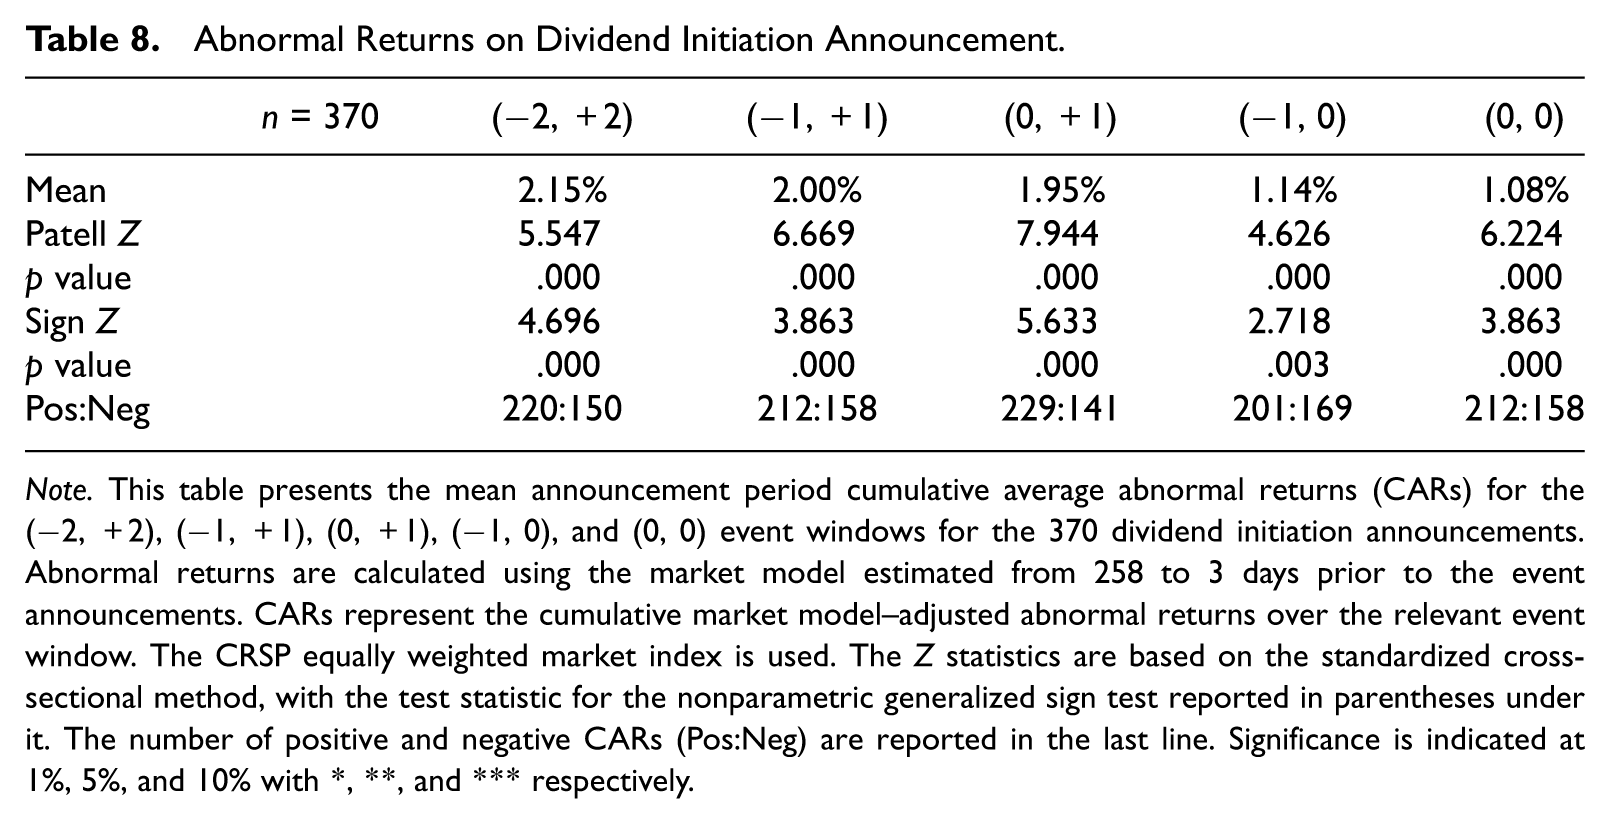
Note. This table presents the mean announcement period cumulative average abnormal returns (CARs) for the (−2, +2), (−1, +1), (0, +1), (−1, 0), and (0, 0) event windows for the 370 dividend initiation announcements. Abnormal returns are calculated using the market model estimated from 258 to 3 days prior to the event announcements. CARs represent the cumulative market model–adjusted abnormal returns over the relevant event window. The CRSP equally weighted market index is used. The Z statistics are based on the standardized cross-sectional method, with the test statistic for the nonparametric generalized sign test reported in parentheses under it. The number of positive and negative CARs (Pos:Neg) are reported in the last line. Significance is indicated at 1%, 5%, and 10% with *, **, and *** respectively.
We find that the announcement returns are significant and positive for all event windows, ranging from 2 days before to 2 days after the announcement and including the announcement date window. The cumulative abnormal returns are all statistically significant, with an abnormal return of 1.08% on the day of the announcement. Although the mean abnormal return on announcement of dividend initiation is positive, 42.7% of the abnormal returns on the announcement date are negative.
We next examine the cross-sectional determinants of the abnormal return reported in Table 8 to determine the impact of earnings management on the market reaction to dividend initiation. We present the results of the cross-sectional estimations in Table 9. The dependent variable is the announcement date abnormal return reported in Table 8 for the year of initiation. As mentioned earlier in the article, according to H3, if firms use earnings management as a signal, we should find a positive coefficient for one or more of the five measures of earnings management. Panel A provides the estimates for the entire sample of initiators while Panel B includes only those firms that have positive abnormal returns. The results in Panel A for AM show a marginal negative relation between abnormal discretionary accruals and Year 0 abnormal returns for all initiators, suggesting that initiating firms with upward accrual earnings management have lower announcement returns. We do not find initiator earnings management to be significant in any of the other estimations in Panel A. In Panel B, we also find a negative relation for AM. In column two of Panel B, we find a negative relationship for initiating firms that manage earnings upward with CFO. The interpretation is that firms with more upward earnings management have lower announcement returns. The remaining earnings management measures in Panel B are not significant. These results show that firms with upward earnings management are priced lower by the market, which is opposite of the purpose for signaling. Thus, we are unable to confirm H3. If firms are managing earnings upward to signal the market alongside the initiation of dividends, then we should detect a positive abnormal return with the upward earnings management. Instead, we find the opposite that firms earn a positive reaction from the market with lower discretionary accruals. Our findings are consistent with the Chen et al.’s (2007) conclusion that the market prices accrual quality, but we add to these findings by showing that the market reprices the lower accruals on announcement of dividend initiation.
Cross-sectional Analysis of Abnormal Returns due to Dividend Initiation.
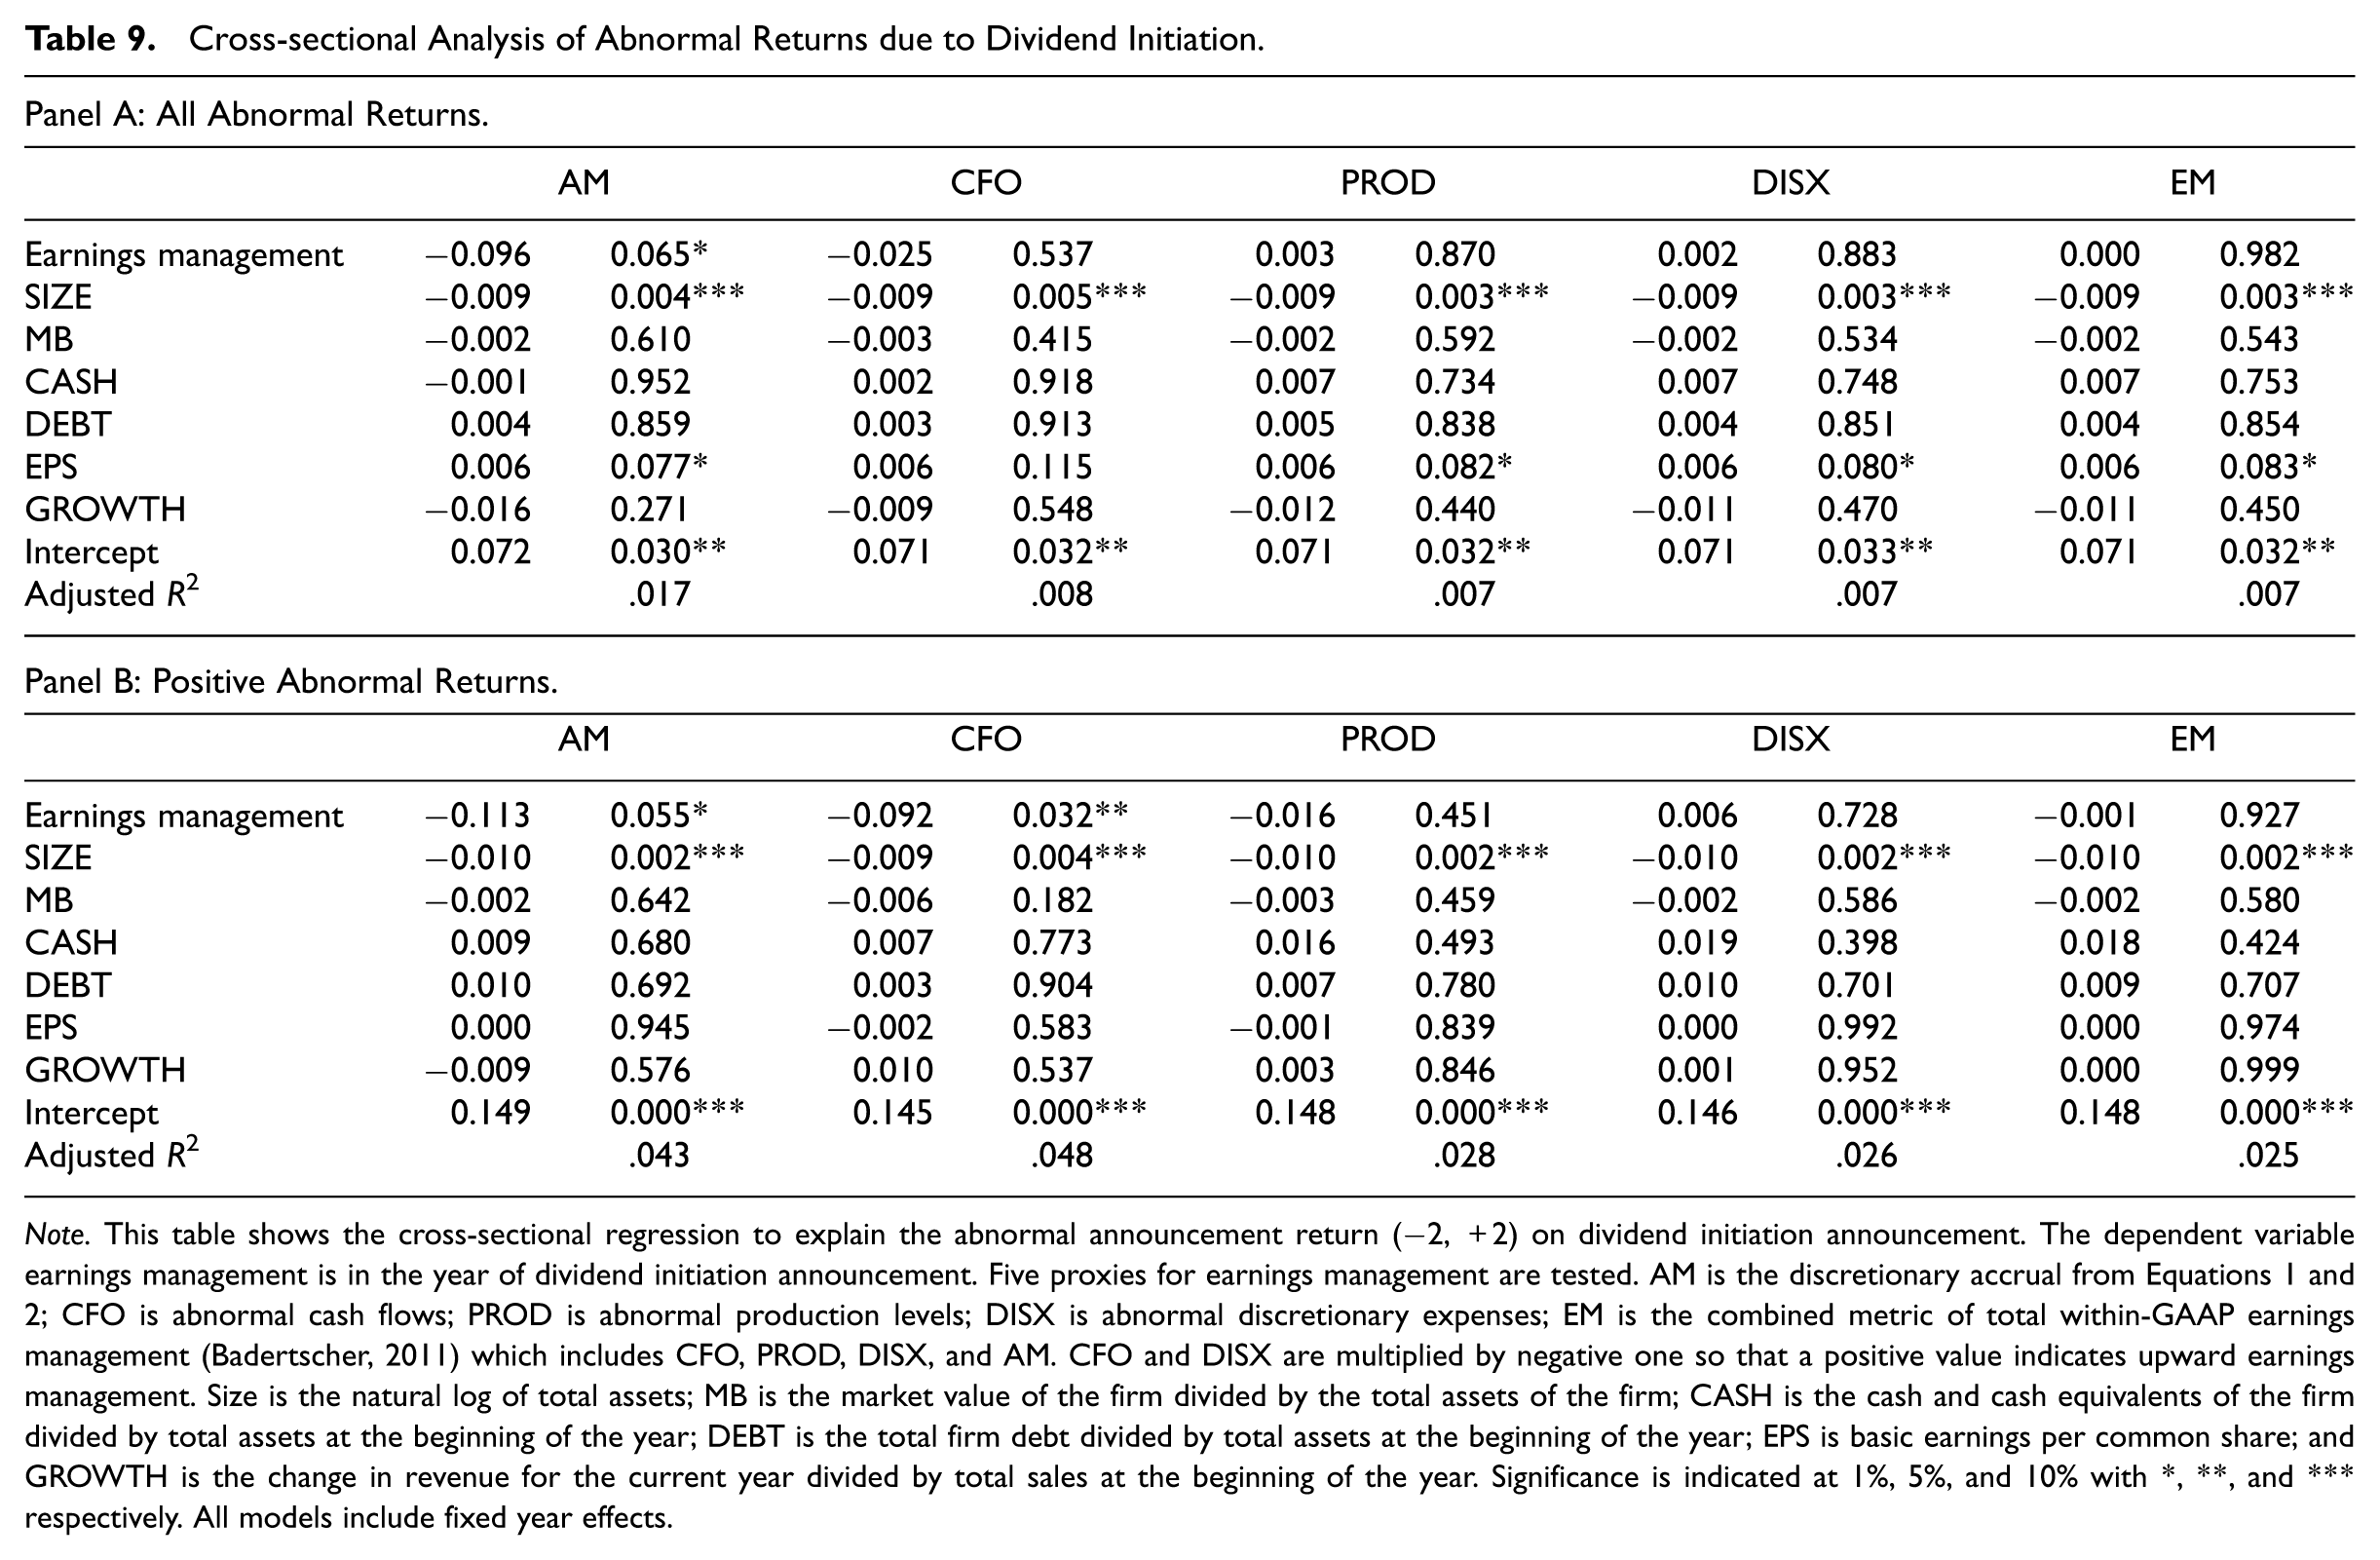
Note. This table shows the cross-sectional regression to explain the abnormal announcement return (−2, +2) on dividend initiation announcement. The dependent variable earnings management is in the year of dividend initiation announcement. Five proxies for earnings management are tested. AM is the discretionary accrual from Equations 1 and 2; CFO is abnormal cash flows; PROD is abnormal production levels; DISX is abnormal discretionary expenses; EM is the combined metric of total within-GAAP earnings management (Badertscher, 2011) which includes CFO, PROD, DISX, and AM. CFO and DISX are multiplied by negative one so that a positive value indicates upward earnings management. Size is the natural log of total assets; MB is the market value of the firm divided by the total assets of the firm; CASH is the cash and cash equivalents of the firm divided by total assets at the beginning of the year; DEBT is the total firm debt divided by total assets at the beginning of the year; EPS is basic earnings per common share; and GROWTH is the change in revenue for the current year divided by total sales at the beginning of the year. Significance is indicated at 1%, 5%, and 10% with *, **, and *** respectively. All models include fixed year effects.
Conclusion
This study examines a sample of 423 dividend initiators to evaluate earnings management in a free cash flow (agency) and signaling framework. We hypothesize that if earnings are managed near dividend initiation, the signaling theory suggests that earnings will be managed up as a confirmatory signal regarding future prospects. However, the agency/free cash flow theory suggests that earnings will be managed down as additional support to managerial efforts to contain agency problems. Our findings support the free cash flow/agency theory. The results of our real earnings management analysis of initiating firms show that there is significant downward real earnings management leading up to and including the year of initiation. Specifically, firms that initiate dividends manage cash flows from operations and production to establish earnings reserves prior to releasing cash to shareholders.
Overspending on discretionary expenses manages earnings downward, but it also reduces cash. We find that dividend initiating firms do not have significantly abnormal discretionary expenditures (SG&A, advertising, and R&D costs). This finding is a sharp contrast to a recent research sample for which the motivation was to reduce reported earnings (Francis et al., 2016). We suggest that this points to the motivation of dividend initiating firms’ use of downward real activities management to lend credibility to their implicit commitment of reducing agency problems while maintaining financial flexibility to pay future dividends.
Prior literature documents that firms manage earnings upward when they increase dividends as a coordinated signal to the market (Koerniadi & Tourani-Rad, 2011; Subramanyam, 1996). If dividend initiation and dividend increases have the same agency ramifications, we expect that there would be a similar pattern of earnings management. To evaluate the combined impact of accrual and real earnings management, we follow Badertscher (2011) and calculate a proxy, EM, to incorporate the total within-GAAP earnings management. We test the total within-GAAP earnings management of both initiators and increasers through real activities and accrual management. We document that while dividend increasers manage earnings upward, dividend initiators manage earnings downward with a similar magnitude.
Dividend increasers achieve higher reported earnings with positive abnormal accruals, overproduction, and lower discretionary expenses. In contrast, dividend initiators take in more cash than the market would expect based on their income statement by using real activities management of cash flows from operations and restricting production levels, consistent with sales manipulation of revenue timing, pricing, credit requirements, or inventory levels. In summary, dividend increasers and dividend initiators follow very different reporting strategies.
We also examine market reaction to dividend initiation announcements, and we document a significant, positive return for the event of dividend initiation. Although signaling implies that the market would respond favorably to upward earnings management as in prior literature, initiating firms are priced significantly higher on announcement day when their earnings are managed downward. This provides further evidence that initiating firms are not signaling.
This research is, to the best of our knowledge, the first evidence of real earnings management surrounding dividend initiation and the first research examining the motivation and effects of both methods. Although Chen et al. (2007) examined accrual quality in the months surrounding dividend initiation, we test immediate repricing by the market on dividend announcement, which allows us to conclude that earnings are not managed upward as a signal for initiating firms as compared with firms that increased existing dividends. Subramanyam’s (1996) research uses changes in recurring dividends, which have different governance characteristics than dividend initiation.
Overall, our findings support that the agency effects of the free cash flow theory are prevalent as nonpaying firms establish a quasi contract to return funds to shareholders. We suggest that initiating firms are primarily using earnings management to create earnings reserves, maintain financial flexibility, and reduce shareholder expectations for the magnitude and imminence of dividend initiation. We further show that dividend increasing firms have a similar, cumulative magnitude of earnings management in the opposite direction. This should be of interest to investors because, to the extent that real earnings management activities do not reverse, they represent a cost to investors for the agency realignment as firms commit to a recurring dividend payout.
Footnotes
Acknowledgements
The authors gratefully acknowledge the comments and suggestions from Bharat Sarath (editor), Siva Nathan (associate editor), and two anonymous referees. The authors also thank the participants at the 2013 American Accounting Association Meeting (AAA) and the 2015 Financial Management Association (FMA) conference. Anita Pennathur acknowledges support from O’Maley and the Stone Initiative.
Authors’ Note
Any errors herein are the responsibility of the authors.
Declaration of Conflicting Interests
The author(s) declared no potential conflicts of interest with respect to the research, authorship, and/or publication of this article.
Funding
The author(s) received no financial support for the research, authorship, and/or publication of this article.