
Abstract
In this study, we examine whether banks’ use of the loan loss provision (LLP) to manage earnings is associated with (a) the extent to which banks hold assets subject to fair value reporting and (b) the use of an industry specialist auditor. We find that banks with a greater proportion of assets subject to fair value reporting (i.e., higher fair value exposure) use less LLP-based earnings management but more transaction-based earnings management (i.e., earnings management achieved by timing the realization of gains/losses). We also find that banks engaging industry specialist auditors use less LLP-based earnings management. Our findings suggest that banks’ use of the LLP to manage earnings is more limited when they have access to alternative earnings management tools and when they engage an auditor with more industry knowledge. Our results should be informative to regulators, members of the banking industry, and academics interested in the earnings management behavior of banks.
Introduction
One of the main ways that banks achieve smooth earnings streams is by exercising discretion over the loan loss provision (LLP), which we refer to as LLP-based earnings management. LLP-based earnings management can be costly because it can attract regulatory attention (Liu & Ryan, 2006; U.S. General Accounting Office [U.S. GAO], 1994). Prior research finds that banks rely less on the LLP to manage earnings when they have alternative earnings management tools. In this article, we hypothesize that bank holdings of financial assets exposed to fluctuations in fair value facilitate the use of realized gains and losses to manage earnings, allowing banks to escape the regulatory scrutiny associated with LLP-based earnings management. We examine whether the extent to which banks use LLP-based earnings management is reduced when they can engage in the sale of financial assets subject to fair value reporting. 1 We also examine how banks trade off LLP-based earnings management with discretion over the timing of realized gains and losses on the sale of investments, which we refer to as transaction-based earnings management. Finally, because prior research finds that auditor industry specialization mitigates accrual-based earnings management (Balsam, Krishnan, & Yang, 2003) and clients with higher quality auditors may engage in more transaction-based earnings management (Chi, Lisic, & Pevzner, 2011), we examine the association between auditor specialization, LLP-based earnings management, and fair value exposure.
We focus on the banking industry because of the critical role that banks play in the economy and, more importantly, because of concerns about the financial reporting quality (and ultimate viability) of banks. Prior research suggests that managers in the banking industry use the increased flexibility allowed under fair value rules to make self-serving choices, which reduces the quality of accounting information (Dechow, Myers, & Shakespeare, 2010; Dechow & Shakespeare, 2009; Kilic, Lobo, Ranasinghe, & Sivaramakrishnan, 2013). 2 We posit that their ability to use transaction-based earnings management depends, in part, on the extent to which banks hold assets exposed to fair value changes. Providing evidence on the association between bank exposure to fair values and the use of discretion in the LLP is our first contribution.
We follow Nissim & Penman (2007), Khan (2014), and Xie (2016), and measure fair value exposure as the proportion of the assets and liabilities reported at fair value. 3 We posit that banks with a high proportion of their assets and liabilities subjected to fair value reporting have additional flexibility in managing earnings through realized gains or losses, so we examine whether the level of exposure to fair value is associated with the form of earnings management chosen. Specifically, we examine the extent to which exposure to fair value influences management discretion in estimating the LLP to smooth earnings.
The banking industry also provides a unique context in which to study the effects of auditor specialization because of the complexity of transactions and the extensive accounting and auditing knowledge required to audit banks (American Institute of CPAs, 2003, 2012). In addition, examining the role of auditors in the banking industry is important because of recent concerns about the auditing of fair values (e.g., Bratten, Gaynor, McDaniel, Montague, & Sierra, 2013). We expect auditor specialization to reduce LLP-based earnings management, especially for banks that rely mostly on LLP-based earnings management to smooth their earnings because these banks have less opportunity to use transaction-based earnings management tools. Providing evidence that the extent to which auditor specialization mitigates LLP-based earnings management is associated with the extent of bank exposure to fair value reporting is our second contribution.
We report three main findings: First, we find that our proxy for earnings management flexibility (hereafter, fair value exposure) is negatively associated with the use of the discretionary portion of the LLP to smooth earnings. Second, banks with more fair value exposure exhibit a greater trade-off between LLP-based earnings management and transaction-based earnings management. Finally, auditor specialization is negatively associated with the use of the LLP to smooth earnings, and this association is decreasing in fair value exposure.
Collectively, we extend the prior literature by providing insights about how banks manage earnings using the LLP depending on the availability of alternative earnings management tools, and whether they are audited by industry specialist auditors. Our findings should be of interest to researchers, regulators, and standard setters because they provide evidence that assets reported at fair value present opportunities for transaction-based earnings management and, thus, strategic behavior. In addition, we complement prior research examining the role of auditors in the banking industry by providing evidence that industry specialist auditors mitigate accrual-based earnings management. Our findings on the role of auditors should also be of interest to auditing regulators as they consider ways to increase audit quality in the banking sector because they suggest that auditor industry specialization is one such alternative.
Prior Research and Development of Hypotheses
Earnings Smoothing in the Banking Industry
Prior research posits that managers prefer smooth earnings streams for several reasons (Collins, Shackelford, & Wahlen, 1995; Liu & Ryan, 2006; Myers, Myers, & Skinner, 2007): First, managers may believe that investors require a higher risk premium when earnings are volatile (Erickson, Hewitt, & Maines, 2017; Graham, Harvey, & Rajgopal, 2005). 4 Second, managers can increase their compensation by reporting smoother earnings (Cheng, Warfield, & Ye, 2011; Joyce, 1996; Ramanna & Watts, 2012). Third, smoother earnings improve access to external financing (Barth, Landsman, & Wahlen, 1995; Kanagaretnam, Lobo, & Mathieu, 2004), and events expected to increase bank volatility are associated with negative returns (A. Beatty, Chamberlain, & Magliolo, 1996).
The LLP is the largest and most salient accrual for banks, and hence, most prior research on earnings management in the banking industry focuses primarily on the LLP. 5 Under the incurred loss model (which was in place throughout our sample period), the LLP reflects managers’ current estimates of the noncollectability of loans that will be realized in the future when borrowers are unable to make loan payments, so estimation of the LLP relies extensively on the judgment of managers. 6 When earnings absent the discretionary choices of management (hereafter, “premanaged earnings”) are expected to be high, managers can use their discretion to overstate the LLP, resulting in lower reported earnings. Similarly, when premanaged earnings are expected to be low, managers can understate the LLP, resulting in higher reported earnings.
Barth, Gomez-Biscarri, Kasznik, & López-Espinosa (2017) find that banks use realized gains and losses to smooth earnings, that the extent of earnings smoothing using realized gains and losses is positively associated with unrealized gains and losses on available-for-sale (AFS) securities, and that smoothing reduces earnings quality. In contrast, our study focuses on banks’ use of the LLP to smooth earnings, and whether this is affected by the extent to which banks hold alternative financial assets that they can use to smooth earnings, or by whether the bank is audited by an industry specialist auditor.
Regulation and Earnings Management in Banks
Managers may not prefer to use the LLP to manage earnings because of the potential for regulatory intervention associated with managing earnings through the LLP. Subsequent to early studies examining earnings smoothing, two major regulatory interventions have affected the extent to which bank managers can use the LLP to manage earnings: First, the Federal Deposit Insurance Corporation Improvement Act of 1991 (Senate 1991) required managers of financial institutions with assets greater than US$500 million (increased to US$1 billion in 2005) to issue a report on the effectiveness of internal controls over financial reporting. This Act led to improvements in internal control and financial reporting quality of affected banks. For example, Altamuro & Beatty (2010) find that FDICIA’s internal control requirements increased the validity of the LLP, improved earnings quality, and reduced the likelihood of meeting or beating earnings benchmarks. In addition, the Sarbanes–Oxley Act of 2002 (House of Representatives 2002) required banks (and other public companies) to provide auditor attestation on the effectiveness of internal controls.
Second, in response to bank attempts to engage in earnings management in the 1990s, the U.S. Securities and Exchange Commission (SEC) devotes considerable attention to how bank managers use their discretion in calculating the LLP. For example, in 1998, the SEC ordered Sun Trust Bank to trim the LLP it reported from 1994 through 1996, resulting in upward earnings restatements. In addition, the Government Accountability Office (GAO) has expressed concerns that banks are smoothing income by overstating the LLP when premanaged earnings are high (Liu & Ryan, 2006). In 2001, the SEC issued Staff Accounting Bulletin 102 which required banks to validate their estimated loan losses by comparing them with eventual charge-offs (SEC, 2001). Scrutiny of the LLP by the SEC, the GAO, and others could lead banks to find other means to smooth earnings, including transaction-based earnings management.
Furthermore, under the incurred loss model, loan types can affect earnings management. 7 For example, there is more managerial discretion associated with heterogeneous loans (e.g., commercial loans) because these loans must be individually evaluated by applying judgment about collectability. There is less discretion associated with homogeneous loans (e.g., consumer loans) because they are evaluated at the portfolio level, using statistical models based on historical losses (Liu & Ryan, 2006). Given increased regulation of financial reporting over time and the difference in discretion across loan types, we posit that bank size, regulation, and loan types are likely to affect the incentives and ability of bank managers to engage in earnings management, and thus we control for these determinants in our analyses.
The extent to which bank managers trade off the use of LLP-based and transaction-based earnings management tools is likely to depend on their relative costs and effectiveness. Moyer (1990) suggests that bank managers choose different earnings management tools, including the LLP, loan charge-offs, and securities gains and losses, depending on regulatory and political costs. Moyer (1990) does not explicitly test for a relation among the use of these three tools but reports a positive association. Although not the focus of the study, Scholes, Wilson, and Wolfson (1990) report a positive association between realized securities gains and the LLP but do not estimate the association between the discretionary components of these earnings management tools. A. Beatty, Chamberlain, & Magliolo (1995b) formally acknowledge that managers’ use of one type of earnings management tool may depend on their use of other types. They examine how the various tools jointly affect capital, tax, and earnings outcomes. Collins et al. (1995) separately examine the use of the LLP and realized gains and losses, and assess the relation between the discretionary tools by correlating regression coefficients from each earnings management tool; they find that banks use both the LLP and gains and losses to manage capital. More recently, Zang (2012) documents that in a nonbank setting, firms use less accrual-based earnings management and rely more on transaction-based earnings management when the costs of accrual-based earnings management are higher, consistent with the notion that firms trade off between earnings management tools depending on their relative costs. 8 We extend the recent literature examining the trade-off between earnings management tools by examining determinants of this trade-off and whether auditor specialization plays a role.
LLP-Based Earnings Management and Fair Value Exposure
We argue that to avoid increased regulatory scrutiny and still report smoother earnings, banks trade off LLP-based earnings management with transaction-based earnings management. We extend prior research and suggest that holding alternative financial assets exposed to changes in fair value provides banks a different set of tools to use for smoothing earnings. At the extreme, banks holding a low proportion of alternative assets have few opportunities to smooth earnings and rely primarily on the LLP. Given regulatory and potential auditor scrutiny of the LLP, these banks may not be able to make substantial smoothing adjustments. In contrast, banks holding a high proportion of these assets can use different smoothing mechanisms.
Holding more financial assets exposed to changes in fair value presents a different set of opportunities for banks to smooth earnings, but the direction of the association between this exposure and the LLP is an empirical question. For example, banks with significant trading activities can generate income through these activities, which may lead to less reliance on the LLP. Alternatively, unexpected fair value fluctuations in assets classified as trading securities may lead banks with significant trading activities to rely more on the LLP to smooth earnings. To the extent that banks hold more financial assets that are marked-to-market but with fair value changes not yet affecting income (such as AFS securities), they have more options to manage earnings (e.g., a greater variety of investments to sell and flexibility in the timing of these sales). Barth et al. (2017) find that higher levels of unrealized gains in AFS portfolios are associated with the increased use of realized gains and losses from these securities to smooth income and avoid losses. Holding securities classified as “held-to-maturity” could influence the use of LLP-based earnings management because the income from these securities could reduce volatility, and ultimately the need for certain banks to manage earnings. 9 Even the presence of securities such as mortgage-backed securities suggests that banks have different opportunities beyond the LLP to manage earnings, but potentially more earnings volatility, increasing the need to smooth earnings. Kilic et al. (2013) find that banks which experience higher earnings fluctuations under Statement of Financial Accounting Standards (SFAS) 133 rely more on the LLP to manage earnings relative to other banks. 10 Thus, banks with more assets exposed to fair value reporting could require larger or smaller adjustments to LLP-based earnings management to achieve smoother reported earnings.
These arguments lead to our first hypothesis, stated in the null:
Auditor Industry Specialization and Earnings Smoothing
Prior research suggests that auditors specialize to differentiate themselves from their competitors (Dunn & Mayhew, 2004). Auditors can specialize by investing in technology or personnel with industry-specific knowledge, and by capturing and sharing this knowledge with others in the audit firm. The accumulation of industry-specific knowledge can improve audit quality because industry specialists can better identify and detect errors or misstatements (Owhoso, Messier, & Lynch, 2002; Solomon, Shields, & Whittington, 1999), and more easily comply with auditing standards (O’Keefe, King, & Gaver, 1994). 11 Prior research also finds that clients of industry specialist auditors are less likely to be the targets of SEC Enforcement Actions (Carcello & Nagy, 2004), have lower discretionary accruals and higher earnings response coefficients (Balsam et al., 2003; Chen, Chen, Lobo, & Wang, 2011; Gul, Fung, & Jaggi, 2009; Lim & Tan, 2008; Mascarenhas, Cahan, & Naiker, 2010; Reichelt & Wang, 2010), make more conservative accounting choices (Krishnan, 2005; Lim & Tan, 2009), and are less likely to meet or just beat earnings targets (Gul et al., 2009; Lim & Tan, 2008).
Prior research examines the role of professional skepticism and auditors’ response to increased risk of material misstatements (see Hurtt, Brown-Liburd, Early, & Krishnamoorthy, 2013, for a recent review). In addition, the PCAOB states that “the allowance for loan losses is one of the most significant estimates made by many issuers in the financial services industry,” and “If auditors do not properly test issuers’ estimates of the ALL (allowance for loan losses), auditors might fail to detect material misstatements in issuers’ financial statements relating to loan portfolio values, and investors might be misled” (Public Company Accounting Oversight Board [PCAOB], 2010). The PCAOB also recommends that auditors consider management incentives to engage in earnings management when devising an audit plan (PCAOB, 2010). Therefore, auditors should spend significant time and effort auditing the LLP, especially when incentives to manipulate the LLP are strong.
Following prior research, we expect auditor specialization to have a mitigating effect on LLP-based earnings management because industry-specific knowledge can be even more valuable in industries with complex accounting issues and in industries subject to extensive regulation (Martin, Rich, & Wilks, 2006). In an international banking setting, Kanagaretnam, Lim, and Lobo (2010) find that auditor industry specialization is negatively associated with benchmark beating and the use of income-increasing accruals. 12 Thus, we examine the role of industry specialization in mitigating earnings management among U.S. banks. Moreover, if banks with less fair value exposure rely more on the LLP to manage earnings, we expect the effect of auditor industry expertise to be more pronounced at mitigating LLP-based earnings management among these banks. 13 These arguments lead to the following two hypotheses, stated in the alternative form:
Research Methodology
Sample Composition
We construct our sample by first collecting accounting data from the Bank Holding Companies (BHC) database maintained by the Federal Reserve Bank of Chicago. This database contains data from U.S. bank holding companies that file a FR Y-9C report. 14 We limit our sample to all public banks from 2000 through 2008 available on both the BHC database and COMPUSTAT (initially 3,270 bank years). We lose 199 observations that are unavailable in Audit Analytics and 136 observations because of missing variables needed for our analyses. Our final sample consists of 2,935 bank-year observations from 2000 through 2008. The number of sample banks ranges from 271 to 383 per year.
Earnings Management Using the LLP
We follow prior research (e.g., Khan, 2014; Nissim & Penman, 2007; Xie, 2016) and measure the extent of assets and liabilities reported at fair value (FVE) as the sum of assets and liabilities recognized or disclosed at fair value divided by total assets. See the appendix for details about variable construction. 15
We measure the discretionary portion of the LLP (DLLP) following A. Beatty, Ke, & Petroni (2002) by taking the residual from the following regression (in this and all subsequent models, bank subscripts are omitted):
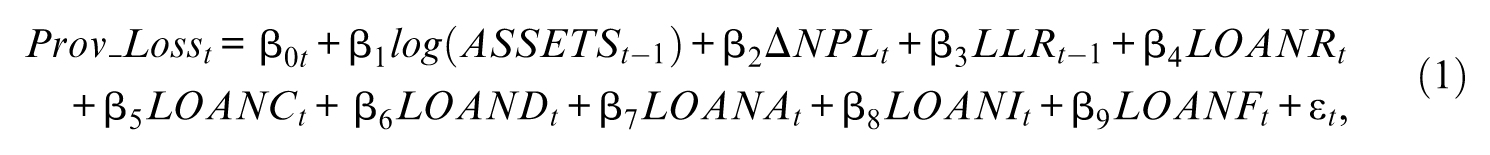
where Prov_Loss is the gross provision for loan losses (BHCK4230) scaled by the average of total loans outstanding (BHCK2122) during the year; 16 ASSETS is total assets (BHCK2170); ΔNPL is the change in nonperforming loans (BHCK5526 + BHCK5525) from the beginning to the end of the year, scaled by the average of total loans outstanding during the year; LLR is the loan loss reserve (BHCK3123) scaled by the average of total loans outstanding during the year; and LOANR, LOANC, LOAND, LOANA, LOANI, and LOANF are, respectively, the proportions of real estate (BHCK1410), commercial (BHCK1766), depository institution (BHCK5481 or BHCK1288), agricultural (BHCK1590), individual (BHCKB538 + BHCKB539 + BHCK2011), and foreign government (BHCK2081) loans to the average of total loans outstanding during the year; these are included in the model because management’s ability to estimate the provision may vary by loan type.
The results from the untabulated estimation of Model 1 are generally consistent with those in A. Beatty et al. (2002). The provision for loan losses (Prov_Loss) is increasing in bank size (ASSETS), the change in the nonperforming loans (ΔNPL), and the lagged loan loss reserve (LLR). In addition, real estate loans (LOANR), commercial and industrial loans (LOANC), and individual loans (LOANI) are positively associated with Prov_Loss, but the coefficients on the other loan types are not significantly different from 0.
To test whether the extent to which banks fair value exposure affects the use of the LLP to smooth earnings (H1), we estimate Models 2a and 2b.

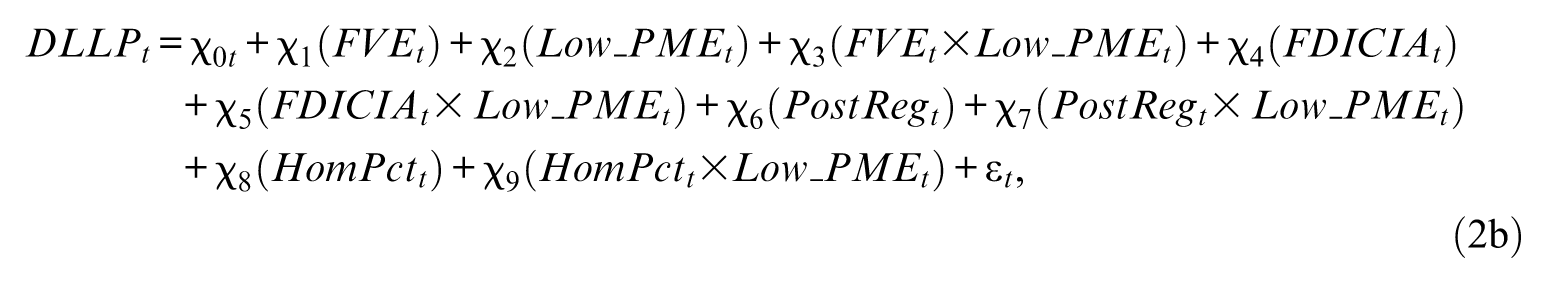
where DLLP is the discretionary LLP (i.e., the residual from Model 1) times lagged loans and scaled by lagged assets;
FVE is the proportion of assets and liabilities reported at fair value; 17 High_PME is an indicator variable set to 1 when premanaged earnings are in the top quintile of sample observations in each year, and 0 otherwise, where premanaged earnings is defined as earnings plus discretionary LLP (from Model 1 above) minus discretionary realized gains and losses (from Model 3 below); and Low_PME is an indicator variable set to 1 when premanaged earnings are in the bottom quintile of sample observations, and 0 otherwise; FDICIA is an indicator variable equal to 1 for observations with assets greater than US$500 million for fiscal years prior to 2005, and greater than US$1 billion for fiscal years in 2005 or later, 0 otherwise; PostReg is an indicator variable equal to 1 for fiscal years 2003 or later, 0 otherwise; HomPct is the percentage of homogeneous loans which includes consumer loans, family residential mortgages, loans to financial institutions, and acceptances of other banks (see Liu & Ryan, 2006).
We make no predictions about ψ1 and χ1, which capture the main effect of fair value exposure on the magnitude of the DLLP. Prior research shows that banks with high premanaged earnings smooth earnings using the LLP, so we expect a positive ψ2 in Model 2a, and banks with low premanaged earnings smooth earnings using the LLP, so we expect a negative χ2 in Model 2b. In addition, if fair value exposure is negatively associated with banks’ use of the LLP to smooth earnings, ψ3 will be negative in Model 2a and χ3 will be positive in Model 2b. However, if fair value exposure is positively associated with earnings smoothing using the LLP, ψ3 will be positive in Model 2a and χ3 will be negative in Model 2b. 18
Based on prior discussion about the effects of regulation on earnings management incentives, we explicitly incorporate variables that control for bank size (FDICIA), regulatory period (PostReg), and the percentage of homogeneous loans (HomPct). We interact each of these variables with High_PME and Low_PME to control for their incremental effects. 19
Earnings Management Using Realized Gains and Losses
Managers can also smooth earnings using realized gains and losses from the sales of investment securities. To estimate the extent of management’s discretion over reported gains and losses, we adopt the model of A. Beatty and Harris (1998) and A. Beatty et al. (2002), where realized securities gains and losses are a function of assets and unrealized gains and losses 20 :

where RSGL is the level of realized gains and losses recorded in year t scaled by assets at the beginning of year t; ASSETS is as previously defined; and UNGL is the level of unrealized gains and losses at the beginning of year t scaled by assets at the beginning of year t.
Following A. Beatty et al. (2002), the residual from Model 3 represents the “discretionary” component, and captures the portion of the realized gain or loss that cannot be explained by bank size and amortized cost. This is our measure of transaction-based earnings management. Results from the untabulated estimation of Model 3 are generally consistent with those of A. Beatty et al. (2002), and the coefficient on UNGL is positive and significant.
The Trade-Off Between the LLP and Realized Gains and Losses
We also test whether the trade-off between LLP-based and transaction-based earnings management differs depending on fair value exposure by estimating the following models:
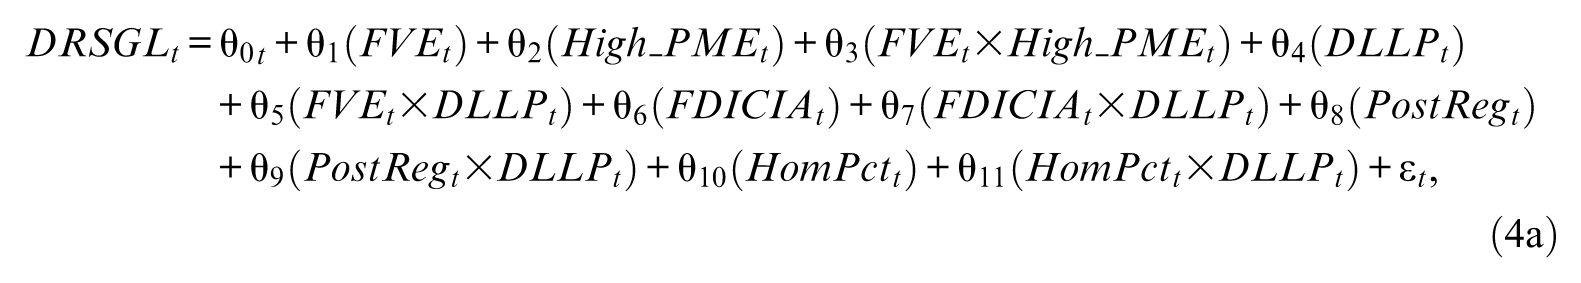

where DRSGL is the discretionary realized gains and losses (i.e., the residual from Model 3) scaled by lagged assets; and all other variables are as previously defined.
Unlike Models 2a and 2b, here we do not focus on smoothing high or low premanaged earnings (although we control for smoothing incentives). Instead, we focus on the trade-off between LLP-based and transaction-based earnings management because banks can use these tools as complements or as substitutes. If banks trade off discretion in estimating the LLP with discretion in reporting realized gains and losses, then realized gains will be high (low) when the DLLP is high (low), so θ4 and λ4 will be positive. More importantly, if fair value exposure is positively associated with the trade-off because banks with more fair value exposure have more opportunities for transaction-based earnings management, then θ5 and λ5 will be positive. 21
The Influence of Auditor Industry Specialization
Next, we consider the influence of auditor specialization on the discretionary accounting choices made by banks (H2) and the influence of the extent of bank assets held at fair value on this association (H3). We follow Balsam et al. (2003) and Kanagaretnam, Krishnan, & Lobo (2009), and identify the industry specialist as the audit firm that audits the largest number of clients in the banking industry. To test H2 and H3, we augment Models 2a and 2b, and estimate the following models:
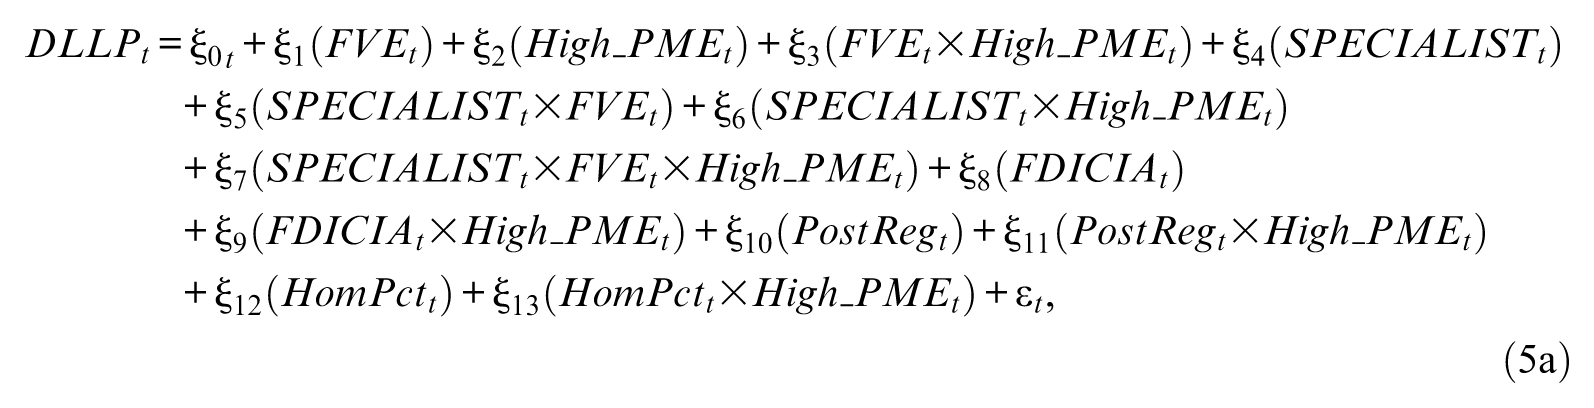
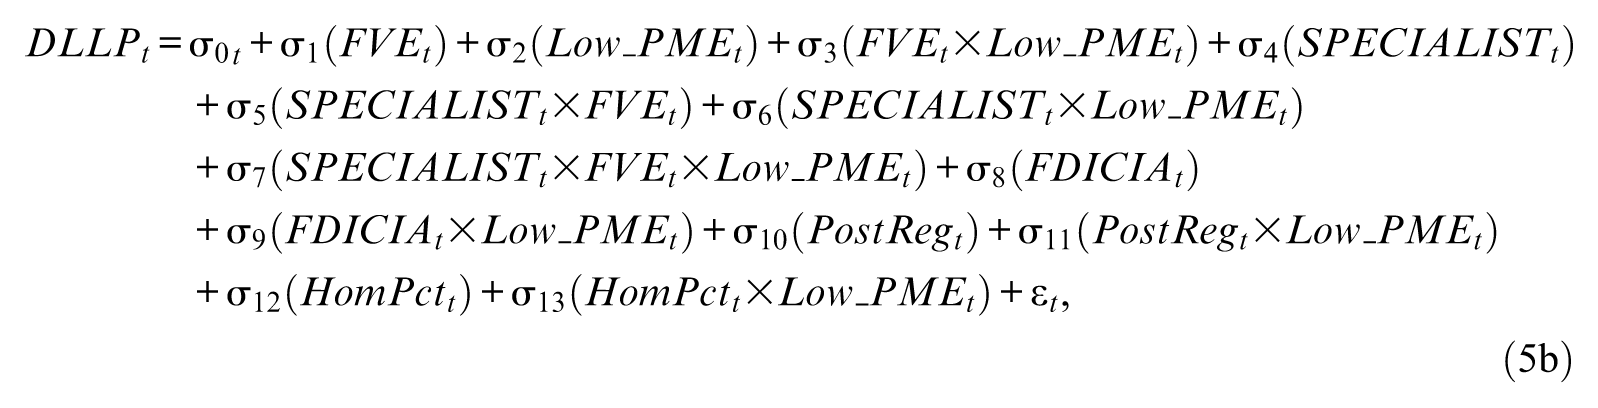
where SPECIALIST is an indicator variable set to 1 when the auditor is the industry specialist based on annual market share of clients audited (so, consistent with Kanagaretnam et al., 2009, KPMG is the industry specialist in all sample years); and all other variables are as previously defined.
If (as predicted by H2) industry specialist auditors constrain the ability of banks to use the LLP to smooth earnings, then ξ6 will be negative in Model 5a and σ6 will be positive in Model 5b. In addition, if (as predicted by H3) auditor industry specialization mitigates the discretionary use of the LLP to a lesser extent as fair value exposure increases, then ξ7 will be positive in Model 5a and σ7 will be negative in Model 5b.
An important consideration when examining the effect of engaging an industry specialist auditor is the ability to attribute that effect to the industry specialist. Because the specialist auditor in this industry audits more than 40% of the banks audited by all Big N auditors, there is a high correlation between SPECIALIST and the use of a Big N auditor. 22 We address this by estimating Models 5a and 5b with and without controls for the other Big N audit firms, and by separately examining a subsample of banks audited only by Big N audit firms.
Descriptive Statistics
Table 1, Panel A, reports descriptive statistics for the banks in our sample. Overall, our sample banks are larger than those observed in A. Beatty et al. (2002), who report a mean of US$5.1 billion for public banks but are slightly smaller than those in Ettredge, Xu, & Yi (2014), who report median logged assets of 14.59 (vs. our median of 14.20). Bank profitability (ROA), with mean and median income of approximately 1% of assets, is comparable with that in A. Beatty et al. (2002), with a mean of 1.1% for public banks. The mean and median of sample banks’ exposure to fair values (FVE) are both approximately 0.20, so 20% of sample banks’ assets and liabilities are reported at fair value on average. Across our full sample, approximately 23% of banks are audited by the industry specialist auditor.
Descriptive Statistics.

Note. Panel A provides descriptive statistics for the full sample. Panel B presents mean and median values separately for each quartile of FVE. Variable definitions are provided in the appendix.
In Panel B, we partition the sample into quartiles of FVE, and report mean and median values for each quartile. By construction, the proportion of assets and liabilities reported at fair value is increasing across the quartiles, from a mean (median) of 9.4% (10.1%) of assets for banks in the bottom quartile to 39.4% (36.6%) of assets in the top quartile. We also find that bank size is increasing across the FVE quartiles, but it is not monotonic for the mean of assets. Although the percentage of homogeneous loans is increasing across the quartiles, from a mean of 29.9% in the bottom quartile to a mean of 39.1% in the top quartile, premanaged ROA is approximately 1% of assets in each quartile. Finally, we find an increase in the proportion of banks audited by the specialist auditor as FVE increases, from 14.9% in the bottom quartile to 30.6% in the top quartile.
We present correlations in Table 2, with Pearson’s correlation coefficients below the diagonal and Spearman’s correlation coefficients above the diagonal. Consistent with the evidence in Table 1, Panel B, FVE is positively correlated with Assets and HomPct, with correlation coefficients of .255 and .222, respectively. All other correlations with FVE are less than .200, and the Pearson correlation between FVE and SPECIALIST is only .115. DLLP and Premanaged ROA (DRSGL and Premanaged ROA) exhibit a small positive (negative), weakly consistent with the use of these tools to smooth earnings.
Correlation Table.
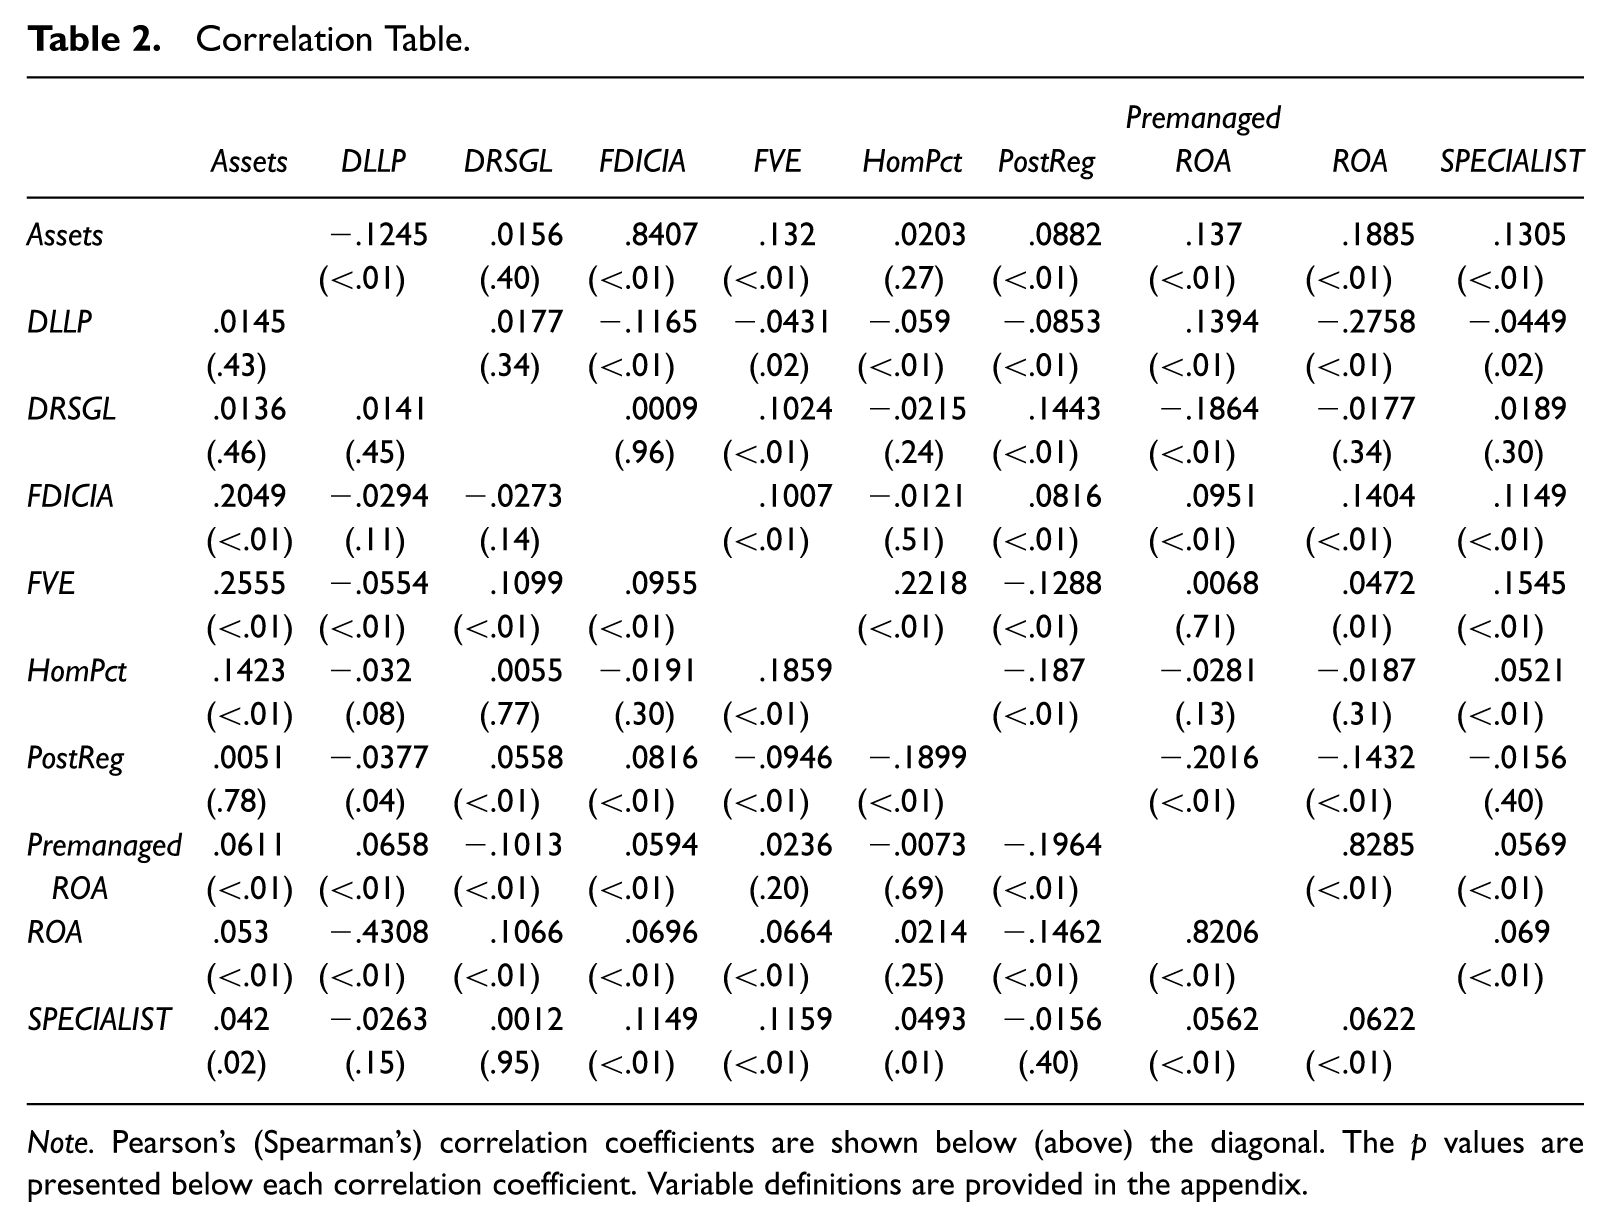
Note. Pearson’s (Spearman’s) correlation coefficients are shown below (above) the diagonal. The p values are presented below each correlation coefficient. Variable definitions are provided in the appendix.
Results
Primary Tests
In the analyses that follow, we present results separately for (a) our entire sample of banks and (b) a restricted sample in which we eliminate the middle three quintiles of premanaged earnings. We present results for the restricted sample to increase the power of our tests by comparing the behaviors of only those banks with highest and lowest premanaged earnings.
Earnings smoothing through the LLP
In Table 3, we examine whether banks’ fair value exposure is associated with LLP-based earnings smoothing. In Panel A, the coefficient on High_PME is positive and significant, suggesting that, on average, banks with high PME record larger DLLPs, presumably to reduce earnings. In addition, in Panel B, the coefficient on Low_PME is negative and significant, suggesting that, on average, banks with low PME record smaller DLLPs, presumably to boost earnings. Thus, similar to prior research, we find that banks smooth earnings using the LLP.
Earnings Management Using the Discretionary Loan Loss Provision (DLLP).

Note. See the appendix for the definition of variables. The p values are calculated using two-tailed tests.
More importantly for our study, the coefficient on FVE×High_PME is negative and significant in Panel A, suggesting that holding more assets reported at fair value is associated with lower levels of downward earnings management using the LLP. In Panel B, although the coefficient on FVE×Low_PME is not significant for the full sample, it is positive and significant for the restricted sample, suggesting a reduction in upward earnings management as FVE increases. Overall, these results allow us to reject H1, and conclude that as exposure to fair value increases, banks reduce their use of the LLP to smooth earnings. We also note that the coefficient on FDICIA×High_PME (FDICIA×Low_PME) is negative (positive) and significant, suggesting that large banks are less likely to engage in earnings management, consistent with these banks having stronger internal controls or being subject to stronger regulatory monitoring. The interactions PostReg×High_PME/Low_PME and HomPct×High_PME/Low_PME are not significant, suggesting that incentives to engage in LLP-based earnings management are not stronger in the postregulation period or for banks with a higher proportion of homogeneous loans. 23
The trade-off between using the LLP and realized gains and losses
Table 4 provides results for tests of a trade-off between discretionary use of the LLP, and discretionary use of realized gains and losses as FVE increases. In the first two columns of both Panels A and B, we exclude FVE to confirm the cross-sectional presence of a trade-off between DLLP and DRSGL. In both panels, the coefficient on DLLP is positive and significant, indicating that as the discretionary LLP increases (decreases), discretionary realized gains/losses increase (decrease), consistent with the prior literature that documents a trade-off. In the next two columns, we add FVE and its interactions. In both panels, the coefficient estimates on FVE×DLLP are positive and significant. Thus, we conclude that banks incrementally trade off between the discretionary LLP and discretionary realized gains and losses as FVE increases.
Trade-Off Between Discretionary Loan Loss Provision (DLLP) and Discretionary Realized Gains/Losses (DRSGL).
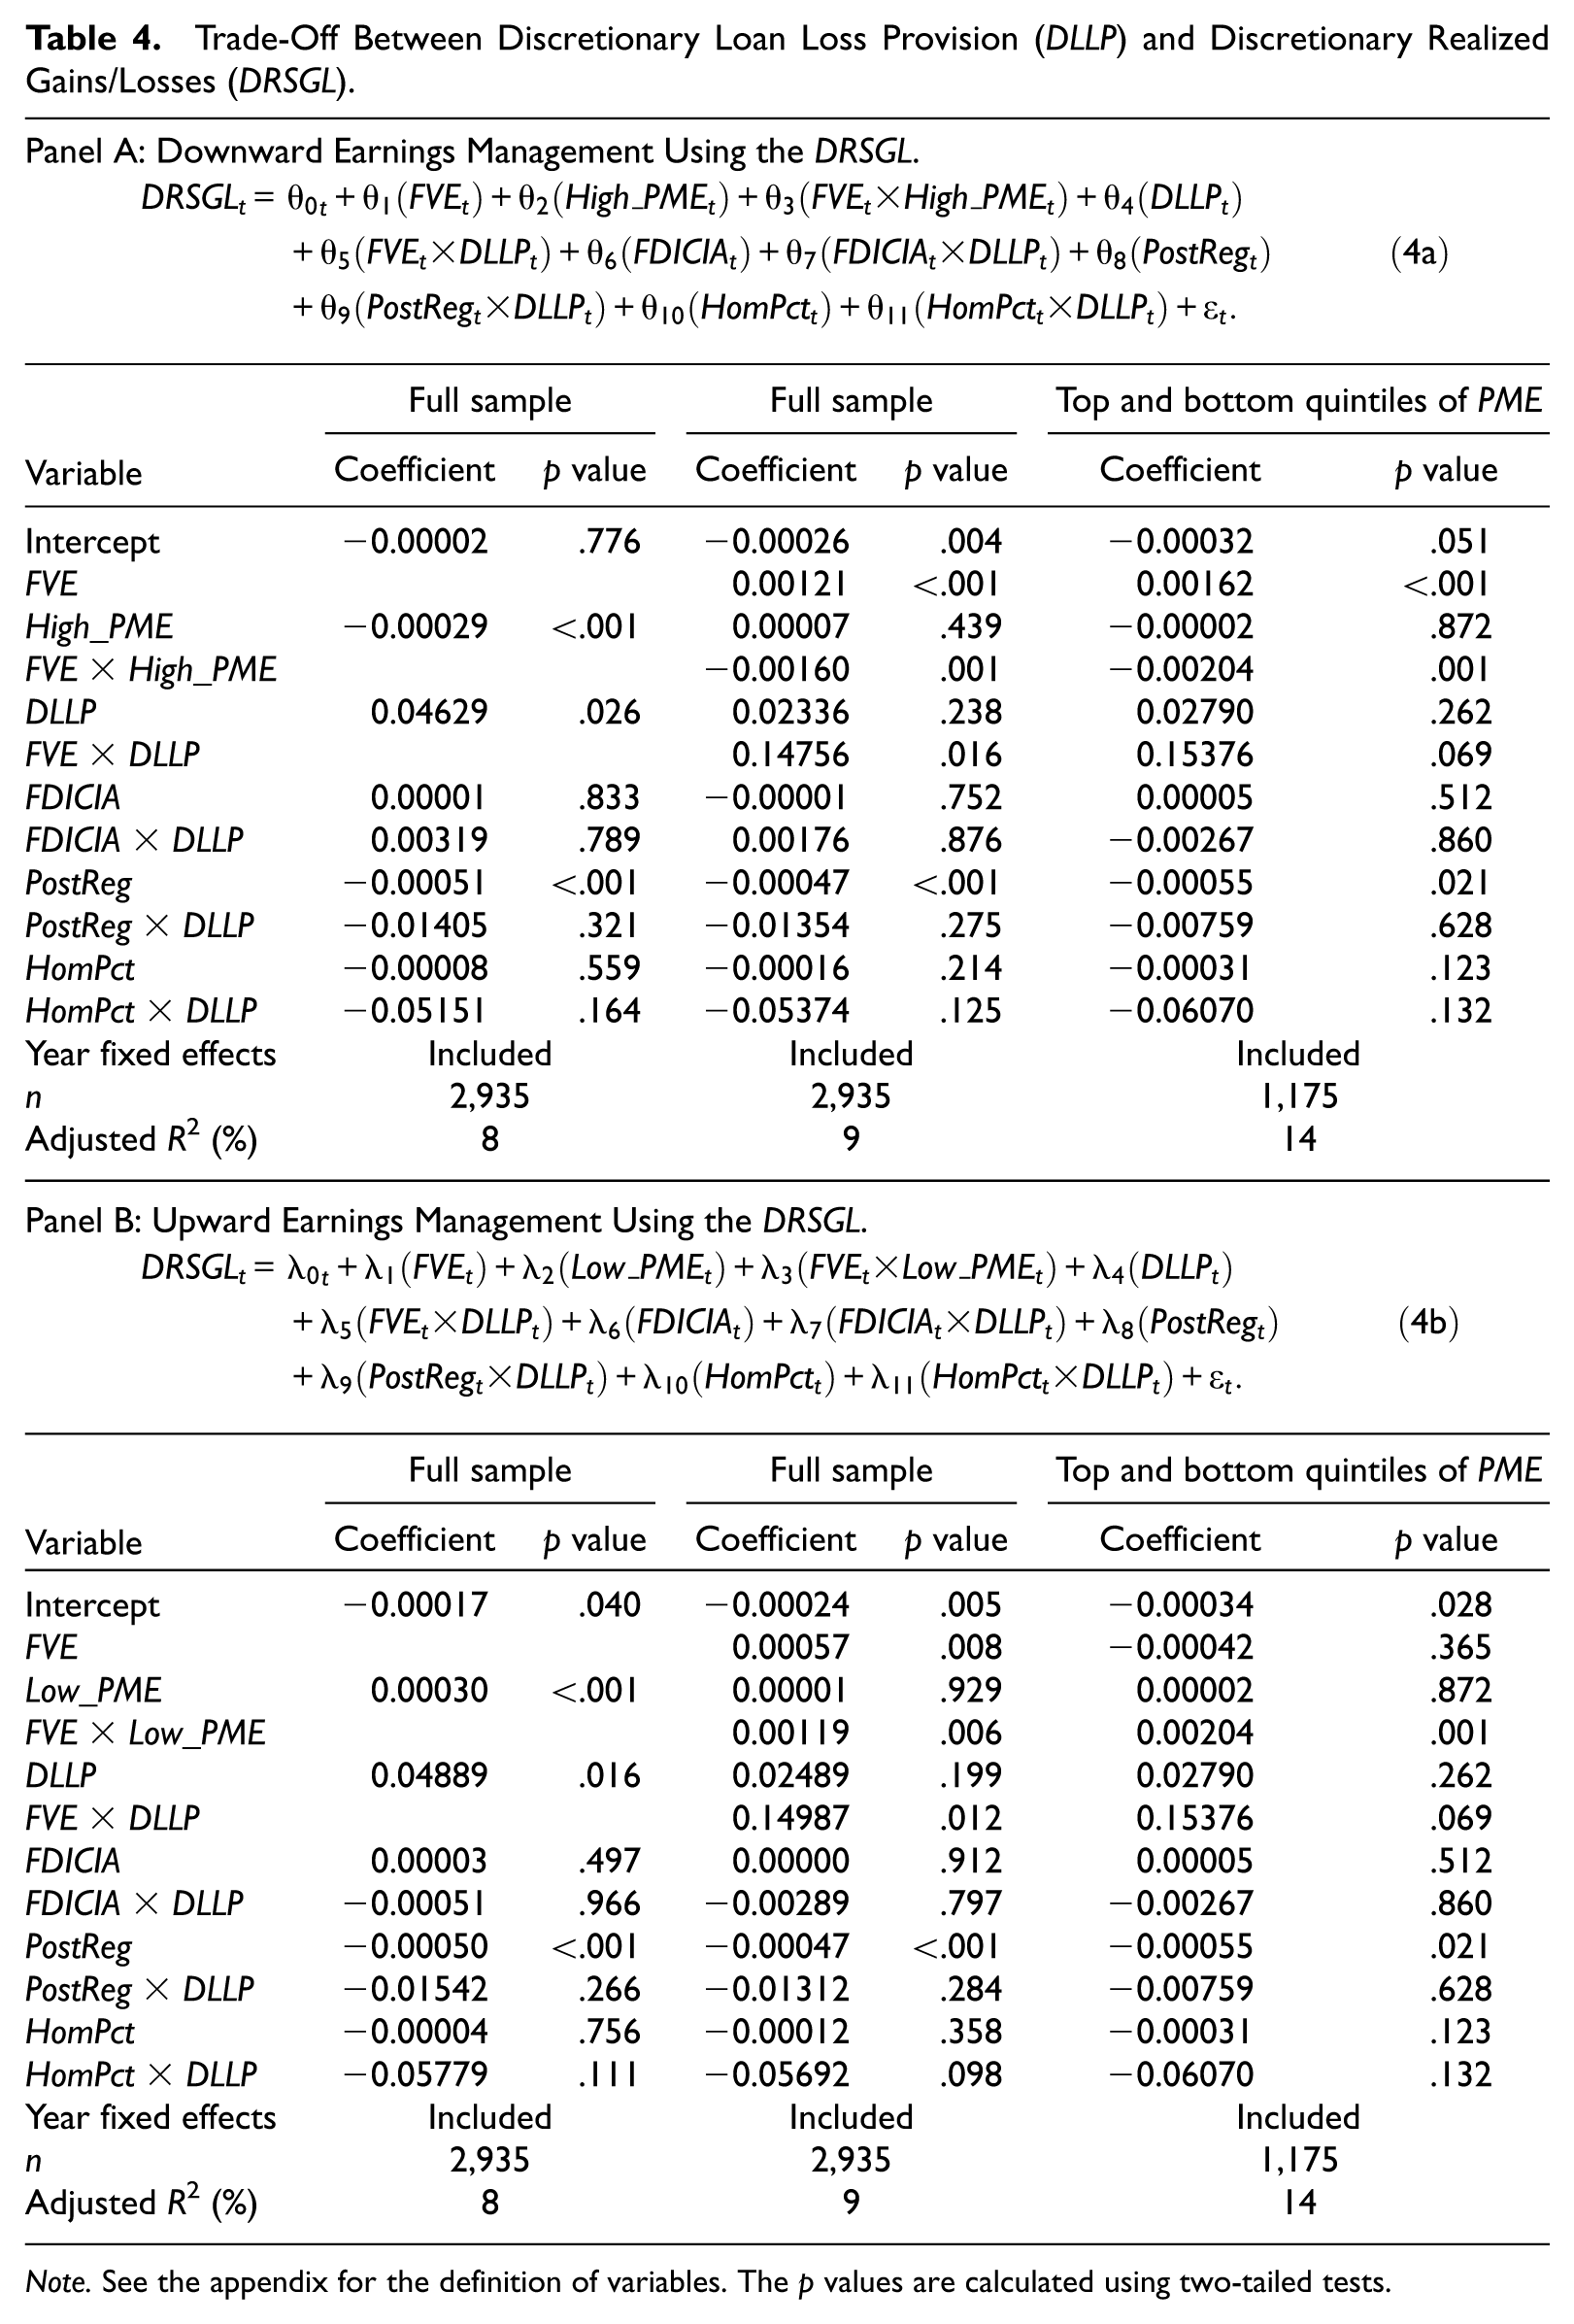
Note. See the appendix for the definition of variables. The p values are calculated using two-tailed tests.
Overall, our results suggest that the means used to manage earnings differ across banks depending on the extent of assets and liabilities reported at fair value. At first glance, these results seem to differ from those shown in Kilic et al. (2013), who find that exposure to derivatives (which may proxy for fair value exposure) is associated with an increase in LLP-based earnings management, but Kilic et al. (2013) focus solely on derivatives while we use a more comprehensive measure that incorporates several balance sheet items reported at fair value.
Auditor industry specialization and earnings smoothing through the LLP
In Table 5, we examine whether the use of an industry specialist auditor affects LLP-based earnings management. We estimate three specifications of Models 5a and 5b using both the full sample and the restricted sample. Under the first specification, as shown in the first and fourth columns, the results reveal that the use of an industry specialist auditor attenuates LLP-based earnings smoothing (i.e., the coefficient estimates on SPECIALIST×High_PME are negative and significant in Panel A, and the coefficient estimates on SPECIALIST×Low_PME are positive and significant in Panel B). The second specification, as shown in the second and fifth columns, includes controls for the Big N audit firms that are not specialists (OtherBigN). The coefficients on SPECIALIST×High_PME and on SPECIALIST×Low_PME are still significant in the predicted direction, whereas the coefficients on OtherBigN×High_PME (in Panel A) and on OtherBigN×Low_PME (in Panel B) are not significant. This suggests that other Big N audit firms do not constrain LLP-based earnings management to the same degree as specialists. Finally, we provide the third specification which restricts the sample to only clients of Big N audit firms. The results, presented in the third and sixth columns, reveal that the use of an industry specialist auditor constrains LLP-based earnings management to a greater extent than does the use of another Big N auditor. 24 Overall, we find some evidence supporting—that the use of an industry specialist auditor reduces LLP-based smoothing among banks with low exposure to fair value.
The Effect of Auditor Industry Specialization on Earnings Management Using the Discretionary Loan Loss Provision (DLLP).
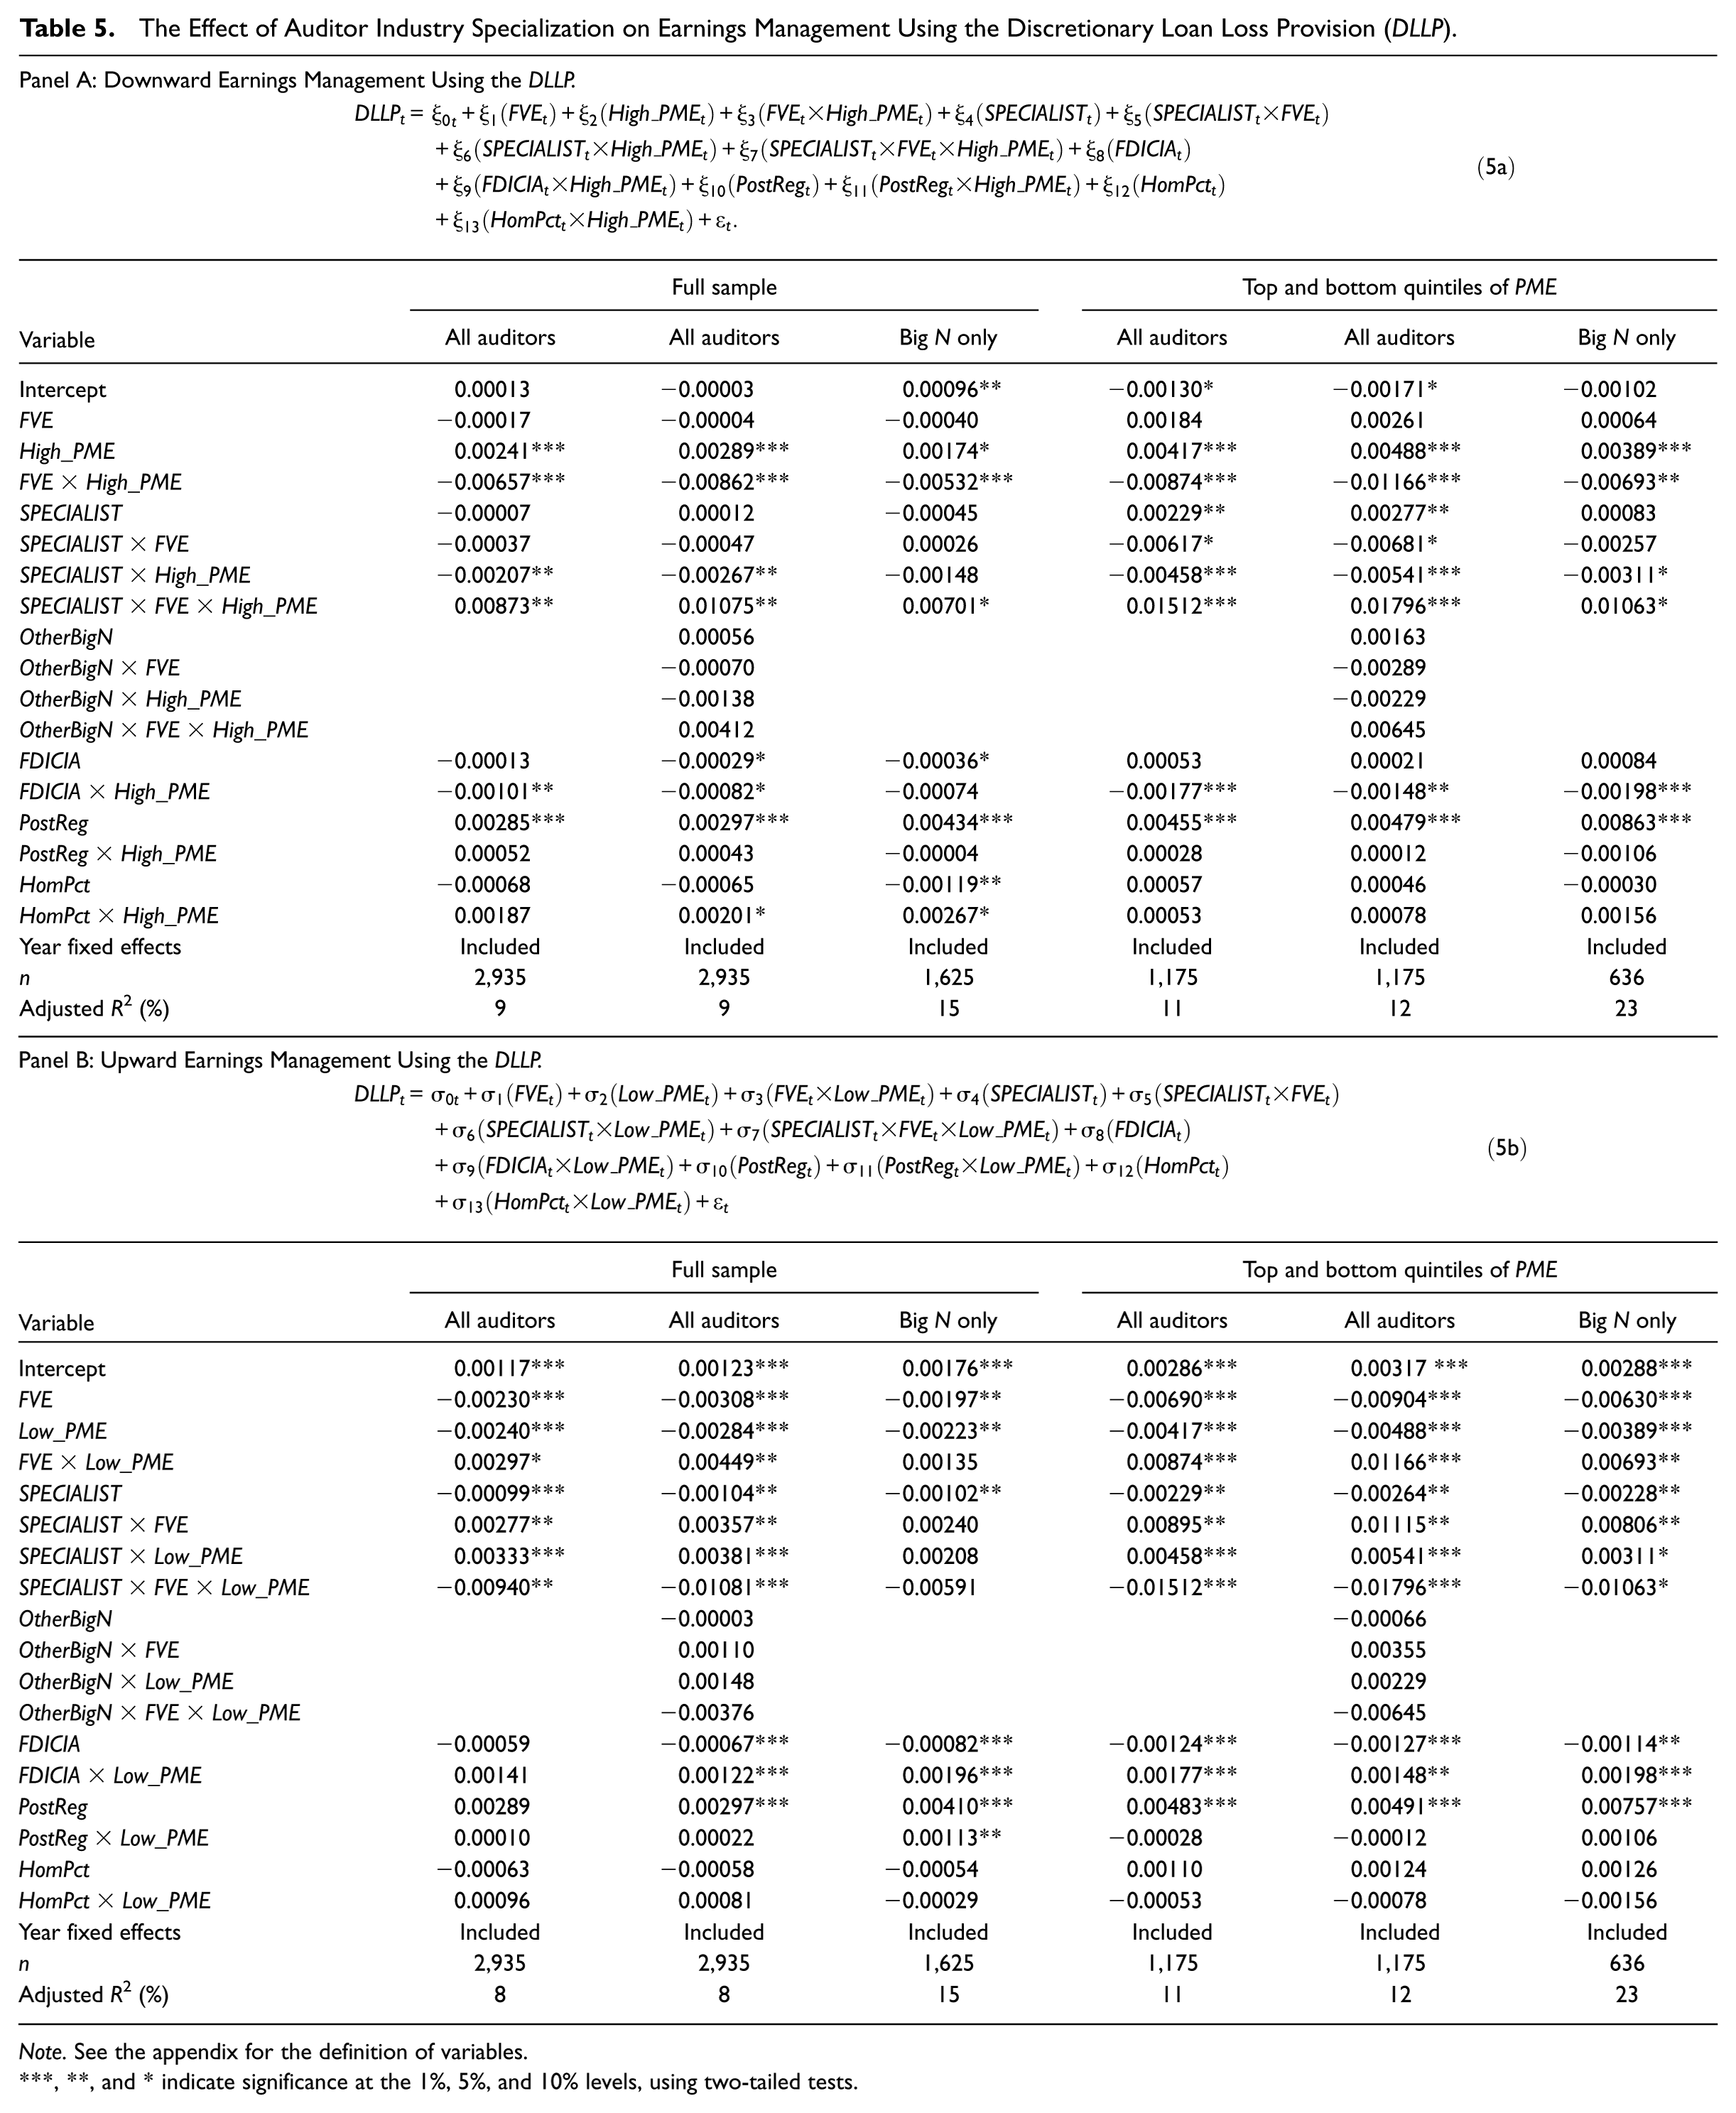
Note. See the appendix for the definition of variables.
, **, and * indicate significance at the 1%, 5%, and 10% levels, using two-tailed tests.
Table 5 confirms our earlier result that fair value exposure is negatively associated with LLP-based earnings management on average (i.e., the coefficient on FVE×High_PME is negative and significant in Panel A, and the coefficient on FVE×Low_PME is positive and significant in Panel B). This suggests that banks without much exposure to fair value use the LLP more to smooth earnings. However, this effect is attenuated when these banks are audited by industry specialist auditors (i.e., the coefficient on SPECIALIST×FVE×High_PME is positive and significant in Panel A, and the coefficient on SPECIALIST×FVE×Low_PME is negative and significant in Panel B in all specifications but one). This indicates that auditor specialization mitigates LLP-based earnings management to a greater degree among banks with low exposure to fair value. These results support H3, and suggest that the effect of auditor industry specialization in constraining LLP-based earning smoothing depends on exposure to fair value.
Additional Tests
In this section, we describe a series of additional tests: First, because we use a comprehensive measure of fair value exposure that captures many types of assets, it is unclear whether a single FVE element or the total amount is associated with a reduction in LLP-based earnings management. Thus, we decompose FVE into AFS (which is the largest component) and OTHER, and we reestimate Models 2a and 2b. Results in Table 6 reveal that both components of FVE (interacted with High_PME in Panel A and Low_PME in Panel B) contribute to the main results presented in Table 3.
Earnings Management Using the Discretionary Loan Loss Provision (DLLP) for AFS Versus Other FVE.

Note. See the appendix for the definition of variables. The p values are calculated using two-tailed tests.
Second, we consider the impact of the financial crisis on our results. Many banks, particularly those that engaged in subprime lending, were forced to write off assets, and they faced regulatory capital pressure in late 2007 and throughout 2008, leading to The Emergency Economic Stabilization Act signed into law in late 2008. It is unclear ex ante whether the discretion banks enjoyed from fair value exposure in the precrisis period was even available during the crisis period. In addition, it is unclear whether bank incentives to smooth earnings were present. Thus, we perform separate analyses using observations in the precrisis period (2000-2006) and the crisis period (2007-2008). Results in Table 7 reveal a positive and significant coefficient on High_PME (in Panel A), and a negative and significant coefficient on Low_PME (in Panel B) in both the precrisis period and the crisis period, indicating that banks used the LLP to smooth earnings in both periods. 25 We also find that fair value exposure is negatively associated with the use of LLP to smooth earnings both before and during the crisis.
Earnings Management Using the Discretionary Loan Loss Provision (DLLP) Precrisis Versus Crisis.

Note. See the appendix for the definition of variables.
, **, and * indicate significance at the 1%, 5%, and 10% levels using two-tailed tests.
Third, to determine whether our results are sensitive to the model specification, we use alternative models to estimate the discretionary LLP. Specifically, we estimate Model 1 from Liu & Ryan (2006) and the two-stage model (i.e., Models 1 and 3) from Kanagaretnam et al. (2010). In the Liu and Ryan (2006) model, X×High_ROA indicates whether highly profitable banks smooth earnings downward using the LLP. In Table 8, we find this to be the case as evidenced by the positive and significant coefficient estimate. We also augment the Liu and Ryan model by adding FVE, X×FVE, and X×FVE×High_ROA. The coefficient on the three-way interaction X×FVE×High_ROA is negative and significant, suggesting that fair value exposure is associated with less LLP-based earnings management, supporting our primary results.
Provision for Loan Losses Following the Liu & Ryan (2006) Model.
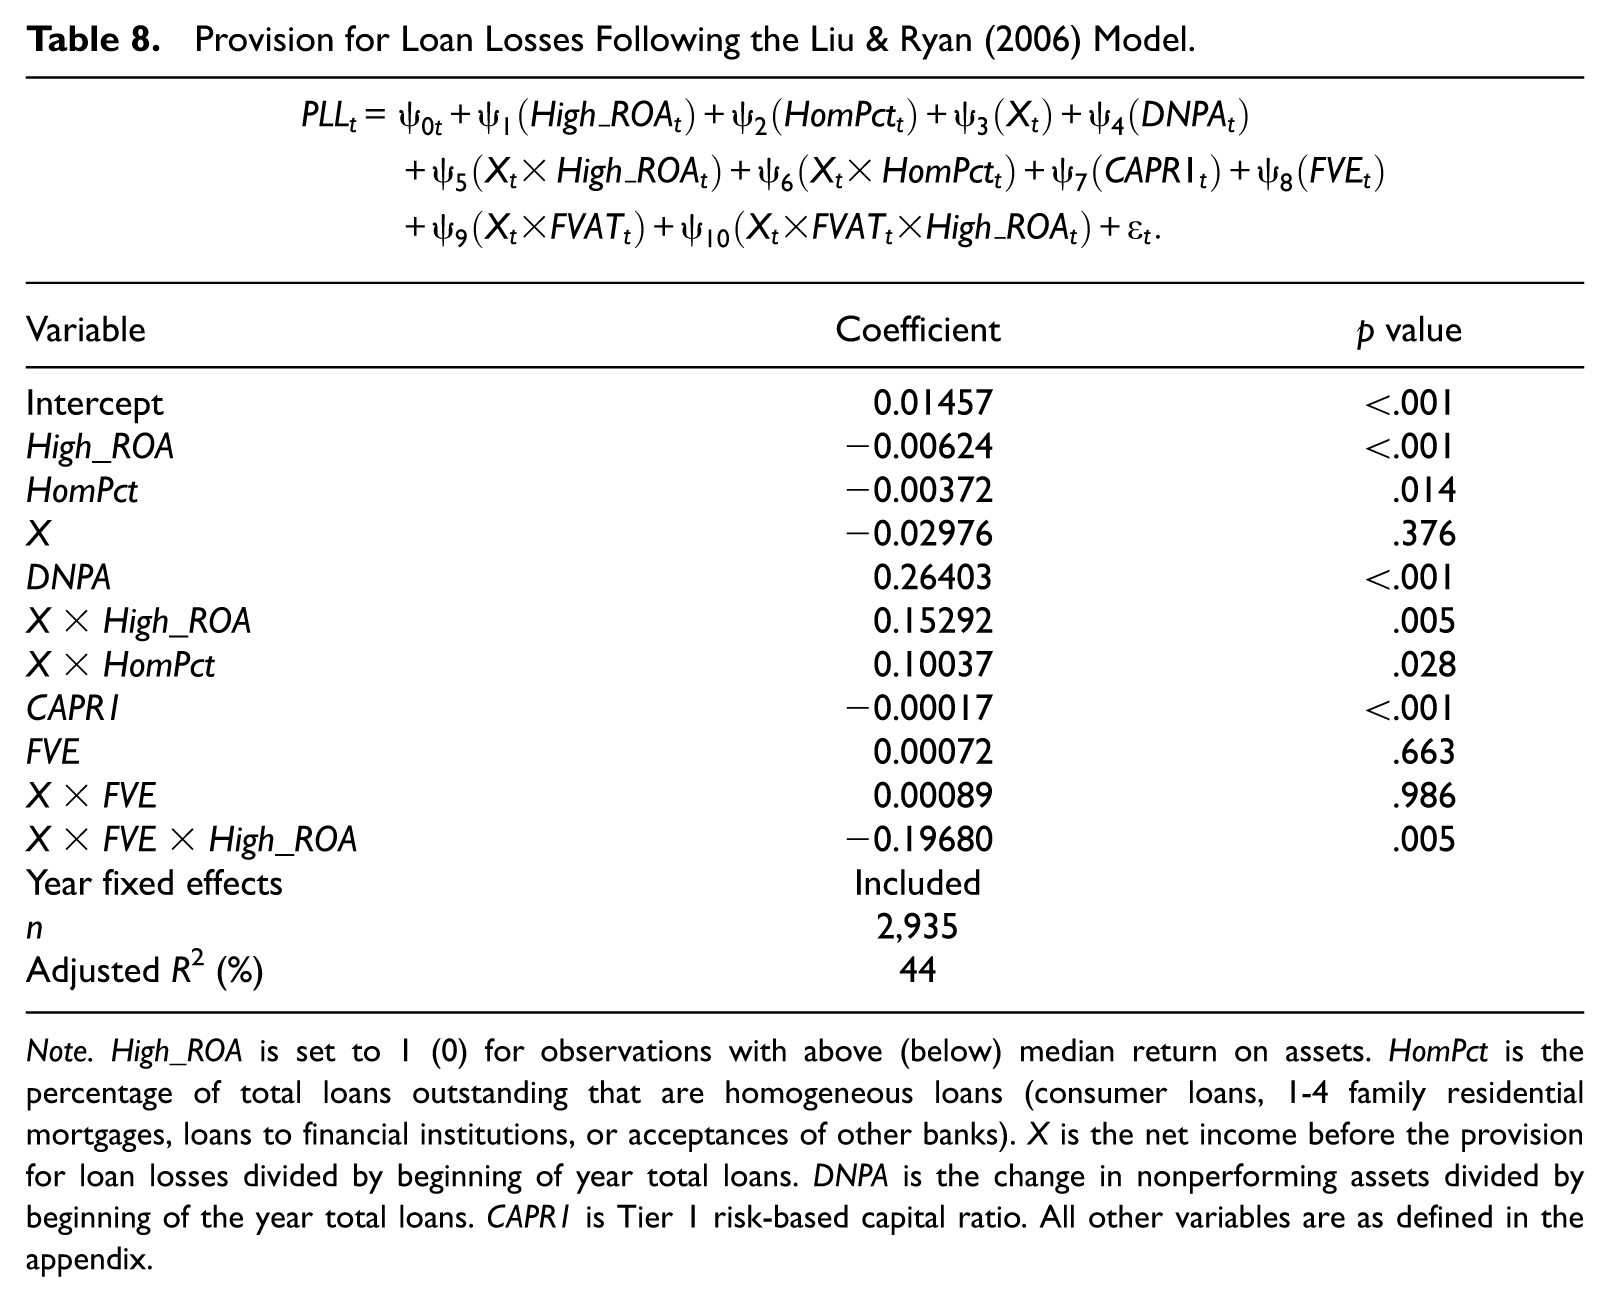
Note. High_ROA is set to 1 (0) for observations with above (below) median return on assets. HomPct is the percentage of total loans outstanding that are homogeneous loans (consumer loans, 1-4 family residential mortgages, loans to financial institutions, or acceptances of other banks). X is the net income before the provision for loan losses divided by beginning of year total loans. DNPA is the change in nonperforming assets divided by beginning of the year total loans. CAPR1 is Tier 1 risk-based capital ratio. All other variables are as defined in the appendix.
Kanagaretnam et al. (2010) estimate their Model 3 separately for banks with positive versus negative abnormal loan loss provisions (ALLPs), which are calculated as the residuals from their untabulated first-stage regression. We present results using the positive and negative ALLP subsamples in Table 9, Panels A and B, respectively. Given our research question, we exclude abnormal fees and instead augment the model with FVE. In Panel A, the coefficient on FVE is negative and significant, indicating that banks that manage the provision upward (which decreases net income) exhibit less earnings management as FVE increases. In Panel B, the coefficient on FVE is positive and significant, indicating that banks that manage the provision downward (which increase net income) also exhibit less earnings management as FVE increases. Collectively, Tables 8 and 9 provide evidence consistent with earlier results.
Abnormal Loan Loss Provision (ALLP) Following the Kanagaretnam et al. (2010) Model.

Note. ALLP is the residual from Model 1. EXEMPT is set to 1 (0) for observations with assets less (greater) than US$500 million for fiscal years prior to 2005, and less (greater) than US$1 billion for fiscal years in 2005 or later. MB is the market-to-book ratio. LMVE is the natural log of market value of common equity at the end of the year. LOSS is set to 1 (0) if net income is less (equal to or greater) than 0. PASTLLP is prior year LLP divided by total assets at the beginning of the year. EBP is the net income before extraordinary items and LLPs divided by total assets at the beginning of the year. TIER1 is tier 1 risk-adjusted capital ratio at the beginning of the year. TCAP is total risk-adjusted capital ratio at the beginning of the year. All other variables are as defined in the appendix.
Robustness Tests
To assess the robustness of our main results, we reestimate each model using alternative specifications for our main variables of interest—FVE, PME, and SPECIALIST. First, we use the median value of FVE as an alternative cut-off, and redefine FVE as an indicator variable equal to 1 (0) for banks with greater than (less than or equal to) the median FVE in the year. Untabulated results for the full sample are qualitatively similar to our primary results with a few exceptions. First, when estimating Models 4a and 4b, the coefficients on FVE×DLLP are positive but not quite statistically significant at conventional levels (two-tailed p values = .112 for downward earnings management and .142 for upward earnings management). Also, when estimating Model 5a the coefficient on SPECIALIST×FVE×High_PME is positive but marginally significant in the second specification using the full sample (one-tailed p value = .053), the coefficient on SPECIALIST×High_PME is negative but marginally significant for the first specification using the full sample (one-tailed p value = .055), and the same coefficient is not significant in the last specification using the Big N subsample. Finally, for Model 5b, the coefficients on SPECIALIST×FVE×Low_PME are negative but marginally significant for the first and sixth specifications (one-tailed p values = .073 and .080, respectively), and are not significant in the second specification, while the coefficient on SPECIALIST×Low_PME is not significant in the sixth specification.
We also redefine FVE as an indicator equal to 1 for banks in the top quintile of FVE, 0 otherwise. The results are similar to our main analyses except that the coefficients on FVE×DLLP in Models 4a and 4b are not significant in the reduced sample, the coefficients on SPECIALIST×High_PME in Model 5a are marginally significant in the first and sixth specification (one-tailed p values = .072 and .057, respectively), and the coefficient on SPECIALIST×Low_PME in Model 5b is marginally significant (one-tailed p value = .058).
Second, we reestimate our models using the median cut-off for premanaged earnings (PME), including banks with premanaged earnings greater than the median in the High_PME group and the remaining banks in the Low_PME group. Untabulated results are similar to our primary results with the exception of the coefficient on SPECIALIST×FVE×High_PME, which is positive but not significant in the third specification using the Big N subsample.
Third, we use a continuous measure of PME. Untabulated results are similar to those tabulated, except that the coefficient on FVE×DLLP is not significant when estimating Model 4a, the coefficient on SPECIALIST×PME is not significant in the sixth specification, and the coefficients on SPECIALIST×FVE×PME are positive but marginally significant in the third and sixth specifications (one-tailed p values = .069 and .079, respectively).
Fourth, we reestimate Models 5a and 5b replacing SPECIALIST with indicators for each of the Big N audit firms. Here, we find some evidence (untabulated) that two other Big N audit firms constrain both upward and downward earnings management using the LLP.
Fifth, we use a continuous measure of auditor specialization based on the proportion of clients audited by each audit firm. Untabulated results are similar to our primary results, suggesting that increased industry specialization (related to market share) mitigates the extent to which banks with lower exposure to fair value use the LLP to smooth earnings.
Sixth, to alleviate the concern that operational differences across banks could explain our results, we perform two additional sets of tests: First, we reestimate the analyses in Tables 3 and 4 by including the following measures: the equity-to-asset ratio (to control for leverage differences), the deposit-to-asset ratio (to capture differences in funding structure), and the nonperforming loans-to-asset ratio (to capture risk differences). We include these measures individually and altogether. In all specifications, our inferences remain unchanged. Second, we remove money center banks, and inferences remain unchanged. 26
Finally, to alleviate the concern that observations are not independent, we reestimate our main tests using clustered standard errors, and our inferences remain unchanged.
Conclusion
We examine the relation between our proxy for earnings management flexibility—the proportion of assets reported at fair value (which we refer to as “fair value exposure”)—and the extent to which banks use discretion over the LLP to smooth reported earnings. We suggest that banks with more fair value exposure have access to a different set of earnings management tools, and are thus able to substitute accrual-based earnings management (using the discretionary LLP) with transaction-based earnings management (using realized gains and losses). We also examine whether auditor industry specialization affects LLP-based earnings management.
We find that fair value exposure is negatively associated with the use of the discretionary LLP to smooth earnings, and positively associated with the extent to which banks trade off LLP-based and transaction-based earnings management. We also find that the use of an industry specialist auditor mitigates the extent to which banks use the discretionary portion of the LLP to smooth earnings, especially for banks with lower exposure to fair value. Our results suggest that a different set of earnings management tools are available to banks that hold more alternative financial assets, and that the ability to smooth earnings is mitigated by use of industry specialist auditors. Our findings contribute to our understanding of the roles that asset composition and auditor industry specialization play in banks’ earnings management decisions.
Our findings should be informative to regulators, members of the banking industry, and academics interested in the earnings management behavior of banks. They suggest that as banks choose to hold more assets subject to fair value reporting, they have a different and potentially less visible set of earnings management tools available to achieve desired earnings outcomes. These results are also important because they reflect determinants of the discretionary LLP reported using the current incurred loss model. These determinants are important to document in part because for fiscal years beginning after December 15, 2019 (2020), public (private) banks will adopt an alternative model—the current expected loss model—to calculate the provision (following FASB ASU 2016-13), and the new model could lead to different estimates of the LLP.
Our findings should also be of interest to investors. A. Beatty, Chamberlain, & Magliolo (1995a) find that valuation models of banks’ investment securities and the loan loss allowance are misspecified due to measurement error. Our study provides evidence that banks manage earnings differently depending on the extent to which they hold alternative financial instruments. Future valuation models could consider that the extent of discretion banks use to estimate loan losses and to time the realization of gains and losses may differ depending on their exposure to fair value.
As previously mentioned, our fair value measure captures not only exposure to fair value but also variation in the portfolio of bank asset holdings, so we do not provide evidence on the “type” of fair value accounting system, or speak to costs or benefits of requiring changes in the fair value of assets to be recorded on the balance sheet and/or income statement. Rather, our findings derive under the current accounting system, where some changes in fair value are ignored, others are recorded on both the balance sheet and income statement, and others bypass the income statement. Finally, we focus strictly on earnings management, and do not consider trade-offs that managers make to meet tax or regulatory capital objectives. We leave addressing these issues to future research.
Footnotes
Appendix
Variable Definitions.

| Variable | Definition | |
|---|---|---|
| Assetst | = | Total assets (BHCK2170), winsorized at the 1% and 99% levels. |
| DLLPt | = | The discretionary portion of the LLP (as estimated in Model 1) times lagged loans, scaled by lagged assets. |
| DRSGLt | = | Discretionary gains and losses (as estimated in Model 3), scaled by lagged assets, winsorized at the 1% and 99% levels. |
| FDICIAt | = | 1 for observations with assets greater than US$500 million in fiscal years prior to 2005, and greater than US$1 billion in fiscal years in 2005 or later, 0 otherwise. |
| FVEt | = | The sum of the assets and liabilities recognized or disclosed at fair value, scaled by total assets, winsorized at the 1% and 99% levels. These assets and liabilities include investments, derivatives, mortgage servicing rights, other financial assets, trading liabilities, and items reported at fair value using the fair value option. Fair values of held-to-maturity investments are disclosed in the BHC database as Item BHCK8551 until 2000 and as BHCK1771 thereafter. Fair values of AFS investments are disclosed as BHCK1773, fair values of trading assets are disclosed as BHCK3545, and fair values of derivatives other than those included in trading assets are disclosed as Items BHCK8733 through BHCK8748 and as Items BHCKC219 through BHCK222, fair values of mortgage servicing rights are disclosed as BHCK6438. Other financial assets reported at fair value include interest-only strips receivable (BHCKA519 and BHCKA520), except in 2007 and 2008 when a specific “other financial servicing assets” at fair value was disclosed (BHCKF249). Fair values of trading liabilities are disclosed as BHCK3548, and items reported at fair value using the fair value option include certain nontrading securities (BHCKF240), deposits (BHCKF252), other financial and servicing liabilities (BHCK 258), loan commitments not accounted for as derivatives (BHCK261), and loans and leases held for sale (BHCKF243). When any of these amounts are not disclosed, we set them to 0. |
| High_PMEt | = | 1 when Premanaged ROA are in the top quintile of sample observations in the year, and 0 otherwise. |
| HomPctt | = | The percentage of homogeneous loans which includes consumer loans (BHCB538, BHCB539, and BHCK2011), family residential mortgages (BHCK1797, BHDM5367, and BHDM538), and loans to financial institutions (BHCK1288). |
| Low_PMEt | = | 1 when Premanaged ROA is in the bottom quintile of sample observations in the year, and 0 otherwise. |
| OtherBigN | = | 1 if the bank is audited by a Big N auditor other than the SPECIALIST, and 0 otherwise. |
| PostRegt | = | 1 if the fiscal year is 2003 or later, and 0 otherwise. |
| Premanaged ROAt | = | ROA minus DLLP plus DRSGL, winsorized at the 1% and 99% levels. |
| ROAt | = | Net income (BHCK4340) scaled by lagged assets, winsorized at the 1% and 99% levels. |
| SPECIALISTt | = | 1 if the bank is audited by the industry specialist (the audit firm that audits the most clients in the banking industry in a given year), and 0 otherwise. In our sample, KPMG LLP is the specialist auditor in all years. |
Acknowledgements
We thank Bharat Sarath (editor), Sandra Chamberlain (associate editor), an anonomous reviewer, Gauri Bhat, Amanda Convery, Mark Evans, David Hulse, James Myers, Eddie Riedl, Hong Xie, workshop participants at the University of Arkansas and at the University of Kentucky, and conference participants at the 2012 Financial Accounting and Reporting Section Midyear Meeting, the 2012 American Accounting Association Annual Meeting, and the 2016 Tefler Annual Conference on Accounting and Finance at the University of Ottawa for providing comments on previous versions. This article was previously titled “Fair Value Accounting, Auditor Specialization, and Earnings Management: Evidence from the Banking Industry” and “The Effects of Fair Value Exposure and Auditor Specialization on Banks’ Discretionary Use of the Loan Loss Provision.”
The author(s) declared no potential conflicts of interest with respect to the research, authorship, and/or publication of this article.
The author(s) disclosed receipt of the following financial support for the research, authorship, and/or publication of this article: Brian Bratten and Monika Causholli gratefully acknowledge financial support from the Von Allmen Research Support Endowment at the University of Kentucky, and Linda A. Myers gratefully acknowledges financial support from the Haslam Chair of Business and from the William B. Stokely Faculty Research Fellowship at the University of Tennessee, and from the Garrison/Wilson Chair while at the University of Arkansas.