



Abstract
We examine banks’ accounting policy choices during the financial crisis where they are strongly motivated to manage earnings or regulatory capital. We address the issue via the initial elections of the fair value option (FVO) under SFAS No. 159, which provides considerable latitude and in particular its transition guidance is amenable to exploitation. We investigate banks’ reasons to elect the FVO and provide evidence regarding whether and how these reasons differed for banks adopting the standard in the first quarter of 2007 (early adopters) versus first quarter of 2008 (regular adopters). We predict and find that early adopters with histories of managing accounting numbers were more likely to make opportunistic FVO elections, and we show that early adopters with low capital tended to exploit the FVO in the opposite direction as those with high capital. With intense regulatory scrutiny since April 2007, we predict and find that regular adopters’ FVO elections complied with SFAS No. 159’s intent. We further analyze the particular reasons why early and regular adopters most commonly elected the FVO for specific types of financial instruments. We find that early adopters’ elections for available-for-sale (AFS) securities and debt reflected opportunism, and regular adopters’ elections for loans held for sale reflected compliance with the standard’s intent to remedy accounting mismatches for economic hedges.
Introduction
We investigate how bank holding companies (“banks”) make accounting policy choices during the financial crisis where the incentives to manage earnings or regulatory capital are stronger. In particular, we examine the reasons why banks elected the FVO for financial instruments upon their adoption of SFAS No. 159, The Fair Value Option for Financial Assets and Financial Liabilities. We consider whether banks’ FVO elections reflected exploitation of the standard’s transition guidance or compliance with the standard’s expressed intent to remedy accounting mismatches for economic hedges. We distinguish banks adopting SFAS No. 159 in the first quarter of 2007 (early adopters) versus the first quarter of 2008 (regular adopters), as well as FVO elections for different types of financial instruments. We begin our analysis at the start of 2007 because it is the period that the harshness of the U.S. subprime crisis was first perceived by the market (Ryan, 2008). We hypothesize and provide evidence that early adopters’ opportunistic FVO elections exhibited considerably greater variation than documented by Song (2008), Henry (2009), and Guthrie, Irving, and Sokolowsky (2011) (“the FVO literature”). More importantly, we hypothesize and provide the first evidence that regular adopters complied with SFAS No. 159’s expressed intent.
SFAS No. 159’s transition guidance required firms to record the effect of adopting the standard in retained earnings. The FVO literature finds that some early adopters exploited the standard’s transition guidance by electing the FVO for AFS securities with cumulative unrealized losses. These elections increased early adopters’ future net income by relieving it of these losses. We provide three new findings or insights regarding early adopters incremental to the FVO literature. First, we predict and find that early adopters with histories of realizing gains and losses on AFS securities to smooth their net income were more likely to exploit SFAS No. 159’s transition guidance. This finding indicates the importance of distinguishing firms based on their histories of managing accounting numbers. Second, we predict and find that early adopters with below-median regulatory capital elected the FVO for financial instruments with cumulative unrealized gains to increase their regulatory capital, 1 despite the negative consequences of these elections for future net income. This is opposite to the elections of early adopters with above-median regulatory capital. Third, we find that early adopters’ FVO initial elections were most frequently for AFS securities and debt. We explain why early adopters’ initial FVO elections for AFS securities and debt were both amenable to the exploitation of SFAS No. 159’s transition guidance and more likely to create than to remedy accounting mismatches.
We also provide three new findings or insights regarding regular adopters. First, we predict and find that proxies for regular adopters’ histories of managing accounting numbers and incentives regarding management of accounting and regulatory capital numbers do not explain their FVO elections, consistent with these elections not exploiting SFAS No. 159’s transition guidance. Second, we predict and find that proxies for accounting mismatches explain regular adopters’ FVO elections, consistent with these elections adhering to SFAS No. 159’s stated intent. Third, we find that regular adopters most commonly elected the FVO for loans held for sale. We explain that FVO elections for loans held for sale were likely to remedy accounting mismatches for economic hedges due to the difficulty of obtaining hedge accounting. In addition, we explain that these elections could not exploit SFAS No. 159’s transition guidance to raise future net income due to lower of cost or fair value accounting for loans held for sale.
Our results are important because some accounting researchers, standard setters, and other accounting policy makers have drawn negative inferences about SFAS No. 159’s FVO from the opportunistic behavior of some early adopters. For example, Song (2008) concludes that “[o]verall, the FVO seems to induce undesirable effects.” 2 Certain FASB board members appear to have soured on the FVO due to early adopters’ exploitation of the transition guidance in SFAS No. 159, a standard they view as principles-based. 3 Our results imply that any evaluation by the FASB of the merits of SFAS No. 159’s FVO relative to the alternative of hedge accounting should not dwell on early adopters’ opportunistic behavior. In fact, our findings for regular adopters should apply a fortiori to all banks’ FVO elections after 2008, because various provisions of the standard discussed in the “SFAS No. 159, Hypotheses, and the FVO Literature” section make it essentially impossible to manage accounting or regulatory capital numbers through FVO elections after the period of initial adoption.
Our study is closely related to but distinct from the work of Huizinga and Laeven (2012). While similarly investigating banks’ accounting discretion in the financial crisis, they focus on asset impairment, loan loss provisions, and classification of the mortgage-backed securities, finding that banks use accounting discretion to overstate the value of distressed assets and their regulatory capital during the U.S. mortgage crisis. We complement their work by providing positive evidence on how other accounting choice was made during the crisis and attributing the different findings to the role of regulators. Huizinga and Laeven (2012) indicate that regulators to some extent allowed banks to exploit accounting discretion to overstate their asset values at a time of financial crisis. However, regulatory forbearance did not apply to the FVO. Beginning in April 2007, the Securities and Exchange Commission (SEC) and other accounting policy makers took various actions to quash the opportunistic behavior exhibited by early adopters. While early adopters’ FVO elections were opportunistic, we find new evidence that regular adopters were deterred from such behavior by the scrutiny of early adopters’ FVO elections by the SEC and auditors.
We contribute to the earnings management literature within the banking industry. Recent research by Dunn, Kohlbeck, and Smith (2016) examines a similar issue on acquisition accounting. They find that acquirer banks with stronger incentives to boost income are more likely to report bargain purchase gains, which suggests that managers opportunistically exercise their discretion over fair value estimates to accelerate the recognition of bargain purchase gains. While our findings of early adopters’ elections in part reach the same conclusion for banks’ exploitation of the accounting rules, we make three incremental contributions. First, we offer evidence of regular adopters’ elections complied with the standard’s intent, suggesting how the monitoring mechanism deters opportunistic behavior. Second, instead of using the earnings-based benchmark as a proxy for current earnings management motivation, we use histories of managing accounting numbers to capture both current and future opportunistic incentives, which facilitates to distinguish more suspicious banks from less suspicious banks. We expect and find that opportunistic FVO elections primarily cluster around more suspicious banks. Finally, we address the coordination between earnings management and capital management by investigating when and how one opportunistic incentive dominates over the other. We find that banks managed earnings through accounting discretion when they had the sufficiently high capital to take the hit. However, for banks with capital concerns, they chose to raise their regulatory capital even at the cost of reduced earnings.
The remainder of the article is organized as follows. In the “SFAS No. 159, Hypotheses, and the FVO Literature” section, we describe the application of SFAS No. 159’s FVO and transition guidance to different types of financial instruments, the response of the SEC and other accounting policy makers to early adopters’ exploitation of that transition guidance, and the FVO literature. We develop our hypotheses along with this discussion. In the “Sample, Data, Variables, and Models” section, we describe our sample, data, variables, and empirical models. In the “Empirical Results” section, we report the results of our main empirical analyses and describe the specification analyses we conducted. We conclude in the “Conclusion” section.
SFAS No. 159, Hypotheses, and the FVO Literature
SFAS No. 159’s Requirements and Transition Guidance
SFAS No. 159 allows firms to discretionally account for most financial instruments and similar items at fair value with unrealized gains and losses recorded in net income in the period they occur. The FVO elections are irrevocable. Firms may only elect the FVO for whole financial instruments, not for selected risks within financial instruments. Firms may elect the FVO on an instrument-by-instrument basis. 4 American Accounting Association (AAA, 2007) criticizes this feature as yielding noncomparable accounting within portfolios of similar instruments held by a firm as well as across firms. Two FASB board members dissented from SFAS No. 159 primarily because of the lack of comparability they expected would result from the optional aspects of the FVO. The FVO is no worse than the alternative of current hedge accounting in this regard, however, and paragraphs 17 to 22 of SFAS No. 159 require detailed disclosures to mitigate this concern.
In the period they initially adopted SFAS No. 159, firms could elect the FVO for any financial instrument they held. As discussed below, this free choice along with the standard’s transition guidance allowed firms to make opportunistic FVO elections during the initial adoption period. After initial adoption, firms may elect the FVO only at the inception of financial instruments or when certain specified events trigger a new basis of accounting for those instruments.
SFAS No. 159 became effective for firms’ first fiscal year beginning after November 15, 2007. As all but seven of our sample banks have calendar fiscal years, the effective date of the standard generally is January 1, 2008. Firms could early adopt SFAS No. 159 as long as they (a) contemporaneously early adopted SFAS No. 157, Fair Value Measurements; (b) made the choice after issuance of the standard but within 120 days of the beginning of the fiscal year; and (c) had not issued financial statements for any quarter of that year. SFAS No. 159’s effective date for our early adopters generally is January 1, 2007.
SFAS No. 159’s transition guidance contains two features that were amenable to exploitation. First, paragraph 25 of the standard requires all adopters to record the cumulative effect of adopting the standard in retained earnings. While the FASB’s reasonable rationale for this feature is to avoid contaminating net income in the adoption period with gains and losses that occurred in prior periods, this feature allowed firms to raise their future net income by electing the FVO for positions with cumulative unrealized losses. This feature also allowed banks to raise their current Tier 1 capital ratio by electing the FVO for financial instruments with cumulative unrealized gains. Second, paragraph 30 of SFAS No. 159 allowed early adopters up to 120 days after the beginning of the adoption quarter to determine the financial instruments for which they initially elected the FVO. This feature is motivated by the issuance of the standard in February 2007 and the FASB’s desire to allow early adoption as of the beginning (as opposed to the second quarter) of fiscal 2007. However, it provided early adopters with the ability to raise their 2007:Q1 and to a lesser extent 2007:Q2 net income as well as their Tier 1 capital ratios by electing the FVO for positions that experienced unrealized gains during the look back period. 5 Taken together, firms could exploit the FVO to manage current and/or future accounting numbers by avoiding losses at the time of adoption and/or recognizing gains in the first adoption quarter.
The FVO literature finds that some early adopters elected the FVO for financial instruments, particularly AFS securities, with cumulative unrealized losses at the effective adoption date and with unrealized gains during the 120-day look back period. Song (2008) and Guthrie et al. (2011) find that this opportunistic behavior is concentrated among early adopters desiring to meet earnings targets. Although the accounting and banking literatures often find that banks make accounting choices to increase regulatory capital, 6 the FVO literature provides essentially no evidence that banks exploited SFAS No. 159’s transition guidance to raise capital.
The FVO literature and discussion above show or strongly suggest that early adopters elected the FVO for financial instruments with cumulative unrealized losses to raise their future net income. We propose two new hypotheses regarding early adopters’ opportunistic behavior here and one more in the following section. We do not expect banks in general to exploit the FVO; however, we use histories of managing accounting numbers to distinguish more suspicious banks from less suspicious banks. 7 We expect that early adopters’ opportunistic FVO elections should be observed primarily for more suspicious banks, and we further expect more suspicious banks to behave differently depending on their ex-ante level of regulatory capital. More explicitly, we predict that more suspicious banks with high regulatory capital elected the FVO for financial instruments with cumulative unrealized losses because those banks had the sufficiently high regulatory capital to render them willing to absorb the hit to regulatory capital. On the contrary, we expect more suspicious banks with sufficiently low regulatory capital to elect the FVO for financial instruments with cumulative unrealized gains to raise their regulatory capital. Collectively, we develop the following hypotheses to address the primary motivation for earnings management and capital management, respectively.
Regulatory Scrutiny and SFAS No. 159’s Intent
Beginning in April 2007, the SEC and other accounting policy makers took various actions to quash the opportunistic behavior exhibited by early adopters. In an April 2007 speech, SEC Deputy Chief Accountant James Kroeker indicated the SEC’s displeasure with portfolio “rebalancing” or “enhancement” strategies that various investment advisors had proposed firms to use upon adopting SFAS No. 159 (Kroeker, 2007). In a typical strategy, firms would elect the FVO for financial instruments with cumulative unrealized losses that they recorded directly in retained earnings. Firms would then sell the instruments and replace them with similar instruments for which they would not elect the FVO to avoid future net income volatility. Mr. Kroeker states that “this type of activity does not appear to promote the objective of the accounting standard. Accordingly, you can expect the SEC staff to continue to have an interest in such activities.” A CAQ Alert (Center for Audit Quality, 2007) effectively reiterated this warning to the auditor and financial report preparer communities. 8 As a result of scrutiny by the SEC or auditors, Henry (2009) identifies 12 firms (11 banks and one lessor) who rescinded or revised the FVO elections after their announcement of early adoption. However, she also indicates how numerous early adopters received such scrutiny but did not revise their FVO elections despite appearing to have exploited SFAS No. 159’s transition guidance.
Paragraph 1 of SFAS No. 159 states that the FVO provides “entities with the opportunity to mitigate volatility in reported net income caused by measuring related assets and liabilities differently without having to apply complex hedge accounting provisions.” That is, SFAS No. 159’s FVO enables firms to remedy accounting mismatches by accounting symmetrically for the two sides of economic hedges in a simpler fashion than does hedge accounting. While SFAS No. 133, Accounting for Derivative Instruments and Hedging Activities, governs hedge accounting, it allows only for highly effective hedges involving derivatives. The standard’s hedge effectiveness and other requirements make it difficult for many economic hedges to qualify for hedge accounting.
With intense regulatory scrutiny since April 2007, we expect regular adopters to behave differently from early adopters. In particular, we hypothesize that regular adopters’ FVO elections were more likely to comply with SFAS No. 159’s intent to remedy accounting mismatches.
We discuss our proxies for accounting mismatches in the “Sample, Data, Variables, and Models” section.
Analysis by Type of Financial Instrument
We further analyze the particular reasons why early and regular adopters most commonly elected the FVO for specific types of financial instruments. We separately examine only the three most commonly elected types: AFS securities and debt for early adopters as well as loans held for sale for regular adopters. As discussed in the “Sample, Data, Variables, and Models” section, at least 19 banks (more than 66% of early or regular adopters) elected the FVO for any of the three financial instruments. The next most common type is regular adopters’ elections for debt, with only eight banks. Analysis by type of such instrument is limited by the small numbers of observations and unable to make reliable inferences.
We determine whether banks’ FVO elections reflect opportunism versus compliance with SFAS No. 159’s intent based on the answers to two questions. First, do banks elect the FVO as a substitute for difficult-to-obtain hedge accounting for the elected financial instruments? If so, banks likely are remedying accounting mismatches, consistent with SFAS No. 159’s intent. In contrast, if banks elect the FVO for the hedged items in economic hedges for which it is easy to obtain hedge accounting or for noneconomic hedges, then they likely are behaving opportunistically. Second, do banks disproportionately elect the FVO for financial instruments with cumulative unrealized losses or gains? If so, they likely are behaving opportunistically. We provide the typical answers for these questions for each of the three types of financial instruments.
We first consider AFS securities and debt, which we consider together due to their economic similarity. Banks’ derivatives-based hedges of AFS securities and debt usually exhibit little if any accounting hedge ineffectiveness. This is partly because banks often designate specific risks within these financial instruments—most commonly benchmark interest rate risk—as the hedged item. 9 Banks usually hedge this benchmark interest rate risk using interest rate swaps that exhibit high hedge effectiveness. For this reason, banks generally do not need to elect SFAS No. 159’s FVO as a substitute for hedge accounting for their hedges of AFS securities or debt. 10 Moreover, banks generally could elect the FVO for AFS securities and debt with either cumulative unrealized losses (gains), thereby increasing their future net income (current Tier 1 regulatory capital). 11 Hence, early adopters’ FVO elections for AFS securities and debt likely are opportunistic.
We now turn to loans held for sale. Banks typically hold loans held for sale only for the period of time necessary to accumulate enough loans to sell efficiently. For example, mortgages are banks’ most common type of loans held for sale, and banks typically hold mortgages as held for sale for about 2 months. Banks usually hedge loans held for sale by selling forward or futures contracts with tenors equal to the expected length of the holding period. While these derivatives-based hedges could, in principle, qualify for hedge accounting, they typically exhibit considerable hedge ineffectiveness due to the uncertain length of the holding period. This uncertain length results partly from fluctuations in the speed that banks accumulate loans held for sale and partly from fluctuations in the receptivity of buyers in the secondary loan market. 12 For this and other lesser reasons, 13 banks find it difficult to obtain hedge accounting for their hedges of loans held for sale. Hence, banks likely elect the FVO for loans held for sale as a substitute for hedge accounting. 14
In addition, banks generally cannot elect the FVO for loans held for sale with cumulative unrealized losses because loans held for sale are accounted for at lower of cost or fair value, with unrealized losses recognized for accounting purposes as if they were realized. Banks must recognize all unrealized losses on loan held for sale prior to the adoption of the FVO. Hence, banks cannot elect the FVO for loans held for sale to raise their future net income. Banks could elect the FVO for loans held for sale with cumulative unrealized gains to raise their Tier 1 regulatory capital upon initial adoption, however.
Based on the above discussion, we propose two hypotheses regarding the particular reasons for banks’ elections for the three most common types. More specifically, we hypothesize that early adopters’ elections for AFS securities and debt reflected opportunism, and regular adopters’ elections for loans held for sale reflected compliance with SFAS No. 159’s intent.
Sample, Data, Variables, and Models
Sample and Data Sources
We restrict our analysis to banks for two reasons. First, this restriction yields a more homogeneous sample. Compared with nonbanks, banks hold more financial instruments and are more likely to use asset-liability management (ALM), other forms of economic hedging, and hedge accounting. Second, banks provide detailed data about their FVO elections and other attributes in their regulatory FR Y-9C reports. Both reasons are important to our study because we analyze specific reasons for banks’ FVO elections for specific types of financial instruments. For example, nonbanks generally do not hold any loans held for sale.
To identify banks that adopted SFAS No. 159, when they did so, and the financial instruments for which they made their initial FVO elections, we searched all publicly traded banks’ Form 10-Q filings for 2007:Q1 and 2008:Q1 on the SEC’s EDGAR database using the keywords “fair value option,”“FVO,” and “159.” The development of the sample is summarized in Table 1, panel A. Of the 371 banks on the EDGAR database in 2007:Q1, 19 have missing data, 28 early adopted SFAS No. 159, and 324 did not adopt the standard in that quarter. The 352 observations with nonmissing data constitute our 2007:Q1 sample.
Sample Selection and Distribution of FVO Elections.
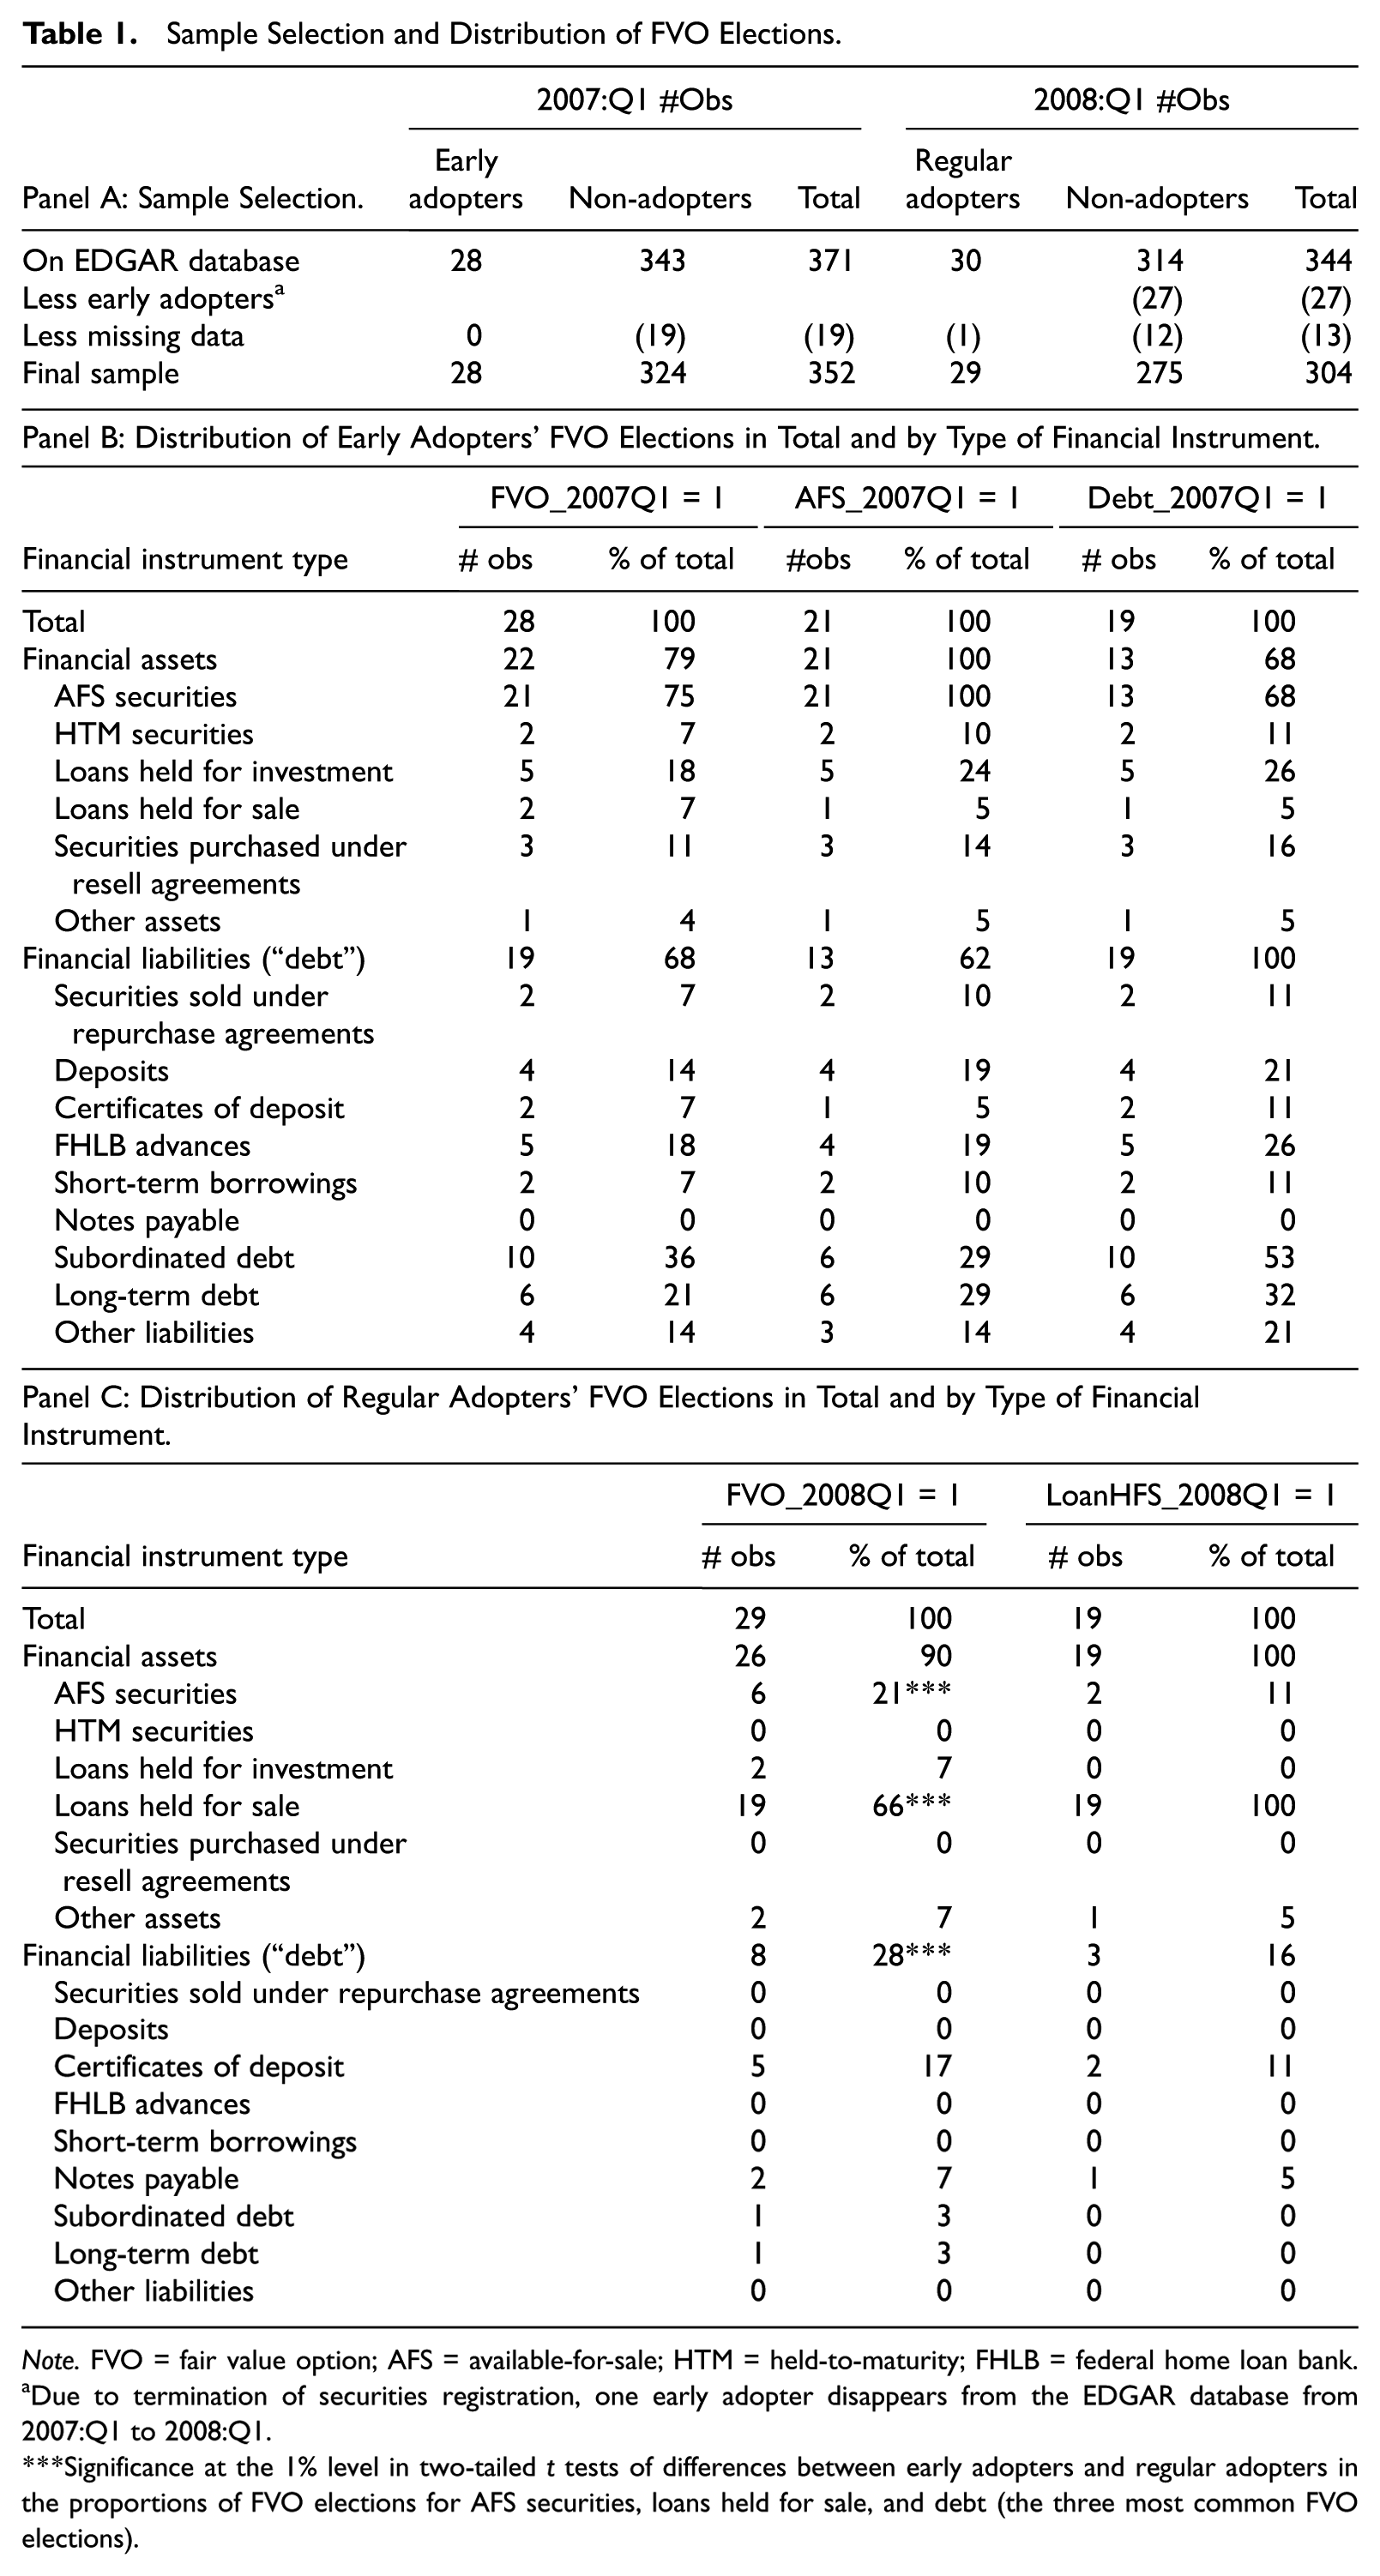
Note. FVO = fair value option; AFS = available-for-sale; HTM = held-to-maturity; FHLB = federal home loan bank. aDue to termination of securities registration, one early adopter disappears from the EDGAR database from 2007:Q1 to 2008:Q1.
Significance at the 1% level in two-tailed t tests of differences between early adopters and regular adopters in the proportions of FVO elections for AFS securities, loans held for sale, and debt (the three most common FVO elections).
Primarily because of termination of securities registration as a result of the financial crisis, 27 banks disappear from the EDGAR database from 2007:Q1 to 2008:Q1. Of the 344 banks on the EDGAR database in 2008:Q1, 13 have missing data, 27 early adopted SFAS No. 159, 29 regularly adopted SFAS No. 159 (excluding one regular adopter with missing data), and 275 did not elect the FVO in that quarter. The 304 observations with nonmissing data that are not early adopters constitute our 2008:Q1 sample.
Table 1 reports the counts of FVO elections in total and by type of financial instruments for early adopters (panel B) and regular adopters (panel C). Of the 28 early adopters, 21 (19) elected the FVO for AFS securities (debt), and 13 elected the FVO for both AFS securities and debt. The considerable overlap in the FVO elections for AFS securities and debt likely reflects the fact that banks typically use both AFS securities and debt in ALM due to their offsetting risks. The next most frequently elected item is loans held for investment, with only five elections.
Of the 29 regular adopters, 19 elected the FVO for loans held for sale. There is relatively little overlap between FVO elections for loans held for sale and other financial instruments, which presumably reflects the fact that banks typically do not use loans held for sale in ALM due to their short and uncertain holding period. The next most frequently elected item is debt, with only eight elections.
We collected most of our variables from banks’ regulatory FR Y-9C reports, which U.S. bank holding companies with total consolidated assets above $500 million are required to file each quarter with the Federal Reserve. 15 These high-quality reports are essentially complete in terms of the coverage of banks meeting the size criterion and the availability of required variables. We obtained the fair and carrying values of banks’ financial instruments from their Form 10-Ks on the EDGAR database. We gathered net hedge ineffectiveness gains or losses from Compustat and daily stock returns from the Center for Research in Security Prices (CRSP).
Variables and Empirical Models
We test our hypotheses using logistic regression models in which the dependent variables are dichotomous variables indicating five distinct FVO elections. The explanatory variables include proxies for accounting mismatches, proxies for opportunism regarding SFAS No. 159’s transition guidance, and control variables.
The dependent variables are as follows. FVO_2007Q1 takes a value of one for early adopters and zero otherwise. FVO_2008Q1 takes a value of one for regular adopters, is missing for early adopters, and is zero otherwise. AFS_2007Q1 (Debt_2007Q1) takes a value of one for early adopters electing the FVO for AFS securities (debt), is missing for early adopters that elected the FVO only for financial instruments other than AFS securities (debt), and is zero otherwise. LoanHFS_2008Q1 takes a value of one for regular adopters electing the FVO for loans held for sale, is missing for early adopters and for regular adopters that selected the FVO only for financial instruments other than loans held for sale, and is zero otherwise. Panel A of the appendix contains the definitions of these dependent variables.
The explanatory variables include four proxies for accounting mismatches, which we expect to explain regular adopters’ FVO elections. The first two capture accounting mismatches that occur when the two sides of banks’ ALM or other economic hedging relationships are accounted for inconsistently. EarV denotes the standard deviation of quarterly income before extraordinary items divided by beginning total assets over the four quarters prior to the potential initial FVO adoption. REcor denotes the correlation between quarterly stock returns and quarterly income divided by beginning total assets over the four quarters prior to the potential initial FVO adoption. More positive EarV and more negative REcor imply greater accounting mismatches, all else being equal. In H3 and H5, we expect regular adopters’ FVO elections, particularly for loans held for sale, to be positively associated with EarV and negatively associated with REcor. 16
The two remaining accounting mismatch proxies capture banks’ costly or ineffective use of hedge accounting. IH_dmy denotes a dummy variable that takes a value of one for banks reporting gains or losses attributable to accounting hedge ineffectiveness in the year prior to the potential initial FVO election and zero otherwise; this variable is intended to capture the ineffectiveness of hedge accounting. Der denotes the notional amount of derivatives divided by total assets in the quarter prior to the potential initial FVO election; this variable is intended to capture the cost of hedge accounting. Again, in H3 and H5, we expect regular adopters’ FVO elections, particularly for loans held for sale, to be positively associated with both IH_dmy and Der. 17
The explanatory variables include eight proxies for opportunism. As discussed below, we expect early adopters’ FVO elections to be associated in predictable directions with many of these proxies. We expect regular adopters’ FVO elections to have no reliable association with any of these proxies.
All the opportunism proxies are based in part or whole on measures of banks’ histories of managing accounting numbers and/or current Tier 1 regulatory capital ratio. We determine banks’ histories of managing accounting numbers using the correlation between realized net gains on AFS securities and premanaged income (i.e., income subtracts realized net gains on AFS securities) over the prior eight quarters for the bank. 18 A negative correlation is consistent with the bank having smoothed its quarterly net income through the realization of gains and losses on AFS securities, that is, having behaved opportunistically. We expect past income-smoothing behavior to be associated with current opportunistic FVO elections because they are both motivated by the same decision model in terms of overall assessment and coordination of two interrelated factors, such as current and future performances under income smoothing as well as earnings and capital under opportunistic FVO elections. In addition, opportunistic FVO elections simulate the process of income smoothing in the context of not trying to boost income in all states. Hence, we construct the dichotomous variable OPP, which takes a value of one if this correlation is negative and zero otherwise. 19 Specifically, we use OPP to distinguish more suspicious banks (with histories of managing accounting numbers, that is, OPP = 1) from less suspicious banks (without histories of managing accounting numbers, that is, OPP = 0). We expect opportunistic FVO elections for more suspicious banks, but not for less suspicious banks. To further investigate more suspicious banks’ choices regarding the elections of the FVO, we expect them to behave differently depending on their ex-ante level of regulatory capital. We measure banks’ ex-ante level of regulatory capital as the dichotomous variable REG_H, which takes a value of one if the firm’s Tier 1 capital ratio is above the median for the sample banks in the quarter prior to the potential initial FVO election and zero otherwise.
The first two opportunism proxies interact OPP and REG_H. OPP_H denotes OPP times REG_H. OPP_L equals OPP times (1-REG_H). We expect early adopters’ FVO elections to be positively associated with both OPP_H and OPP_L. However, we expect early adopters with OPP_H = 1 to elect the FVO for financial instruments with cumulative unrealized losses, and early adopters with OPP_L = 1 to elect the FVO for financial instruments with cumulative unrealized gains. 20
The next two opportunism proxies pertain to the availability of financial instruments with cumulative unrealized gains or losses for the bank. Such availability is necessary for banks to be able to elect the FVO opportunistically. UGLAFS denotes the difference between fair value and carrying value of AFS securities divided by total assets. 21 UGLNFA denotes the difference between fair value and carrying value of net financial assets other than AFS securities divided by total assets. We distinguish AFS securities from other net financial assets in part because AFS securities are accounted for differently, but primarily because the FVO literature finds that early adopters’ FVO elections for AFS securities were the primary way that they exploited SFAS No. 159’s transition guidance. 22 We do not make hypotheses about the direct associations between early adopters’ FVO elections and one of UGLAFS and UGLNFA because we expect these relationships to depend upon OPP_H and OPP_L. To capture these indirect associations, the remaining opportunism variables are the four multiplicative interactions between UGLAFS and UGLNFA with one of OPP_H and OPP_L. We expect early adopters’ initial FVO elections to be negatively associated with UGLAFS×OPP_H and UGLNFA×OPP_H because banks with OPP_H = 1 will elect the FVO for financial instruments with cumulative unrealized losses to increase future net income. We expect early adopters’ initial FVO elections to be positively associated with UGLAFS×OPP_L and UGLNFA×OPP_L because banks with OPP_L = 1 will elect the FVO for financial instruments with cumulative unrealized gains to increase regulatory capital.
We include two control variables in the models. We include the log of total assets, denoted LogTA, to control for the effect of size. Song (2008) and Guthrie et al. (2011) find that larger firms are more likely to make FVO elections. Larger firms are more visible than and differ in numerous other ways from smaller firms that may influence their FVO elections. Because it is difficult to determine the net implication of the numerous and pervasive effects of firm size, we make no directional prediction for LogTA despite these findings. We also include 0-1 year interest rate sensitivity gap, denoted IRSG, to control for banks’ choices to accept interest rate risk economically and thus are willing to absorb the corresponding net income volatility. IRSG may also capture accounting mismatches, due to the mixed-attribute accounting for financial instruments. Because IRSG may capture various constructs, we do not make a directional prediction for its association with banks’ FVO elections.
As discussed in the specification analyses section, we tried various other control variables that were insignificant and did not affect our inferences regarding the included explanatory variables. Panel B of the appendix contains the definitions of the explanatory variables and summarizes our predictions for the directions of their associations with FVO elections.
Because our dependent variables are dummy variables indicating correspondingly defined FVO elections described above, we estimate logistic regressions of these variables on the explanatory variables, that is,
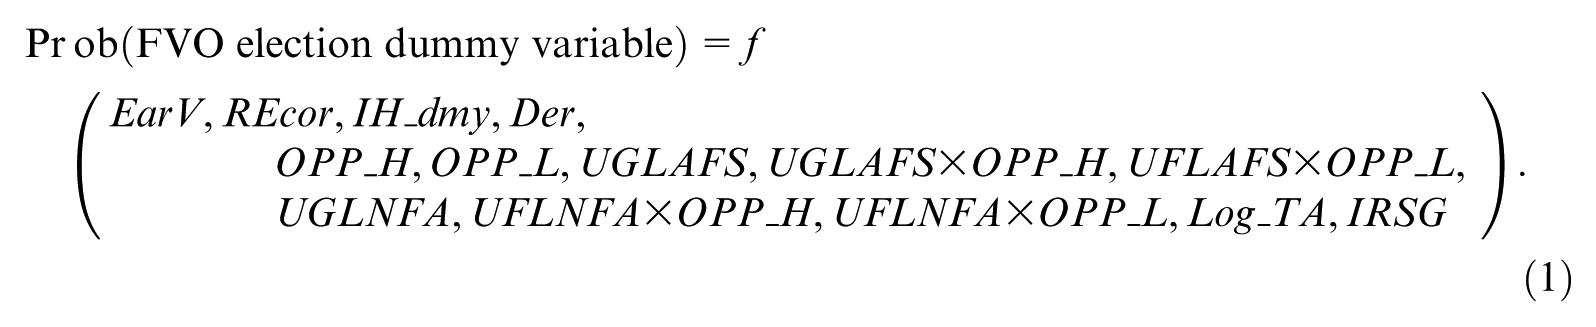
The sample period for the estimation of Equation 1 is 2007:Q1 for the models in which the dependent variable is FVO_2007Q1, AFS_2007Q1, or Debt_2007Q1, and 2008:Q1 for the models in which the dependent variable is FVO_2008Q1 or LoanHFS_2008Q1.
We measure all explanatory variables in the period immediately prior to the potential initial FVO election under consideration. We winsorize all continuous variables at the 0.5% and 99.5% tails to reduce the effects of outliers. Our results are robust to conventional alternative winsorization and deletion rules.
Unless stated differently, we say that an estimated coefficient or other statistic is significant if the probability of the null hypothesis generating that statistic is 5% or less in a one-tailed test if we have made a directional prediction and in a two-tailed test otherwise.
We report several goodness-of-fit statistics for the estimation of Equation 1, while the most interpretable of which is the area under the ROC (receiver operating characteristics) curve. This statistic is the estimated probability that the model ranks a randomly chosen actual FVO election higher than a randomly chosen non-FVO election. Random guessing yields an area under the ROC curve equal to 0.50, while perfect prediction yields a statistic of 1.00. Hosmer and Lemeshow (2000) state that an area under the ROC curve of 0.70 to 0.80 (above 0.80) indicates an acceptable (excellent) model.
Empirical Results
Descriptive Statistics
Table 2 reports the means, medians, and standard deviations of the explanatory variables in Equation 1 for various pairings of FVO adopters versus non-adopters. The table reports the significance levels for these pairings of Student t and Wilcoxon rank-sum Z tests of differences between the means and medians, respectively, as well as Snedecor–Cochran F tests of ratios of variances. For comparative purposes, the table reports these statistics and tests for the nonexplanatory variables OPP, UGLAFS×OPP, and UGLNFA×OPP.
Descriptive Statistics of Explanatory Variables for Adopters Versus Non-Adopters in Same Quarter.
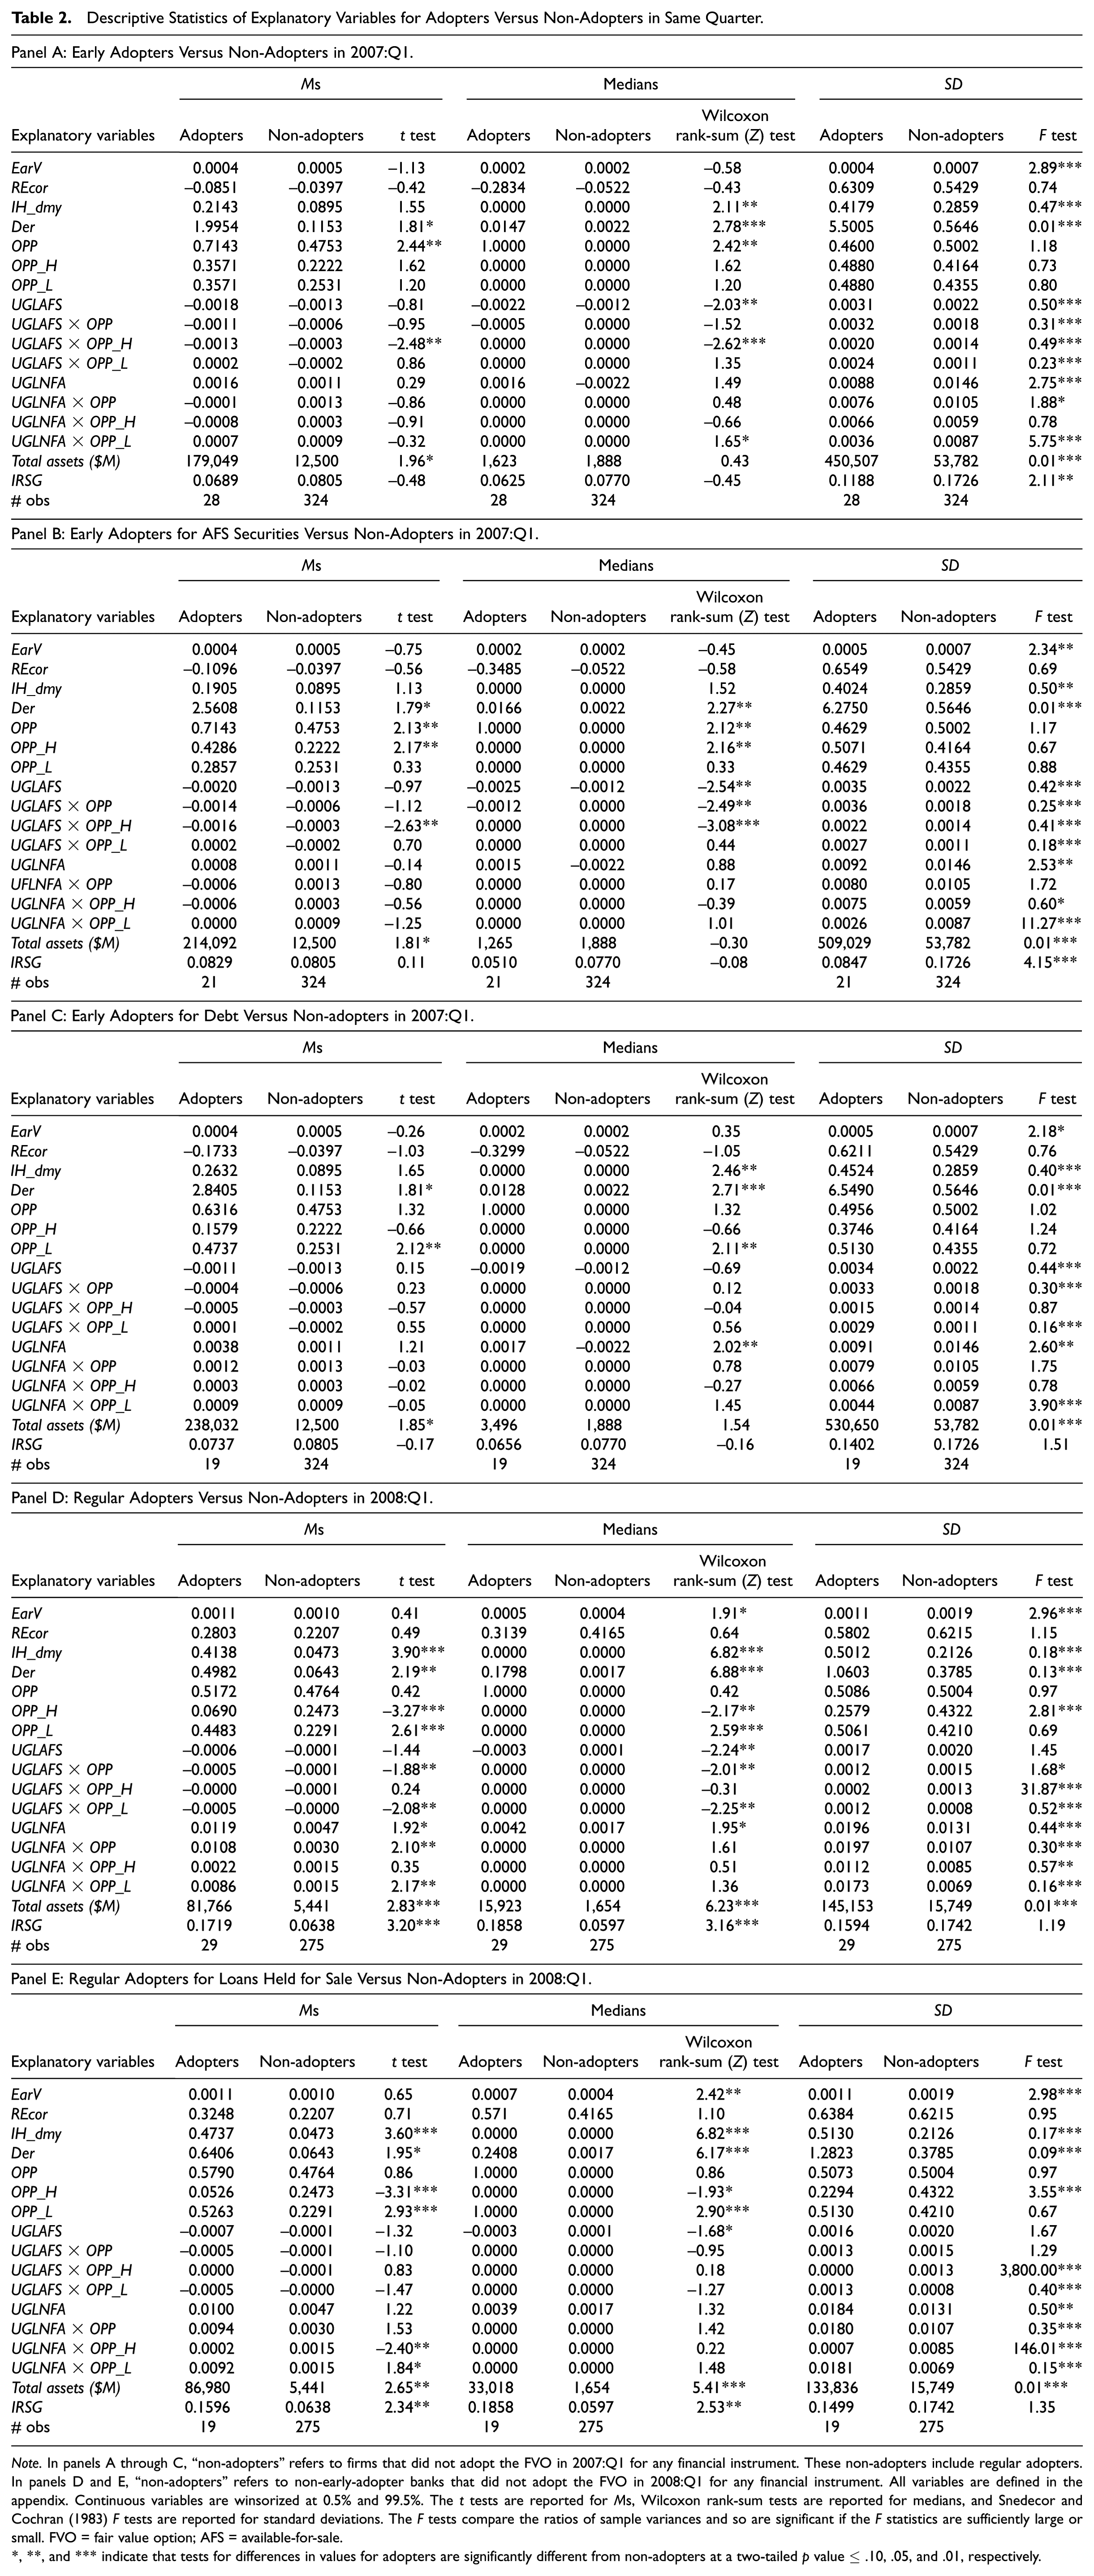
Note. In panels A through C, “non-adopters” refers to firms that did not adopt the FVO in 2007:Q1 for any financial instrument. These non-adopters include regular adopters. In panels D and E, “non-adopters” refers to non-early-adopter banks that did not adopt the FVO in 2008:Q1 for any financial instrument. All variables are defined in the appendix. Continuous variables are winsorized at 0.5% and 99.5%. The t tests are reported for Ms, Wilcoxon rank-sum tests are reported for medians, and Snedecor and Cochran (1983) F tests are reported for standard deviations. The F tests compare the ratios of sample variances and so are significant if the F statistics are sufficiently large or small. FVO = fair value option; AFS = available-for-sale.
, **, and *** indicate that tests for differences in values for adopters are significantly different from non-adopters at a two-tailed p value ≤ .10, .05, and .01, respectively.
Panel A of Table 2 reports these statistics and tests for early adopters versus non-adopters in 2007:Q1. Panel B (C) reports them for early adopters that elected the FVO for AFS securities (debt) versus non-adopters in 2007:Q1. Panel D reports them for regular adopters versus non-adopters in 2008:Q1. Panel E reports them for regular adopters that elected the FVO for loans held for sale versus non-adopters in 2008:Q1.
The statistics and tests reported in panel A indicate that early adopters were more likely to report accounting hedge ineffectiveness (for IH_dmy, Z = 2.11) and to use derivatives (for Der, t = 1.81 and Z = 2.78) than are other observations in 2007:Q1. These findings are consistent with early adopters’ FVO elections adhering to SFAS No. 159’s intent. However, there is also evidence that early adopters with histories of managing accounting numbers and high regulatory capital (i.e., OPP_H = 1) opportunistically elected the FVO for AFS securities with cumulative unrealized losses (for UGLAFS× OPP_H, t = −2.48 and Z = −2.62) to raise future net income, consistent with H1. In contrast, early adopters with the same proclivity but low regulatory capital (i.e., OPP_L = 1) opportunistically elected the FVO for debt with cumulative unrealized gains (for UGLNFA× OPP_L, Z = 1.65) to raise regulatory capital, consistent with H2. Notice that the significances of the interactive variables involving OPP are muted relative to the significance of the corresponding interactive variables involving OPP_H and OPP_L, because of the different opportunistic behavior of high- versus low-capital adopters. Panel A also reports evidence that early adopters are larger (for total assets, t = 1.96).
Panels B and C report the descriptive statistics and tests comparing early adopters electing the FVO for AFS securities and debt to non-adopters in 2007:Q1. While generally similar to the results for early adopters reported in panel A, these panels indicate differences between early adopters electing the FVO for the two types of instruments, despite the substantial overlap in these elections for these instruments reported in Table 1, panel B. These differences are not observable in panel A, and so they highlight the importance of separate analysis of FVO elections by type of financial instrument.
Specifically, panel B reports that early adopters electing the FVO for AFS securities have histories of managing accounting numbers and higher capital than corresponding non-adopters (for OPP_H, t = 2.17 and Z = 2.16), consistent with H1. In contrast, panel C reports that early adopters electing the FVO for debt also have histories of managing accounting numbers but have lower capital than corresponding non-adopters (for OPP_L, t = 2.12 and Z = 2.11), consistent with H2. Panel B reports that early adopters electing the FVO for AFS securities generally have larger cumulative unrealized losses on AFS securities than corresponding non-adopters (for UGLAFS, Z = −2.54), again consistent with H1. In contrast, panel C reports that early adopters electing the FVO for debt generally have larger cumulative unrealized gains on other net financial assets than corresponding non-adopters (for UGLNFA, Z = 2.02), again consistent with H2. As in panel A, notice that the significances of the interactive variables involving OPP are muted relative to the significance of the corresponding interactive variables involving OPP_H and OPP_L.
The statistics and tests reported in panel D suggest that regular adopters adhered more strongly to SFAS No. 159’s intent than did early adopters. The differences of the means and medians of IH_dmy (t = 3.90 and Z = 6.82) as well as Der (t = 2.19 and Z = 6.88) are considerably more significantly positive than in panel A, and the difference of the medians of EarV (Z = 1.91) is also significantly positive. However, there is also some apparent evidence that regular adopters with histories of managing accounting numbers and low regulatory capital (i.e., OPP_L = 1) exploited SFAS No. 159’s transition guidance. Specifically, regular adopters were more likely than corresponding non-adopters to have OPP_L = 1 (t = 2.61 and Z = 2.59). Regular adopters with OPP_L = 1 elected the FVO for AFS securities with cumulative unrealized losses (for UGLAFS×OPP_L, t = −2.08 and Z = −2.25) but elected the FVO for net financial assets with cumulative unrealized gains (for UGLNFA×OPP_L, t = 2.17). 23
Panel E reports the descriptive statistics and tests comparing regular adopters electing the FVO for loans held for sale to non-adopters 2008:Q1. Compared with the results for all regular adopters in panel D, panel E reports similarly strong associations with the accounting mismatch proxies but noticeably weaker associations with the opportunism proxies. This suggests that regular adopters’ FVO elections for loans held for sale are even more likely to comply with SFAS No. 159’s intent than their elections for other financial instruments. These differences again highlight the importance of separate analysis of FVO elections by type of financial instrument.
Panels A and B of Table 3 report the Pearson correlations of the Equation 1 variables for the 2007:Q1 and 2008:Q1 samples, respectively. We briefly discuss the more interesting correlations. Log_TA is highly correlated with many of the other explanatory variables, particularly IH_dmy and Der, indicating the importance of controlling for size. Log_TA is positively correlated with OPP_L because larger banks are more likely both to have managed income and to have lower regulatory capital. IH_dmy and Der are highly positively correlated, which will tend to work against either variable being significant in the multivariate analysis.
Pearson Correlations of Equation 1 Explanatory Variables for 2007:Q1 and 2008:Q1 Samples.
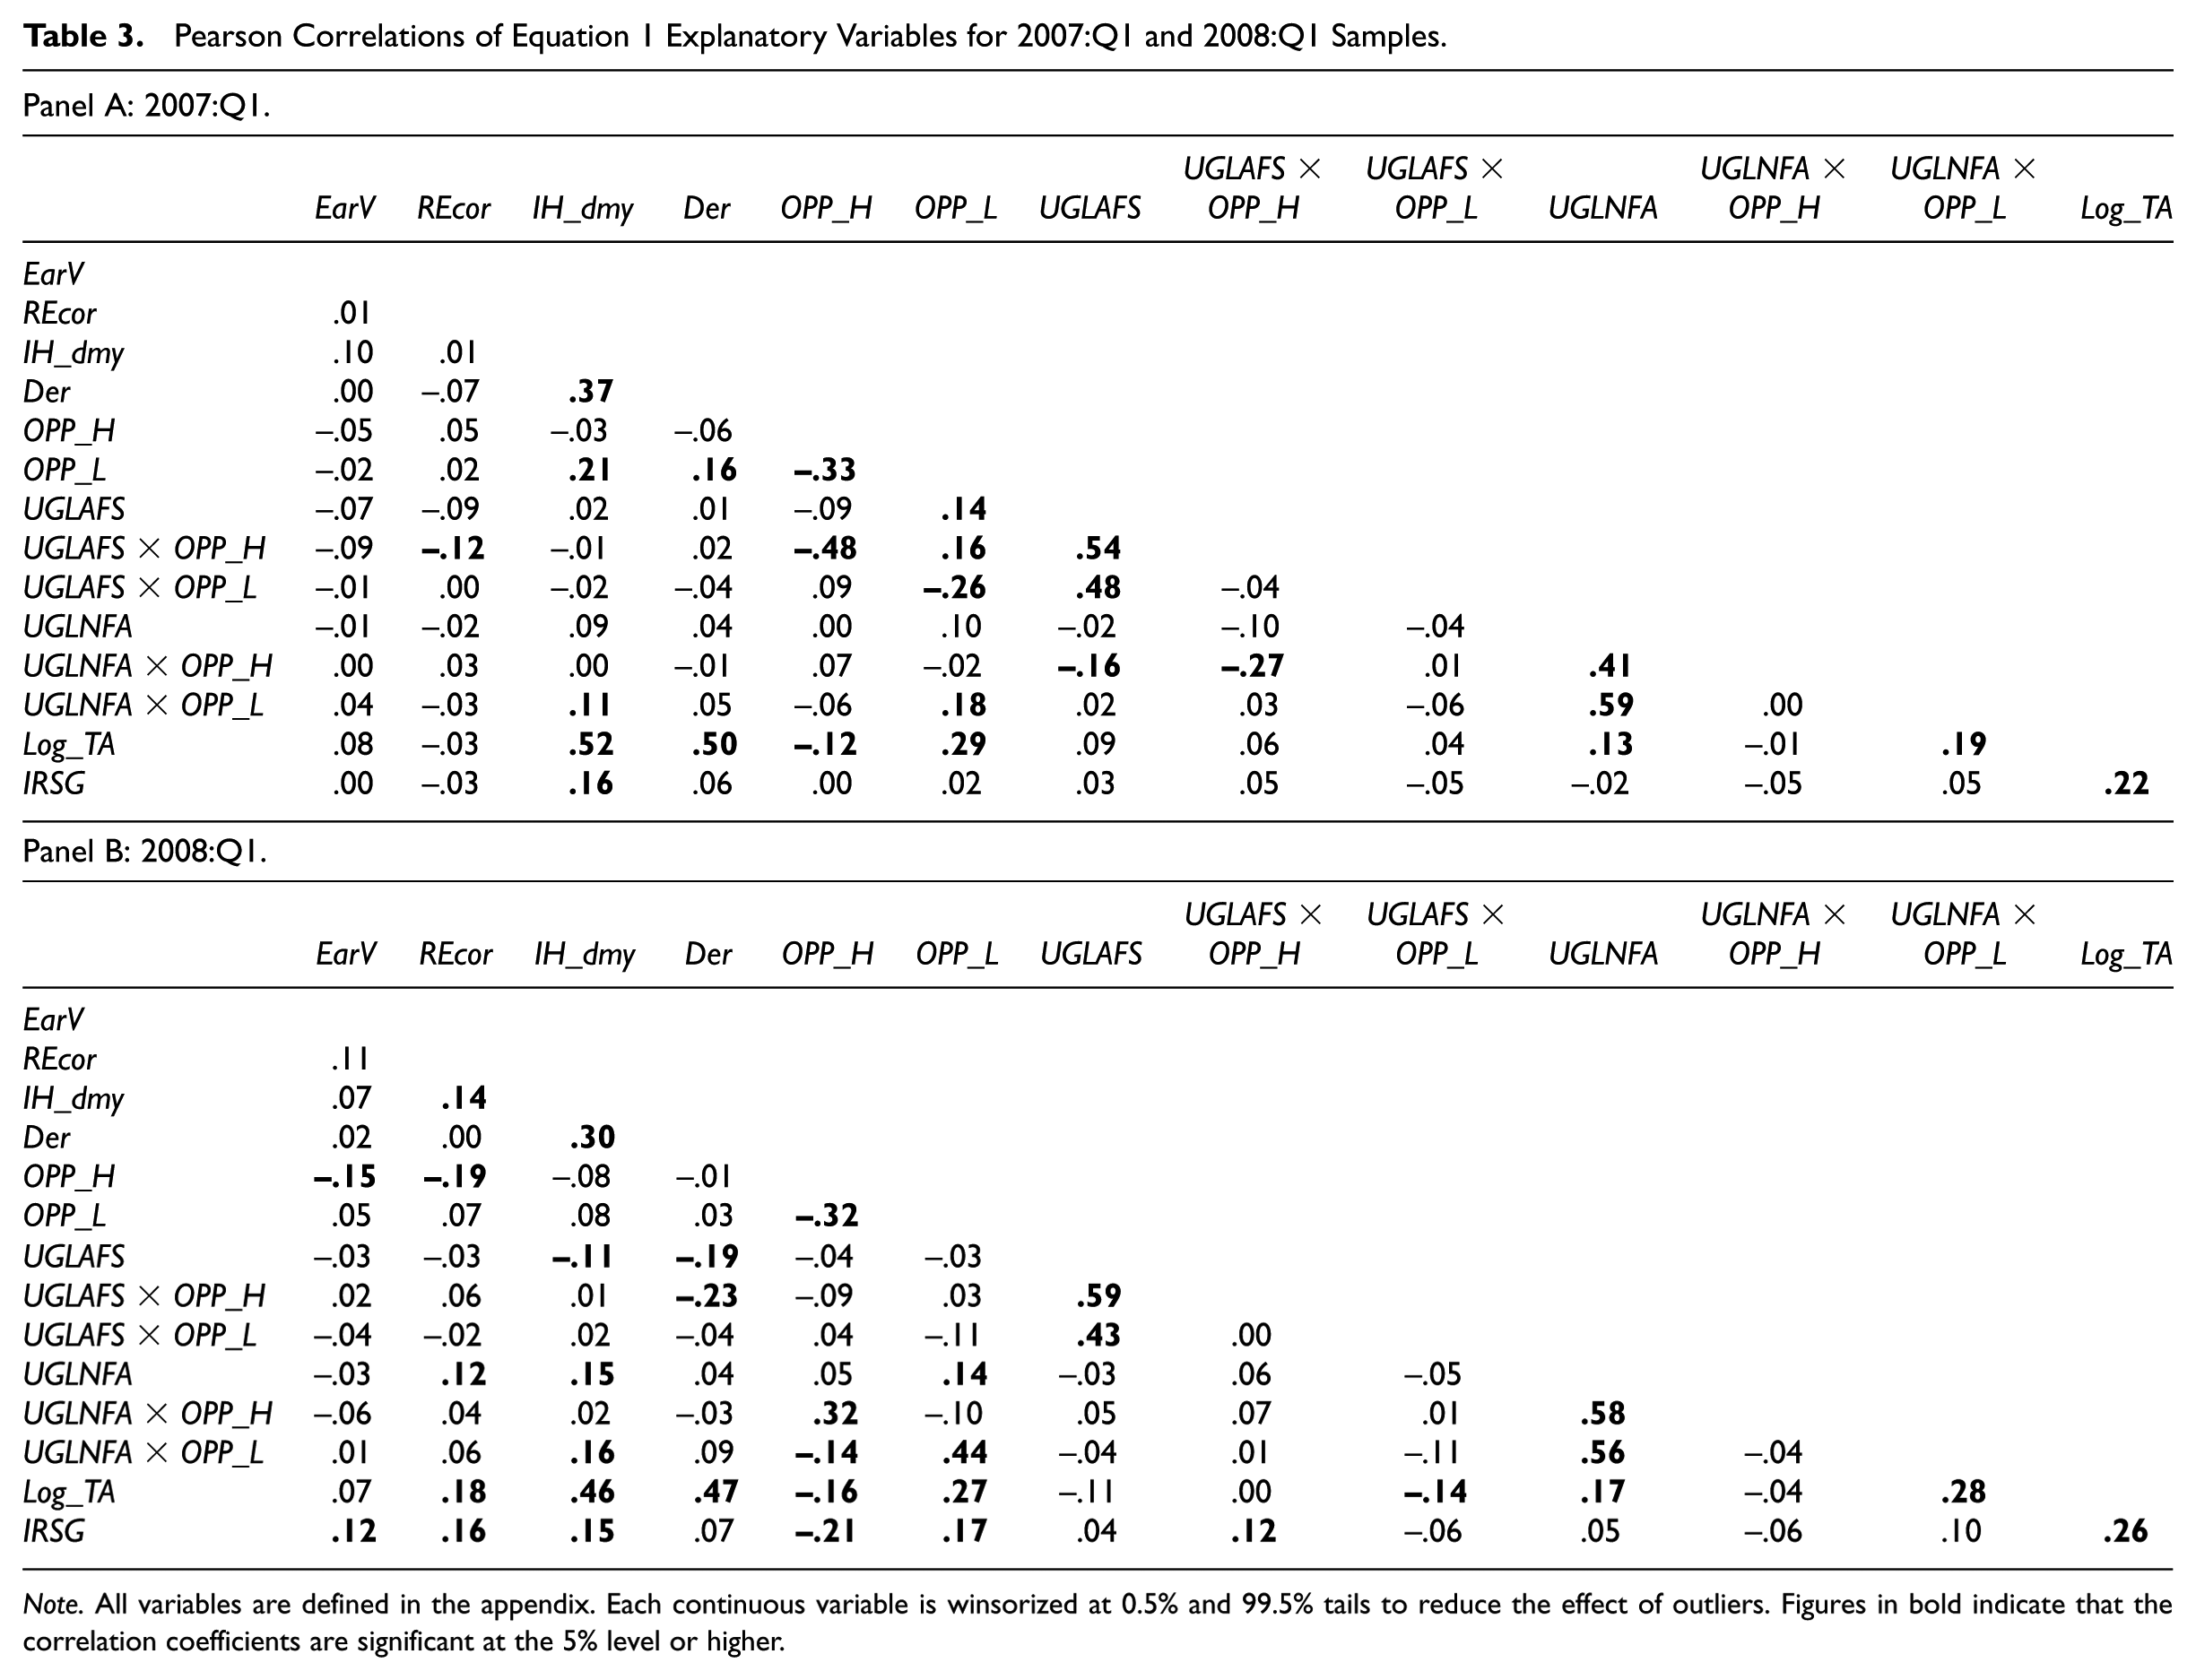
Note. All variables are defined in the appendix. Each continuous variable is winsorized at 0.5% and 99.5% tails to reduce the effect of outliers. Figures in bold indicate that the correlation coefficients are significant at the 5% level or higher.
Logistic Regression Estimations
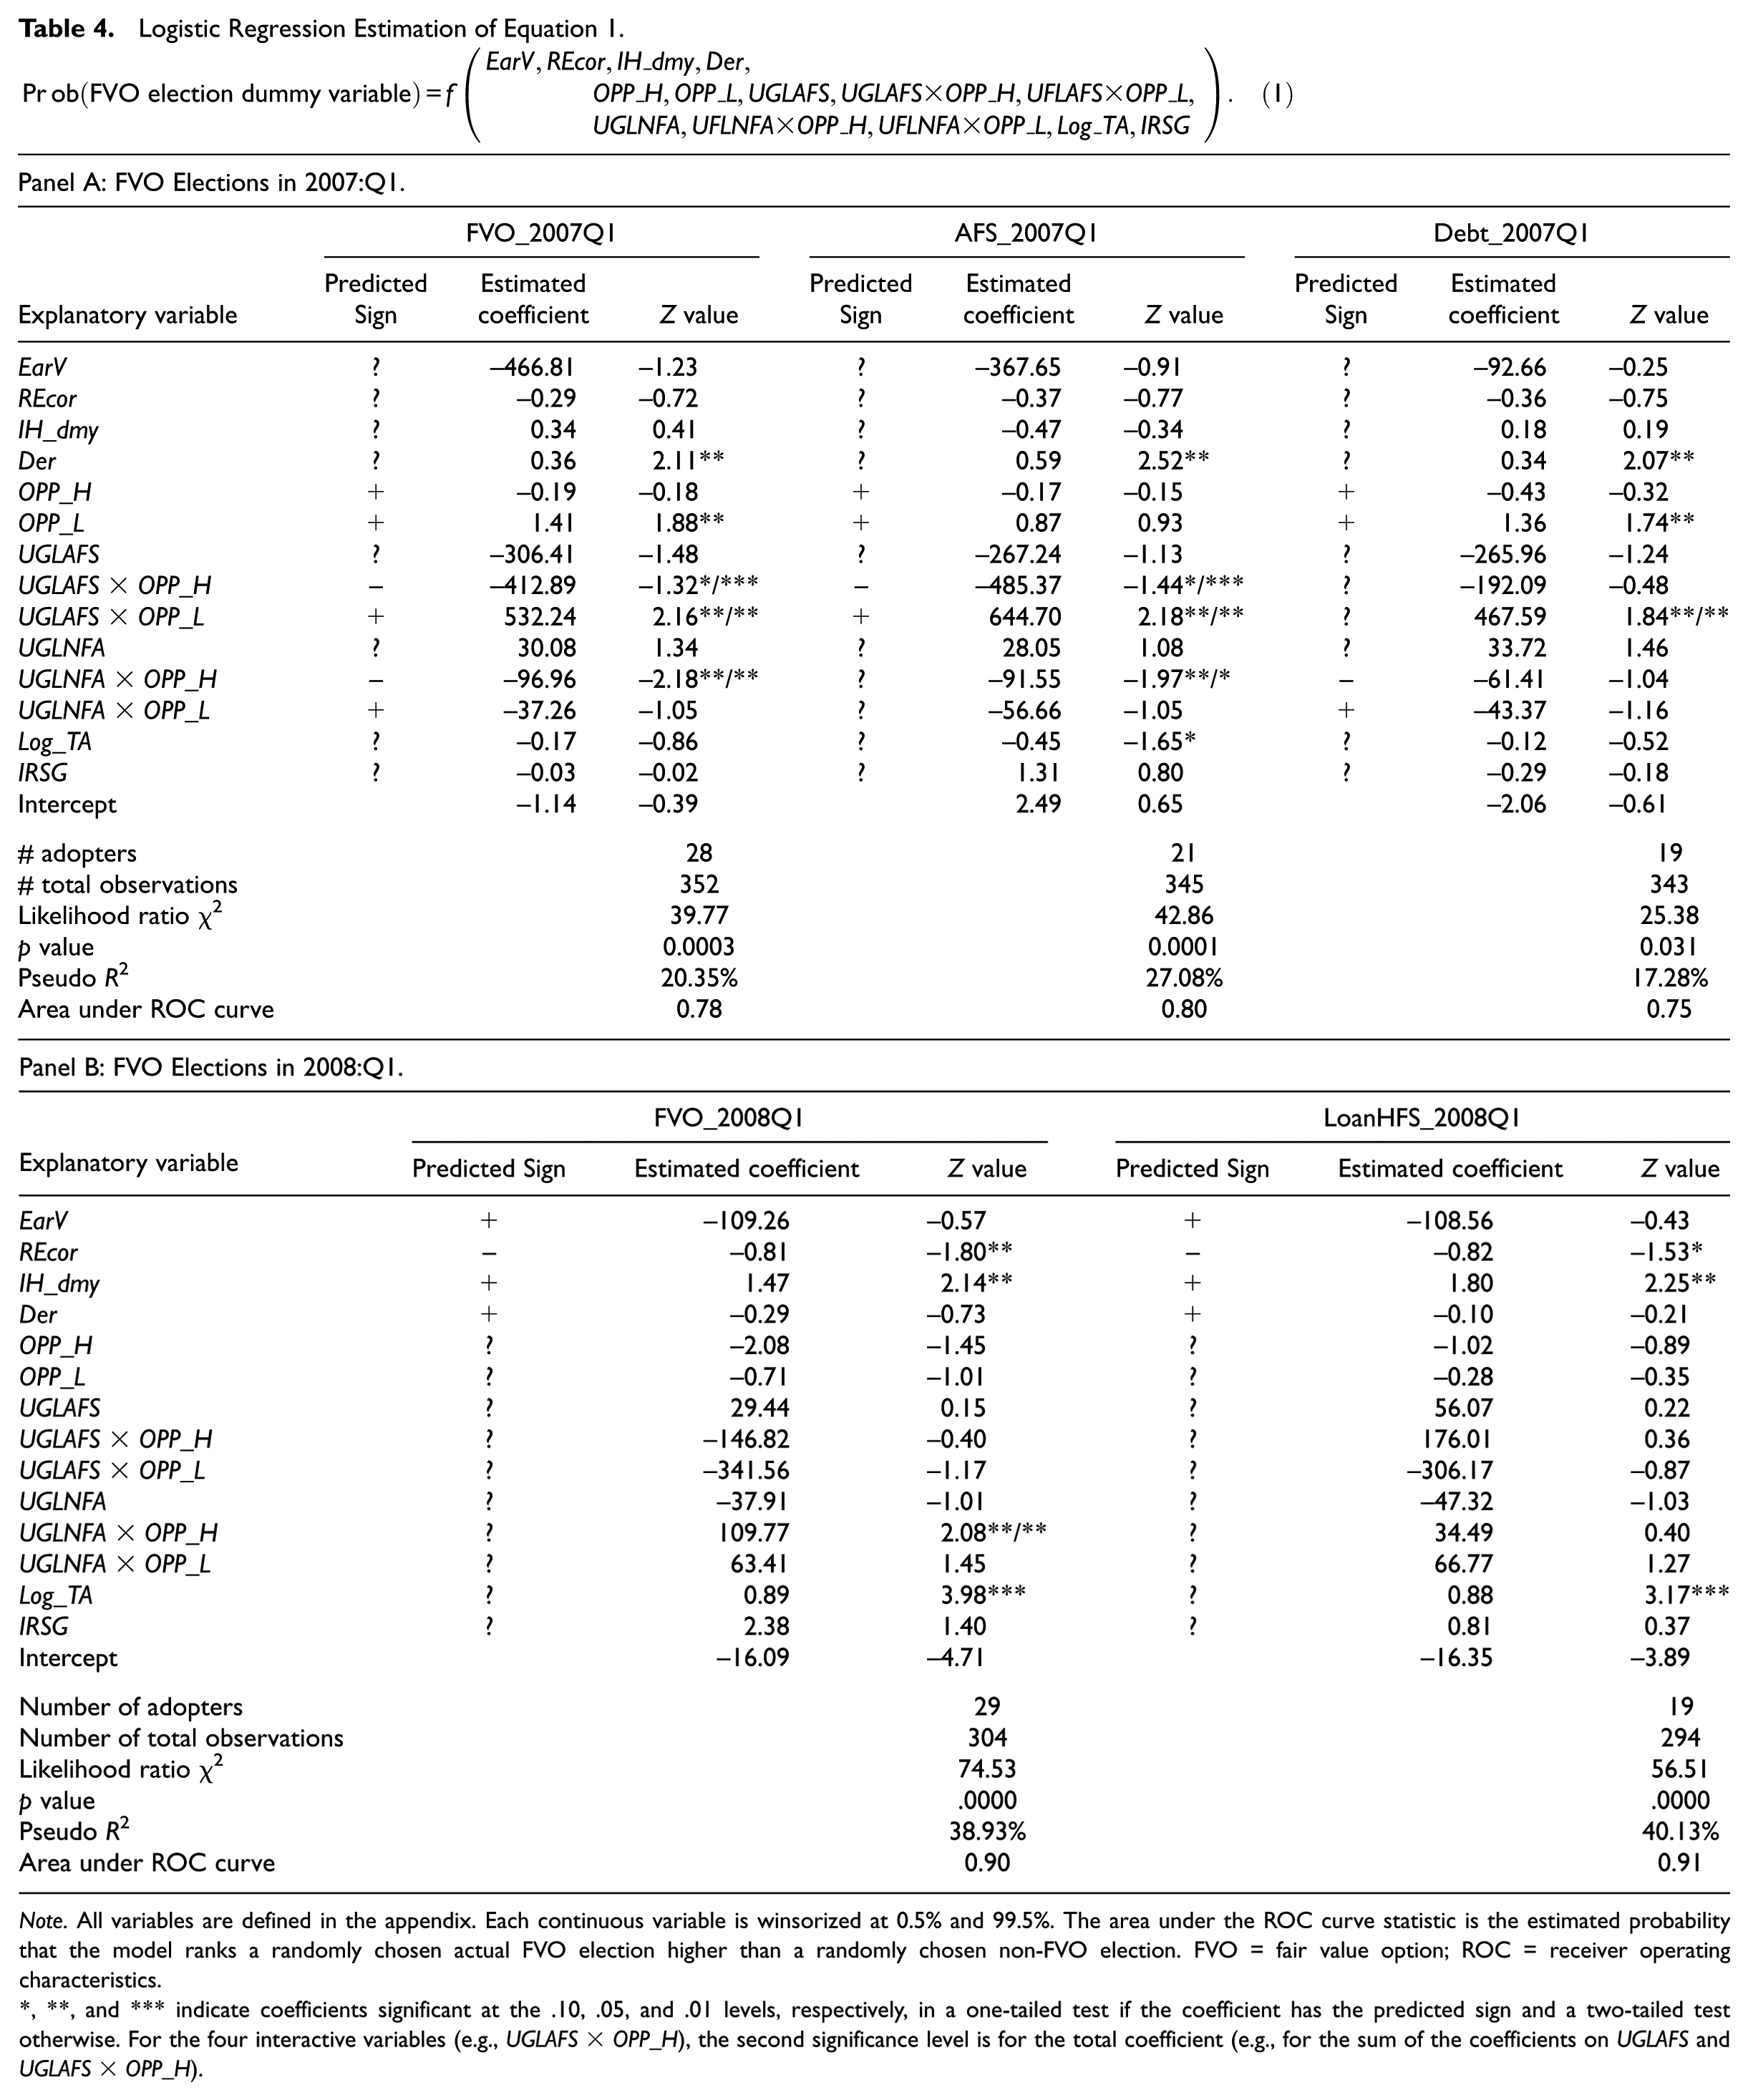
Table 4 reports the results of the logistic regression estimations of Equation 1. Panel A reports the results for the 2007:Q1 sample with the dependent variables FVO_2007Q1 (the leftmost set of columns), AFS_2007Q1 (the center set of columns), and Debt_2007Q1 (the rightmost set of columns). 24 Panel B reports the results for the 2008:Q1 sample with the dependent variables FVO_2008Q1 (the left set of columns) and LoanHFS_2008Q1 (the right set of columns). The goodness of fit of the estimated models is generally quite good. By Hosmer and Lemeshow’s ROC rules of thumb mentioned above, the models for early adopters range from the upper end of adequate to the lower end of excellent, while the models for regular adopters are all excellent.
Logistic Regression Estimation of Equation 1.
Note. All variables are defined in the appendix. Each continuous variable is winsorized at 0.5% and 99.5%. The area under the ROC curve statistic is the estimated probability that the model ranks a randomly chosen actual FVO election higher than a randomly chosen non-FVO election. FVO = fair value option; ROC = receiver operating characteristics.
, **, and *** indicate coefficients significant at the .10, .05, and .01 levels, respectively, in a one-tailed test if the coefficient has the predicted sign and a two-tailed test otherwise. For the four interactive variables (e.g., UGLAFS×OPP_H), the second significance level is for the total coefficient (e.g., for the sum of the coefficients on UGLAFS and UGLAFS×OPP_H).
The coefficients on the four interactive variables (UGLAFS×OPP_H, UGLAFS×OPP_L, UGLNFA×OPP_H, UGLNFA×OPP_L) reflect the incremental effects of those variables beyond the effects of the uninteracted cumulative unrealized gain variables (UGLAFS and UGLNFA). For example, the coefficient on UGLAFS×OPP_H reflects the incremental effect of that variable beyond the effect of UGLAFS. Hence, Table 4 also reports significance levels for the total coefficients, for example, the sum of the coefficients on UGLAFS and UGLAFS×OPP_H. With one minor exception noted below, the two sets of significance levels yield identical inferences, so we discuss only the first set.
In panel A, the only accounting mismatch variable that is reliably associated with early adopters’ FVO elections is Der, the coefficient on which is significantly positive for all three dependent variables. Hence, banks that used derivatives more intensively were more likely to be early adopters. The explanatory power of Der likely is in part attributable to size-related effects, however, because of the high correlation of Der and Log_TA reported in Table 3, panel A. We discuss this correlation further below. Overall, these results provide minimal evidence that early adopters’ FVO elections adhered to SFAS No. 159’s intent.
In contrast, many of the opportunism variables are significant in panel A, consistent with our hypotheses regarding early adopters’ opportunistic behavior. There is evidence that early adopters with histories of managing accounting numbers and high regulatory capital (OPP_H = 1) elected the FVO for AFS securities and possibly other financial instruments with cumulative unrealized losses to increase future net income, consistent with H1 and H4. Specifically, the coefficient on UGLAFS×OPP_H is significantly negative at the 10% level for the models with dependent variables FVO_2007Q1 and AFS_2007Q1. The coefficient on UGLNFA×OPP_H is significantly negative for the models with dependent variables FVO_2007Q1 and AFS_2007Q1, although the significance level of the total coefficient in the model with the latter dependent variable is only 10%.
Consistent with H2 and H4, panel A also reports evidence that early adopters with histories of managing accounting numbers and low regulatory capital (OPP_L = 1) elected the FVO for AFS securities, debt, and possibly other financial instruments with cumulative unrealized gains to increase regulatory capital. Specifically, the coefficient on UGLAFS×OPP_L is significantly positive for the models with each of the three dependent variables. In addition, the coefficient on OPP_L is significantly positive for the models with the dependent variables FVO_2007Q1 and Debt_2007Q1. Our findings that early adopters opportunistically elected the FVO for debt and possibly other financial instruments with cumulative unrealized gains to raise regulatory capital are new given the FVO literature.
The control variables generally are insignificant. Unexpectedly given the findings of the FVO literature, the coefficient on Log_TA is consistently negative. The reason for this difference with the results in the FVO literature is the high positive correlation of Log_TA and Der mentioned earlier. If we exclude Der from the model or replace it with a dichotomous dummy variable for derivatives use, then the coefficient on Log_TA becomes positive. While some of the papers in the FVO literature control for derivatives use, they do so using a dummy variable that is less positively correlated with firm size than Der.
In panel B, regular adopters’ FVO elections are associated in the predicted directions with both REcor and IH_dmy, consistent with H3 and H5. The coefficient on REcor is significantly negative in the models with the dependent variables FVO_2008Q1 and LoanHFS_2008Q1, although only at the 10% level for the latter. The coefficient on IH_dmy is significantly positive in the models with both dependent variables. We view the significant coefficients on these variables as compelling evidence that regular adopters complied with SFAS No. 159’s intent. Compared with Der, the only accounting mismatch variable significant in explaining early adopters’ FVO elections, REcor more directly reflects accounting mismatches for economic hedges and IH_dmy more directly reflects problems in applying hedge accounting.
In contrast to the results for early adopters in panel A, the only opportunism variable that is significant for regular adopters in panel B is UGLNFA×OPP_H in the model with dependent variable FVO_2008Q1.
FVO Elections After 2008
SFAS No. 159 allows firms to elect the FVO for financial instruments that exist at early adoption date or the effective date (i.e., January 1, 2007, for our early adopters and January 1, 2008, for our regular adopters). Specifically, when initially adopting the FVO in 2007:Q1 (early adopters) or 2008:Q1 (regular adopters), firms could elect the FVO for any recognized financial instrument they held. As discussed in the “SFAS No. 159, Hypotheses, and the FVO Literature” section, this free choice along with the standard’s transition guidance allows firms to make opportunistic FVO elections in the initial adoption period.
However, the free choice and the transition guidance are exclusively for firms initially adopting the FVO in 2007:Q1 or 2008:Q1. Since then, firms may only elect the FVO at the inception of financial instruments or when certain specified events trigger a new basis of accounting for those instruments, such as business combinations or consolidation. Considering that firms generally acquire financial instruments at fair value, the FVO elections at the inception of financial instruments have no immediate effects on their accounting or regulatory capital numbers. For this reason, it is essentially impossible for firms to make FVO elections to manage the current levels of accounting or regulatory capital numbers after the initial adoption period, 2007:Q1 or 2008:Q1. Of course, the volatility of firms’ accounting and regulatory capital numbers in future periods will inevitably be affected by the immediate recognition of unrealized gains and losses as they occur on the FVO-elected financial instruments.
Our findings for regular adopters should apply a fortiori to all banks’ FVO elections after 2008 because various provisions of SFAS No. 159 make it essentially impossible to manage accounting or regulatory capital numbers through FVO elections after the period of initial adoption. In an attempt to show this, we hand-collected data on banks’ FVO elections after the first quarter of 2008. Taking the same approach described in the “Sample, Data, Variables, and Models” section, we used keywords to search banks’ Form 10-Q and 10-K filings from 2008:Q2 to 2010:Q4, and identified 14 new adopters that did not apply the FVO prior to 2008:Q1. While the small number of new adopters limits statistical analysis of their incentives to adopt the FVO, we examined their FVO disclosures to explore more insights. Specifically, we find that all but three new adopters elected the FVO exclusively for loans held for sale, which presumably reflected compliance with SFAS No. 159’s intent as evidenced by the support of our H5. We also find that none of the new adopters elected the FVO for AFS securities, which likely reflected opportunism as evidenced by the support of our H4. The above findings suggest that banks’ FVO elections after the period of initial adoption are similar to those in 2008:Q1.
Specification Analyses
We conducted a number of specification tests of Equation 1 to ensure the robustness of our results. First, for the estimations involving FVO elections for AFS securities and debt in 2007:Q1 as well as loans held for sale in 2008:Q1, we included the prior balance of the corresponding instrument divided by total assets to ensure that the amount of the instruments did not drive the FVO election. The coefficients on all three variables are insignificant.
Second, instead of the dichotomous hedge ineffectiveness variable, IH_dmy, we used a continuous measure of hedge ineffectiveness, the absolute value of net hedge ineffectiveness gains and losses. We do not use this continuous measure in our main results because it nets hedge ineffectiveness gains against ineffectiveness losses. A firm with higher gross hedge ineffectiveness may have lower net ineffectiveness and vice versa. For this reason, this measure, even though continuous, is more limited than IH_dmy in our view. Consistent with this view, the coefficient on the continuous measure of hedge ineffectiveness has the same sign as the one on our binary measure but is insignificant.
Third, as in the FVO literature, we used a dichotomous dummy variable for derivatives use instead of our continuous measure, Der. As discussed previously, the use of this dummy variable loads the effect of derivatives use on our size variable, but it has no other noticeable effects on the model.
Fourth, instead of total assets, we deflated our continuous variables by share price or book value of owners’ equity. We also tried alternative deletion and winsorization rules within the usual range. Our results are not qualitatively affected either by choices of deflator or by treatment of outliers. Fifth, given the insignificance of EarV in all models, we deleted this variable from the models, finding no appreciable effect on any coefficient in any model.
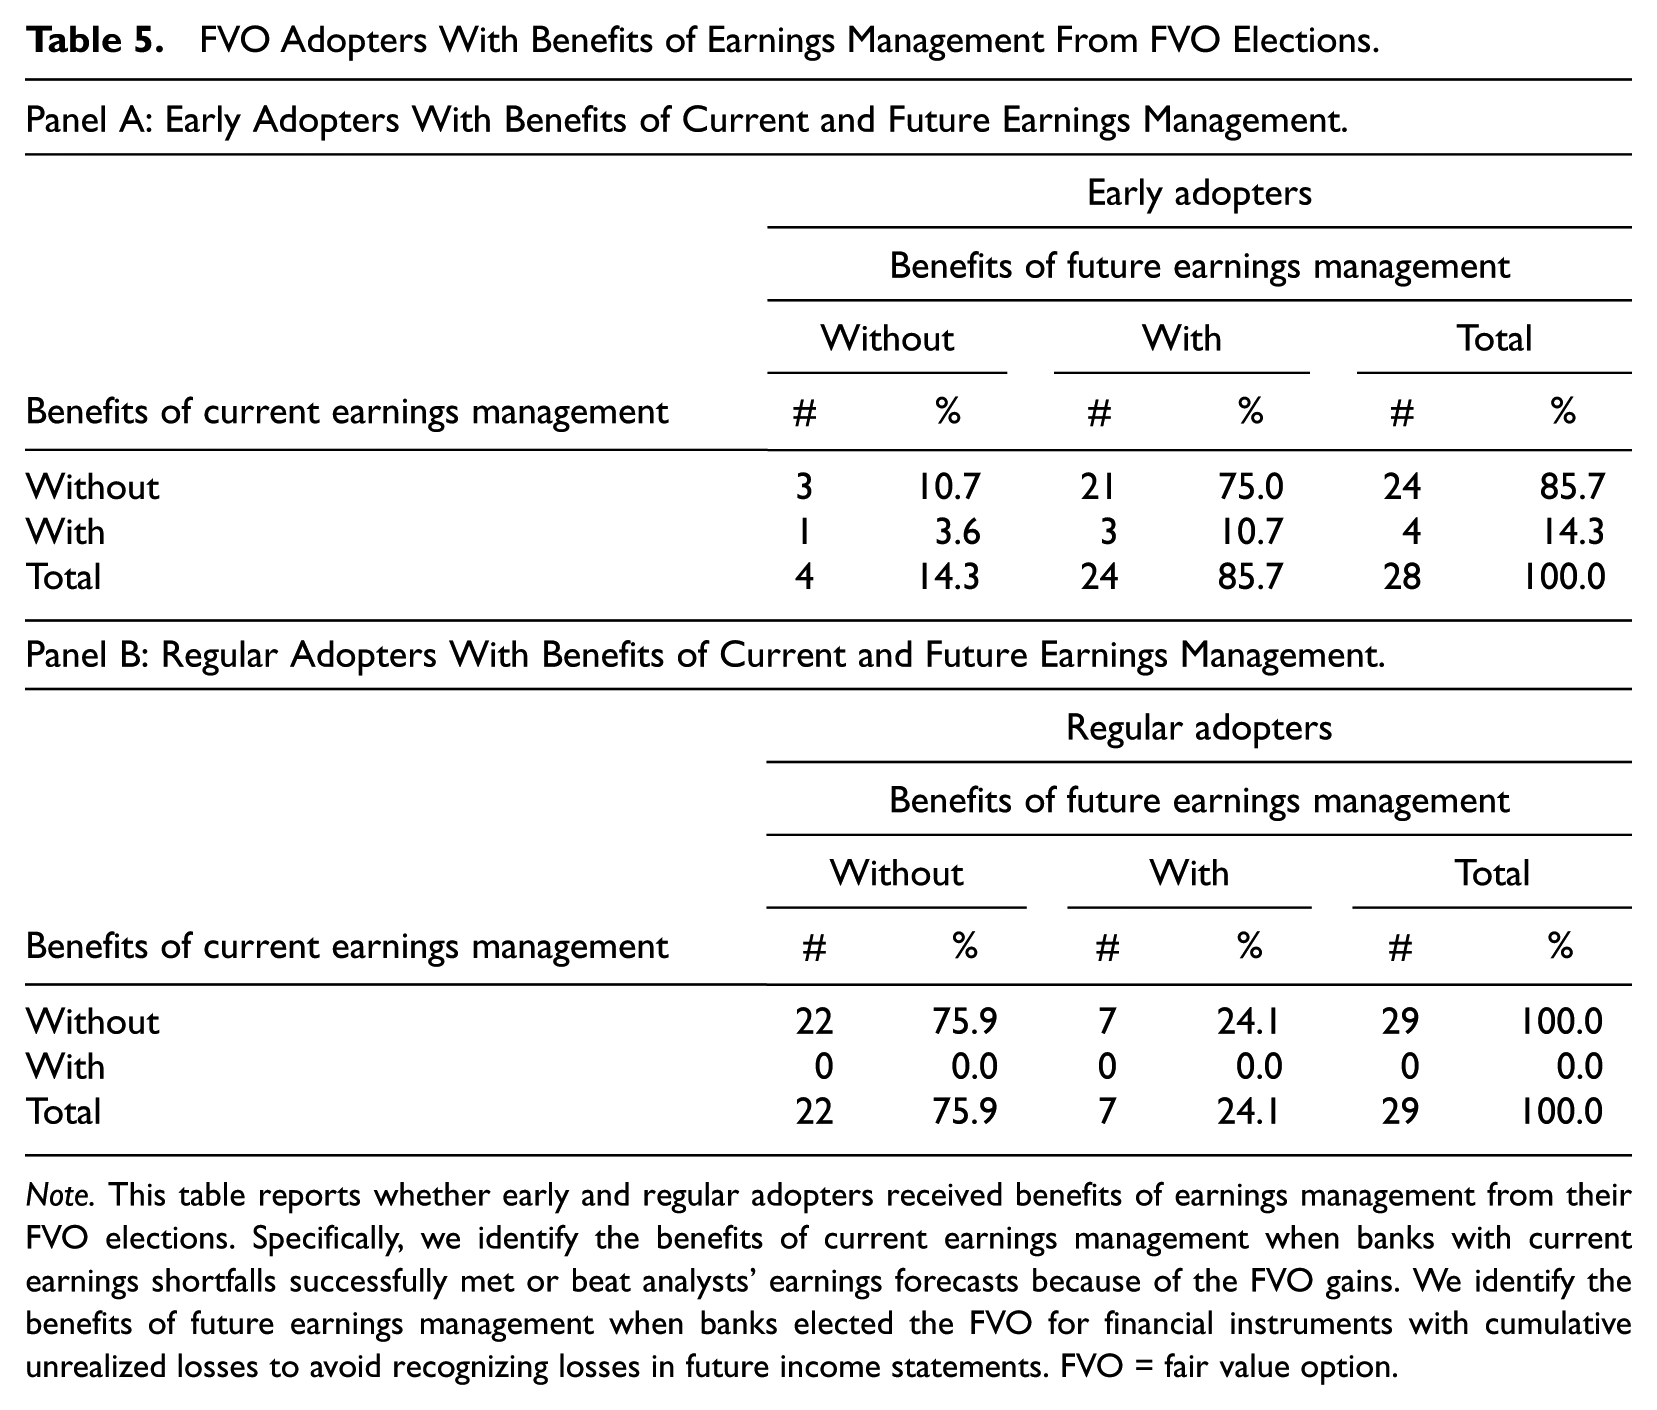
Finally, to provide more evidence of banks’ opportunistic behavior, we conduct supplementary tests to examine whether adopters receive benefits of earnings management from their FVO elections. Following Guthrie et al. (2011), we investigate whether banks with current earnings shortfalls successfully meet or beat analysts’ earnings forecasts because of the FVO gains, which we refer to as the benefits of current earnings management. We also examine whether banks elect the FVO for financial instruments with cumulative unrealized losses to avoid recognizing losses in future income statements, which we refer to as the benefits of future earnings management. As reported in Table 5, we find that four early adopters (14.3%) successfully met or beat analysts’ earnings forecasts because of the FVO gains. In addition, 24 early adopters (85.7%) recorded negative transition adjustments to shift unrealized losses to retained earnings, which facilitates loss avoidance in future income statements. 25 Collectively, we find that 25 early adopters (89.3%) were benefited from either current or future earnings management, 26 but only seven regular adopters (24.1%) achieved similar benefits. We interpret these findings as further evidence for early adopters’ exploitation of SFAS No. 159’s transition guidance. If regular adopters had intentionally elected the FVO for opportunistic purpose, the percentage should have been higher.
FVO Adopters With Benefits of Earnings Management From FVO Elections.
Note. This table reports whether early and regular adopters received benefits of earnings management from their FVO elections. Specifically, we identify the benefits of current earnings management when banks with current earnings shortfalls successfully met or beat analysts’ earnings forecasts because of the FVO gains. We identify the benefits of future earnings management when banks elected the FVO for financial instruments with cumulative unrealized losses to avoid recognizing losses in future income statements. FVO = fair value option.
Conclusion
In this study, we examine banks’ accounting policy choices during the financial crisis where they are strongly motivated to manage earnings or regulatory capital. In particular, we investigate why banks elected SFAS No. 159’s FVO upon their initial adoption of the standard, and whether the reasons differed for early adopters versus regular adopters as well as across banks’ FVO elections for different types of financial instruments. We hypothesize and provide evidence that early adopters behaved opportunistically in more varied ways than the FVO literature shows. Specifically, we refine or explain the FVO literature’s findings regarding early adopters in three ways. First, banks with histories of income smoothing through the realization of gains and losses on AFS securities were more likely to make opportunistic FVO elections, indicating the importance of distinguishing banks on their histories of managing accounting numbers. Second, we show that early adopters’ opportunistic FVO elections for financial instruments with cumulative unrealized losses were restricted to above-median banks that were willing to take the hit to regulatory capital. In contrast, early adopters with below-median regulatory capital elected the FVO for financial instruments with cumulative unrealized gains. Third, we find that early adopters most frequently elected the FVO for AFS securities and debt, which were both amenable to the exploitation of SFAS No. 159’s transition guidance and likely to create accounting mismatches.
In addition, we hypothesize and provide evidence that regular adopters’ FVO elections complied with the standard’s stated intent rather than exploited its transition guidance. In particular, we find that regular adopters’ FVO elections were associated greater accounting mismatches as proxied by prior accounting hedge ineffectiveness as well as low returns-earnings correlations. We further find that regular adopters most frequently elected the FVO for loans held for sale, a financial instrument for which accounting hedges commonly exhibit significant ineffectiveness or cannot qualify for hedge accounting and for which it is impossible to exploit SFAS No. 159’s transition guidance to increase future net income. Collectively, our results complement and add new insights to the FVO literature by indicating that regular adopters elected the FVO, particularly for loans held for sale, to remedy accounting mismatches for the two sides of economic hedges.
Our findings suggest that any evaluation by the FASB of the merits of SFAS No. 159’s FVO relative to the alternative of hedge accounting should not dwell on early adopters’ opportunistic behavior. In fact, SFAS No. 159’s FVO exhibits three features—election at inception only, irrevocability, and application to whole financial instruments, not selected risks—that make it less amenable to the management of accounting or regulatory capital numbers. Although paragraph A3 of SFAS No. 159 indicates that the FASB “views the fair value option as an interim step that can mitigate existing reporting issues and expand the use of fair value measurements for financial instruments,” the current summary of the status of the FASB’s project on the accounting for financial instruments on the FASB website indicates that this accounting will continue to employ mixed measurement attributes for the foreseeable future.
Two other U.S. accounting standards allow FVOs for specific items, SFAS No. 155, Accounting for Certain Hybrid Financial Instruments—an amendment of FASB Statements No. 133 and 140, for hybrid financial instruments, and SFAS No. 156, Accounting for Servicing of Financial Assets—an amendment of FASB Statement No. 140, for servicing rights. Hybrid financial instruments and servicing rights both contain hard-to-hedge embedded options that are similar to the hedging difficulties for loans held for sale discussed in this article. We predict that our findings for regular adopters apply to these FVO elections.
Various other accounting standards contain exploitable transition guidance. For example, the modified retrospective approach to adopting SFAS No. 123(R), Share-Based Payment, allows compensation costs that had not been recognized in net income in prior years to be recorded in retained earnings. Our findings suggest that whether and how firms exploit such transition guidance depends on their histories of managing accounting numbers and other relevant firm characteristics.
Footnotes
Appendix
Acknowledgements
The authors are grateful to accounting seminar participants at Dartmouth College, Duke University, National Chengchi University, National Taiwan University, Texas A&M University, and Washington University in St. Louis, particularly Anwer Ahmed, Gauri Bhat, and Mary Lea McAnally, for useful comments.
Declaration of Conflicting Interests
The author(s) declared no potential conflicts of interest with respect to the research, authorship, and/or publication of this article.
Funding
The author(s) disclosed receipt of the following financial support for the research, authorship, and/or publication of this article: This work was financially supported by the Center for Research in Econometric Theory and Applications (Grant no. 107L900202, 108L900202) from The Featured Areas Research Center Program within the framework of the Higher Education Sprout Project by the Ministry of Education (MOE) in Taiwan. Chi-Chun Liu acknowledges research support from the Ministry of Science and Technology, R.O.C (grant no. 97-2410-H-002-048-MY3,107-3017-F-002-004).