
Abstract
We examine the 52-week anchoring effect in the Indian takeover market that has a unique regulatory design. The Indian takeover regulation mandates the minimum offer price to be function of the target’s 26-week or 60-day high price. We show that the 52-week anchoring effect is robust even in the face of other regulatory anchors that differ from the widely cited 52-week high price. The anchoring effect dominates when the offer price exceeds the 52-week high price. Regulatory intervention in 2011 that shifts the floor price to a recent market price, such as the 60-day high price, does not attenuate the 52-week anchoring effect. We infer that acquirers are willing to pay a higher premium while anchoring to the 52-week high price, even when the regulatory focus is on lower reference prices. Besides, regulatory anchors also serve as additional focal points, demonstrated by the significance of the 26-week high price during its own period of regulation (2002-2011).
Introduction
A target’s 52-week high price has a strong influence on offer premiums (Baker, Pan, & Wurgler, 2012). Using a sample of 169 tender offers spanning the period 2002-2014, we examine the 52-week anchoring effect in the Indian takeover market, which has a unique regulatory design. The Securities and Exchange Board of India (SEBI) takeover regulation, known as Substantial Acquisition of Shares and Takeovers (SAST) 1997, 1 with amendments in 2002 and 2011, mandates the minimum offer price to be a function of the target’s 26-week (or 2-week) high price (SEBI, 2002) and 60-day average price (SEBI, 2011). Indian takeover regulation uses regulatory anchors that differ from the widely cited 52-week high price. Therefore, India offers a unique and natural setting to examine whether the 52-week anchoring effect persists in the face of other regulatory anchors.
Several studies suggest that complex considerations 2 in merger and acquisition (M&A) negotiations cause fixation of the offer premium to be driven by anchors and reference points. The 52-week high price is an influential anchor due to its wide use and availability in the popular media and press. Bidders and targets justify the 52-week high anchor because they expect prospective synergies to surpass previous stock market highs. This 52-week anchoring effect is ubiquitous in various M&A markets around the world, including the United States (Baker et al., 2012; Chira & Madura, 2015; Ma, Wang, & Zhang, 2017), Europe (Niinivaara, 2010), Japan, and Russia (Stepanova, Savelyev, & Shaikhutdinova, 2018). Hence, given the setting of the Indian takeover regulation, we provide evidence beyond simply testing the efficacy of the 52-week anchoring effect as a global phenomenon, for several reasons.
First, with introduction of minimum offer price into the setting, there are multiple anchors in determining the offer price of the target, that is, mandated regulatory prices and the 52-week high price, widely discussed in the literature. Such a regulatory design makes it interesting to explore whether the 52-week anchoring effect is robust, over and above regulatory-induced anchors. In other words, this setting allows us to examine whether investors are willing to pay a higher premium by anchoring to the 52-week high price, while the regulator explicitly guides them with reference prices lower than (or equal to) the 52-week high price.
Second, the SAST regulation was amended in 2011 to account for a recent market price, the 60-day high price, while setting the minimum offer price. This legislative amendment provides a basis to test the impact of an exogenous regulatory intervention that shifts the focus from 26-weeks to a recent 60-day market price, on the 52-week anchoring effect. Third, note that some 3 regulatory anchors, the 26-week and 60-day high prices, are a subset of the 52-week high price, resulting in a scenario where anchoring to the 52-week high price could be due to mandated regulatory prices themselves. Therefore, we compute extent of anchoring (Extentit), defined as the difference between target’s 52-week high price and its respective regulatory prices mandated in SEBI SAST regulation, that is, the 26-week high price until 2011 and the 60-day high price until 2014. In this manner, we eliminate the confounding effects of other regulatory prices that are a subset of the 52-week high price, and we document the distinct effect of anchoring to the target’s 52-week high price, over and above other regulatory anchors.
In addition, the Indian setting allows us to investigate the salience of regulatory prices as anchors themselves, because these prices are mandated as part of regulation, unlike the widely discussed 52-week high price. For example, do regulatory prices, 26-week (or 2-week) and 60-day high price, prove to be significant regulatory anchors during 2002-2011 and 2011-2014 period respectively? Significance of regulatory prices during the mandated periods of regulation would establish the impact of being specified as a regulatory benchmark.
Our article contributes to three important areas in the finance literature. First, we contribute to the M&A literature and complement prior studies (Baker et al., 2012; Chira & Madura, 2015; Niinivaara, 2010 and more) that provide evidence on the 52-week anchoring effect in M&A markets around the world. Second, we contribute to regulation and governance literature, and provide new evidence that the 52-week anchoring effect persists even in the face of different regulatory anchors. Hence, we believe the scope of this study goes beyond simply testing the efficacy of the 52-week anchoring effect as a global phenomenon. Finally, our findings complement other studies in behavioral corporate finance that establish the 52-week high price as an influential anchor among various firm decisions (Core & Guay, 2001; George, Hwang, & Li, 2018; Huddart, Lang, & Yetman, 2009).
Our main results are as follows. We show that the 52-week high price has positive and significant impact on offer premium, even after controlling for regulatory anchors such as the 26-week and 60-day high price, mandated in the Indian takeover regulation. The 52-week anchoring effect dominates only when the offer price exceeds the 52-week high price than when it is lower. This result supports the argument that if the bidders identify the importance of the 52-week high price as a reference price, they would probably decide to bid higher than the influential anchor to ensure deal success (Baker et al., 2012).
Next, we compute extent of anchoring, which explains the difference between the 52-week high price and its respective regulatory anchors, 26-week and 60-day high price, and find it to be positive and highly significant. The inference is that acquirers are willing to pay more (higher premium) due to anchoring to the 52-week high price, even when the regulator mandates a lower reference price of 26-weeks/60-days. This finding builds on Baker et al. (2012), as the key issue in the Indian setting is whether alternate regulatory anchors, which are a subset of the 52-week high price, mask the 52-week anchoring phenomenon. Moreover, the regulatory intervention in 2011 in shifting the floor price to a recent market price, the 60-day high price, does not attenuate the 52-week anchoring effect. These results provide robust evidence that 52-week anchoring persists even in the face of other regulatory anchors mandated in Indian takeover regulation. We further investigate the salience of regulatory prices, that is, 26-week, 2-week, and 60-day high prices, as anchors themselves, during their own period of regulation. Indeed, we find that regulatory anchors do serve as additional focal points, as demonstrated by the significance of 26-week and 2-week high price during their respective periods of regulation (2002-2011). Smaller sample of firms during 2011-2014 limit our ability to draw inferences about the regulatory anchors for that period.
We also examine alternative explanations to our main findings. A possible explanation for increased offer premium includes targets perceiving their firms as undervalued (Chira & Madura, 2015). Therefore, we calculate the distance of anchoring (Distance), defined as the difference between target 52-week high price and its current market price, to examine whether undervalued targets negotiate for larger offer premiums. Consistent with Chira and Madura (2015), we find a significant increase in offer premium when the target current stock price is distant from its 52-week reference price. We also conduct additional analysis by replacing the closing prices with adjusted closing prices. An interesting finding is that the 52-week anchoring effect is no longer significant with adjusted closing prices. This result suggests that when firms face drastic price changes due to major corporate actions such as stock splits, investors still anchor to the unadjusted 52-week high price that is widely reported in the media. Moreover, the SEBI regulation, with respect to the minimum offer price setting, simply mentions closing prices (unadjusted). We also find that the anchoring effect is not significant for regulatory anchors with adjusted closing prices.
The remainder of this article proceeds as follows. The “Regulatory Framework” section briefly discusses the relevance of the SEBI regulation, SAST 1997 (with amendments in 2002 and 2011). “Prior Literature and Hypothesis Development” section presents the relevant literature and develops testable hypotheses. “Data and Method” section discusses the sample and variables, and “Method” section describes our methodology. “Results” section presents empirical results, additional analysis, and robustness checks. Finally, “Conclusion” section concludes with suggestions for future research.
Regulatory Framework
The SEBI Regulation on Takeovers, 4 SAST 1997, mandates the minimum offer price for tender offer deals, to be function relevant market and nonmarket factors (SEBI, 1997b). We refer to the SEBI SAST regulations, 1997, with a second amendment in 2002, w.e.f. 9-9-2002, and a further amendment in 2011, w.e.f. 01-11-2011, due to data availability for the period 2002-2014. We interpret the SEBI (SAST) regulation 2002 and 2011 presented in Appendix A as follows.
First, the regulation stipulates a minimum level of offer price that is paid by an acquirer to whom the offer is being made. In the opinion of Justice P. N. Bhagwati Committee Report on Takeovers (SEBI, 1997), “laying down this minimum level of offer price is necessary to protect the interest of investors and not discordant with the free pricing regime.” Hence, the rationale for mandating a minimum offer price in India is that it provides a fair exit option to minority shareholders. 5 Second, the minimum price is a function of the higher of the weekly (daily) highs and lows of the closing prices during the 26-weeks (or 2-weeks) for SEBI (SAST) 2002, or the volume-weighted average market price for a period of 60 trading days in case of SEBI (SAST) 2011 preceding the date of public announcement. The regulation implies that among other (nonmarket) prices, past stock market price is also relevant in determining the minimum offer price because it covers events and market functions prior to public announcement for frequently traded stocks. Among nonmarket factors, the minimum offer price includes the price paid by the acquirer in negotiated transactions. Third, if the shares of the target company are infrequently traded, 6 the price would have to be approved by SEBI (1997a).
Therefore, the Indian takeover regulation includes peak stock market prices that the target has achieved over various horizons as regulatory anchors in setting the minimum offer price. Moreover, the amendment in 2011 indicates a shift to a more recent market price, that is, the 60-day price from the 26-week price in 2002. The rationale behind this regulatory intervention by SEBI in 2011 is to make the minimum offer price a function of the target’s recent market price that reflects the status of the target’s current management and business practices. Given this regulatory architecture, examining the 52-week high anchoring effect is both topical and relevant. We specifically attempt to examine whether the 52-week high anchoring effect is salient even in the face of other regulatory anchors. This research question becomes interesting as the regulatory prices, 26-week and 60-day high prices, are a subset of the 52-week reference price under study.
Prior Literature and Hypothesis Development
In financial markets, historical peak prices serve as influential anchors or reference points. For instance, Heath, Huddart, and Lang (1999); Core and Guay (2001); and Farrell, Krische, and Sedatole (2011) find a strong tendency for company executives and employees to exercise stock options when the underlying stock price moves past its 52-week high. Huddart et al. (2009) document that trading volume increases significantly whenever prices exceed the 52-week high and low prices. George and Hwang (2004) observe that investors use the 52-week high as an anchor to evaluate their profits from momentum, and Li and Yu (2012) show that the predictability of the Dow Jones Industrial Average is based on nearness to the index’s 52-week high price. George et al. (2018) find that significant post earnings announcement drift depends strongly on whether stock prices are near (far from) their 52-week highs when positive (negative) earnings surprises arrive. There are other studies that report the influence of historical peak prices on investor trading decisions (Barber & Odean, 2008; Barberis & Xiong, 2009; Grinblatt & Keloharju, 2001). These studies inform the decision maker’s tendency to set anchor or reference points with respect to stock price highs and lows. The motivation is explained in psychology as a common human tendency to rely on a salient or easily available reference value, then adjusting to arrive at a final estimate (Chapman & Johnson, 2002; Kahneman, 1992; Tversky & Kahneman, 1974). Yet adjustments are naturally insufficient, such that the final estimate is biased toward the salient initial value.
The role of anchors and reference points in decision making and its implications for negotiations are documented in several studies (Kahneman, 1992; Kristensen & Gärling, 1997; Neale & Bazerman, 1992). Although negotiators generally appraise an offer based on multiple characteristics, Orr and Guthrie (2005) show that focus on a single aspect as an anchor has a significant influence on the estimated value of the object. Baucells, Weber, and Welfens (2011) find that agents use recent, salient, concrete, and personally relevant information as a basis for forming and updating their reference points. Köszegi and Rabin (2006, 2007) argue that expectations about the future form the most natural reference point for valuing realized outcomes.
Motivated by this literature, we evaluate whether offer prices are significantly influenced by the target’s 52-week high price in tender offer deals. In this context, Baker et al. (2012) propose that if bidders identify the importance of the 52-week high price as a reference point, they might as well decide to bid slightly higher than the 52-week high price to ensure deal completion. Therefore, we hypothesize ex ante that the 52-week anchoring effect would be stronger for deals when the offer price is higher than the 52-week high price, in comparison with deals where the offer price is lower than the 52-week high price.
Moreover, testing the 52-week anchoring phenomenon in M&A is unique in the Indian context, due to regulatory requirements mandated in SEBI (SAST) takeover regulations. First, the Indian regulation mandates a minimum offer price, unlike other markets around the world. Second, the minimum offer price is a function of various historical peak market prices, that is, 26-week, 2-week, or 60-day high prices, as well as other nonmarket prices (negotiated offer price) relevant to the deal. Finally, an exogenous legislative amendment in 2011 shifted the regulatory anchor from 26-week high price to a recent 60-day market price, thus providing a natural setting to test impact of the regulatory intervention on the 52-week anchoring effect. Given this background, we propose our first hypothesis, as follows:
It is apparent that the regulatory anchors, the 26-week and 60-day prices, are a subset of the 52-week high price, resulting in a scenario where anchoring to the 52-week high price can be confounded by regulatory anchors themselves. Hence, we specifically investigate whether anchoring to the 52-week high price persists when the 52-week high price is greater than alternate regulatory anchors that are specifically a subset of the 52-week high price, that is, 26-week and 60-day high price. Extending this argument, we define extent of anchoring as the difference between the 52-week high price and regulatory anchors during their respective periods of regulation, and formulate our second hypothesis, as follows:
Next, we investigate the prowess of regulatory prices as anchors themselves, as these prices are explicitly stated and mandated in regulation, unlike the more popular 52-week high price. In our sample, we have periods during which some regulatory prices are mandated, while others are nonmandated. That is, 26-week and 2-week high price is mandated during the 2002-2011 period, while 60-day high price is mandated during the 2011-2014 period. This allows us to examine the significance of 26-week and 2-week high price as regulatory anchors during the 2002-2011 period, while taking into account that 60-day high price is a subset of 26-week high price and is, moreover, a nonmandated price during that period. 7 This discussion leads to our third hypothesis, which addresses the impact of being specified as a regulatory anchor.
Targets whose current stock price is farther from its 52-week high reference price are likely to negotiate for higher premiums because they are perceived to be undervalued (Baker et al., 2012; Chira & Madura, 2015). That is, when the target’s current stock price is close to its 52-week high reference price, one could interpret that the market valuation is appropriate (not undervalued), leading to lower offer premiums. In fact, Chira and Madura (2015) find that bidder tendency to submit bids and offer success increases if target’s prevailing stock price is closer to its 52-week high, as bidders are expected to pay lower offer premiums. This discussion leads to our final hypothesis, as follows:
Data and Method
Sample
The data for our analysis are obtained from the SEBI takeover database and the Prowess database created by the Center for Monitoring Indian Economy Private Limited (CMIE), for the period 2002-2014. The takeover database on the SEBI website provides data on tender offers from April 1997. However, information on justification of the minimum offer price, such as the regulatory prices, can be inferred only from the letter of offers (LOFs) 8 filed by the acquirer and uploaded on the SEBI website. These documents are available on the SEBI website only from April 2002. 9 Moreover, the SEBI SAST regulations of 1997 underwent major amendments in 2002 and 2011 pertaining to offer price. Therefore, we restrict our period of study from April 2002 to March 2014 and hand-collect data pertaining to regulatory prices from LOFs filed by merchant banker with SEBI.
The total number of tender offers in our sample comprises of 885 deals for the period 2002-2014. This data set comprises of a set of variables such as, information about the tender offer, regulatory prices from SEBI SAST regulation, financial characteristics of the target firm, daily stock market prices of the target firm, and prices related to the market index, Sensex. Information on the tender offer includes names of the acquiring company and the target company, public announcement date and offer date, offer price, offer size, equity percentage, and objective of the offer. We use CMIE Prowess as our primary source for historical stock market prices and financial characteristics of target firms. The Prowess database forms the basis of several published empirical studies on the Indian corporate sector (e.g., Bertrand, Mehta, & Mullainathan, 2002; Khanna & Palepu, 2000; Sarkar & Sarkar, 2000; Siegel & Choudhury, 2012). We go about matching the firm names obtained from the SEBI website with the firm names in Prowess and include only those firms for which the name match is possible. 10 This specification leads to an intermediary sample of 280 tender offers. Furthermore, our study requires availability of traded prices over different time horizons, thus reducing the final sample size to 169 tender offers spanning the period 2002-2014. The final sample consists of those target firms that are frequently traded and that comprise the necessary financial data to conduct further analysis. The specific sample for the regression analysis varies with the hypothesis being tested, as well as other controls used in the analysis.
Variables
This section describes the dependent and independent variables used in this study. All variables are defined in Appendix B. The main dependent variable is Offerpremium, which is offer price scaled by the target’s 30-day lagged closing price prior to the date of public announcement. To calculate the 52-week high price, we consider a period between 30-days prior to the public announcement of open offers up to 365 calendar days. We find the highest market price within the 335-day window. Similarly, to calculate 26-week high price, we consider a window of 30 days to 180 calendar days prior to public announcement, and a window of 30 days until 60 calendar days prior to public announcement for calculating the 60-day high price. For computing the 2-week lagged market price, we consider the highest price in the 2 weeks–period prior to the date of public announcement. Following prior studies, we use target’s 30-day lagged closing price as a potential date for controlling rumors (Agrawal & Nasser, 2012; Baker et al., 2012; Keown & Pinkerton, 1981), as well as a scaling factor for potential heteroscedasticity. To calculate the 30-day closing price, we consider the 30- to 32-day window prior to the public announcement. This 30-day closing price is used to scale the offer price, the various market prices, and the regulatory prices to arrive at the premium. As the 30-day is a subset of the 26-week high and the 52-week high, the 30-day price is either smaller or equal to the 26-week or 52-week high price.
Descriptive statistics of dependent and independent variables are given in Table 1, panel A. The descriptive statistics show that some variables are positively skewed, that is, Offerpremium, 52weekhighprice, and other regulatory prices. A similar trend is observable in Extent variables. Therefore, we divide the sample into positive and negative premium samples, defined as deals with offer price greater than the 52-week high price and deals with offer price lower than the 52-week reference price, respectively. The descriptive statistics corresponding to the RegulatoryProxy show higher values, that is, above the third quartile, and the number of cases with RegulatoryProxy that equal MarketPrice is higher than nonmarket price. Furthermore, the first and third quartile and the median for SAST 2011 is 0, indicating that we have very few observations for the 2011-2014 period.
Panel A: Descriptive Statistics of Key Variables.
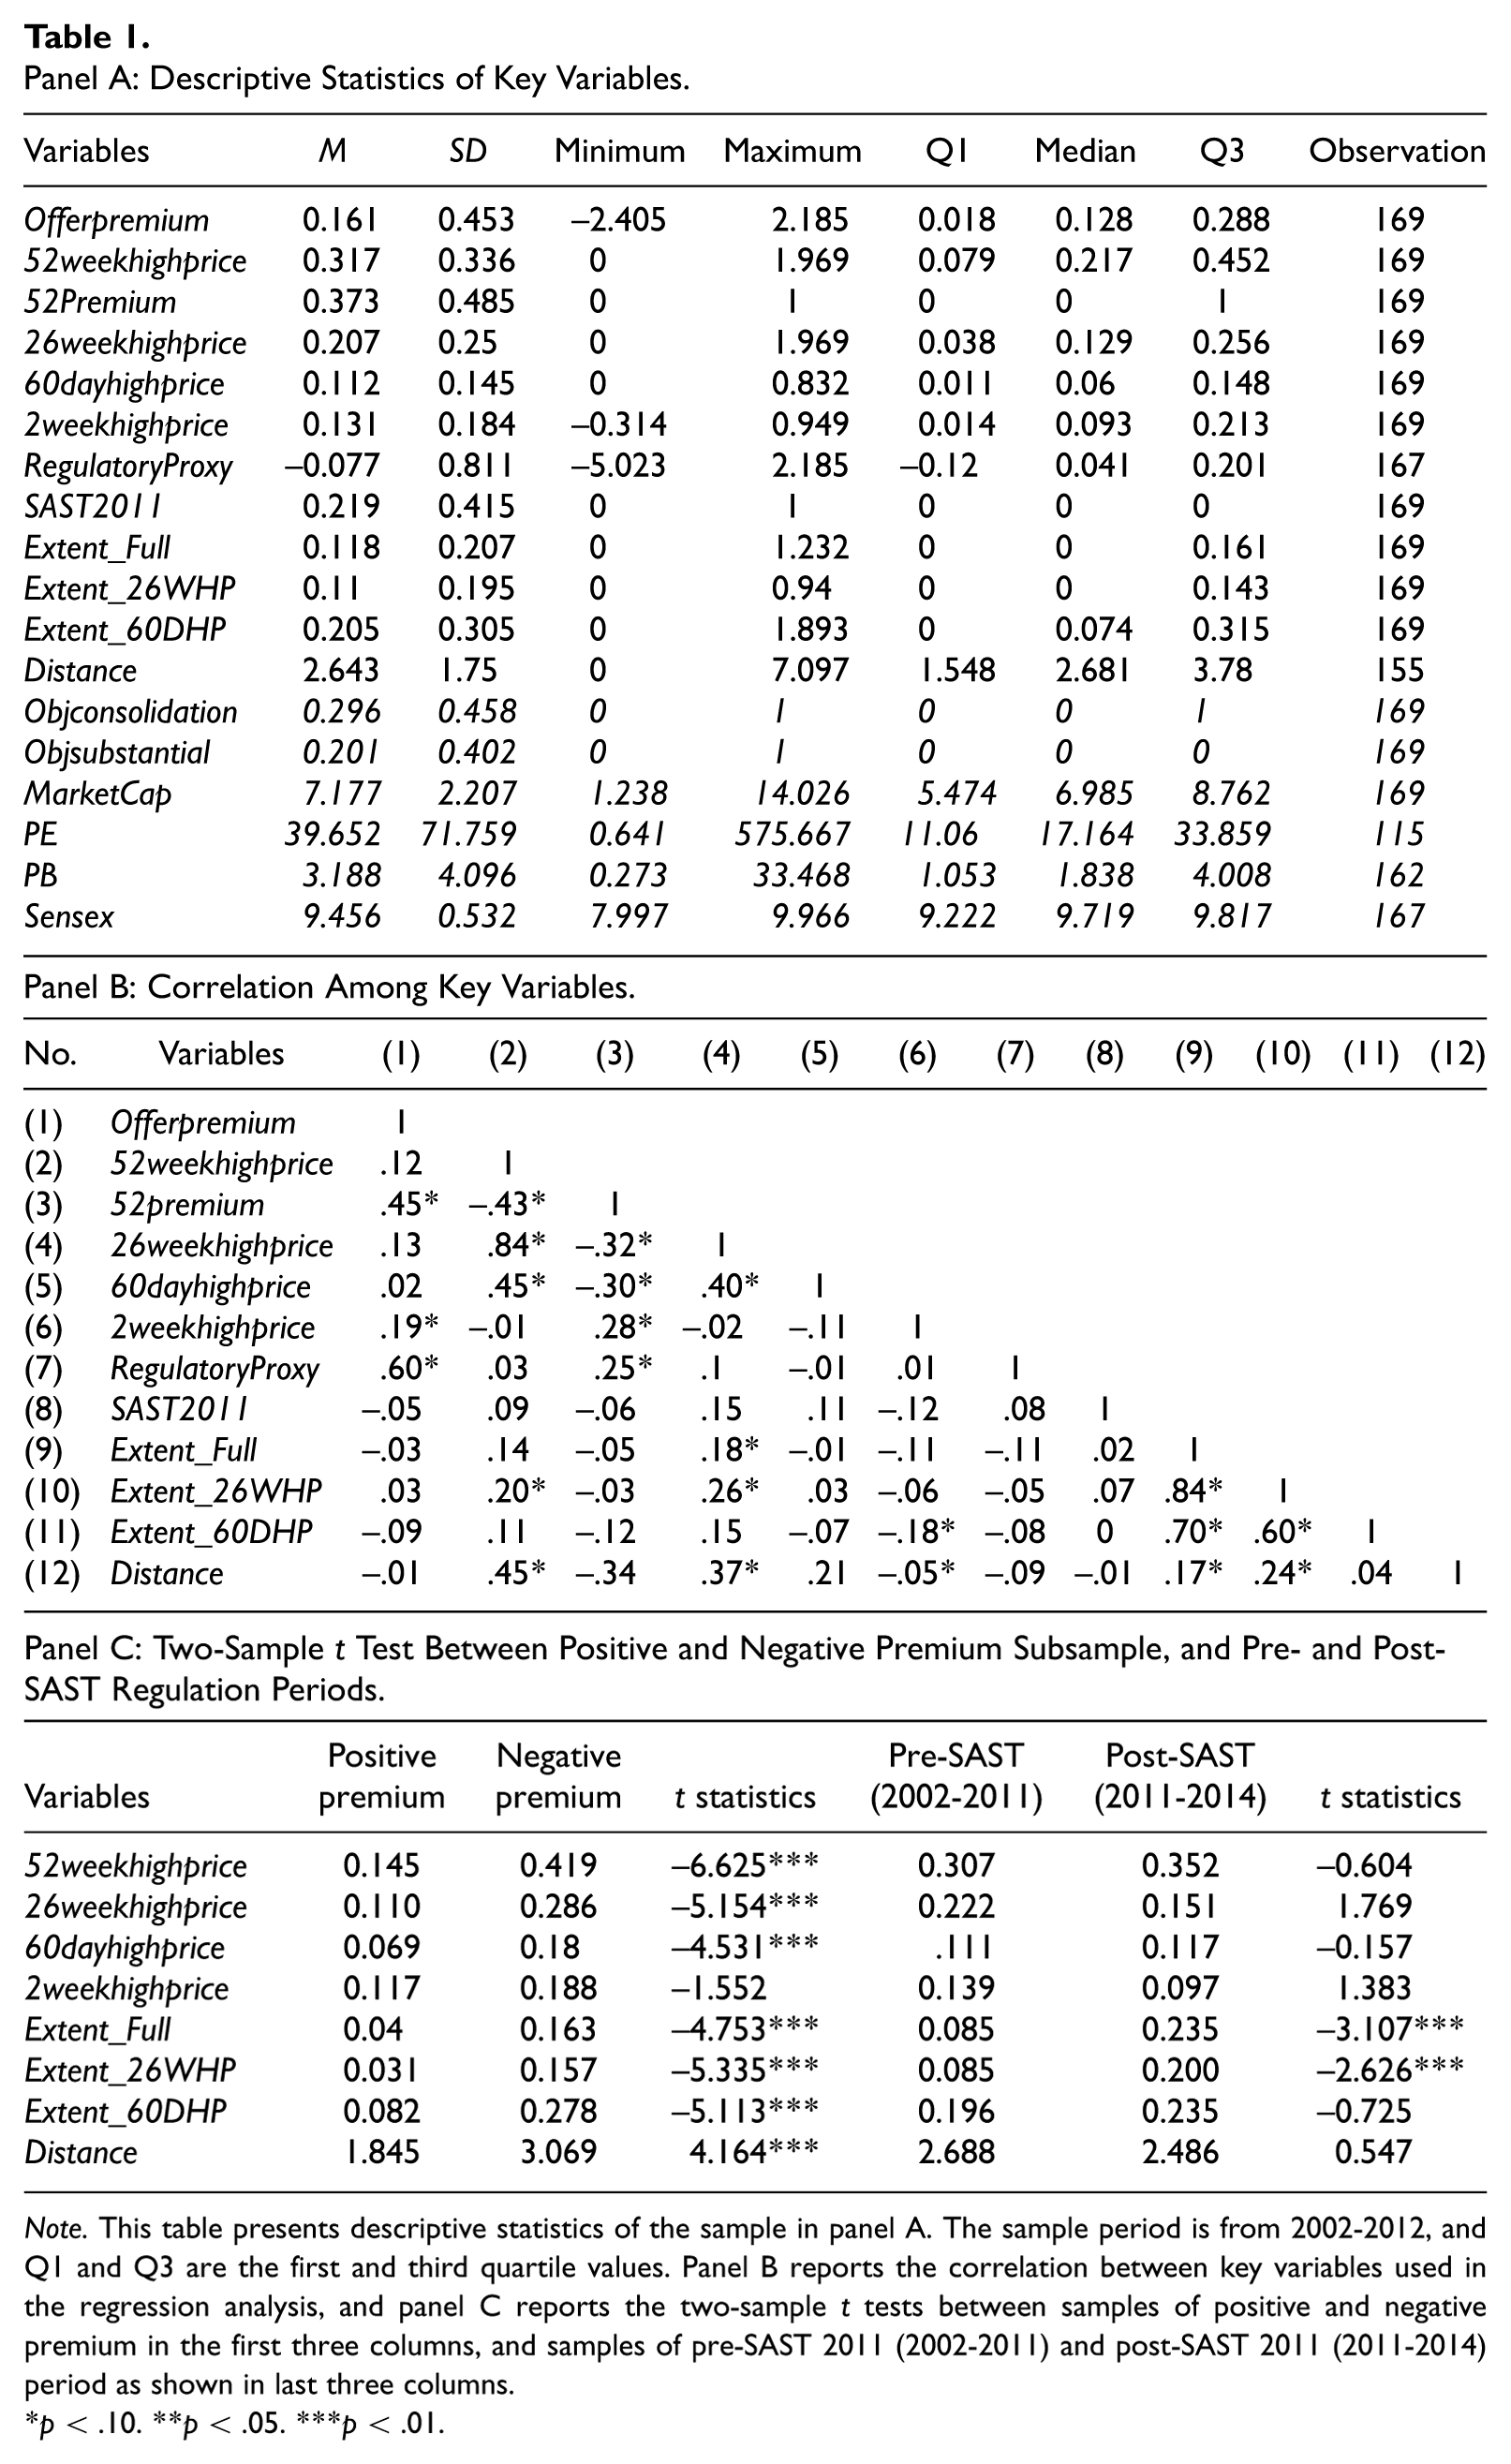
Note. This table presents descriptive statistics of the sample in panel A. The sample period is from 2002-2012, and Q1 and Q3 are the first and third quartile values. Panel B reports the correlation between key variables used in the regression analysis, and panel C reports the two-sample t tests between samples of positive and negative premium in the first three columns, and samples of pre-SAST 2011 (2002-2011) and post-SAST 2011 (2011-2014) period as shown in last three columns.
p < .10. **p < .05. ***p < .01.
The correlation analysis among key variables is given in Table 1, panel B. The association between offer premium and peak prices is positive; however, only the 52-week premium dummy variable appears significant. This indicates that offer premium and 52-week high price have positive association, only when 52-week high price is greater than the offer price. We find correlation between peak prices as well as among various extent variables; however, these variables are not used in the same regression analysis.
In Table 1, panel C, we conduct a two-sample t test for comparing means between various subsamples. We first divide the data into positive and negative premium subsamples and test for difference in means. The means for positive and negative premium subsamples are significantly different in all cases, except the 2-week high price. Therefore, we treat these subsamples separately for subsequent regression analysis. We further divide the data according to different regulatory periods, pre-SAST 2011 (2002-2011), and post-SAST 2011 (2011-2014). The results show that the means across the two periods are not significantly different for various peak prices over different horizons, except for the Extent variables. The means of Extent_Full and Extent_26WHP variables are significantly different across both periods, with the mean value lower in the pre-SAST 2011 period, that is, the 52-week high premium is closer to the 26-week high premium. Incidentally, the mean of 52-week high price itself is not significantly different in both periods, suggesting that the change in SAST regulation in 2011 does not have an impact on the 52-week anchoring effect.
Characteristics of Tender Offers
Acquisition of shares through open offer involves various objectives for the acquisition, divided into three main categories: change in control, substantial acquisition, and consolidation of holdings. Change in control involves change in voting rights such that the control or decision-making power goes to new shareholders. As per the SEBI SAST regulations of 1997, control includes the right to appoint majority of directors and/or to control the management or policy decisions. Substantial acquisition involves acquisition of a substantial quantity of shares or voting rights of the company, which in SAST 1997 is defined as 15% or more of voting rights in the target company, increasing to 25% or more voting rights in SEBI takeover code 2011. Consolidation applies to persons holding a substantial stake and who would like to acquire further shares beyond a limit. The acquirer who holds shares or voting rights of between 55% and 75%, and who is desirous of consolidating this shareholding, can do so by making an open offer.
The data set shows that out of 169 deals, 50 deals correspond to the objective of consolidation, 34 deals for substantial acquisition, and 85 deals involve change of control. Although substantial acquisitions leading to consolidation would mean partial acquisition of minority stakes, we include them in the analysis along with change in control. Moreover, in cases that involve persons acting in concert as acquirers, the total number of shares acquired by them is equivalent to the number leading to change in control. Therefore, we assume that as far as determination of the offer price is concerned, the case for substantial acquisitions and change in control would be similar. Inclusion of consolidation of holdings is mainly to avoid further loss of data given the smallness of our sample. Therefore, we include and exclude deals with consolidation of holdings to analyze its impact on the 52-week anchoring effect.
An important deal characteristic is the medium of exchange. Empirical evidence suggests that takeovers which use cash receive higher premiums compared with stock due to market timing and differences in accounting treatments, tax consequences, and shareholder control (de La Bruslerie, 2013; Rhodes-Kropf & Viswanathan, 2004; Schwert, 2000; Shleifer & Vishny, 2003). However, in our data set, information about the mode of payment is available only from April 2007, and for most of these deals the mode of payment is cash. Therefore, we do not consider mode of payment as a determinant in our analysis. Another important characteristic of M&A deals is successful completion of the deal. In our sample, we have information about deal completion for only 109 deals because, post 2010, the SEBI website stopped giving information on success status of deals. Out of 109 deals, there are only five deals that are not completed. Hence, we are unable to consider deal success as an independent variable in our analysis.
Method
The baseline regression model used to determine the association between the target’s 52-week high price and offer premium is as follows:

where Offerpremium is the dependent variable and 52weekhighprice is the independent variable of interest, defined in Appendix B. Henceforth, in variable subscripts, i denotes the target firm and t denotes time. Next, we turn to the main model as shown in Equation 2, which includes regulatory factors and other control variables that are important while determining the offer premium in M&A deals in India.
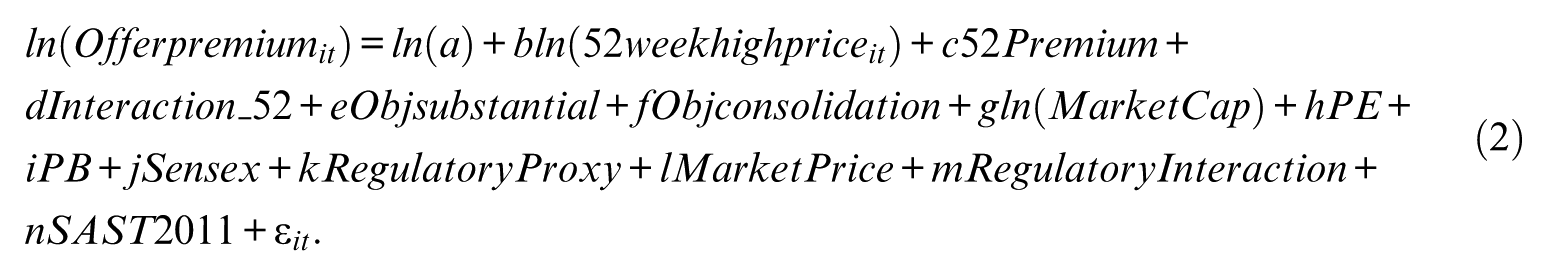
Using the following regression model (Equation 2), we test our first hypothesis of asymmetric anchoring effects on offer premium while controlling for regulatory structure unique to the Indian setting. We introduce dummy variable 52Premium that takes the value 1 if the offer price exceeds the 52-week high price, and 0 if the offer price is less than the 52-week high price. However, to establish whether anchoring is stronger when offer price exceeds the 52-week reference price, we introduce Interaction_52, where the 52Premium dummy is interacted with the 52-week high price. The dummy and its interaction may lead to endogeneity issues as it is based on the offer price itself. Therefore, we divide the data set into positive and negative premium subsamples. To alleviate the impact of outliers, we winsorize all continuous variables at the 1st and 99th percentiles. We also use mean-centered values for the interaction terms to control for potential multicollinearity.
To account for the regulatory framework unique to Indian takeover markets, we introduce regulatory prices and other factors that determine the impact of SEBI (SAST) regulation on the 52-week high anchoring phenomenon. First, we include RegulatoryProxy, the minimum offer price mandated in SEBI (SAST) regulation 2002 and 2011. As the regulatory proxy can be a market or nonmarket price, we next include a dummy variable, MarketPrice, to investigate the effects of regulatory proxy being a market price. However, to establish the effect of the market-oriented-regulatory proxy on the offer premium, we interact the regulatory proxy with the market price, RegulatoryInteraction. Finally, we include a time dummy, SAST2011, to capture the impact of change in SEBI (SAST) regulation in October 2011.
There is compelling evidence regarding the negative relation between target size and takeover premium (Alexandridis, Fuller, Terhaar, & Travlos, 2013). Acquirers pay significantly lower premiums in large deals, resulting in gains to acquiring companies (Moeller, Schlingemann, & Stulz, 2004). Moreover, several studies show an inverse relation between targetiveness (probability of being targeted) and firm size (Vijh & Yang, 2013). Therefore, to control for size of target firms, we include the logarithm of market capitalization, MarketCap, for target firms in the analysis. With regard to takeover activity, Dong, Hirshleifer, Richardson, and Teoh (2006) report price-to-book (PB) ratio as a proxy for firm ability to generate high returns on its investments and price-to-earnings (PE) as an indicator for mispricing. Therefore, we control for firm-specific effects by including PE and PB estimates of the target firm in the regression analysis. To control for market-specific effects, we include Sensex returns for the 30-day lagged period prior to the public announcement date. The 30-day lagged period is to ease any upward rumors or the effect of new information on the market index.
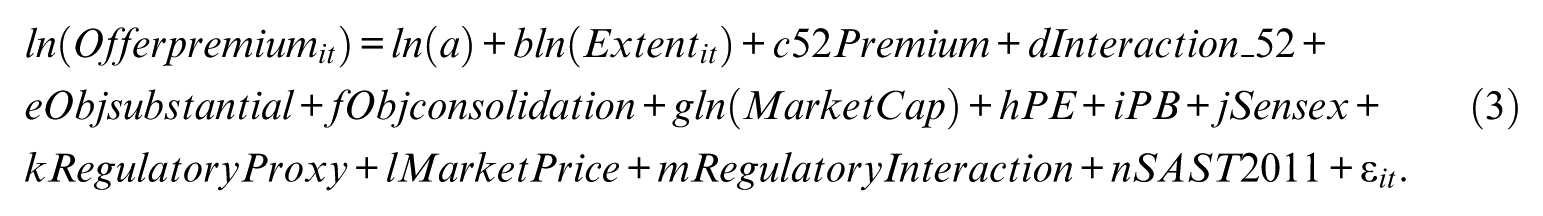
In Equation 3, we replace our main independent variable, 52weekhighpriceit with the measure Extentit, such that we can account for distinct anchoring to the 52-week high price, and eliminate the confounding effects of the regulatory prices, that is, 26-weeks and 60-days, which are a subset of the 52-week high price. Such an analysis would determine the salience of the 52-week high price over and above alternate regulatory anchors. We construct three variants of Extentit: Extent_Full, Extent_26WHP, and Extent_60DHP, defined broadly as percentage difference of the target’s 30-day lagged 52-week high price compared with its regulatory anchors, that is, 26-week or 60-day high price, over various periods of regulation (refer to Appendix B for detailed definitions).

Next, to test for the prowess of regulatory prices as anchors themselves, we relate the regulatory peak prices, that is, 26weekhighprice, 60dayhighprice, 2weekhighprice, and offer premium, while controlling for regulatory and firm- and market-specific factors, as shown in Equation 4. Note that we introduce the regulatory peak prices independently in the regression analysis. In some cases, we test the salience of these regulatory prices during their mandated periods of regulation, as well as in nonregulatory periods.

Another independent variable of interest is the distance between the target’s 52-week high price and its recent market price. Therefore, in Equation 5 we replace the independent variable, 52-week high price, with Distanceit (difference between target’s 52-week high price and its current market price) and examine its impact on offer premium. Following Chira and Madura (2015), we define Distanceit as the percentage difference in target’s 30-day lagged closing price prior to public announcement compared with its 52-week high reference price.
Results
We first graphically establish the relation between offer price and stock market peak prices in “Anchoring to Peak Prices” subsection, then discuss our findings in “The 52-Week Anchoring Effect” subsection.
Anchoring to Peak Prices
We present the frequency distribution of offer prices relative to targets’ stock market peak prices for 52-weeks, 26-weeks, and 60-days, because it is valuable to make comparison of the 52-week high price with other regulatory peak prices that are a subset of the reference price. The data set for plotting the histogram comes from 169 firms explained in the “Sample” section. Due to a change in SAST regulation in 2011, we present histograms for two periods, April 2002 to October 2011 and November 2011 to March 2014. Figure 1, panel A, illustrates the histogram for the target’s 52-week high price for the periods 2002-2011 and 2011-2014, while panel B presents the histogram for the 26-week high price for the period 2002-2011, and the 60-day high price for the period 2011-2014. For brevity, we focus on regulatory anchors during their respective periods of regulation.
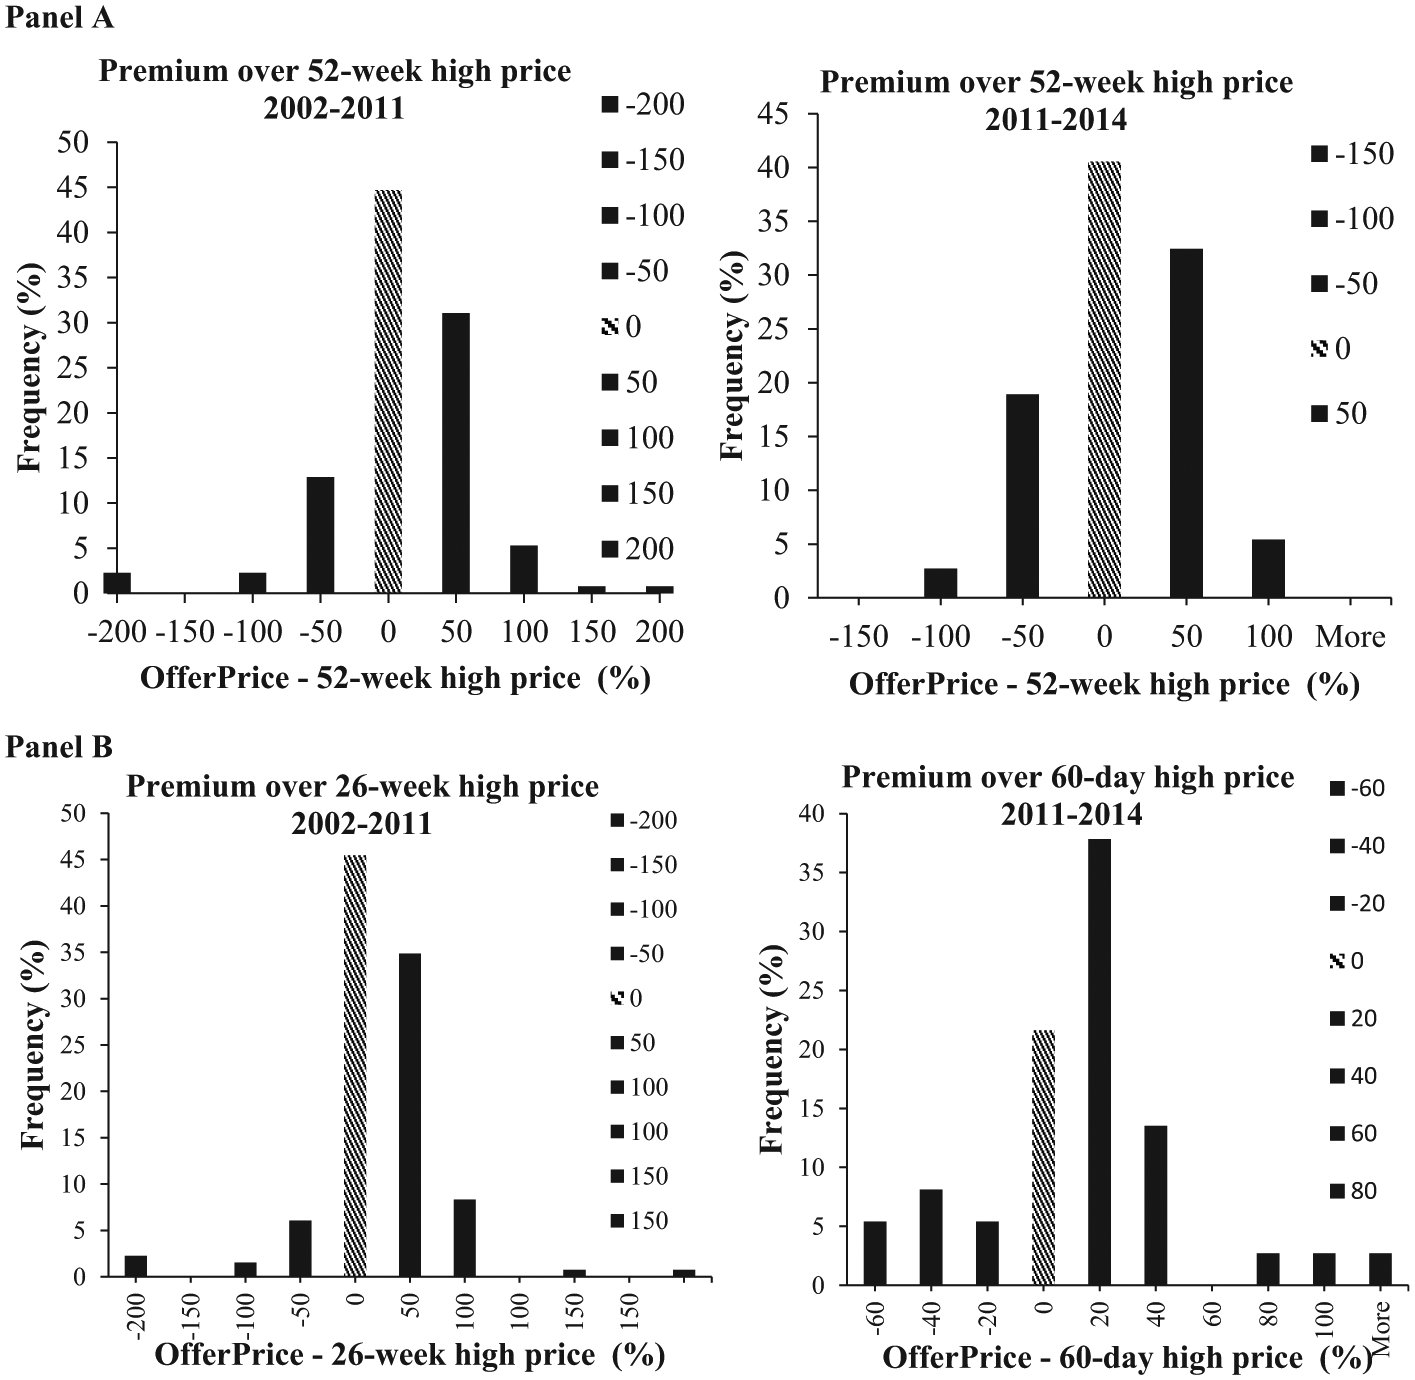
Histogram of offer premium for (A) 52-week high price and (B) 26-week high price and 60-day high price.
In the histograms, the horizontal axis represents the percentage difference, and the vertical axis records frequencies (percentage) for each class, where the value 0 signifies that offer price equals peak market price. The distribution graphically confirms a high level of anchoring around various peak prices, especially the 52-week high price and 26-week high price. 11 One could reason that anchoring to the 26-week high price is due to SEBI SAST regulations of 2002. However, this is not true for the 60-day high price, which has a smaller data sample (37 firm observations).
The 52-Week Anchoring Effect
In this subsection, we discuss the multivariate analysis used to explain the association between target’s 52-week high price and offer premium, while controlling for regulatory and firm- and market-specific factors.
Salience of 52-week high price: Asymmetric anchoring and regulatory effects
Our first hypothesis postulates a positive and significant relation between offer premium and target’s 52-week high price, while controlling for asymmetric anchoring, regulatory factors unique to Indian takeovers, and firm- and market-specific factors (i.e., objective of takeover, market capitalization, PE, PB, and Sensex). We report the results in Table 2 using different regression specifications. Column 1 presents the baseline model with a 52-week premium dummy that differentiates between deals with offer price greater than the 52-week high price, than when lower. In column 2, we interact the 52-week high price and the premium dummy (Interaction_52), to test whether anchoring is stronger when the offer price is above the 52-week reference price. Column 3 presents the results of our full model, which validates the effects of SEBI (SAST) regulation on the 52-week anchoring effect. Columns 4 and 5 present the analysis for positive and negative premium subsamples. Column 6 excludes deals with objective as consolidation, under the assumption that consolidation is considered as partial acquisition.
Salience of 52-Week High Price, Asymmetric Anchoring, and Regulatory Effects.

Note. This table presents the OLS regression results of estimating the impact of the target’s 52-week high price on offer premium for the sample period 2002-2014, while considering regulation and firm- and market-specific factors. Variable definition is according to Appendix B. Column 1 is the baseline regression result for the complete sample. Column 2 includes interaction terms to account for asymmetric anchoring for the complete sample. Column 3 includes regulatory factors for the complete sample. Columns 4 and 5 present the regression results for positive premium and negative premium subsamples respectively, and column 6 presents regression results excluding deals with objective as consolidation. The values within the parentheses represent standard errors. OLS = ordinary least squares.
p < .10. **p < .05. ***p < .01.
In most of the regression specifications (columns 1-6), except in the case of the negative premium sample (column 5), the 52-week high price has a positive and significant effect (highest p value < .01) on offer premium. The 52-week premium dummy is positive; however, this may not be surprising as the higher the offer price, the higher would be the offer premium. More importantly, Interaction_52 is positive and significant, implying that anchoring is stronger for deals with offer price greater than the 52-week high price than when lower. We reason that, if bidders identify the importance of the 52-week high price as a reference price or anchor, they might as well decide to bid slightly higher than the 52-week high price to ensure offer success (Baker et al., 2012).
Results in column 3 show that the regulatory proxy (minimum offer price mandated in the SEBI SAST regulation) has significant impact (only at 10% levels) on the offer premium. However, the 52-week high price is highly significant (p value < .01), suggesting the salience of the 52-week anchoring effect while controlling for alternate regulatory anchors. The dummy variable, MarketPrice, does not appear significant. However, the interaction term, RegulatoryInteraction, is highly significant (at 1% levels), suggesting that when the regulatory proxy is a market price, it significantly increases offer premium. This finding is consistent with related studies that market price serves as an objective measure of market value and liquidity, thus commanding a relatively higher offer premium (Capron & Shen, 2007; Walkling & Edmister, 1985). Furthermore, the SEBI SAST regulatory intervention of 2011 that shifts the 26-week regulatory anchor to a recent market price, that is, 60-day high price, does not attenuate the 52-week anchoring phenomenon.
The above findings support our first hypothesis that the 52-week anchoring effect prevails even after controlling for regulatory requirements specific to Indian acquisitions. Results of our control variables show that the objective of the takeover does not impact the offer premium. Among firm-specific characteristics of the target firm, we find the offer premium significantly declines with increased PE values, thus consistent with Walkling and Edmister (1985) that such firms are perceived as overvalued by the acquirer. In some cases, Sensex has a negative impact on offer premium (at 10% levels), while market capitalization and PB seem to have no significant effect on offer premium.
The relation between offer premium and the 52-week high price could be driven by endogenous effects, because the premium dummy and its interaction is derived from the offer premium itself. Therefore, we conduct a subsample analysis for deals with offer price greater than the 52-week high price (positive premium) and when lower (negative premium). Although the subsamples considerably reduce the sample size of firms, the analysis validates the asymmetric anchoring effects. Our results show that in the case of positive premium subsample (Table 2, column 4), the 52-week high price is positive and significant (at 5% levels). In the case of negative premium subsample (Table 2, column 5), the 52-week high price is not significant. Hence, in subsequent specifications, we present results for the complete sample (which includes the interaction term), as well as positive and negative premium subsamples in some cases. Finally, in column 6, we exclude deals with consolidation as the objective of takeover; this does not change the 52-week anchoring effect.
Extent of anchoring
The SEBI-mandated minimum offer price is a function of other stock market peak prices, that is, 26-weeks and 60-days, which are a subset of the 52-week high price under study. The data show that out of 169 firms, there are 105 firms for which the 52-week high price is either equal to the 26-week high price (97 cases) or the 60-day high price (eight cases). Therefore, the natural question is whether anchoring to the 52-week high price is due to regulation-induced anchors. Hence, to eliminate the confounding effects of regulatory prices which are a subset of the 52-week high price, and to establish the individual effect of the 52-week high price as an influential anchor, we calculate extent of anchoring. That is, the variable Extentit examines whether the 52-week anchoring effect persists when the 52-week high price is greater than various regulatory peak prices, that is, 26-weeks and 60-days, around different regulatory periods.
We define Extentit in various ways (refer to definitions in Appendix B). Column 1 of Table 3 defines Extent_Full as the percentage difference between the 52-week high price and 26-week high price until 2011, and 60-day high price for 2011-2014. This variable accounts for the effect on offer premium when the 52-week high price is greater than the regulatory anchors during the respective periods of regulation. We also compare whether the extent of anchoring is influenced by periods of regulation where the regulatory prices are mandated, and outside of those periods. More specifically, Column 2 examines the effects of 52-week high price greater than 26-week high price during its respective period of regulation, 2002-2011 (Extent_26). Column 3 examines the extent of anchoring for those cases where the 26-week high price is greater than the 60-day high price in the 2002-2011 period. Finally, column 4 presents the extent of anchoring for those cases where the 26-week high price is greater than the 60-day high price, for a period outside of its period of regulation, 2002-2011 (Extent_60), and column 5 repeats the same regression specification for the positive premium sample.
Extent of Anchoring to 52-Week High Price.
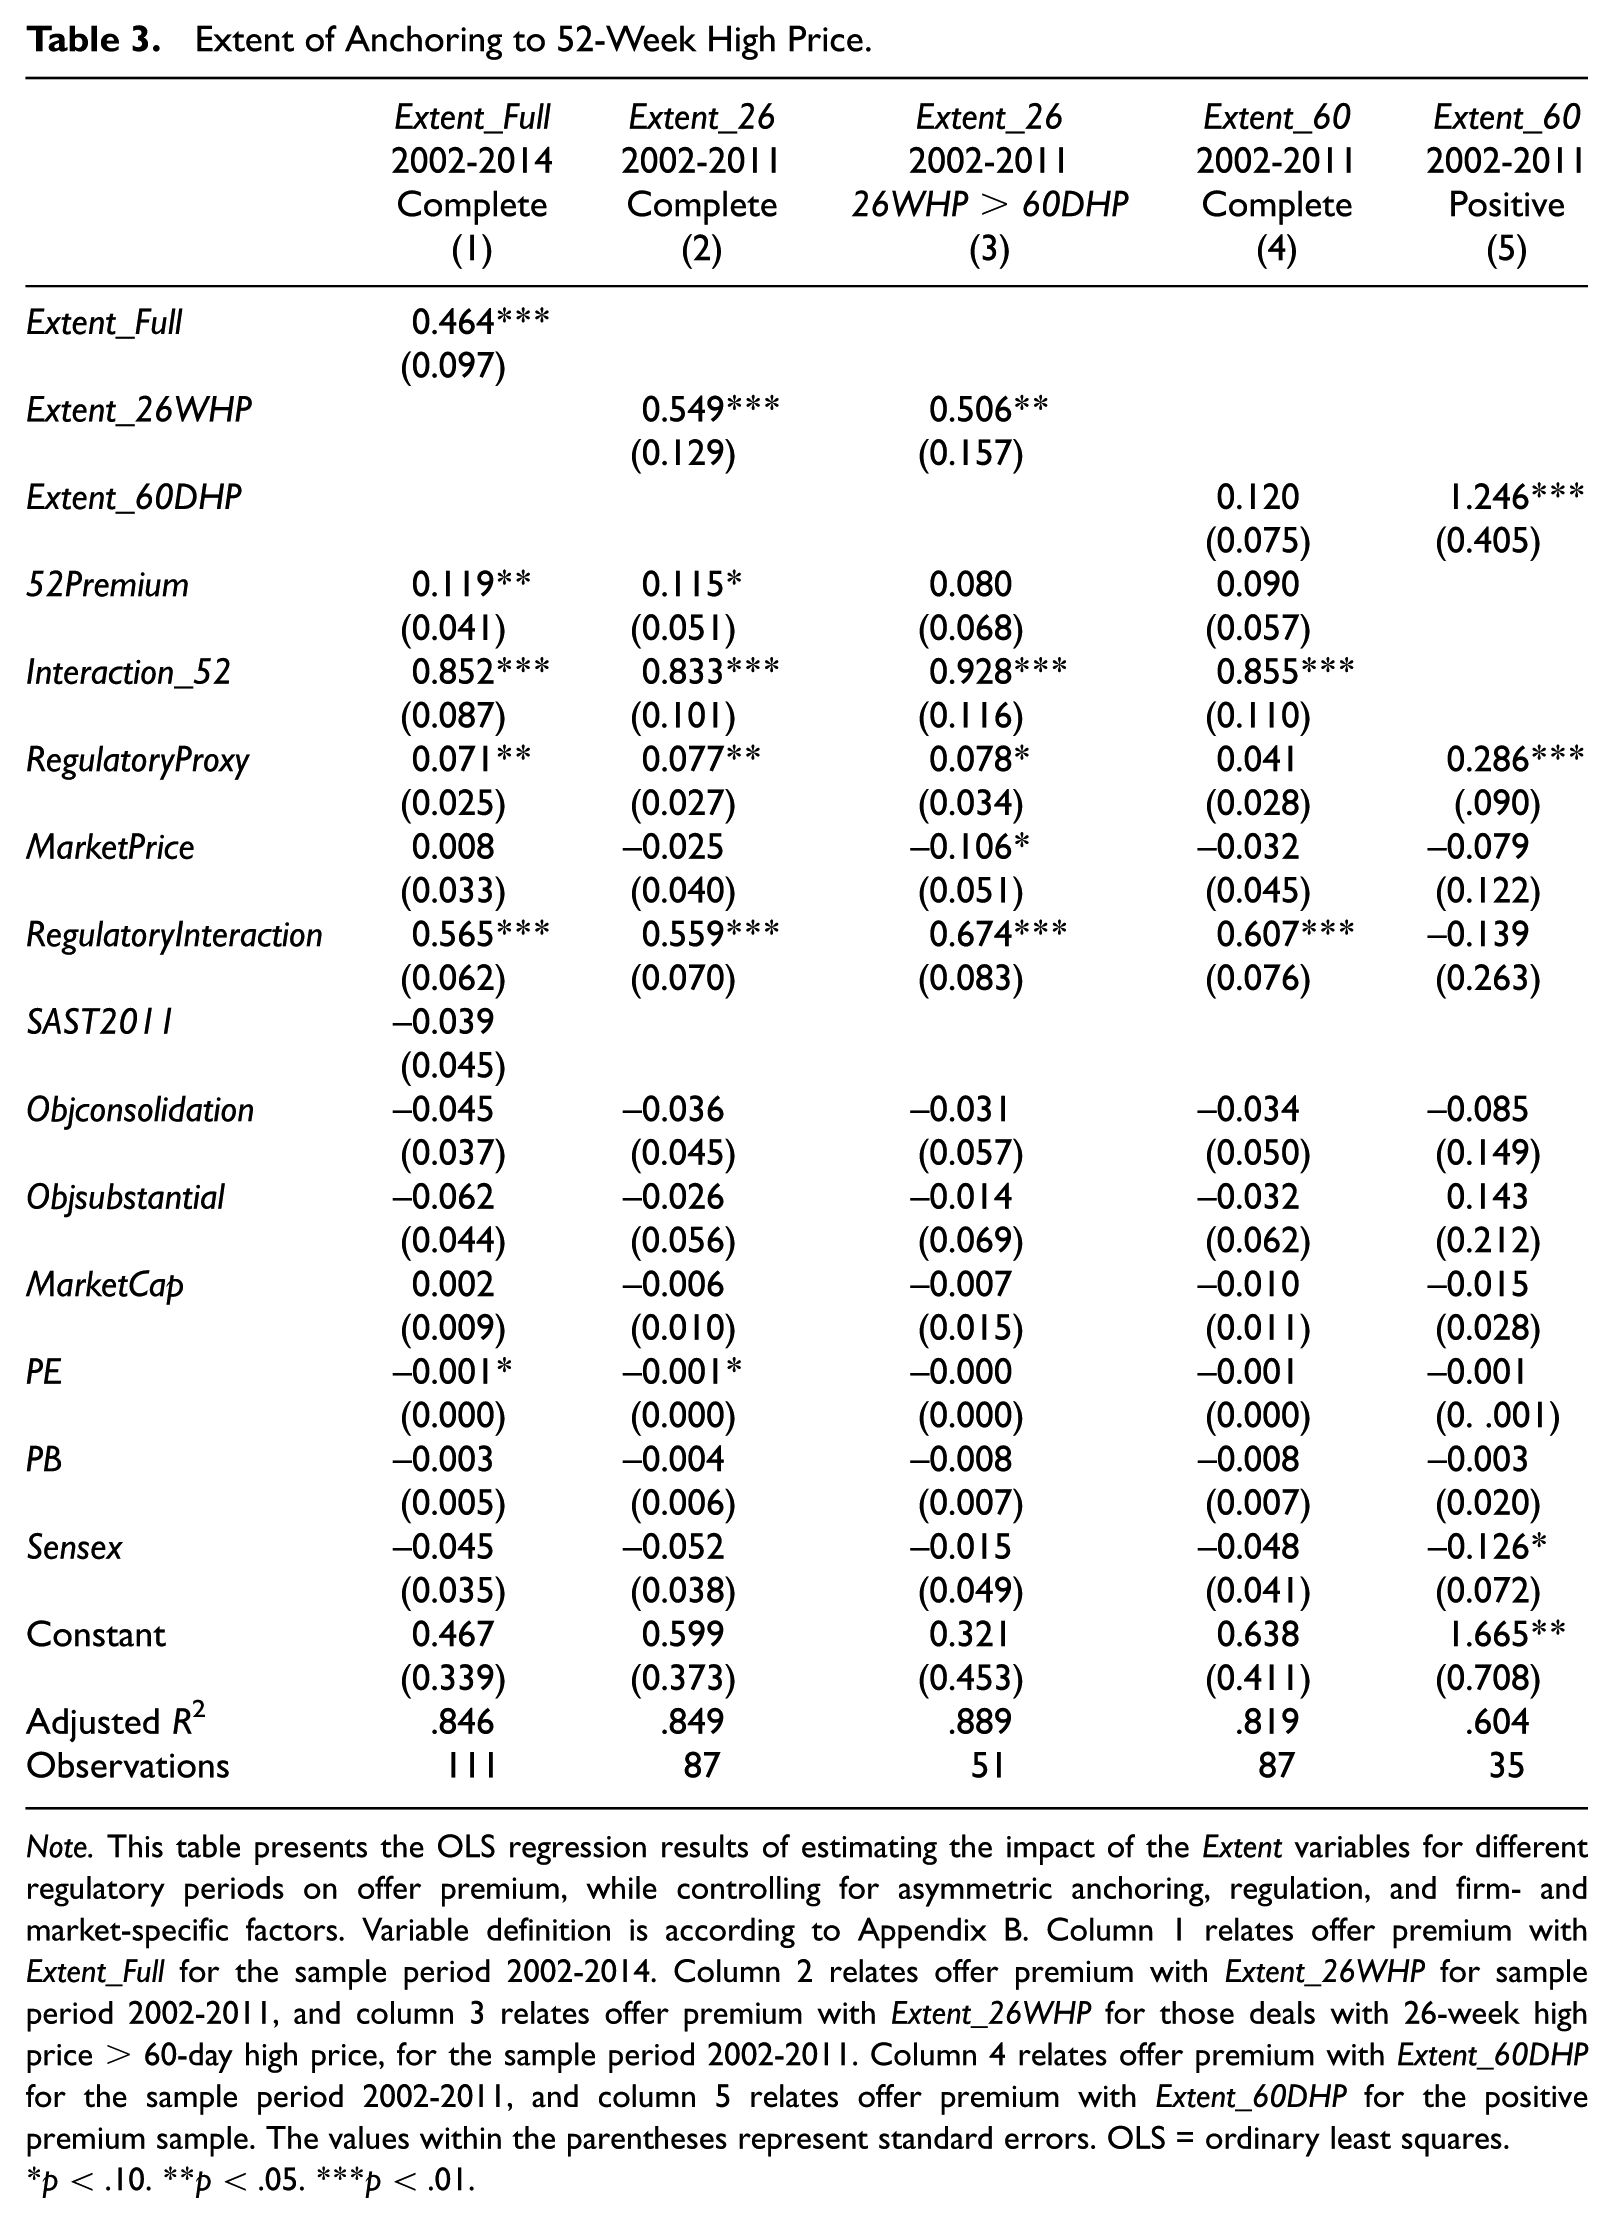
Note. This table presents the OLS regression results of estimating the impact of the Extent variables for different regulatory periods on offer premium, while controlling for asymmetric anchoring, regulation, and firm- and market-specific factors. Variable definition is according to Appendix B. Column 1 relates offer premium with Extent_Full for the sample period 2002-2014. Column 2 relates offer premium with Extent_26WHP for sample period 2002-2011, and column 3 relates offer premium with Extent_26WHP for those deals with 26-week high price > 60-day high price, for the sample period 2002-2011. Column 4 relates offer premium with Extent_60DHP for the sample period 2002-2011, and column 5 relates offer premium with Extent_60DHP for the positive premium sample. The values within the parentheses represent standard errors. OLS = ordinary least squares.
p < .10. **p < .05. ***p < .01.
The results in column 1 reinstate the efficacy of 52-week high price as an influential anchor (at p value < .01), over and above the regulatory-induced anchors, 26-week and 60-day high price, during their respective periods of regulation. This result serves as a contribution beyond Baker et al. (2012), as we establish the salience of the 52-week anchoring effect in the face of alternate regulatory anchors. The inference of this result is that acquirer is willing to pay more (offer premium is higher) while anchoring to the 52-week high price, even when the regulator is mandating a lower reference price of 26-weeks/60-days market price. Results in column 2 document the 52-week anchoring effect over and above 26-week high price during the period 2002-2011, when 26-week high price was the mandated regulatory price. In fact, column 3 results show the extent of anchoring is significant in cases when 26-week is greater than 60-day high price (column 4) for the 2002-2011 period. As per our second hypothesis, these results bring to focus the salience of 52-week high price over regulatory prices explicitly mentioned in SAST regulation.
Next, we turn to results concerning 52-week high price greater than 60-day high price during a period when these prices were nonmandated. Extent_60DHP (defined as 52-week high price minus 60-day high price) is significant in the 2002-2011 period only when we take into consideration the positive premium sample (column 5). This could be because 60-day is a subset of 26-weeks. However, we are unable to report the extent of anchoring (Extent_60) during its respective period of regulation, 2011-2014, due to the small sample size. 12 Nonetheless, the above findings lead us to another interesting question on whether regulatory prices behave as anchors themselves, especially during their respective regulatory regimes. We discuss this issue in detail in the “Salience of Regulatory Anchors” subsection. Also, all the above specifications support the conjecture that the extent of anchoring is stronger when the offer price is above the 52-week high price than when lower. Regulatory interaction is significant in most cases, and higher PE ratios reduce offer premium.
Salience of regulatory anchors
This subsection investigates the prowess of regulatory peak prices as anchors themselves, 13 because they are explicitly mandated in the SEBI SAST regulation. We test the regulatory prowess in various ways. We investigate the salience of regulatory prices, 26-week and 2-week high price, during their respective periods of regulation (2002-2011), and the salience of 60-day high price outside its period of regulation (2002-2011), where such a price was not mandated.
The results in Table 4, panel A, show a positive and significant effect of 26-week high price on offer premium only for the positive premium subsample (column 2), and during its respective period of regulation, 2002-2011 (column 5). However, we are unable to infer the prowess of 26-week high price outside its period of regulation (2011-2014), due to fewer firms in that period. RegulatoryProxy and RegulatoryInteraction are significant in some specifications (highest p value < .01). Among firm-specific factors, higher PE ratio (at 5% levels) and Sensex (at 10% level) has a negative impact on offer premium.
Panel A: Salience of 26-Week High Price as a Regulatory Anchor.
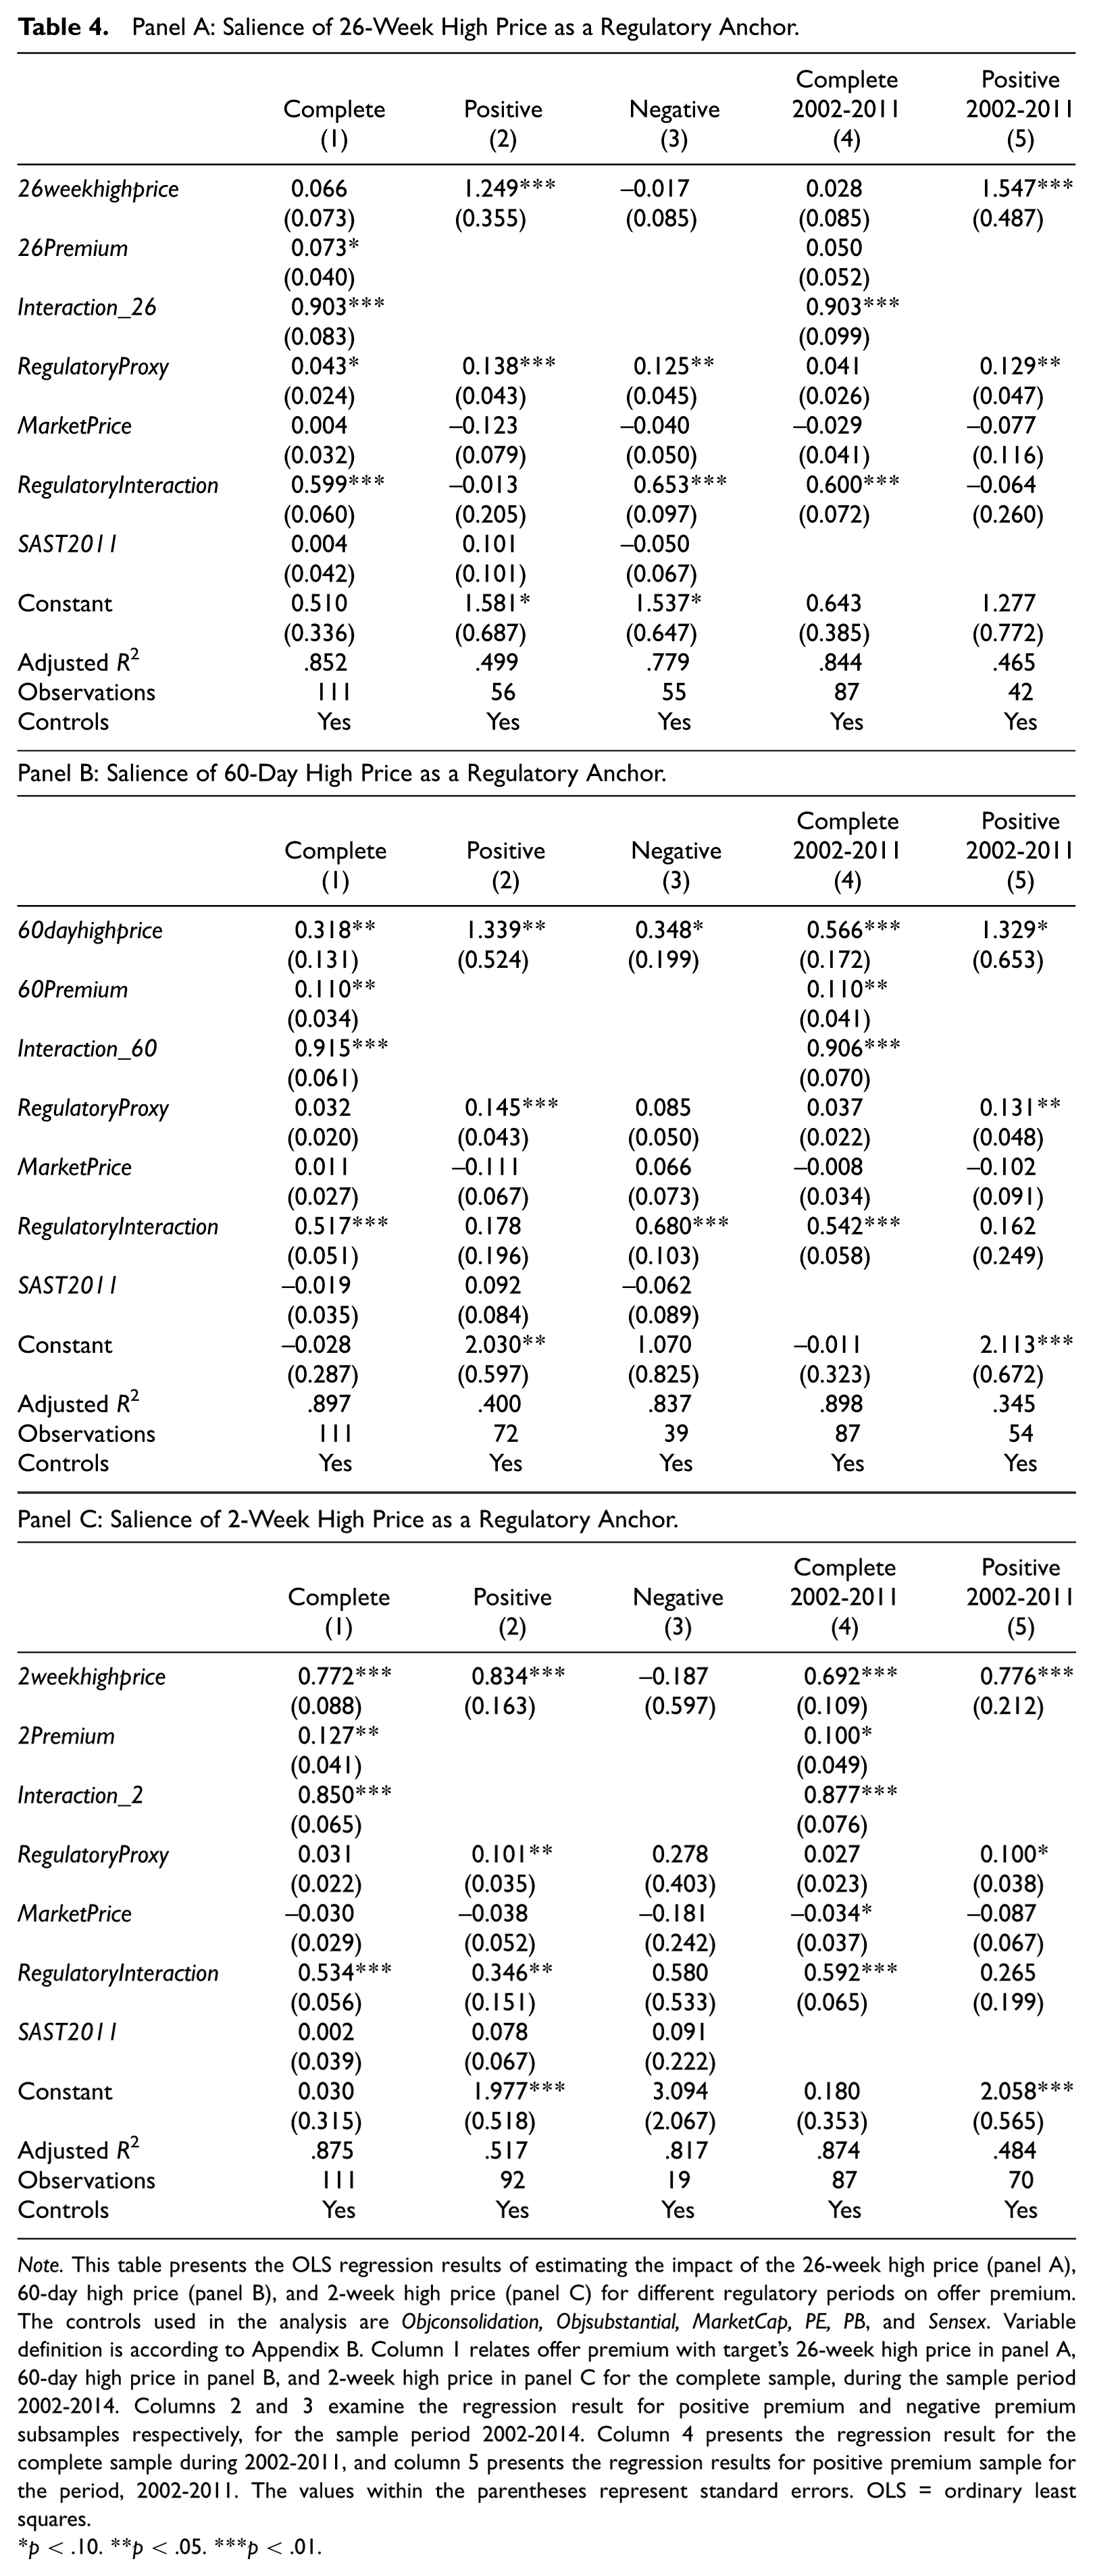
Note. This table presents the OLS regression results of estimating the impact of the 26-week high price (panel A), 60-day high price (panel B), and 2-week high price (panel C) for different regulatory periods on offer premium. The controls used in the analysis are Objconsolidation, Objsubstantial, MarketCap, PE, PB, and Sensex. Variable definition is according to Appendix B. Column 1 relates offer premium with target’s 26-week high price in panel A, 60-day high price in panel B, and 2-week high price in panel C for the complete sample, during the sample period 2002-2014. Columns 2 and 3 examine the regression result for positive premium and negative premium subsamples respectively, for the sample period 2002-2014. Column 4 presents the regression result for the complete sample during 2002-2011, and column 5 presents the regression results for positive premium sample for the period, 2002-2011. The values within the parentheses represent standard errors. OLS = ordinary least squares.
p < .10. **p < .05. ***p < .01.
In Table 4, panel B, we examine the significance of 60-day high price during various regulatory periods. Columns 1 and 2 show positive and significant impact of 60-day high price on offer premium during the 2002-2014 period, however, at 10 percent significance levels. These results do not hold significant for the negative premium subsample (column 3). Column 4 finds 60-day anchoring effect to be highly significant (at 1% levels) during the 2002-2011 period, which could be because 60-day is a subset of 26-weeks.
An important caveat is that the above results pertain to those regulatory prices that are a subset of the 52-week high price. We extend the regulatory prowess analysis to the 2-week high price, which by definition is not part of the 52-week high price. Interestingly, the 2-week price is very close to the announcement date and best reflects the market perception of the target firm. At the same time, the 2-week high price might be contaminated by the information effect of the announcement, which may result in higher offer prices, depending on how the market perceives the acquisition. The results show that the 2-week high price has positive and highly significant (at p value < .01) impact on the offer premium (columns 1-5), except when the offer price is below the 2-week high price (column 3). More importantly, anchoring to the 2-week high price is highly significant during its respective period of regulation (2002-2011). Again, due to fewer firm observations, we are unable to validate its significance of the 2-week high price outside its period of regulation, 2011-2014. The above findings support our third hypothesis that regulatory anchors are significant during their respective periods of regulation.
Distance from 52-week high price
To test our final hypothesis, we investigate whether undervalued targets negotiate higher offer premiums (following Chira & Madura, 2015). Hence, we define distance of anchoring as the difference between target’s 52-week high price and its current market price. The results are given in Table 5.
Distance of the Current Market Price From the 52-Week High Price.
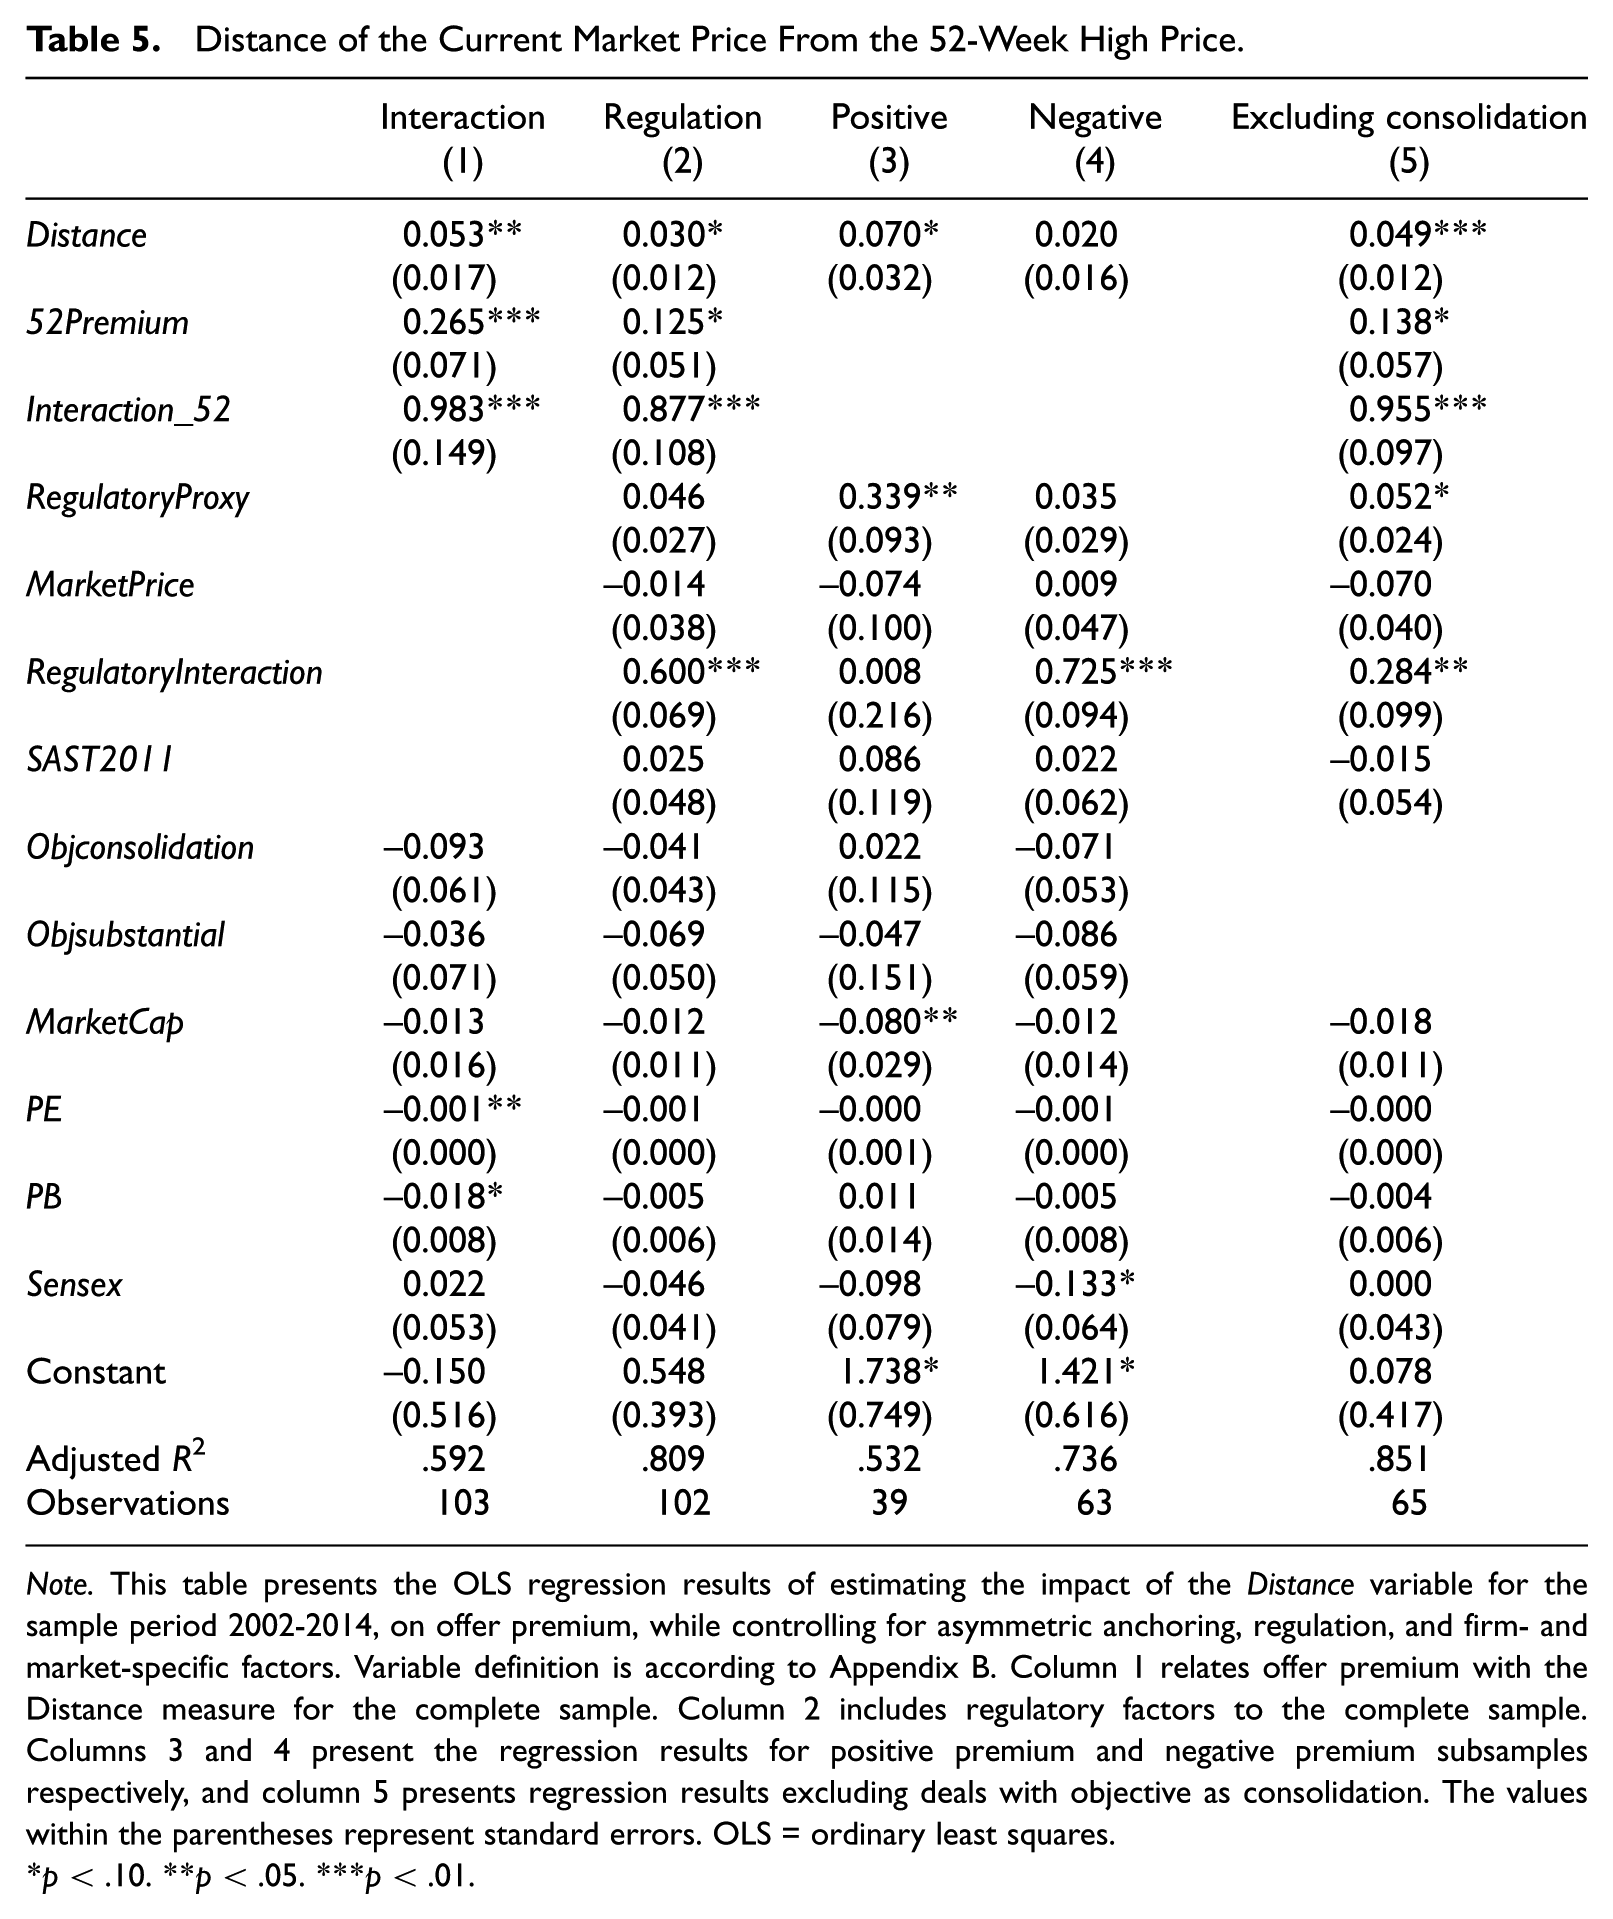
Note. This table presents the OLS regression results of estimating the impact of the Distance variable for the sample period 2002-2014, on offer premium, while controlling for asymmetric anchoring, regulation, and firm- and market-specific factors. Variable definition is according to Appendix B. Column 1 relates offer premium with the Distance measure for the complete sample. Column 2 includes regulatory factors to the complete sample. Columns 3 and 4 present the regression results for positive premium and negative premium subsamples respectively, and column 5 presents regression results excluding deals with objective as consolidation. The values within the parentheses represent standard errors. OLS = ordinary least squares.
p < .10. **p < .05. ***p < .01.
Results in column 1 to 5, except for column 4 which refers to the negative premium sample, show that Distance has positive and significant impact on offer premium (highest p value < .01). Furthermore, the coefficient for the interaction term of 52Premium with Distance is positive and significant (p value < .01). These results imply that acquirers perceive targets as undervalued when the target’s current stock price is lower than the 52-week reference price. These results are consistent with Baker et al. (2012) and Chira and Madura (2015), that undervalued targets negotiate higher offer premiums, and this effect is more pronounced for firms with offer price higher than the 52-week high price. Among regulatory controls, the minimum offer price setting (RegulatoryProxy) has significant impact on offer premium for the positive premium sample, and RegulatoryInteraction appears significant in most cases. With respect to firm-specific characteristics, undervalued firms (low PE ratio) and small size firms (low market capitalization) have significant impact on offer premium.
Additional Analysis and Robustness Checks
To validate our main findings, we perform additional analysis and robustness tests. Our main results are reported using unadjusted closing prices used to calculate peak market prices because SEBI (SAST) regulation simply mentions “closing prices” for determination of the minimum offer price. Moreover, if one follows the behavioral argument, newspapers and popular media report 52-week high closing prices. That is, investors anchor to closing prices reported in the press, rather than the more rational adjusted closing prices. However, one could argue that these prices are not adjusted for other corporate actions. Therefore, we also examine whether the 52-week anchoring effect holds for adjusted closing prices. Our results 14 show the 52-week anchoring effect is no longer significant with adjusted closing prices, especially when firms face drastic price changes due to major corporate actions such as stock splits. Such a result proves the point that investors anchor to the unadjusted 52-week high price that is widely reported in the popular media and newspapers. We also find that the anchoring effect is not significant for regulatory anchors with adjusted closing prices.
Furthermore, we conduct our analysis by including a scaling factor based on a period of less than 30 days, that is, 2-weeks lagged market price 15 , assuming information flow is much slower in emerging markets (Bekaert, Harvey, & Lundblad, 2007). The main results pertaining to the 52-week high price as well as the regulatory factors appear positive and significant. Finally, we test the 52-week anchoring effect by eliminating deals from our sample whose objective is consolidation of holdings (as reported in most tables), as such activity implies only an increase in stake and no change in control.
Conclusion
We find a 52-week anchoring effect among mergers and acquisitions in India. The Indian takeover market offers a unique and natural setting to test this phenomenon, because the Indian takeover regulation mandates that the minimum offer price include alternate peak market prices, that is, target’s 26-week (2-week) or 60-day high prices, in accordance with SEBI (SAST) 2002 and 2012 regulation, respectively. This means in India, we have multiple anchors to determine the offer price of the target, the 52-week high price widely cited in the M&A literature and other peak stock market prices mandated in SEBI (SAST) regulation; these latter prices constitute a subset of the 52-week high price under study. Moreover, an exogenous regulatory intervention in SAST 2011 allows us to test whether the 52-week anchoring effect diminishes due to a shift toward a recent market price, that is, the 60-day high price.
Our findings support the literature on the 52-week anchoring effect that is ubiquitous in various takeover markets around the world, even after controlling for regulatory-induced anchors that are unique to Indian takeover deals. We generate more robust evidence by computing the extent of anchoring, which separates the individual effect of 52-week high price as an influential anchor for cases when the 52-week high price is greater than the regulatory peak prices, the 26-week and 60-day high prices. The anchoring effect is significant for deals when the offer price exceeds the 52-week high price. This result supports Baker et al. (2012) and Chira and Madura (2015), in that if the bidders identify the importance of the 52-week high price as a reference price, they would probably decide to bid higher than the influential anchor to ensure deal success. Our results add to a growing body of literature that documents a tendency for investors to look to reference prices as indicators of value, or potential value, under circumstances where actual values are difficult to estimate.
Regulatory amendments in SEBI (SAST) 2011 do not change (or reduce) the 52-week high anchoring effect. Consistent with Chira and Madura (2015), we find a significant increase in offer premiums when a target’s current stock price is distant from its 52-week high price, because these targets are perceived as undervalued. As an important supplement, we investigate the prowess of regulatory prices as anchors themselves, during their respective periods of regulation. Regulatory anchors also serve as additional focal points, as demonstrated by the significance of 26-week and 2-week high price, during their respective periods of regulation (2002-2011). However, due to a smaller sample of firms in the 2011-2014 period, we are unable to test the significance of these regulatory anchors outside their respective periods of regulation. An interesting extension of the current study would be to analyze the post-acquisition performance of target firms that show a significant 52-week anchoring effect. Such an extension could validate whether the 52-week high price dominates and improves upon the forecasting power of past returns (George & Hwang, 2004).
Footnotes
Appendix
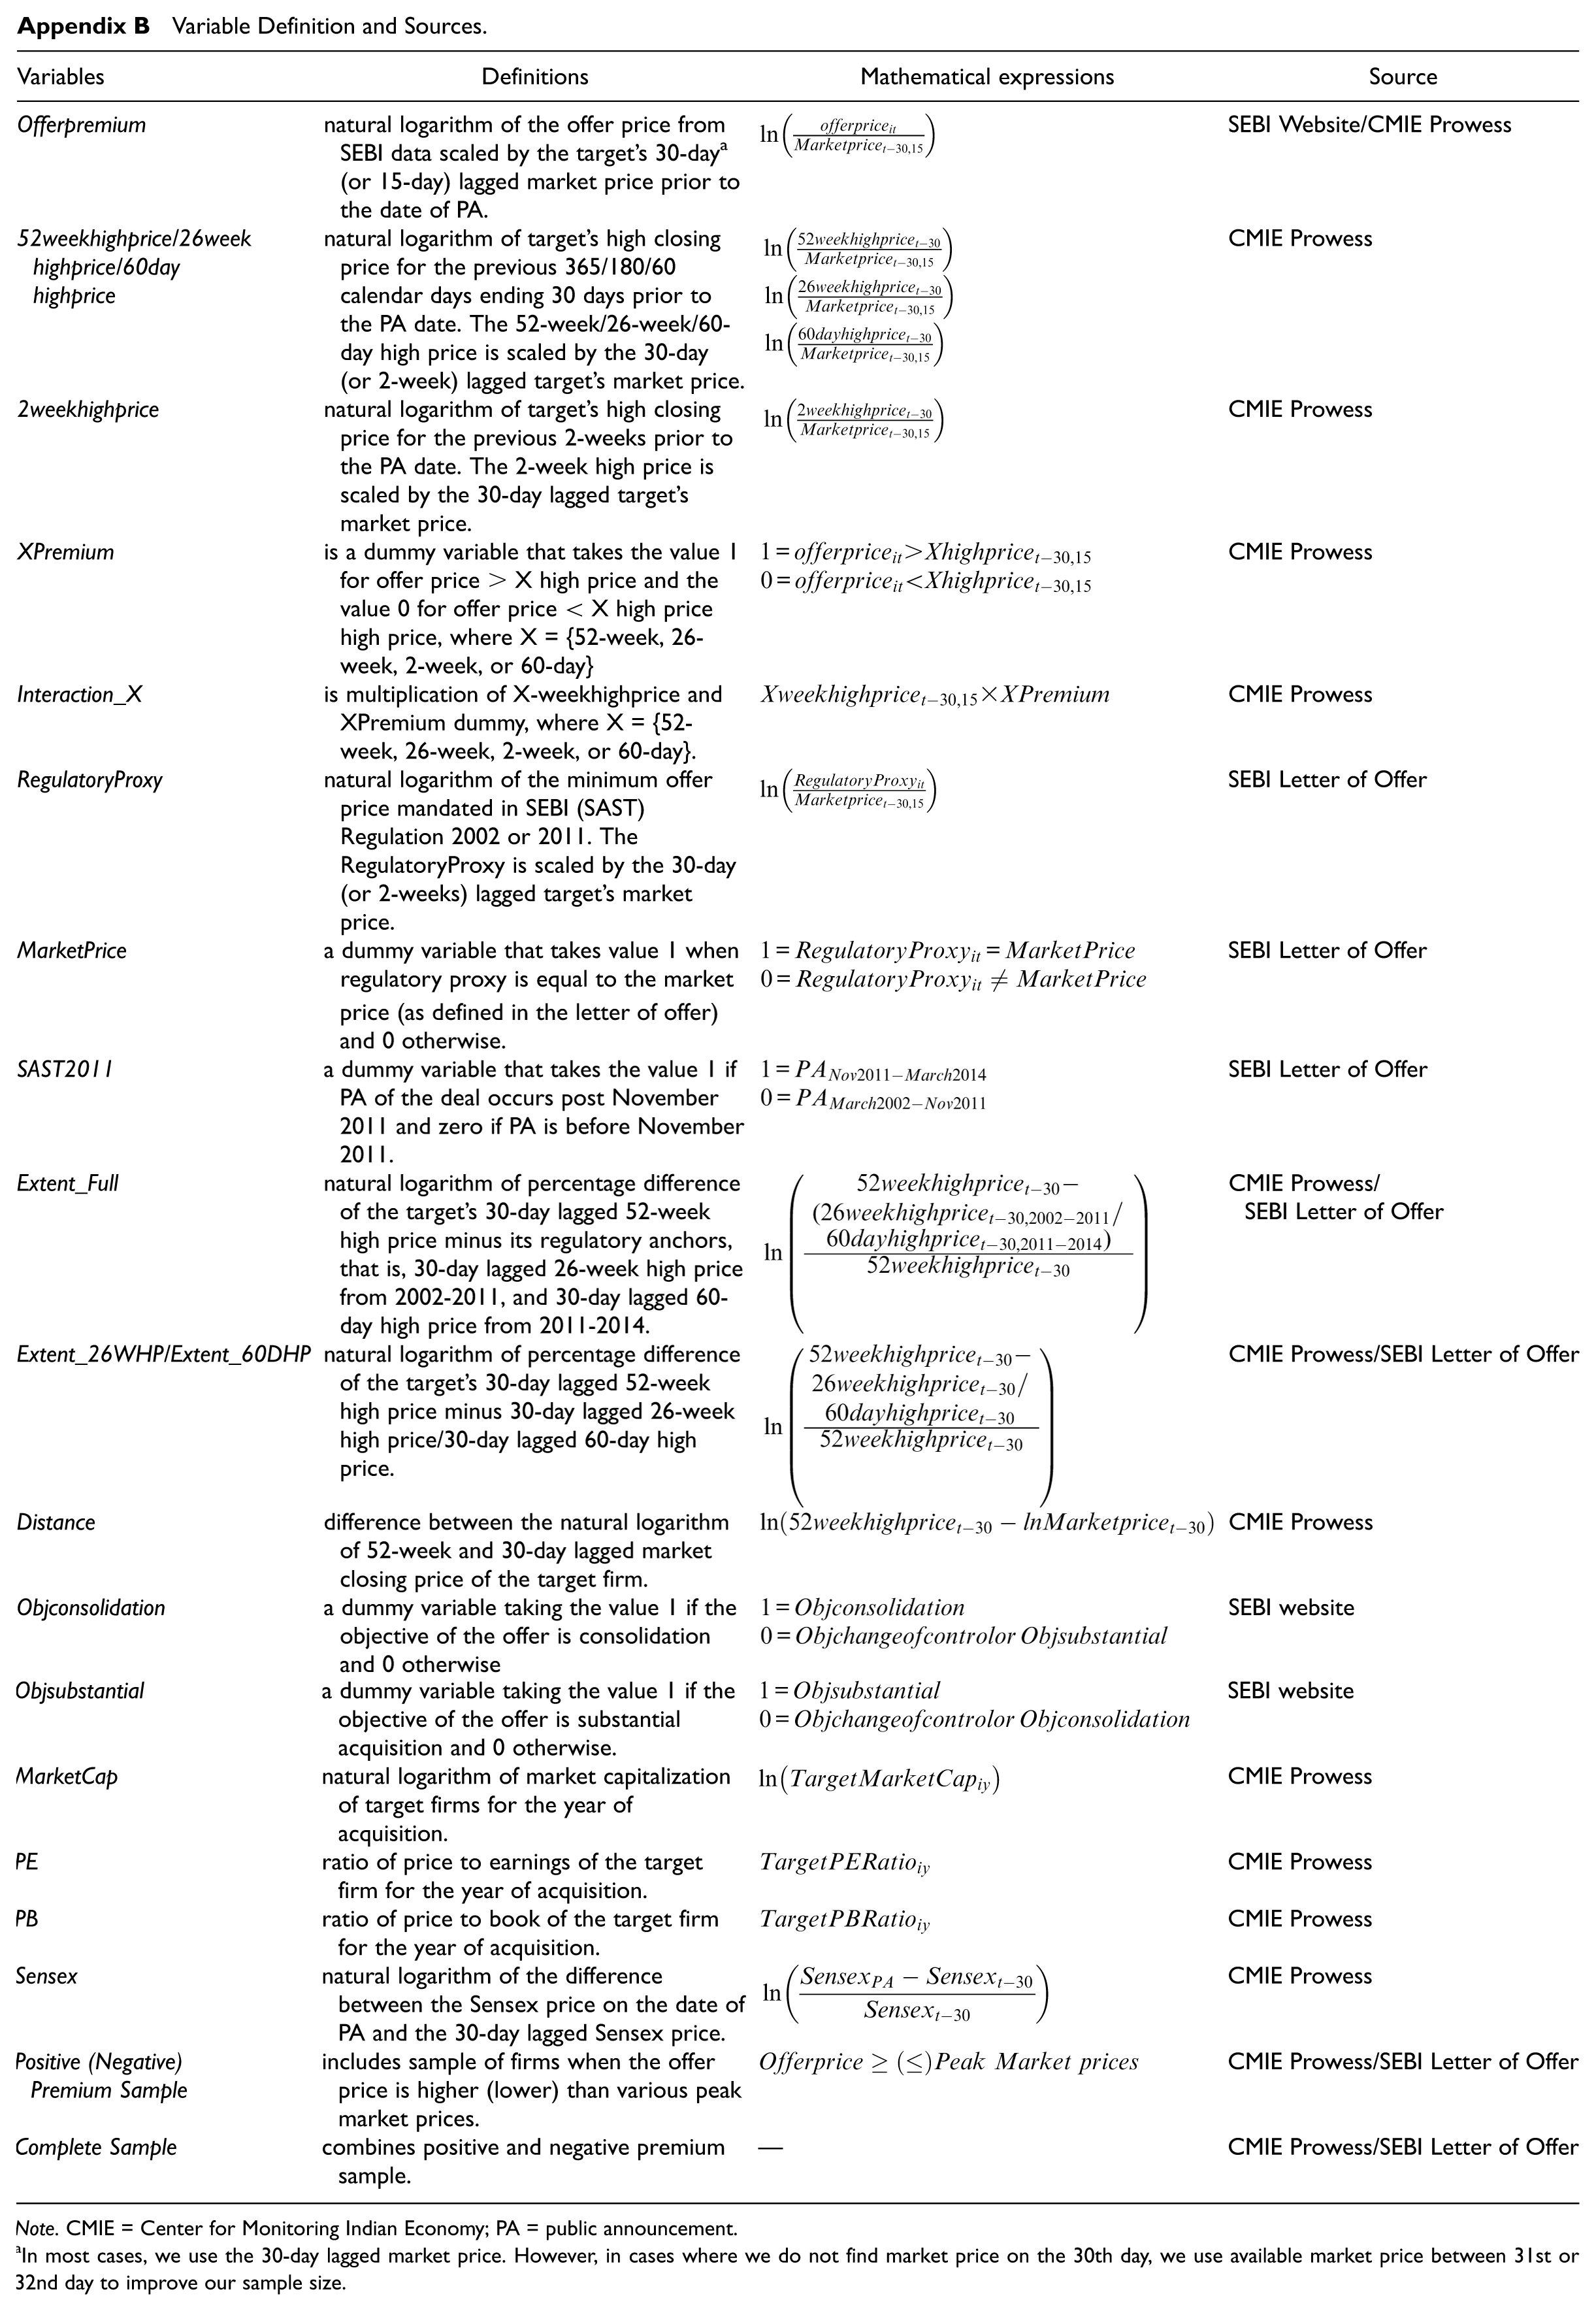
Variable Definition and Sources.
| Variables | Definitions | Mathematical expressions | Source |
|---|---|---|---|
| Offerpremium | natural logarithm of the offer price from SEBI data scaled by the target’s 30-day a (or 15-day) lagged market price prior to the date of PA. | SEBI Website/CMIE Prowess | |
| 52weekhighprice/26weekhighprice/60dayhighprice | natural logarithm of target’s high closing price for the previous 365/180/60 calendar days ending 30 days prior to the PA date. The 52-week/26-week/60-day high price is scaled by the 30-day (or 2-week) lagged target’s market price. |
|
CMIE Prowess |
| 2weekhighprice | natural logarithm of target’s high closing price for the previous 2-weeks prior to the PA date. The 2-week high price is scaled by the 30-day lagged target’s market price. | CMIE Prowess | |
| XPremium | is a dummy variable that takes the value 1 for offer price > X high price and the value 0 for offer price < X high price high price, where X = {52-week, 26-week, 2-week, or 60-day} | CMIE Prowess | |
| Interaction_X | is multiplication of X-weekhighprice and XPremium dummy, where X = {52-week, 26-week, 2-week, or 60-day}. | CMIE Prowess | |
| RegulatoryProxy | natural logarithm of the minimum offer price mandated in SEBI (SAST) Regulation 2002 or 2011. The RegulatoryProxy is scaled by the 30-day (or 2-weeks) lagged target’s market price. | SEBI Letter of Offer | |
| MarketPrice | a dummy variable that takes value 1 when regulatory proxy is equal to the market price (as defined in the letter of offer) and 0 otherwise. | SEBI Letter of Offer | |
| SAST2011 | a dummy variable that takes the value 1 if PA of the deal occurs post November 2011 and zero if PA is before November 2011. |
|
SEBI Letter of Offer |
| Extent_Full | natural logarithm of percentage difference of the target’s 30-day lagged 52-week high price minus its regulatory anchors, that is, 30-day lagged 26-week high price from 2002-2011, and 30-day lagged 60-day high price from 2011-2014. | CMIE Prowess/ SEBI Letter of Offer |
|
| Extent_26WHP/Extent_60DHP | natural logarithm of percentage difference of the target’s 30-day lagged 52-week high price minus 30-day lagged 26-week high price/30-day lagged 60-day high price. | CMIE Prowess/SEBI Letter of Offer | |
| Distance | difference between the natural logarithm of 52-week and 30-day lagged market closing price of the target firm. | CMIE Prowess | |
| Objconsolidation | a dummy variable taking the value 1 if the objective of the offer is consolidation and 0 otherwise |
|
SEBI website |
| Objsubstantial | a dummy variable taking the value 1 if the objective of the offer is substantial acquisition and 0 otherwise. |
|
SEBI website |
| MarketCap | natural logarithm of market capitalization of target firms for the year of acquisition. | CMIE Prowess | |
| PE | ratio of price to earnings of the target firm for the year of acquisition. | CMIE Prowess | |
| PB | ratio of price to book of the target firm for the year of acquisition. | CMIE Prowess | |
| Sensex | natural logarithm of the difference between the Sensex price on the date of PA and the 30-day lagged Sensex price. | CMIE Prowess | |
| Positive (Negative) Premium Sample | includes sample of firms when the offer price is higher (lower) than various peak market prices. | CMIE Prowess/SEBI Letter of Offer | |
| Complete Sample | combines positive and negative premium sample. | — | CMIE Prowess/SEBI Letter of Offer |
Note. CMIE = Center for Monitoring Indian Economy; PA = public announcement.
In most cases, we use the 30-day lagged market price. However, in cases where we do not find market price on the 30th day, we use available market price between 31st or 32nd day to improve our sample size.
Acknowledgements
We are grateful for comments received from Madhu Veeraraghavan, Prabhakar Patil (SEBI), Vijay Marisetty, participants at the TAPMI-CSU conference 2015, and an anonymous referee. We are thankful to R. Srinivasan and Shobana Krishnan for research assistance. All errors are our own.
Declaration of Conflicting Interests
The author(s) declared no potential conflicts of interest with respect to the research, authorship, and/or publication of this article.
Funding
The author(s) disclosed receipt of the following financial support for the research, authorship, and/or publication of this article: We acknowledge financial support from National Stock Exchange (NSE).