
Abstract
This study investigates the determinants of compensation disclosure transparency in the context of the Securities and Exchange Commission (SEC) compensation regulation of 2006. Specifically, it focuses on incentive-related compensation disclosure required by Reg. S-K 402(b). I find that compensation disclosure transparency is negatively associated with managerial power and proprietary cost but is positively associated with external monitoring. These findings hold for both the pre- and postregulation periods. Furthermore, the effects from proprietary cost become weaker in the postregulation years, and stronger external monitoring tends to reduce the negative relations between compensation disclosure transparency and managerial power and proprietary cost. Finally, I document an inverted U-shape relation between excess CEO compensation and compensation disclosure transparency.
Introduction
Compensation disclosure plays an important role in corporate governance. For example, transparent compensation disclosure provides a considerable amount of information that helps investors better evaluate the appropriateness of incentive schemes and performance measures, detect any abuse in ex post compensation payout, and monitor managerial actions induced by incentives. In essence, compensation disclosure is a form of governance disclosure that, together with financial disclosure, contributes to the corporate information system (Bushman, Piotroski, & Smith, 2004).
Despite investors’ persistent calls for better compensation disclosure, firms’ practices vary considerably and sometimes fail to provide adequate information that outsiders use to hold managers accountable (Bebchuk & Fried, 2004). These concerns forced the Securities and Exchange Commission (SEC) to enhance disclosure requirement on compensation incentives and pay-for-performance relations in the 2006 regulation. Specifically, Reg. S-K 402(b) requires public firms to transparently disclose policies and decisions regarding top paid executives’ compensation incentives and pay-for-performance relations in the section “Compensation Discussion and Analysis” (CD&A). The SEC still detected many disclosure deficiencies after the implementation of the new rule (White, 2007).
In this study, I examine whether certain firm and management–specific characteristics are associated with the extent of compensation disclosure transparency in the context of the 2006 SEC regulation. First, the 2006 regulation provides a benchmark to quantify the transparency of compensation disclosure. I construct compensation disclosure scores based on Reg. S-K 402(b) provisions (e.g., performance measures and performance targets), with higher scores representing more transparent compensation disclosure. Moreover, the regulation change allows me to address compensation disclosure in two regulatory regimes. Before the 2006 regulation, the SEC did not call for sufficiently detailed information regarding why and how top executives are compensated. Thus, firms have considerable discretions in reporting incentive-related items. After the regulation, when firms choose not to disclose certain items, they bear possible noncompliance cost, for example, comment letters and enforcement actions from the SEC. The purpose of this study is to compare how the proposed firm and management characteristics affect the transparency of compensation disclosure in the two regulatory regimes. The final sample consists of a panel of unique 704 S&P 1500 firms covering the period from 2004 to 2007, which represents 2 years before and 2 years after the adoption of the 2006 regulation.
Based on the prior literature, I construct principal components from various firm and management–specific measures to proxy for three influential management and firm characteristics on compensation disclosure, namely, managerial power, external monitoring, and proprietary cost. Both the univariate and multivariate tests show that stronger managerial power and higher proprietary cost are associated with less transparent compensation disclosure, whereas firms under close external monitoring are more likely to disclose transparently. These effects are not conditioned on the regulatory regimes and are likely to be associated with firms’ consistent low or high compensation disclosure transparency in the research period. I document a weaker role of proprietary cost in determining compensation disclosure transparency in the postregulation years, which is likely attributable to the SEC mandating proprietary information in the 2006 regulation. I also document evidence showing stronger external monitoring tends to reduce the negative relations between compensation disclosure transparency and managerial power and proprietary cost. Finally, I posit and find an inverted U-shape relation between excess CEO pay and compensation disclosure transparency, likely because firms provide greater transparency to justify the compensation but decide to reduce transparency in fear of public justice when the excess CEO pay can no longer be justified.
This study relates to the stream of research on compensation disclosure (e.g., Laksmana, 2008; Laksmana, Tietz, & Yang, 2012; Robinson, Xue, & Yu, 2011). Laksmana (2008) examines the 1992 SEC compensation disclosure regulation and finds that certain board characteristics, such as board independence and diligence, are positively associated with compensation disclosure quality. Robinson et al. (2011) investigate 339 comment letters issued by the SEC in 2007 and find that compensation disclosure defects are positively related to excess compensation and media criticism of CEO compensation. Laksmana et al. (2012) test the readability of the CD&A section issued by S&P500 firms during the first 2 years under the 2006 regulation. They find the CD&A section becomes more difficult to read when the CEO is overcompensated. 1
This study complements the prior literature in several ways. First, although Laksmana (2008) mainly focus on board characteristics, I identify a vector of variables that influence compensation disclosure decisions from the recent literature and synthesize them into three major factors: managerial power, external monitoring, and proprietary cost, all of which are predictable and significant in explaining compensation disclosure transparency in the empirical tests. This study also complements the findings on the relation between excess CEO compensation and compensation disclosure by documenting an inverted U-shape relation. Moreover, this article extends the prior literature by examining compensation disclosure in both the pre- and postregulation periods. The unique setting created by the new SEC disclosure rule together with the self-constructed disclosure measure allows me to address compensation disclosure in both the pre- and postregulation periods. The results show that the effects of the proposed determinants of compensation disclosure are not conditioned on the regulatory regimes, although I document some evidence of reduced effect on proprietary cost after the implantation of the regulation. The results also show the interactive effects of external monitoring on the other two determinants, which highlights the importance of monitoring for compensation disclosure and supports the SEC’s call for stricter monitoring on executive compensation. 2
Background and Hypothesis Development
In 1938, the SEC promulgated the first executive compensation disclosure rule for proxy statements. Since then, disclosure requirements are published and furnished in Item 402 of Regulation S-K. The SEC amended this compensation disclosure rule in 1992 because investors demanded for more comprehensive information. Although the 1992 regulation requires firms to address CEO pay-for-performance relation and performance measures used to determine the compensation, it does not call for performance targets and other relevant information used in CEO compensation decisions. As a result, firms have much discretion in compensation disclosure under the 1992 regulation, leading to cross-sectional variation in compensation disclosure transparency.
The most prominent change in the 2006 regulation is the CD&A under Reg. S-K 402(b), which requires firms to transparently disclose policies and decisions regarding executive compensation: (1) the objectives of the compensation programs, (2) the facets that the compensation program is designed to reward, (3) each element of compensation, (4) the reasons why the registrant chooses to pay each element, (5) the manner in which the registrant determines the amount and formula for each element to pay, and (6) the manner in which Items (2) through (5) fit into the registrant’s overall compensation objectives. The disclosure regulation is strongly endorsed by investors. In a comment letter to the SEC, the CFA Institute Centre wrote the following: First, the trend toward pay that is tied to performance merits the release of such information. Second, without a reasonable description of such information, it is impossible for shareowners to understand and hold board members accountable for how senior executives are paid.
However, actual disclosure is far from satisfactory. For example, the SEC’s initial survey and the consequent 350 comment letters highlight a series of deficiencies in compensation disclosure, for example, about half of the large issuers do not provide adequate disclosure about performance targets (White, 2007).
Compensation disclosure is prepared by the compensation committee of the board with the assistance of the company’s management and outside advisors. Various management and firm characteristics may affect the compensation disclosure decision making, resulting in cross-sectional variation in compensation disclosure. For example, the committee usually reviews and discusses the disclosure with the company’s management before submitting it to the board; thus, management can have a direct influence on the final report. In this section, I discuss and hypothesize how managerial power, external monitoring, and proprietary cost affect the committee/management’s (or simply expressed as the firm’s) compensation disclosure decision.
Managerial Power and Compensation Disclosure
The corporate governance literature suggests that managers, because of their power over board members, are able to influence their own compensation to extract rents at the cost of investors (Bebchuk & Fried, 2004; Jensen, 1993). For example, CEOs are often granted bonuses for industry-wide performance rather than for the more relevant measures (Bertrand & Mullainathan, 2001). Transparent compensation disclosure helps investors monitor the decision-making processes in executive compensation and therefore empowers investors to fight against management rent extraction through shareholder activism (Ertimur, Ferri, & Muslu, 2011). As the “information obfuscation” theory explains, obfuscated disclosure makes it difficult for investors to process and detect rent extract information (Bloomfield, 2002). Therefore, obfuscated compensation disclosure may help CEOs camouflage rent extraction and reduce investor activism. Consequently, top executives, especially those with substantial managerial power, prefer less transparent compensation disclosure. The above discussion leads to the following hypothesis, stated in the alternative form:
External Monitoring and Compensation Disclosure
Firms are monitored by a variety of outsiders, including shareholders, outside board members, analysts, and auditors, whose supervision according to prior literature is positively correlated with information disclosure (e.g., Beasley, 1996; Bushee & Noe, 2000; Dechow, Sloan, & Sweeney, 1996; Healy, Hutton, & Palepu, 1999). I argue for a positive relation between external monitoring and compensation disclosure. On one hand, compensation disclosure assists external monitoring. Compensation disclosure significantly reduces the cost of monitoring, allowing outsiders to better understand managerial incentives and monitor managerial actions induced by those incentives; it thus increases outsiders’ ability to monitor effectively. On the other hand, external monitoring induces more compensation disclosure. Prior literature finds that when institutions increase equity stakes, they tend to monitor more closely and exert more pressure on managers to release information (Bushee & Noe, 2000; Healy et al., 1999). 3 Therefore, the second hypothesis is expressed as follows in the alternative form:
Proprietary Cost of Compensation Disclosure
Disclosure of detailed managerial compensation contracts could harm firm value—a proprietary cost argument regularly used to justify nondisclosures (Verrecchia, 1983). Compensation information is inherently proprietary. First, it reveals firms’ priorities and emphases in reducing agency cost and improving firm value. As Holmstrom (1979) suggests, board members will employ compensation measures that provide additional information about managerial effort in solving the agency problem within the firm. For example, financially constrained firms are more likely to tie CEO bonus to cash flows. In addition, prior literature also suggests that compensation contracts reveal information about firms’ investment plans, projected earnings, and dividend policies (Gaver, Gaver, & Austin, 1995; Hanlon, Rajgopal, & Shevlin, 2003; Smith & Watts, 1992). The disclosure of otherwise nonpublic compensation information could adversely affect firms’ competitiveness, especially when interested parties, such as political forces, labor unions, and industry competitors, learn from compensation disclosure at the firm’s cost. Studies on the adoption of the 1992 compensation disclosure rules list proprietary cost, for example, political cost, as the main reason why compensation disclosure may possibly harm shareholder value (Lo, 2003). 4 Rational decision makers would therefore avoid compensation disclosure when the inherent proprietary cost is high. These augments lead to the third hypothesis, which is stated in the alternative form:
Data and Research Design
Sample Selection
CEO compensation data are obtained from ExecuComp over the 2004-2007 period, which is divided into a 2-year preregulation subsample (2004-2005) and a 2-year postregulation subsample (2006-2007). I exclude firms that replaced CEOs (3,617 observations) during the sample period because CEO turnovers hinder the cross-period comparison. Next, I drop 532 observations of financial firms (Standard Industrial Classification [SIC] codes 6000-6999). I then match the remaining sample to Compustat and drop 204 unmatched observations. I manually collect governance and compensation disclosure information from the SEC Edgar database and drop 15 observations that do not have relevant public filings. Finally, I exclude 35 observations because they have not established any cash incentive plan for their CEOs. 5 The final sample consists of 2,806 firm-year observations from 704 unique firms. Panel A of Table 1 summarizes the sample selection process.
Sample Selection and Distribution.
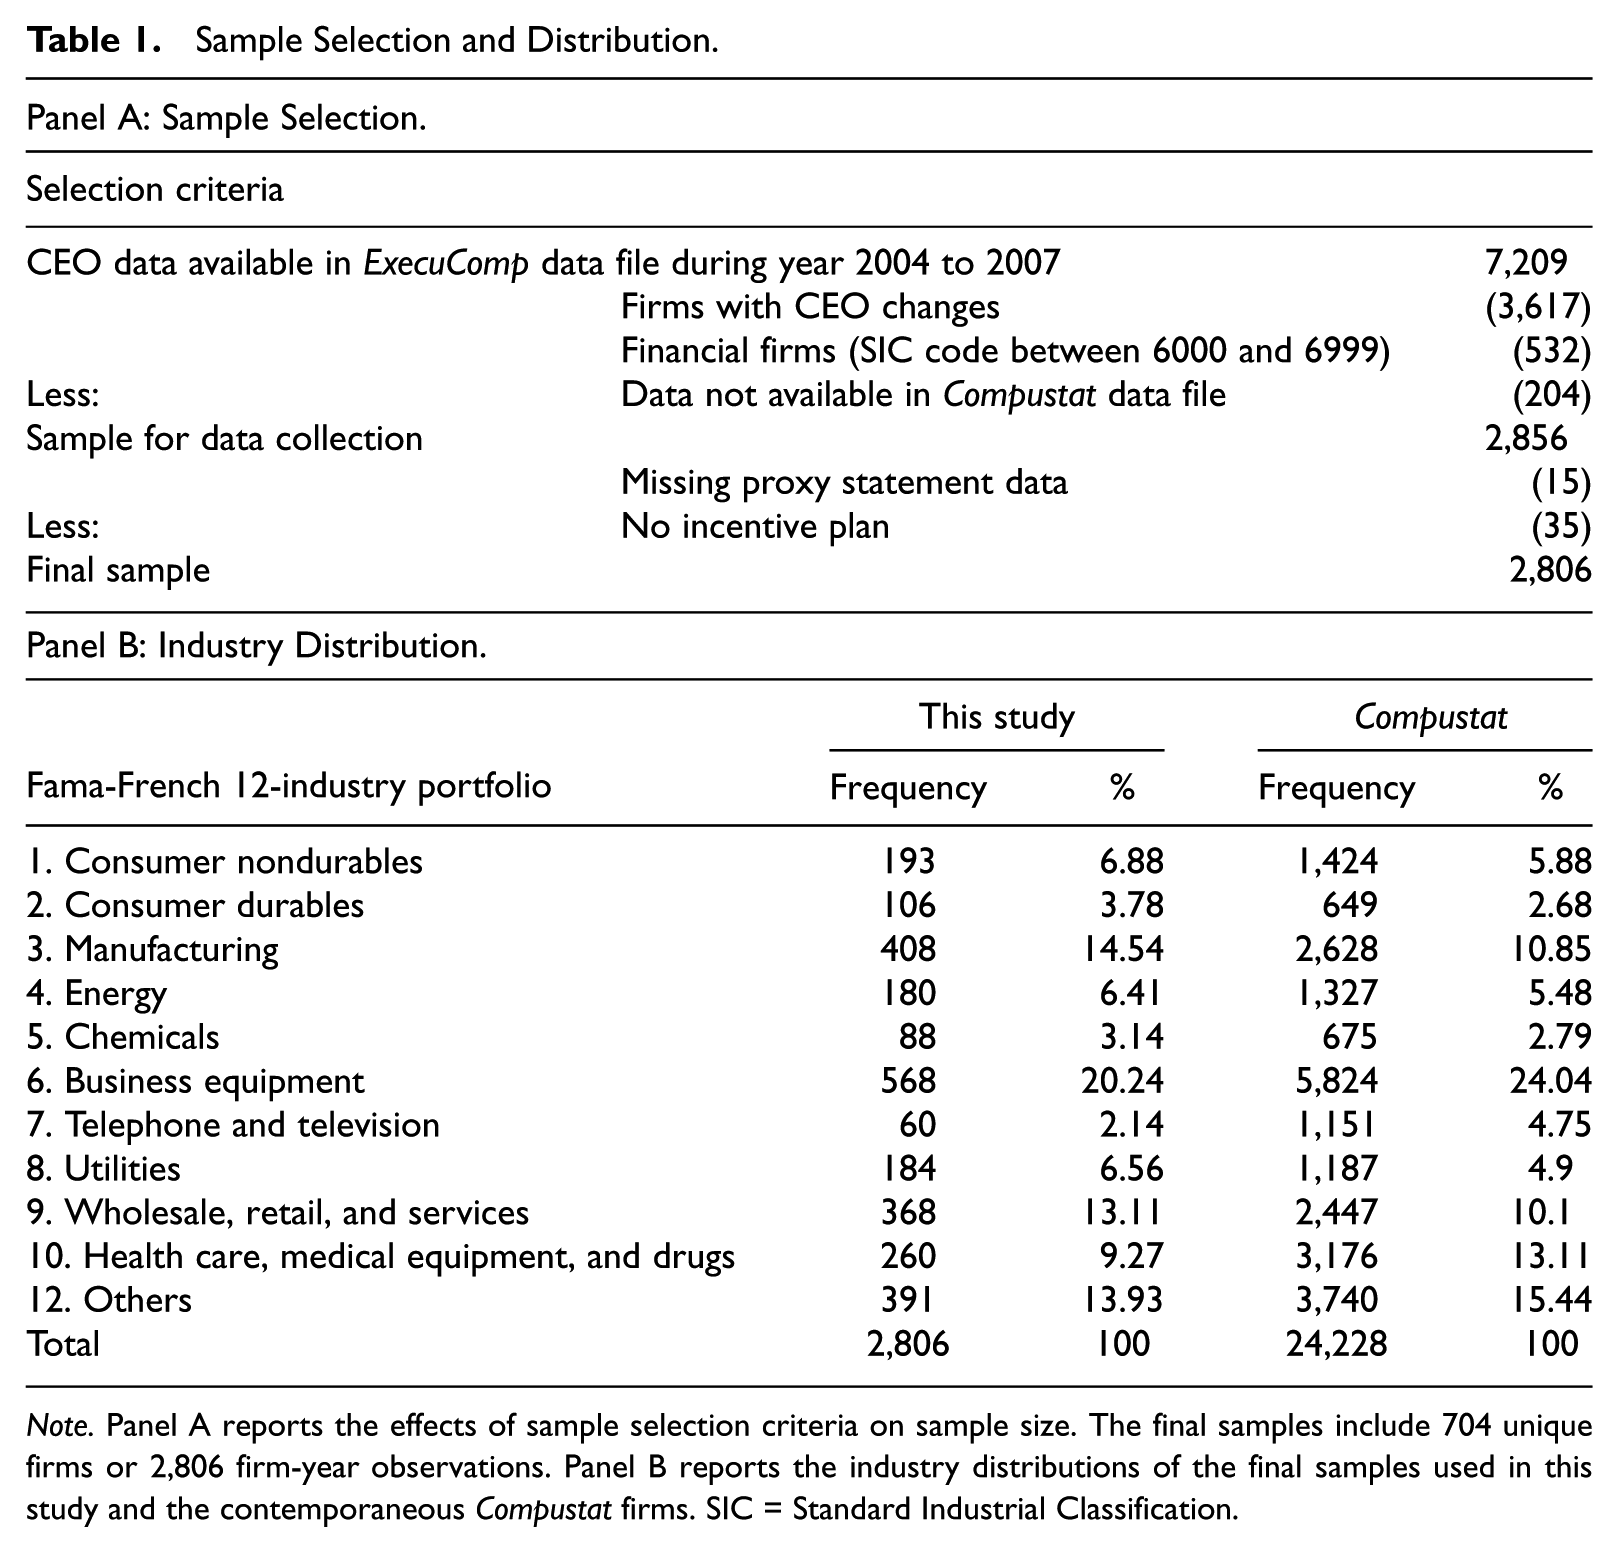
Note. Panel A reports the effects of sample selection criteria on sample size. The final samples include 704 unique firms or 2,806 firm-year observations. Panel B reports the industry distributions of the final samples used in this study and the contemporaneous Compustat firms. SIC = Standard Industrial Classification.
Panel B of Table 1 compares the Fama-French industry distributions between the sample firms and the populace in Compustat. The proportion of each industry in the sample is comparable with that in Compustat, indicating that the sample selection is not biased toward any specific industry and that the test sample is representative of the general population.
Measuring Compensation Disclosure
For the purposes of this study, the term “compensation disclosure” refers to incentive compensation-related disclosures, that is, the design of compensation incentives and the realization of the final payments requested by Reg. S-K 402(b). Note that this rule covers all forms of incentive compensation. I particularly focus on short-term incentive compensation, for example, annual bonus and cash incentive plan, because it is commonly available in most CEOs’ compensation contracts. The design and execution of such plans involve substantial management discretion, leading to great variation in compensation disclosure. Indeed, short-term incentives such as annual bonuses have already been the focus of extensive research on executive compensation (Murphy, 1999).
I hand collect and construct relevant measures from proxy statements and related SEC filings. First, from the CD&A sections in the proxy statements, I extract seven disclosure items representative of Reg. S-K 402(b) disclosures, that is, range of bonuses (CD1), performance measures (CD2), performance weights (CD3), performance targets (CD4), computation formula (CD5), nonfinancial measures and personal performance measure (CD6), and discussions of actual payment (CD7). 6 Except discussions of actual payment, which mainly release information about ex post payout execution, the other six measures focus on information about ex ante compensation incentives. Nevertheless, one should consider all seven measures to gauge the extent of compensation disclosure.
I develop a rating system that evaluates each disclosure item based on the extent to which compensation information is disclosed. For example, when Abbott Laboratories discussed how it arrived at the actual compensation payment (CD7), it disclosed the following information: “since the company financial goals were met in 2007, that portion of each participant’s award was paid accordingly.” Apparently, this disclosure does not open the “black box” and tell readers how those executives are paid; therefore, it scores zero in this rating system. A transparent disclosure scores 1, and one example is from American Electric Power, which in its 2007 proxy statement clearly illustrates how it paid its executives by detailing payout opportunities, calculation formula, and actual performance. Any disclosure that falls somewhere between transparent and opaque receives a score of 0.5. 7 The aggregate measure (SUMCD) is the sum of the seven individual scores and has a range from 0 to 7, with 0 being the opaquest disclosure score and 7 the most transparent.
Table 2 presents the descriptive statistics for the seven compensation disclosure items (CD1-CD7) and the total score (SUMCD). Over the 4-year sample period, the mean (median) of the compensation disclosure index SUMCD is 2.78 (2.5), demonstrating an overall low transparency of compensation disclosure. A subsample comparison suggests that compensation disclosure improves significantly after the SEC pronouncement, with the SUMCD mean (median) increasing from 1.82 (2.0) in the preregulation period to 3.73 (4.0) in the postregulation period, which is statistically significant at a 1% confidence level. This improvement is evident for all individual compensation disclosure items. The most notable cross-period improvement among the seven individual items is performance target disclosure (CD4), with only 3% of the sample firms disclosing specific performance targets before the regulation but 48% after the regulation, which is consistent with the fact that performance targets receive considerable attention under the new regulation. However, the average postregulation SUMCD is only 3.73, which is well below the theoretical value of 7 for a mandatory disclosure, suggesting that noncompliance of compensation disclosure is prevalent, and firms still have substantial discretion in the disclosure decision making under the new regulation, at least in the first 2 years of its adoption.
Descriptive Statistics of the Compensation Disclosure Score.
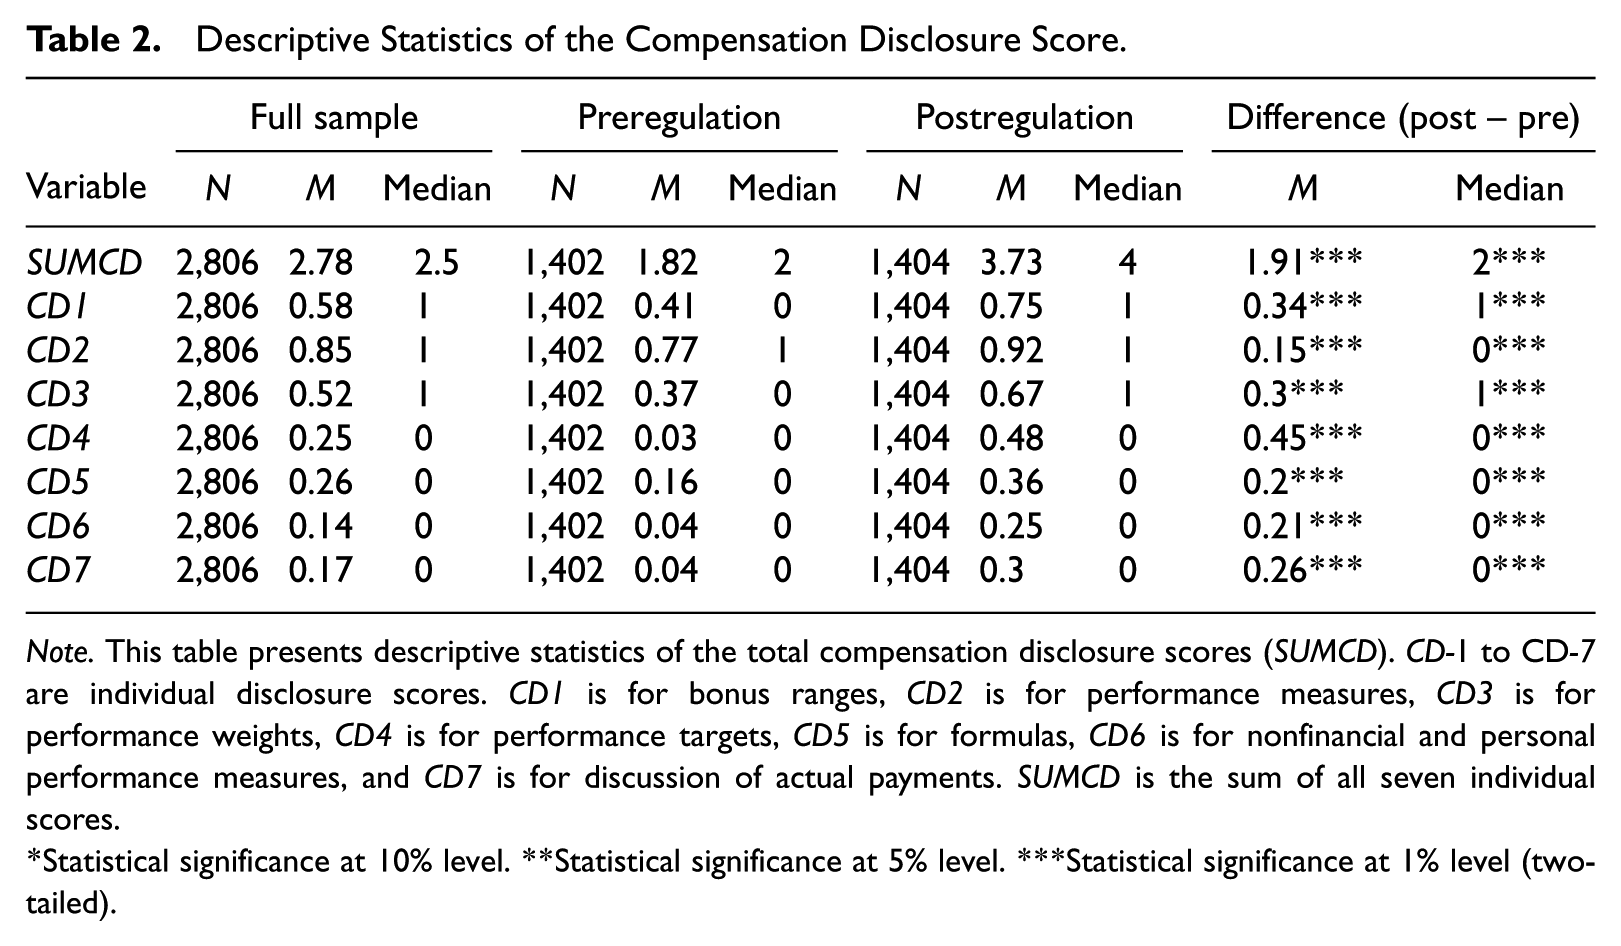
Note. This table presents descriptive statistics of the total compensation disclosure scores (SUMCD). CD-1 to CD-7 are individual disclosure scores. CD1 is for bonus ranges, CD2 is for performance measures, CD3 is for performance weights, CD4 is for performance targets, CD5 is for formulas, CD6 is for nonfinancial and personal performance measures, and CD7 is for discussion of actual payments. SUMCD is the sum of all seven individual scores.
Statistical significance at 10% level. **Statistical significance at 5% level. ***Statistical significance at 1% level (two-tailed).
Next, I develop a compensation disclosure index (CDI) to facilitate cross-regulation comparisons of compensation disclosure transparency. As SUMCD is much higher after the regulation, problem may arise when it is used in a pooled panel for cross-regulation comparison. To better evaluate firms’ compensation disclosure practice in different disclosure regimes, I measure the compensation disclosure index (CDI) using the yearly deciles of SUMCD. CDI ranges between 0.1 and 1, with 1 being the most transparent disclosure.
Research Design
I hypothesize that compensation disclosure is negatively associated with managerial power (H1a) and proprietary cost (H1c), while positively associated with external monitoring (H1b). I identify these relations by regressing the CDI on measures of CEO power, external monitoring, and proprietary cost and by controlling for standard economic determinants of firm disclosure (e.g., Feng, Li, & McVay, 2009). The model specification takes the following form:
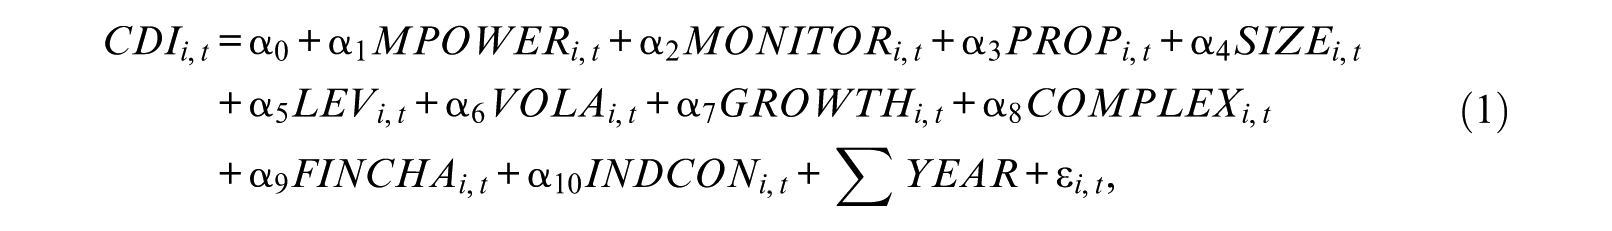
where indices i and t denote firm and year, respectively. The dependent variable CDI is the compensation disclosure index. To capture the multifaceted nature of managerial power, external monitoring, and proprietary cost, I construct multiple measures for each of them and take the principal component value as the independent variable. 8
The measure of managerial power, MPOWER, has four components: CEO founder (FOUNDER), founding family (FAMILY), CEO ownership (CEOOWN), and independent chair (INDCHAIR). FOUNDER equals 1 if the CEO/chairperson is the founder of the company and 0 otherwise, and FAMILY equals 1 if the CEO/chairperson is not the founder but is a member of the founding family and 0 otherwise. Prior research shows that founders or their families have a strong influence over a firm’s activities and often enhance their controls through dual-class stock, disproportionate board representation, and voting agreements (e.g., Anderson & Reeb, 2003; Claessens, Djankov, & Lang, 2000). I follow the procedures illustrated in Anderson and Reeb (2003) to identify information about founders and their families. CEOOWN, a categorical variable measuring three levels of ownership, equals 2 if the CEO/chairperson owns 10% or more of the firm equity, 1 if the ownership is between 3% and 10%, and 0 if the ownership is less than 3%. Managers with larger equity ownership have more votes and thus more power in firm decisions. Because an independent chairperson has the incentive and ability to restrict CEO power, I include chair independency as a proxy for managerial power: INDCHAIR is an indicator variable equal to 1 if the board is chaired by an independent director, and 0 otherwise. 9
External monitoring, MONITOR, also comprises four components: independent director (INDDIR), Big 4 auditor (BIG4), institutional ownership (IOR), and analyst following (NUMAF). INDDIR is a continuous variable that measures the proportion of independent directors on a board. Directors have incentives to monitor the CEO and replace him when his performance is poor (Hermalin & Weisbach, 2003), and director independence further strengthens this monitoring mechanism, restraining CEO entrenchment and improving firm value (e.g., Chhaochharia & Grinstein, 2009; Dechow et al., 1996). BIG4 equals 1 if the firm is audited by a Big 4 audit firm, and 0 otherwise. Larger audit firms have motives to provide stricter external monitoring because they bear higher reputation risk and litigation costs (e.g., Francis, 2004; Lennox, 1999). IOR is the percentage of institutional ownership at the end of the fiscal year. Institutional ownership provides an effective monitoring role in the market because institutional investors have the incentive and ability to collect information and monitor management (Collins, Gong, & Hribar, 2003; Shleifer & Vishny, 1997). NUMAF is the average number of active analyst followings during the fiscal year from I/B/E/S. Financial analysts monitor and discipline managers through their information searching and reporting activities (Healy & Palepu, 2001).
Proprietary cost, PROP, has five components: firm-level R&D intensity (RD), firm age (FIRMAGE), high technology industry (HIGHTECH), industry-wide price-cost margin (IND_MGN), and industry-level R&D intensity (IND_RD). RD is calculated as R&D expenses scaled by total assets. The literature suggests modern firms rely more on R&D than on tangible assets to sustain their competitive advantage (Wang, 2007). In other words, R&D-intensive companies and their CEOs tend to possess more proprietary information. FIRMAGE is calculated as the natural logarithm of the number of years since firm inception. I include firm age because start-up companies tend to have new business ideas and strategies and thus bear a high proprietary cost. The next three components are measured at industry level. HIGHTECH is an indicator variable that equals 1 if a firm’s three-digit SIC code is one of the following: 283, 284, 357, 366, 367, 371, 382, 384, and 737, and 0 otherwise (Amir, Lev, & Sougiannis, 1999). Extant research suggests that the high-tech industry is essentially driven by R&D investment (Amir et al., 1999; Barron, Byard, Kile, & Riedl, 2002). Following Karuna (2007), I also include industry-level price-cost margin (IND_MGN) and industry-level R&D expenditure (IND_RD), both measured with Compustat Segment data by four-digit SIC codes.
The model controls for other factors that prior literature shows to be associated with firms’ disclosure decisions. Firm size (SIZE), which is measured as the natural logarithm of market capitalization, captures the overall information environment (Lang & Lundholm, 1993). Larger firms are more closely followed by analysts, the media, and regulators who have higher demands for firm disclosures. In addition, larger firms enjoy lower costs for information dissemination, which induces more disclosures (Lang & Lundholm, 1993). I control for firm leverage (LEV), measured as total debt divided by total assets, as debt holders will more frequently solicit corporate information to protect their investment from shareholder appropriation when a firm’s leverage is higher. Following Feng et al. (2009), I control for four principal component variables that capture the underlying variability and uncertainty when firms disclose information: volatility (VOLA), growth (GROWTH), operation complexity (COMPLEX), and financial challenges (FINCHA). 10 Finally, I control for industry concentration, INDCON, using the Herfindahl–Hirschman index, which measures the market share of the largest four companies within each four-digit SIC industry.
The sensitivity of compensation disclosure to managerial power, external monitoring, and proprietary cost,
Results
Descriptive Statistics
Panel A of Table 3 summarizes the descriptive statistics for the variables of interest. Each continuous variable is winsorized at its first and 99th percentile levels to reduce the effects of extreme values. Regarding the managerial power measures, the mean values of FOUNDER and FAMILY indicate that 20% of the sample firms have CEO founders and 12% have CEOs from a founding family, which is comparable with the findings by Anderson and Reeb (2003). The majority of CEO equity ownership is less than 3%, and therefore, the indicative variable CEOOWN has a median value of 0. Only 14% of the sample firms have an independent chairperson (INDCHAIR). The principal component of these variables, POWER, loads positive effects from all variables except INDCHAIR, which negatively affects managerial power. POWER has a mean (median) of −0.02 (−0.76), where the higher value represents stronger managerial influence over board members. With respect to the external monitoring measures, on average, 76% of the board directors are independent (INDDIR), 80% of the shares are under institutional ownership (IOR), and the sample firms are followed by 6.49 analysts (NUMAF). In all, 95% of the sample firms are audited by Big 4 audit firms (BIG4). The principal component variable, MONITOR, evenly loads on the effects from the above four measures and has a mean (median) of 0.01 (0.18). The higher the MONITOR value, the more closely outsiders monitor the firm. The principal component of the proprietary cost variables, PROP, primarily loads on the effects from HIGHTECH, IND_MGN, and RD. It equates to 25.7% of the effect from FIRMAGE—but in an opposite direction, which is consistent with the expectation that younger firms put forward more proprietary information. PROP has a mean (median) of −0.01 (−0.78), with a higher value implying a higher proprietary cost for the sample firm in disclosing compensation-related information.
Descriptive Statistics.
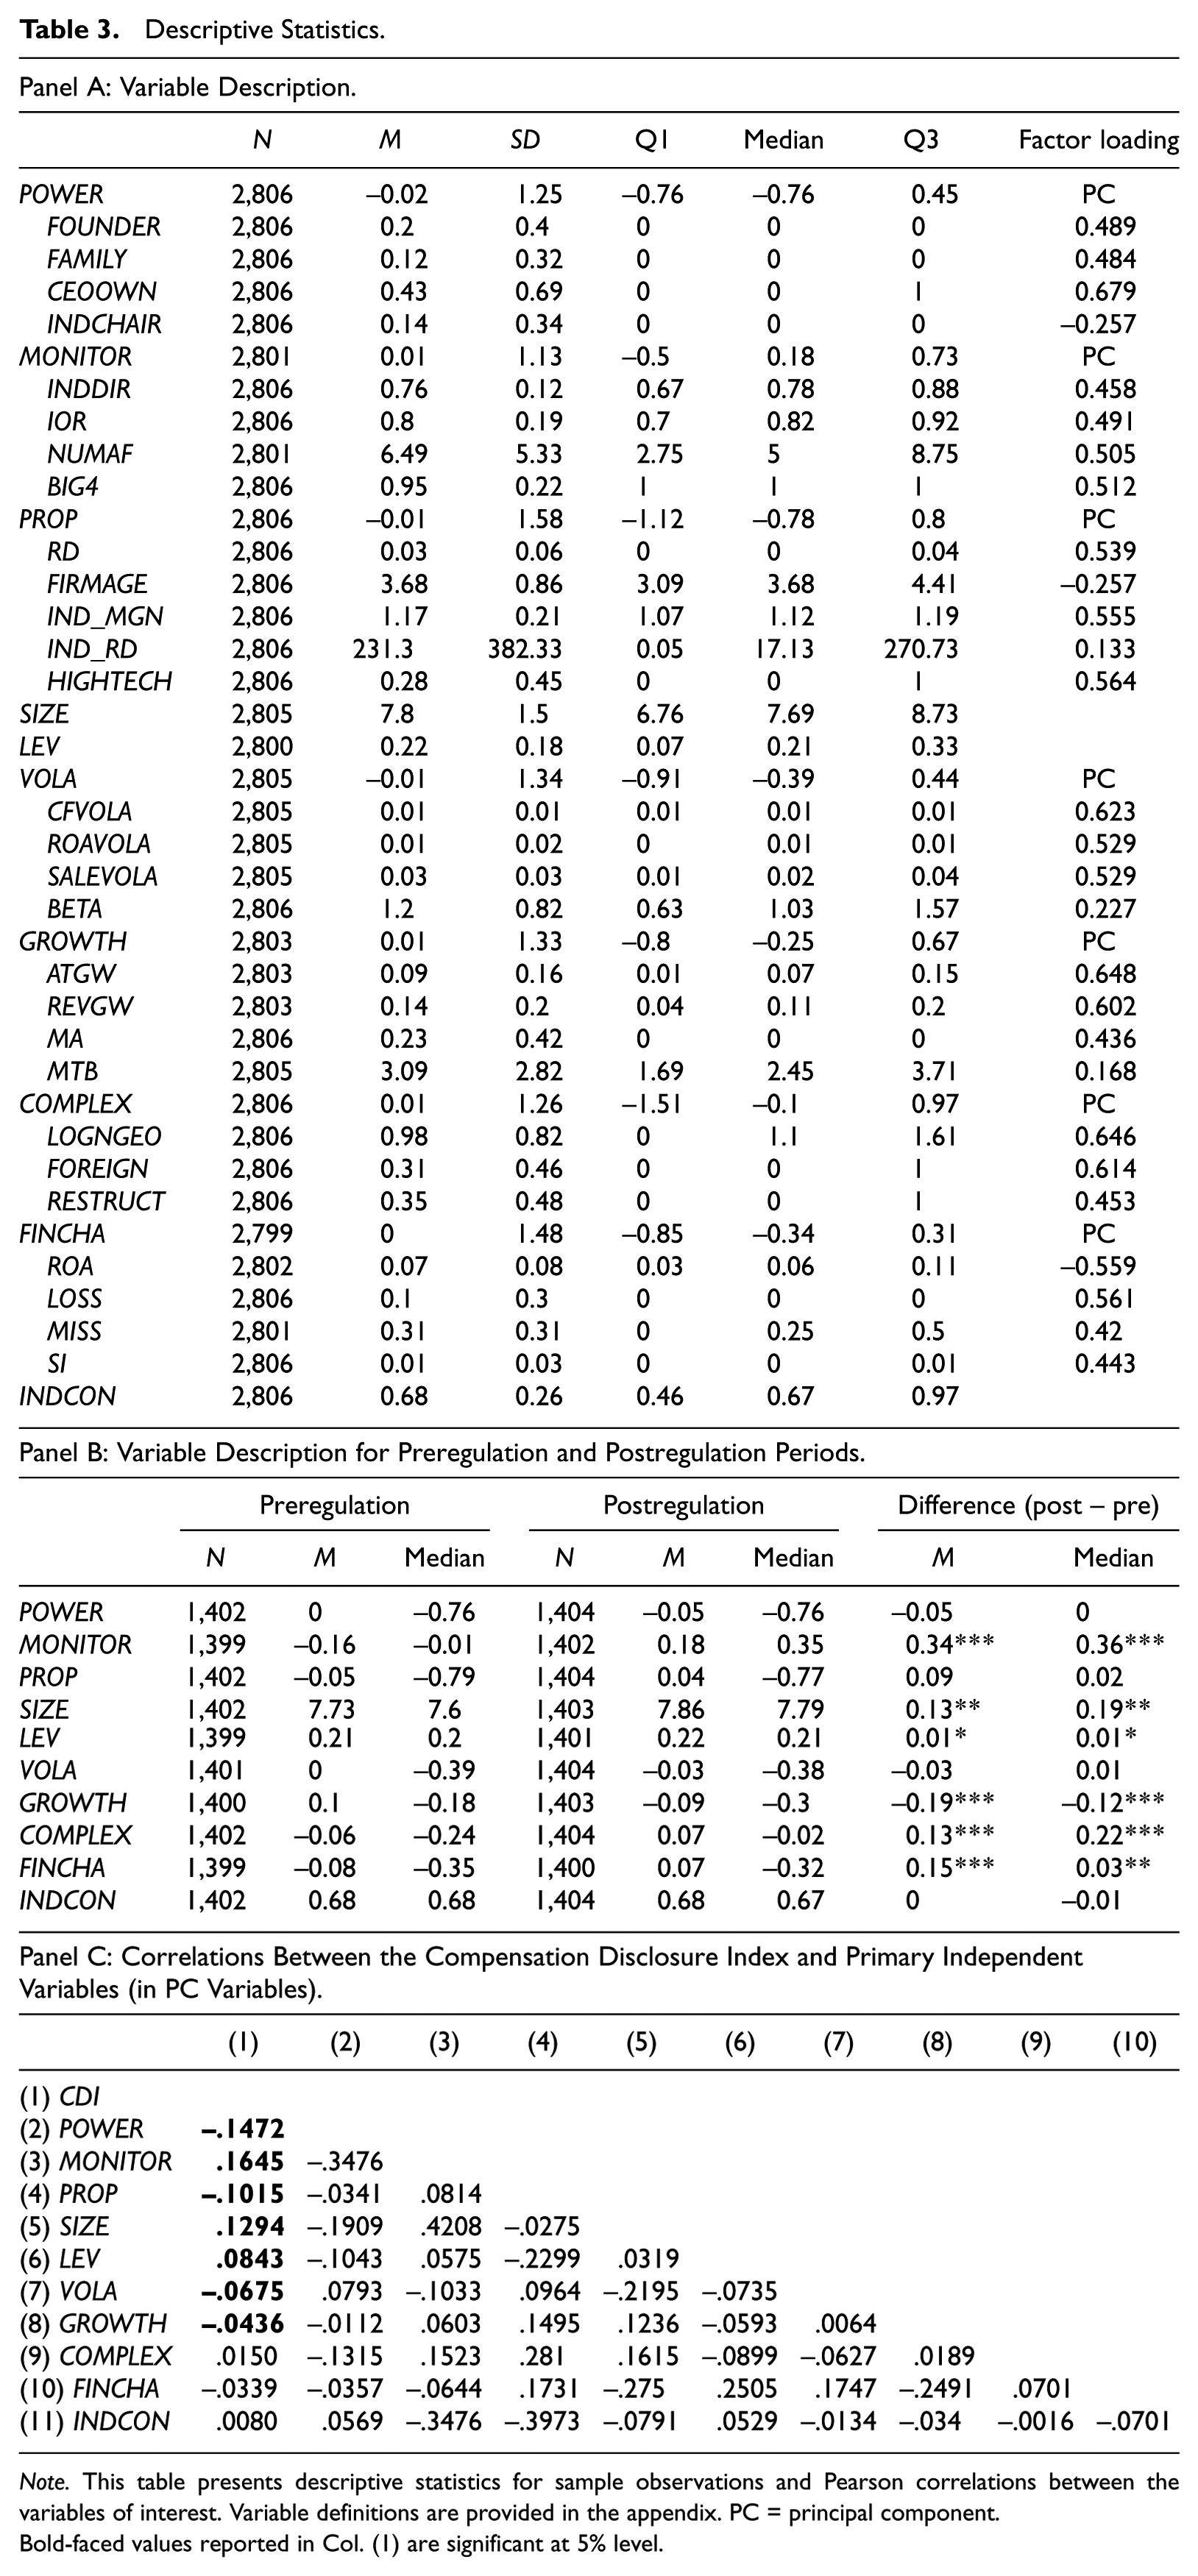
Note. This table presents descriptive statistics for sample observations and Pearson correlations between the variables of interest. Variable definitions are provided in the appendix. PC = principal component. Bold-faced values reported in Col. (1) are significant at 5% level.
The rest of the panel describes the distributions of control variables. The average market value of the sample firms is US$2,440 million (or 7.8 in natural logarithm), and the average firm leverage is 22%. The factor loadings of the next four principal component variables representing volatility (VOLA), firm growth (GROWTH), operating complexity (COMPLEX), and financial challenge (FINCHA), respectively, are comparable with the prior literature (Feng et al., 2009). For industry concentration (INDCON), the sample firms report, on average, 0.68 on the Herfindahl–Hirschman index, which is also comparable with Karuna’s (2007) finding of 0.62.
Panel B of Table 3 compares the variable distributions in the pre- and postregulation periods. In addition to the differences in the compensation disclosure scores, the postregulation period differs from the preregulation period in the following sense: Postregulation firms are slightly larger, which is likely due to the rising share prices during that period; furthermore, they operate with more complexity, have lower growth, and face more financial challenges on average. The post period also saw stronger monitoring from outsiders. All these differences are significant at a 5% confidence level or higher in both the between-sample t tests and the Wilcoxon rank-sum tests.
Panel C of this table reports the Pearson correlation coefficients between the compensation disclosure index (CDI) and the key variables used in analysis. Consistent with the conjecture, CDI is negatively correlated with managerial power (POWER) and proprietary cost (PROP) but positively correlated with monitoring (MONITOR); all these correlations are significant. The signs and significance of these correlations hold for both the pre- and postregulation samples. 11 SIZE and LEV are all positively correlated with compensation disclosure, whereas GROWTH and VOLA are negatively correlated with compensation disclosure. These findings are consistent with findings in the existing literature that corporate disclosures increase with firm size and pressure from debt holders and that firms tend to reduce disclosures when they experience high growth or operate in a volatile environment (e.g., Feng et al., 2009).
Overall, the descriptive statistics provide preliminary evidence that when monitoring is stronger, compensation disclosure tends to be more transparent. They further show that when managerial power is higher or proprietary cost is larger, the transparency will be lower.
Main Results
Table 4 reports the regression results of Equation 1. The pooled sample regression results are reported in column 1. Consistent with the predictions, managerial power and propitiatory cost reduce compensation disclosure transparency, while external monitoring improves. Results also show that, not surprisingly, large firms and leveraged firms are positively associated with increased compensation disclosures, whereas rapidly growing firms are less so, and these effects are significant in the regression. 12
Regression of the Determinants of Compensation Disclosure.
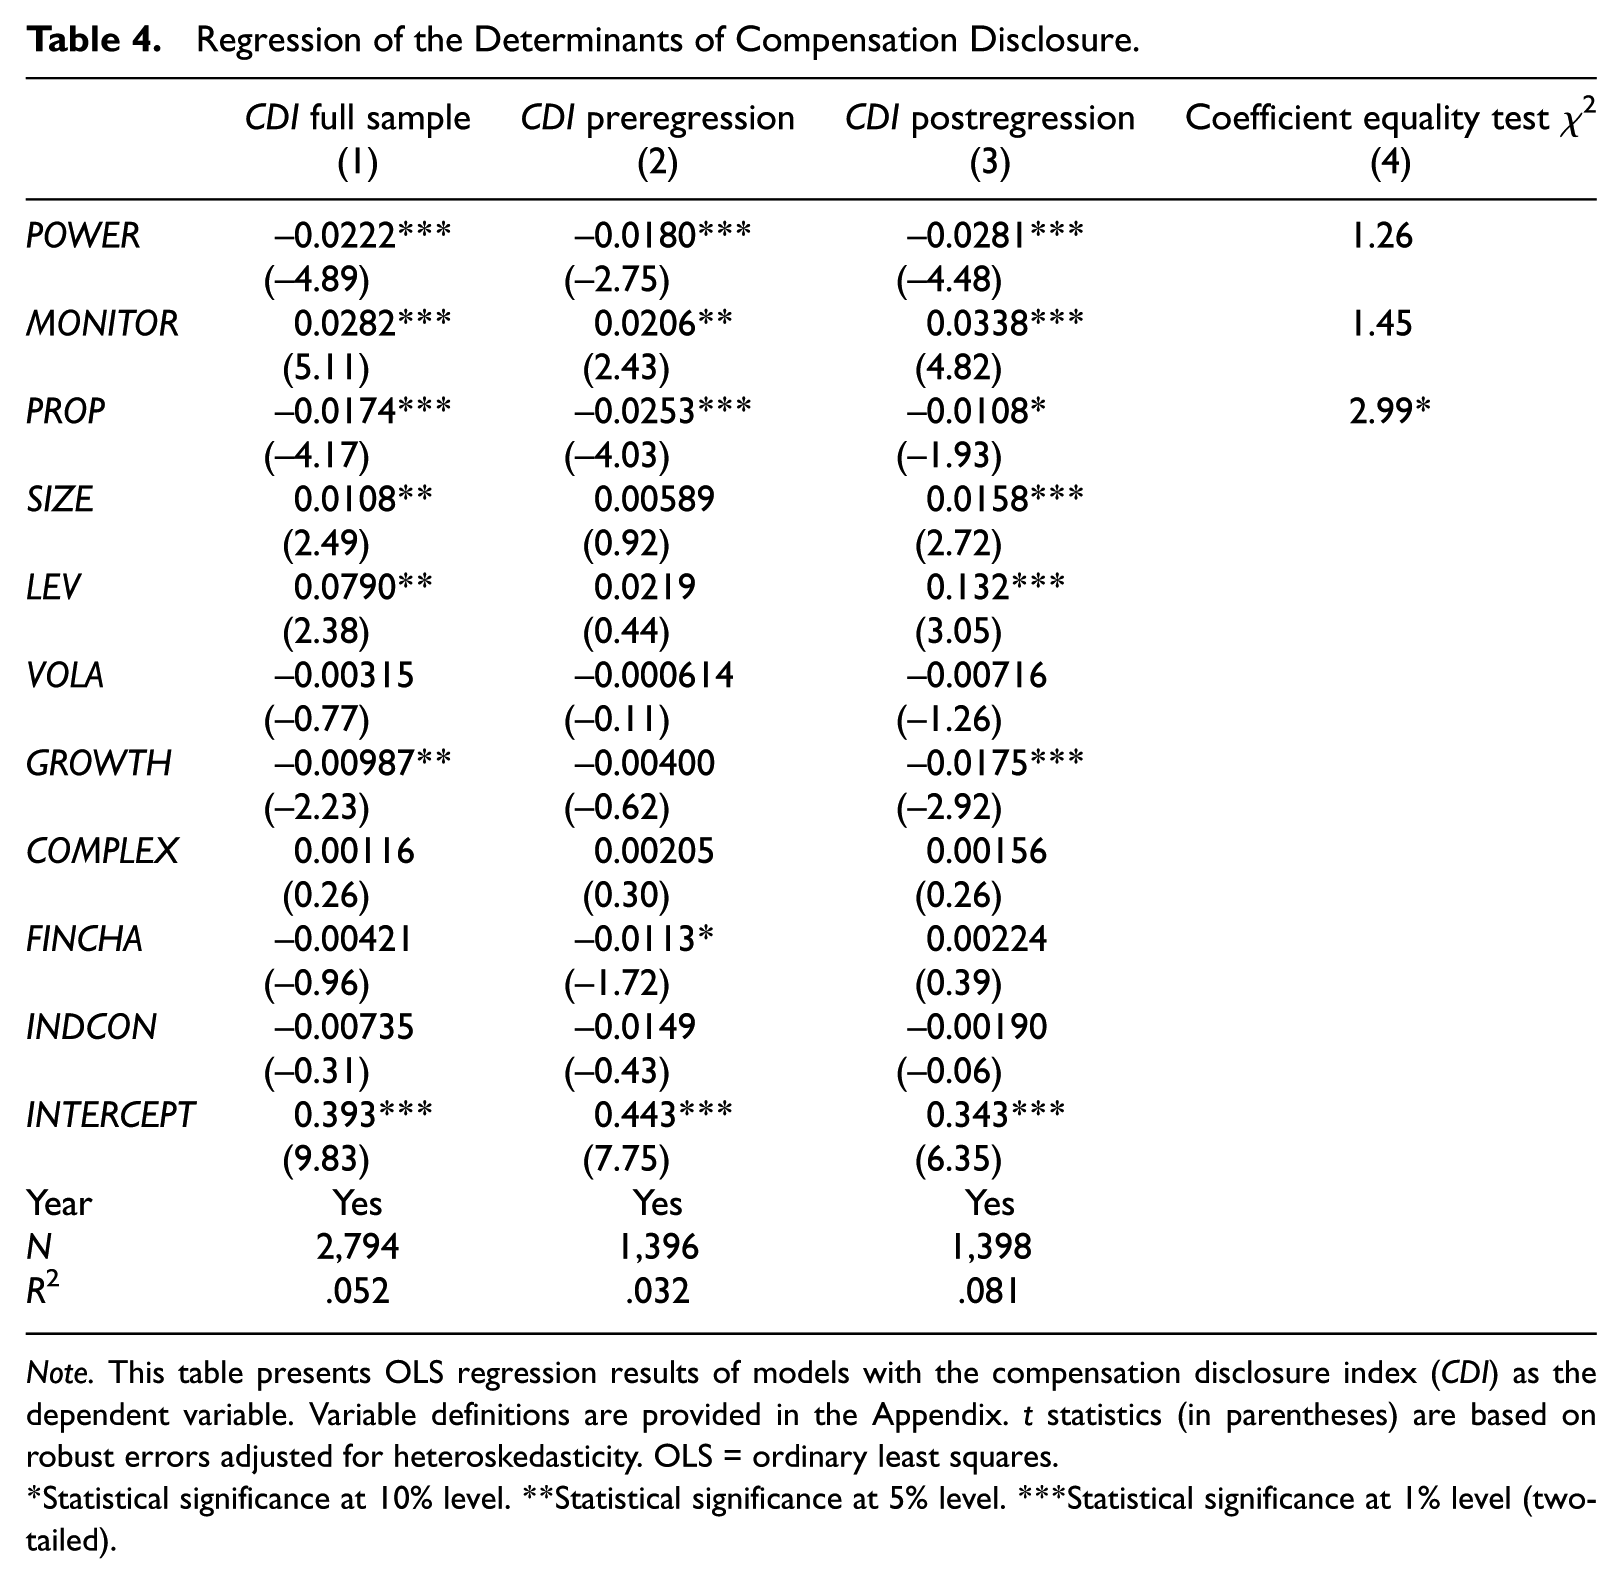
Note. This table presents OLS regression results of models with the compensation disclosure index (CDI) as the dependent variable. Variable definitions are provided in the Appendix. t statistics (in parentheses) are based on robust errors adjusted for heteroskedasticity. OLS = ordinary least squares.
Statistical significance at 10% level. **Statistical significance at 5% level. ***Statistical significance at 1% level (two-tailed).
The 2006 compensation disclosure regulation brings significant changes to the way firms disclose compensation information. It is possible that the regulation has fundamentally changed the disclosure decision process, for example, noncompliance cost is larger enough to dominant all other considerations, and therefore, the findings are no longer consistent before and after the regulation. To address this concern, I separately test the association between CDI and the determinants in the pre- and postregulation subsamples. As seen in columns 2 and 3, the coefficients on POWER, MONITOR, and PROP are significant and have the predicted signs in both subsamples, suggesting that noncompliance cost has not wiped out reporting discretions after the regulation and relations between compensation disclosure transparency and the variables of interest remain. 13
Has the regulation marginally changed the magnitude of the effects from managerial power, external monitoring, and proprietary cost on compensation disclosure transparency? To determine whether the magnitude of these effects has marginally changed across regulation, I test the difference of the coefficients reported in columns 3 and 2. The postregulation regression has shown larger absolute values for the coefficients of POWER and MONITOR, suggesting these two factors become more important when firms make compensation disclosure decision in the postregulation period. It is possible that more discretions arise from managerial power after the regulation. For example, Faulkender and Yang (2012) find that manipulation in CEO compensation peer group selection becomes more severe after the 2016 regulation. However, as shown in column 4, these differences are statistically insignificant. The absolute value of the coefficient of PROP is smaller in the postregulation period, and this difference is statistically significant at the 10% level (χ2 = 2.99), partly because the benefit of withholding proprietary information is significantly reduced by the regulatory cost incurred from the new regulation.
Consistent Low (High) Compensation Disclosure Transparency
In this section, I explore two groups of firms that have consistently low or high compensation disclosure transparency during the research period. The purpose of this test is to find whether firms’ compensation disclosure practice is consistent before and after the regulation and whether this consistency is associated with managerial power, external monitoring, and proprietary cost. I start with identifying two groups of firms: one with consistent low compensation disclosure transparency and one with consistent high transparency. CLOW (CHIGH) stands for consistent low (high) disclosure transparency, which is an indicative variable that equals 1 if a firm’s CDI is below (above) the lower (upper) quartile in both the pre- and postregulation periods. OTHER represents the rest of the firms, which equals 1 if both CLOW and CHIGH equal 0.
Panel A of Table 5 summarizes the descriptive statistics. Over the sample period, 54 firms (8% of the sample) belong to the CLOW group, 108 firms (16% of the sample) belong to the CHIGH group, and the OTHER group has 539 firms. 14 I calculate 4-year average values of managerial power (APOWER), external monitoring (AMONITOR), proprietary cost (APROP), and other independent variables listed in Equation 1. On average, firms in the CLOW (CHIGH) group face the highest (lowest) managerial power and proprietary cost and lowest (highest) external monitoring; firms in the OTHER group carry the middle values for all three measures. 15 Panel B reports the probit regression results for the between-group comparisons. When comparing the CLOW group with the OTHER group, I find that firms with higher managerial power and weaker external monitoring are more likely to consistently produce compensation disclosure in low transparency. When comparing the OTHER group with the CHIGH group, I find that lower proprietary cost helps firms maintain consistent high compensation disclosure transparency. These findings suggest that firms’ compensation reporting policies tend to be consistent, and this long-run compensation disclosure transparency is associated with considerations such as managerial power, external monitoring, and proprietary cost.
Consistent Low (High) Compensation Disclosure Transparency, Cross-Regulation Analysis.
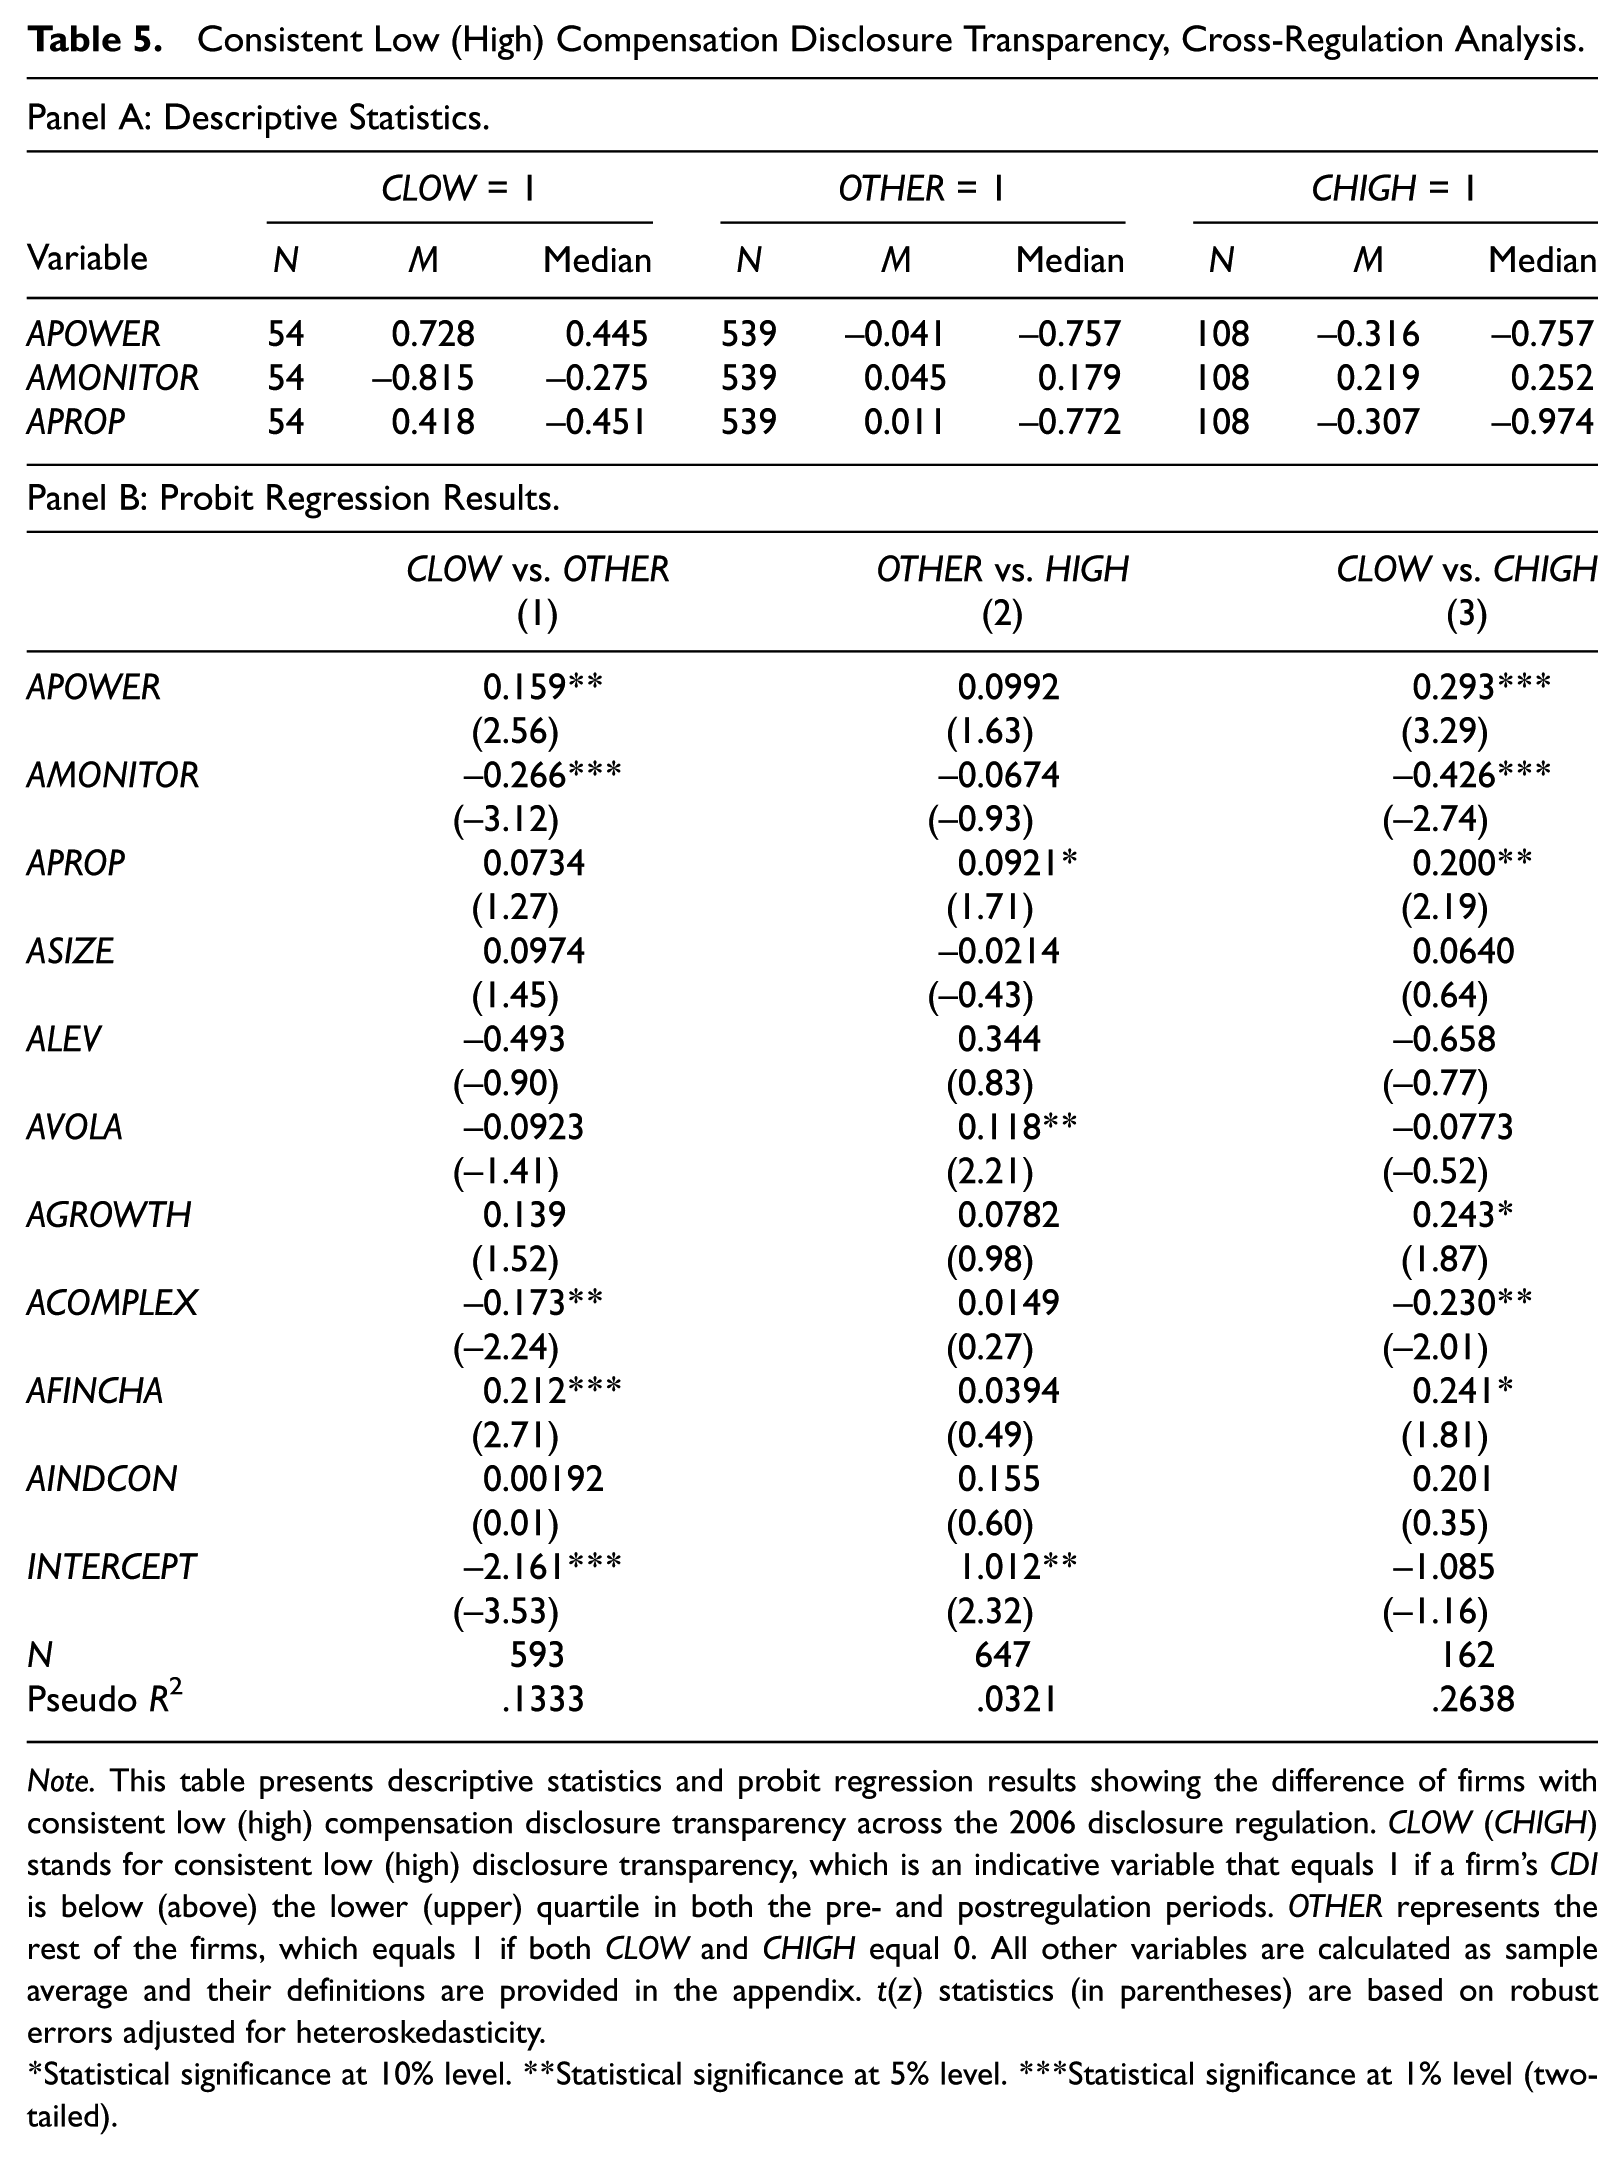
Note. This table presents descriptive statistics and probit regression results showing the difference of firms with consistent low (high) compensation disclosure transparency across the 2006 disclosure regulation. CLOW (CHIGH) stands for consistent low (high) disclosure transparency, which is an indicative variable that equals 1 if a firm’s CDI is below (above) the lower (upper) quartile in both the pre- and postregulation periods. OTHER represents the rest of the firms, which equals 1 if both CLOW and CHIGH equal 0. All other variables are calculated as sample average and their definitions are provided in the appendix. t(z) statistics (in parentheses) are based on robust errors adjusted for heteroskedasticity.
Statistical significance at 10% level. **Statistical significance at 5% level. ***Statistical significance at 1% level (two-tailed).
Interaction Among Managerial Power, External Monitoring, and Proprietary Cost
In this section, I explore the cross-sectional variation in the effects of managerial power, external monitoring, and proprietary cost on compensation disclosure transparency. For example, how does strong external monitoring affect the association between managerial power and compensation disclosure? To do this, I replace the variable of interest with a dummy variable and insert its interaction terms with the rest two determinants into the regression. For example, DMONITOR is an indicative variable that equals 1 if MONITOR is above the yearly sample median, and 0 otherwise. 16 Two related interaction terms, DMONITOR × POWER and DMONITOR × PROP, are created to capture the interactive effects between external monitoring and managerial power, and between external monitoring and proprietary cost, respectively. As column 2 of Table 6 shows, the coefficient on DMONITOR is negative and significant, and the coefficients on the two interaction terms are positive and significant at the 10% level, suggesting that strong monitoring not only improves compensation disclosure transparency but also mitigates the negative effects of managerial power and proprietary cost on compensation disclosure. When testing the interactive effects of proprietary cost, as reported in column 3, I find that external monitoring has an enhanced effect on compensation disclosure when proprietary cost is high. I find no evidence that managerial power has significant interactive effects with the other two determinants.
Interactions Between Determinants of Compensation Disclosure.
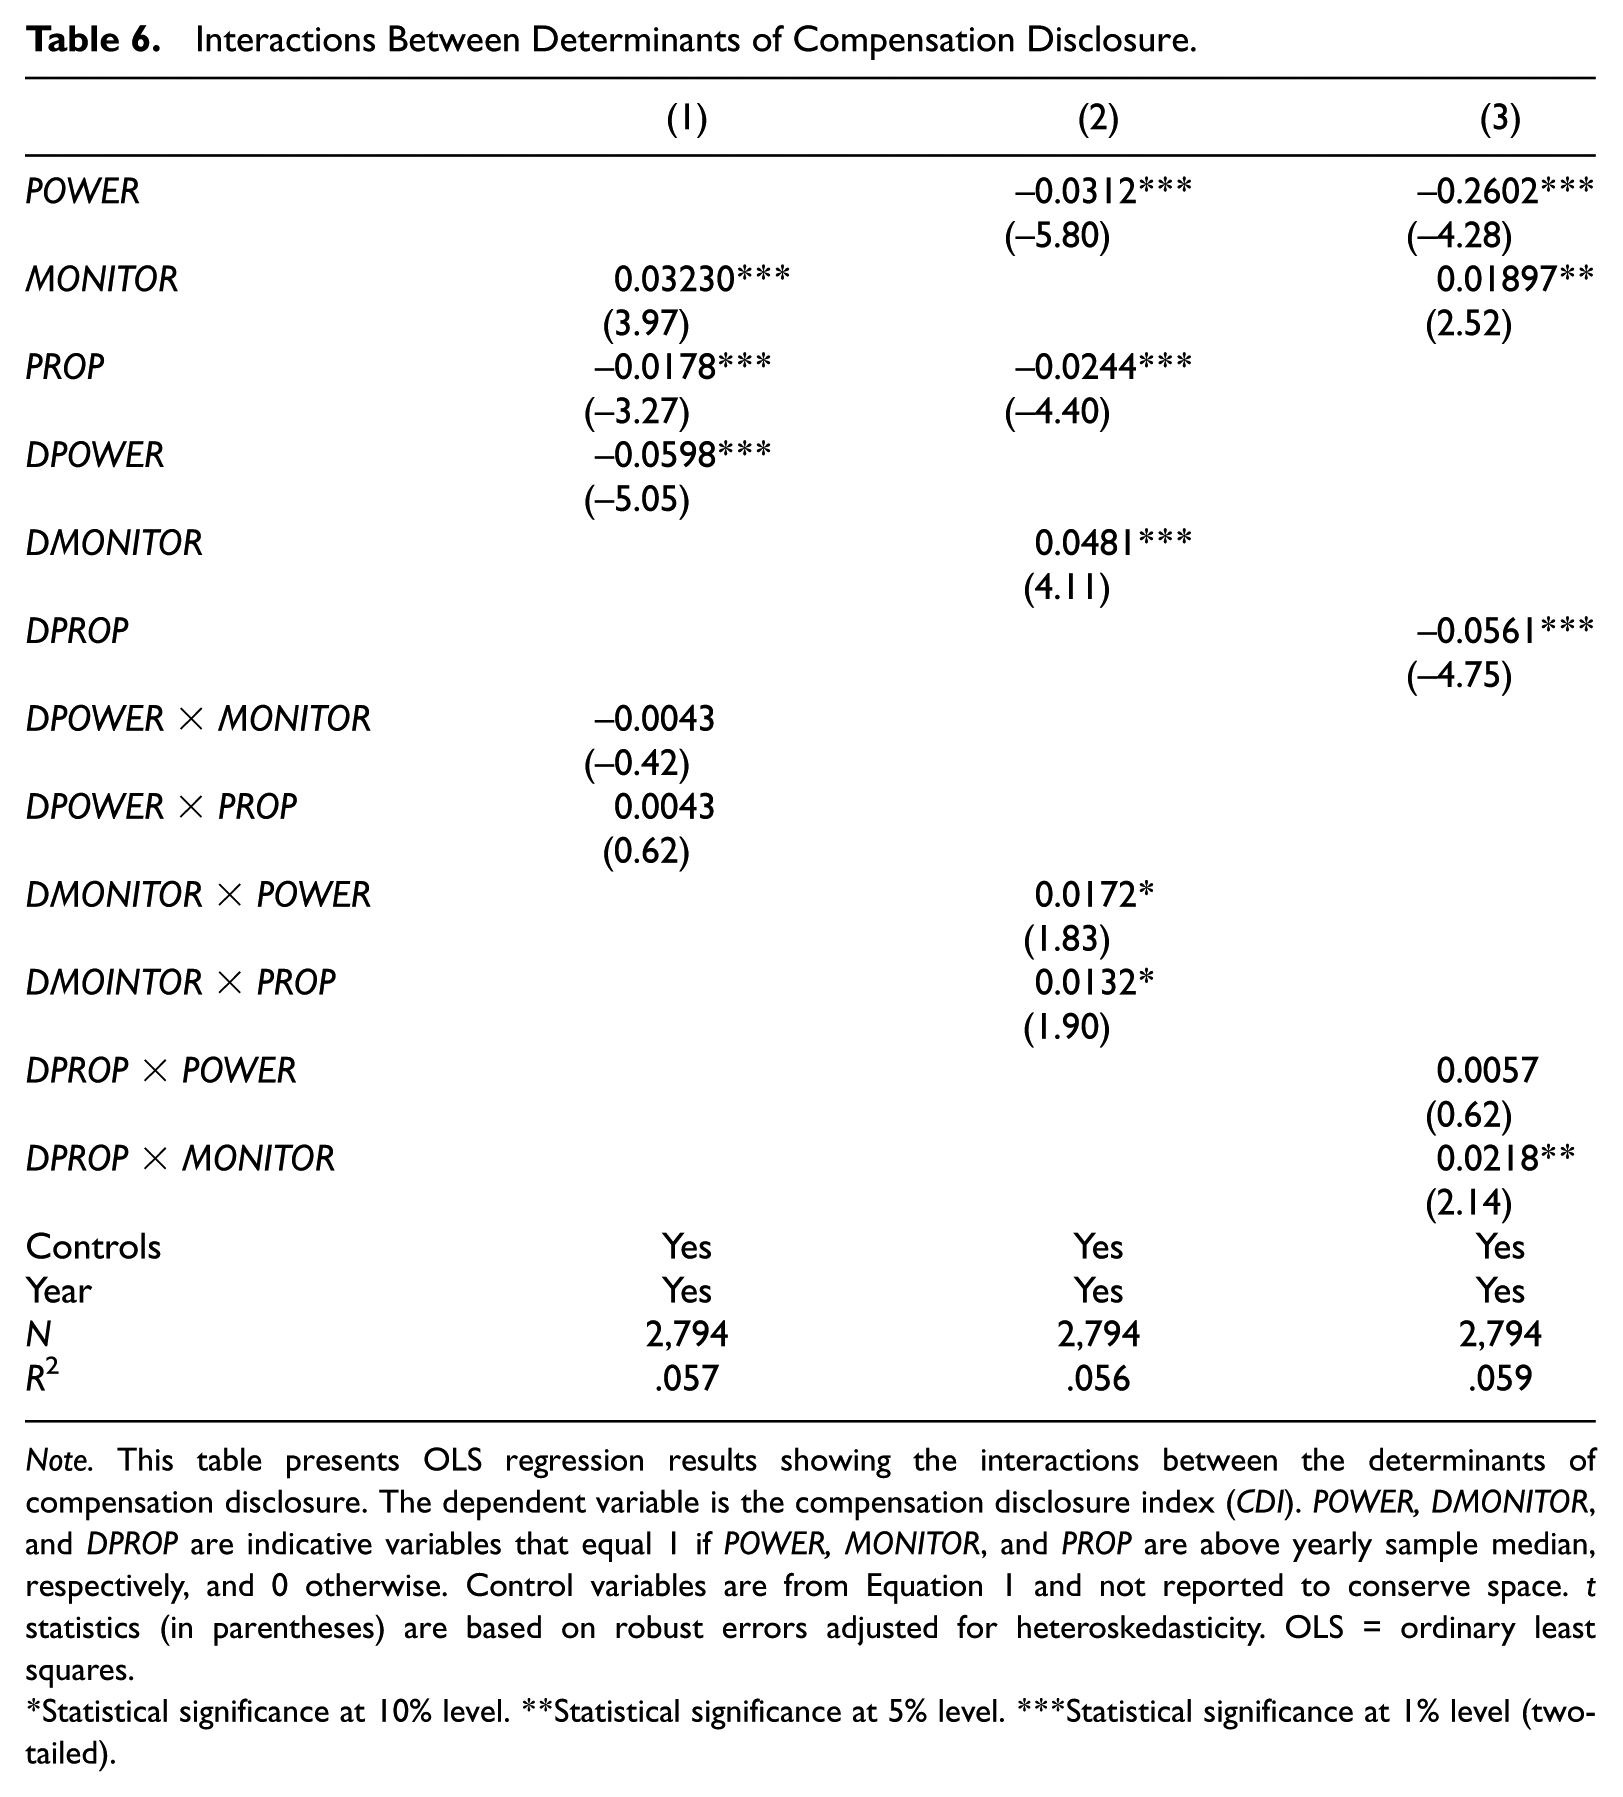
Note. This table presents OLS regression results showing the interactions between the determinants of compensation disclosure. The dependent variable is the compensation disclosure index (CDI). POWER, DMONITOR, and DPROP are indicative variables that equal 1 if POWER, MONITOR, and PROP are above yearly sample median, respectively, and 0 otherwise. Control variables are from Equation 1 and not reported to conserve space. t statistics (in parentheses) are based on robust errors adjusted for heteroskedasticity. OLS = ordinary least squares.
Statistical significance at 10% level. **Statistical significance at 5% level. ***Statistical significance at 1% level (two-tailed).
Excess CEO Compensation
The prior literature suggests that excess CEO compensation also explains compensation disclosure. One line of studies shows that excess pay deters compensation disclosure because overpaid executives tend to obfuscate compensation disclosure to avoid public scrutiny (Laksmana et al., 2012; Lewellen, Park, & Ro, 1996; Robinson et al., 2011). Alternatively, compensation disclosure helps boards justify the compensation policies on excess pay, and there exists a positive relation between compensation disclosure and excess CEO compensation (Laksmana, 2008). Note that these claims are not mutually exclusive because they are concluded from different groups of firms and under different disclosure regimes, for example, before and after 2006 regulation. In this section, I explore the relation between CEO excess compensation and compensation disclosure with a unique cross-regulation panel data, in which the same group of firms experiences both disclosure regimes, in an effort to provide more comprehensive findings.
In doing so, I closely follow Core, Guay, and Larcker (2008) by measuring excess CEO compensation, EXCESS, as the residual compensation that is unexplained by CEO characteristics and firm performance in the following equation:
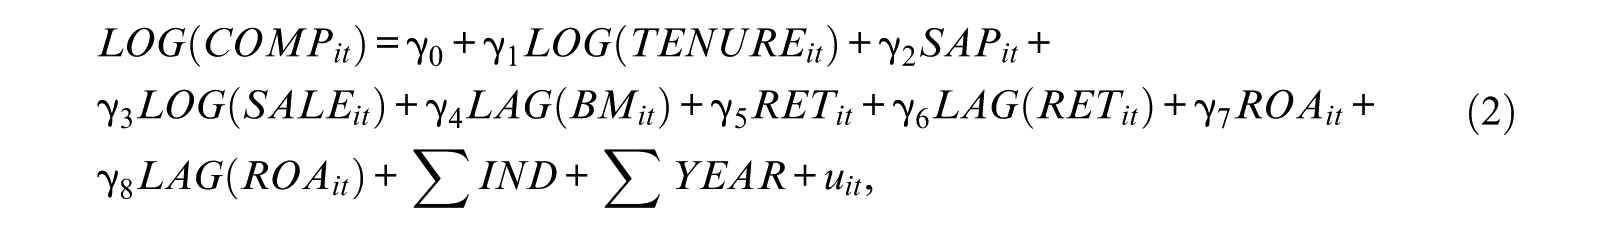
where indices i and t denote firm and year, respectively. LOG(COMP) is the natural logarithm of either the total compensation or the total cash compensation for the CEO. Compensation COMP is estimated in natural logarithms to address the right skew of compensation. The vector of explanatory variables comprises the economic determinants of expected compensation, such as CEO tenure, which is calculated using the natural logarithm of CEO tenure (LOG(TENURE)); an S&P500 firm indicator (SAP); sales, which is calculated using the natural logarithm of sales (LOG(SALE)); beginning book-to-market ratio (LAG(BM)); current and past stock market returns (RET and LAG(RET)); and current and past earnings performances (ROA and LAG(ROA)). Industry and year effects are also included. I calculate the unexplained portion of CEO compensation
Prior literature postulates a linear relation between excess CEO compensation and compensation disclosure. I argue for a nonlinear relation. Specifically, when excess pay rises, firms will first increase disclosure to justify compensation policies on the excess pay (Laksmana, 2008). When excess pay reaches a threshold beyond which the pay-for-performance relation can no longer be justified, firms will obfuscate compensation information to reduce market attention (e.g., Laksmana et al., 2012). Therefore, I argue for an inverted U-shape relation between compensation disclosure and excess CEO compensation. The regression model is as follows:
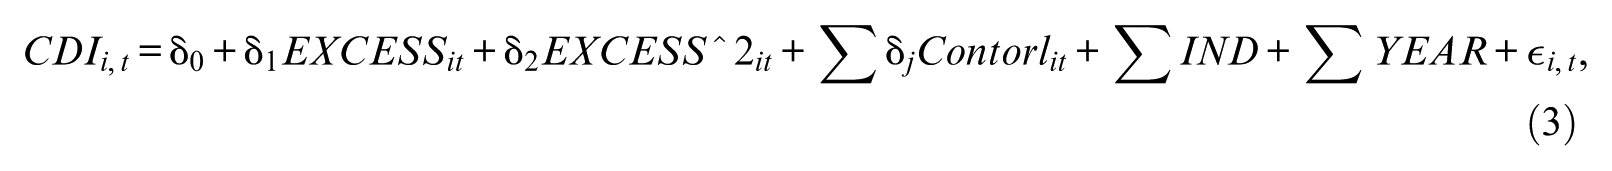
where indices i and t denote firm and year, respectively. The dependent variable is the compensation disclosure index. The independent variable EXCESS is the measure of excess CEO compensation from Equation 2. If the above arguments hold, the coefficient of EXCESS^2, the square of EXCESS, will be negative.
Table 7 reports the regression results when EXCESS is the excess total compensation. Column 1 of Table 7 shows the basic regression of the CDI on the measure of excess CEO compensation only. The coefficient of EXCESS^2 is significantly negative, indicating an inverted U-shape relation. As shown in column 2, this result holds after I control for all the determinants used in explaining CDI in Equation 1. Next, I separate the sample by the amount of excess CEO pay to test the robustness of the finding. As seen in columns 3 and 4, excess CEO compensation is positively associated with compensation disclosure in the low excess pay subsample and negatively associated with compensation disclosure in the high excess pay subsample. These findings further confirm the conjecture that firms enhance compensation disclosure when excess pay rises but turn to obfuscate the disclosure when excess pay grows further. I also separate the sample by regulation regimes to test the robustness of the finding in both the pre- and postregulation periods. In both periods, as seen in columns 5 and 6, the coefficients of EXCESS^2 are significantly negative, suggesting that the nonlinear relation between excess CEO pay and compensation disclosure is unconditioned on the regulatory regimes. When EXCESS proxies for excess cash compensation, results are quantitatively the same and therefore not tabulated.
Excess Compensation and Compensation Disclosure.
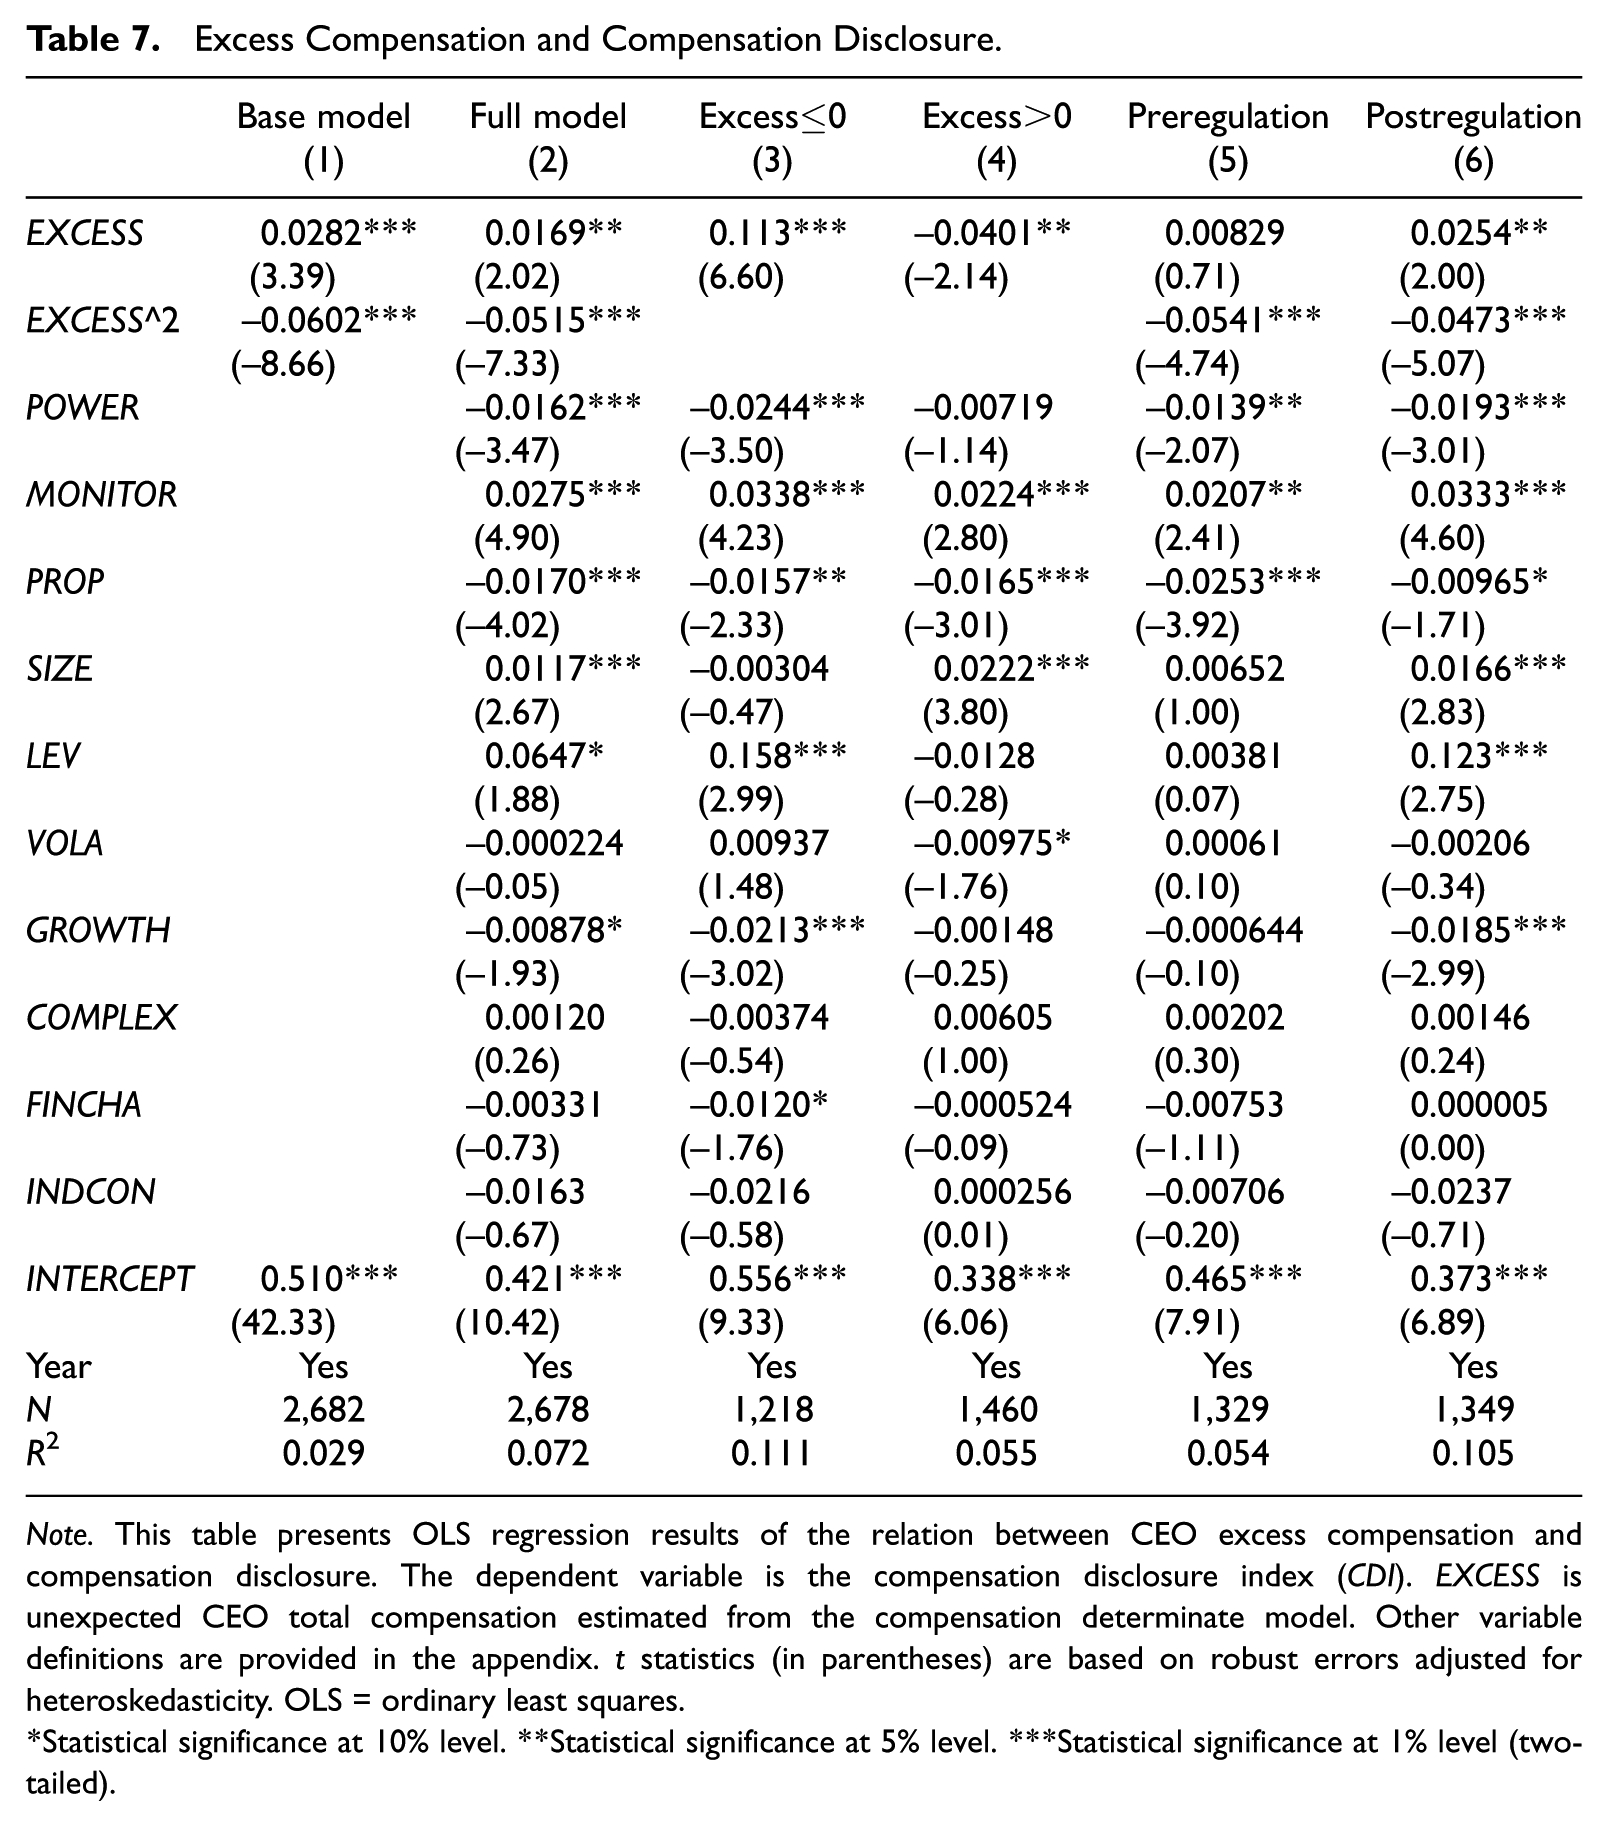
Note. This table presents OLS regression results of the relation between CEO excess compensation and compensation disclosure. The dependent variable is the compensation disclosure index (CDI). EXCESS is unexpected CEO total compensation estimated from the compensation determinate model. Other variable definitions are provided in the appendix. t statistics (in parentheses) are based on robust errors adjusted for heteroskedasticity. OLS = ordinary least squares.
Statistical significance at 10% level. **Statistical significance at 5% level. ***Statistical significance at 1% level (two-tailed).
Conclusion
I study incentive-related compensation disclosure in the context of the SEC compensation disclosure regulation of 2006. Specifically, I study the determinants of compensation disclosure. I argue that the extent to which firms disclose incentive-related compensation information is determined by several firm and management characteristics. I conjecture that powerful CEOs tend to disclosure less compensation information so that they are less likely to be challenged by outsiders to remain entrenched. Proprietary costs are another reason why firms avoid compensation disclosure, as compensation disclosure adversely affects firms’ competitiveness. External monitoring, however, will increase compensation disclosure.
Based on a large panel of U.S. firms for the period from 2004 to 2007 and a self-constructed compensation disclosure index, I report the following findings. First, compensation disclosure is negatively associated with managerial power and proprietary cost but is positively associated with monitoring from external stakeholders. These relations tend to be consistent and robust to the SEC regulation and significant in both the pre- and postregulation periods. I document a weaker role of proprietary cost in determining compensation disclosure transparency in the postregulation years. I also document evidence showing stronger external monitoring tends to reduce the negative relations between compensation disclosure transparency and managerial power and proprietary cost. Finally, I posit and find an inverted U-shape relation between excess CEO pay and compensation disclosure transparency.
This study fits into the genre of the disclosure literature as it investigates a specific type of governance disclosure—compensation disclosure. As the SEC continues to improve the information disclosure environment among U.S. public companies, compensation disclosure becomes a new window through which researchers can peek into firms’ disclosure decisions. This study adds to existing compensation disclosure studies by directly examining the quality of compensation incentive disclosure based on a large and cross-regulation sample. The results complement prior research by providing consistent evidence on all factors hypothesized to affect compensation disclosure.
Supplemental Material
online_appendix_2019 – Supplemental material for Determinants of Compensation Disclosure: Evidence From Reg. S-K 402(b)
Supplemental material, online_appendix_2019 for Determinants of Compensation Disclosure: Evidence From Reg. S-K 402(b) by Ziyun Yang in Journal of Accounting, Auditing & Finance
Footnotes
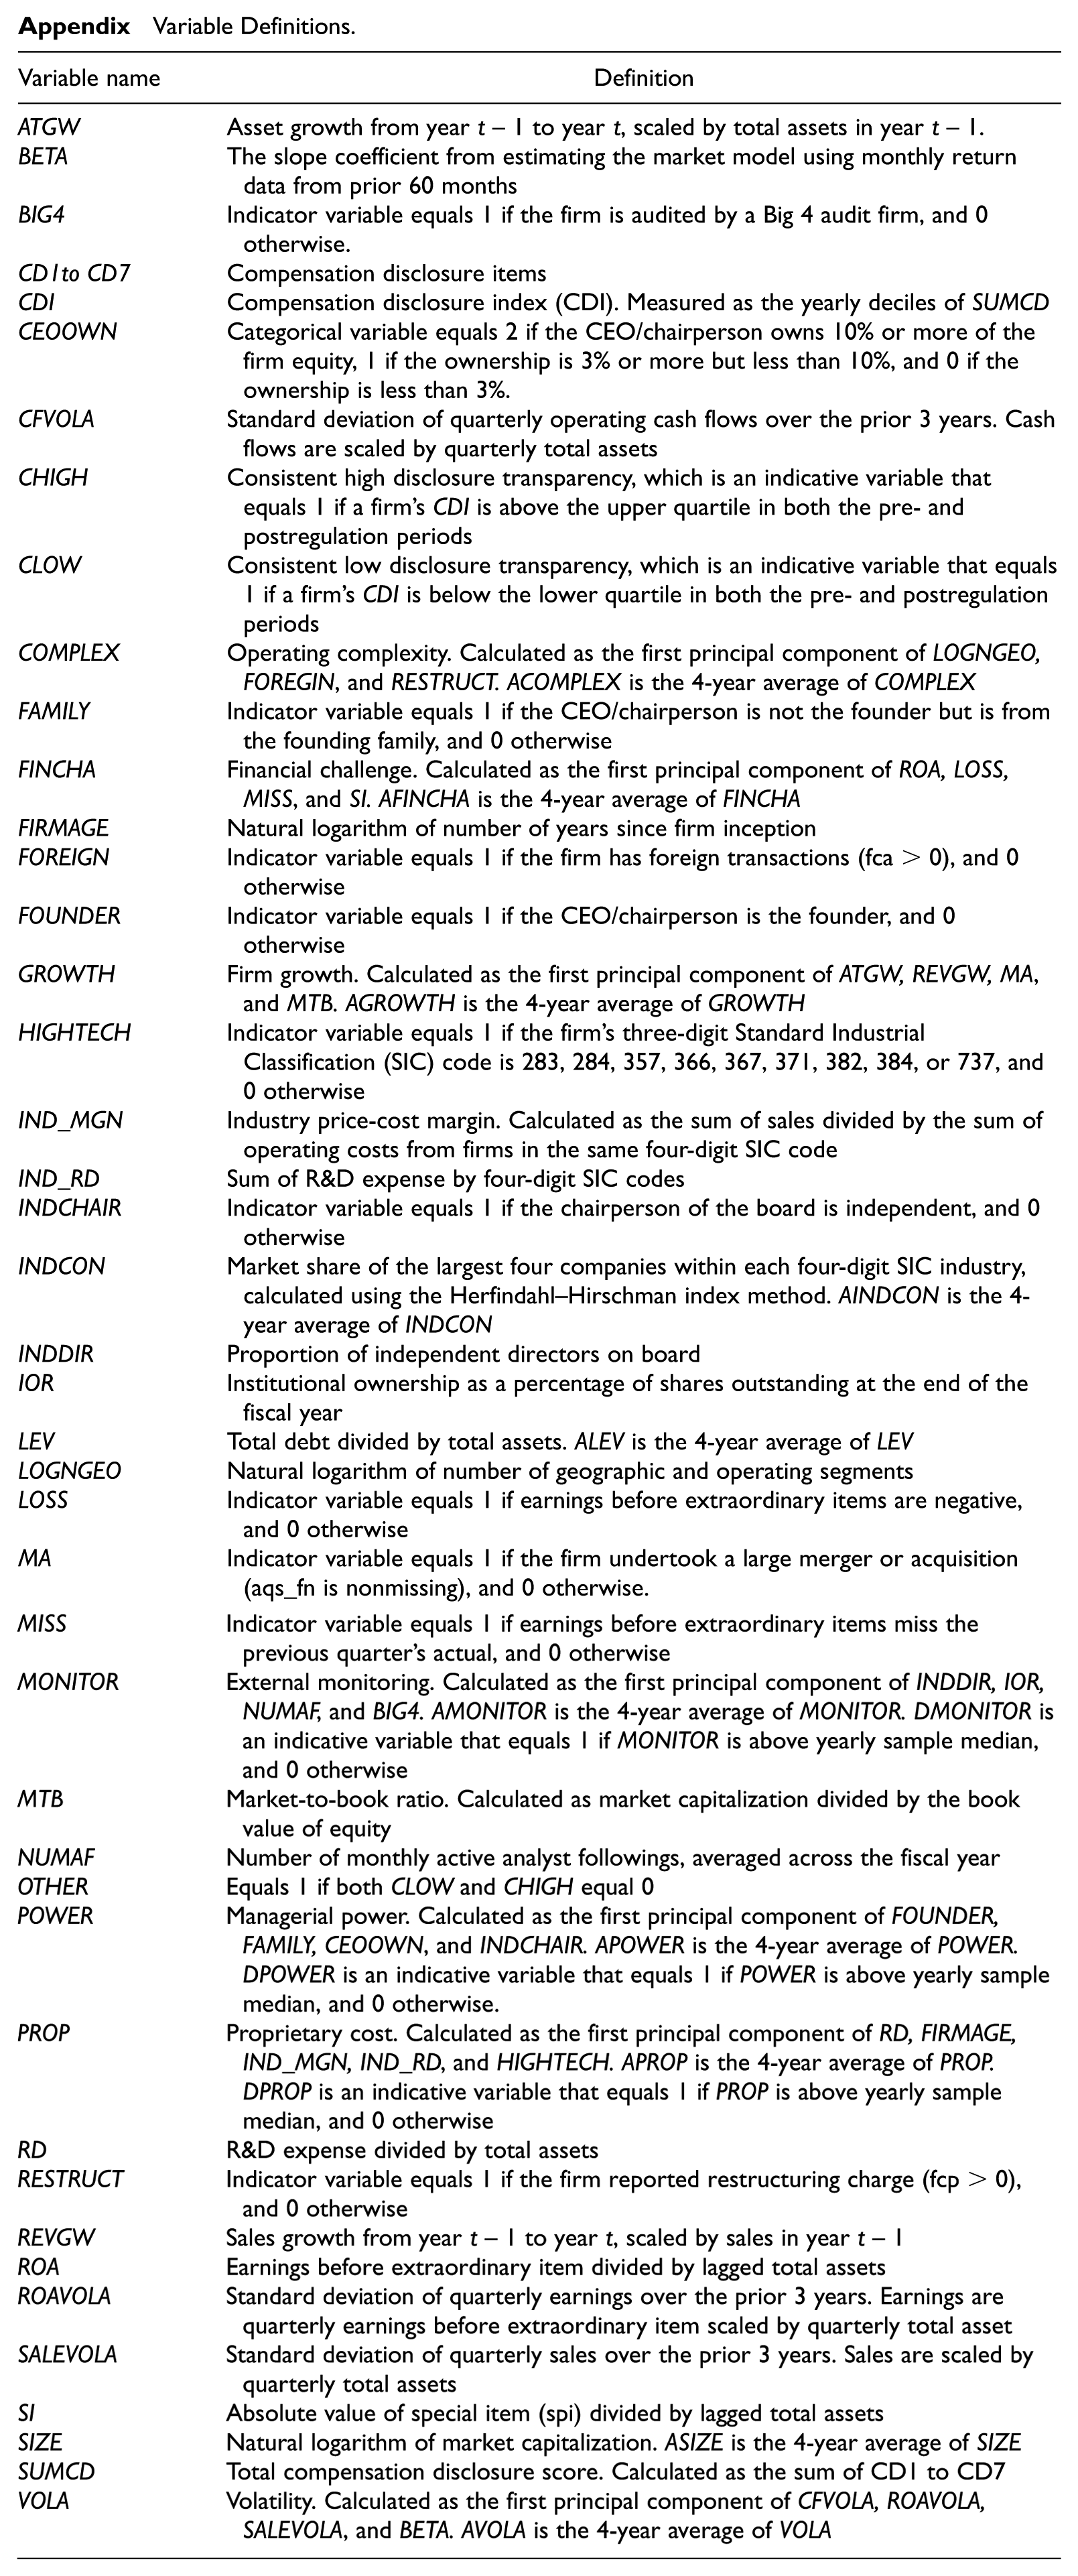
Appendix
Variable Definitions.
| Variable name | Definition |
|---|---|
| ATGW | Asset growth from year t– 1 to year t, scaled by total assets in year t– 1. |
| BETA | The slope coefficient from estimating the market model using monthly return data from prior 60 months |
| BIG4 | Indicator variable equals 1 if the firm is audited by a Big 4 audit firm, and 0 otherwise. |
| CD1to CD7 | Compensation disclosure items |
| CDI | Compensation disclosure index (CDI). Measured as the yearly deciles of SUMCD |
| CEOOWN | Categorical variable equals 2 if the CEO/chairperson owns 10% or more of the firm equity, 1 if the ownership is 3% or more but less than 10%, and 0 if the ownership is less than 3%. |
| CFVOLA | Standard deviation of quarterly operating cash flows over the prior 3 years. Cash flows are scaled by quarterly total assets |
| CHIGH | Consistent high disclosure transparency, which is an indicative variable that equals 1 if a firm’s CDI is above the upper quartile in both the pre- and postregulation periods |
| CLOW | Consistent low disclosure transparency, which is an indicative variable that equals 1 if a firm’s CDI is below the lower quartile in both the pre- and postregulation periods |
| COMPLEX | Operating complexity. Calculated as the first principal component of LOGNGEO, FOREGIN, and RESTRUCT. ACOMPLEX is the 4-year average of COMPLEX |
| FAMILY | Indicator variable equals 1 if the CEO/chairperson is not the founder but is from the founding family, and 0 otherwise |
| FINCHA | Financial challenge. Calculated as the first principal component of ROA, LOSS, MISS, and SI. AFINCHA is the 4-year average of FINCHA |
| FIRMAGE | Natural logarithm of number of years since firm inception |
| FOREIGN | Indicator variable equals 1 if the firm has foreign transactions (fca > 0), and 0 otherwise |
| FOUNDER | Indicator variable equals 1 if the CEO/chairperson is the founder, and 0 otherwise |
| GROWTH | Firm growth. Calculated as the first principal component of ATGW, REVGW, MA, and MTB. AGROWTH is the 4-year average of GROWTH |
| HIGHTECH | Indicator variable equals 1 if the firm’s three-digit Standard Industrial Classification (SIC) code is 283, 284, 357, 366, 367, 371, 382, 384, or 737, and 0 otherwise |
| IND_MGN | Industry price-cost margin. Calculated as the sum of sales divided by the sum of operating costs from firms in the same four-digit SIC code |
| IND_RD | Sum of R&D expense by four-digit SIC codes |
| INDCHAIR | Indicator variable equals 1 if the chairperson of the board is independent, and 0 otherwise |
| INDCON | Market share of the largest four companies within each four-digit SIC industry, calculated using the Herfindahl–Hirschman index method. AINDCON is the 4-year average of INDCON |
| INDDIR | Proportion of independent directors on board |
| IOR | Institutional ownership as a percentage of shares outstanding at the end of the fiscal year |
| LEV | Total debt divided by total assets. ALEV is the 4-year average of LEV |
| LOGNGEO | Natural logarithm of number of geographic and operating segments |
| LOSS | Indicator variable equals 1 if earnings before extraordinary items are negative, and 0 otherwise |
| MA | Indicator variable equals 1 if the firm undertook a large merger or acquisition (aqs_fn is nonmissing), and 0 otherwise. |
| MISS | Indicator variable equals 1 if earnings before extraordinary items miss the previous quarter’s actual, and 0 otherwise |
| MONITOR | External monitoring. Calculated as the first principal component of INDDIR, IOR, NUMAF, and BIG4. AMONITOR is the 4-year average of MONITOR. DMONITOR is an indicative variable that equals 1 if MONITOR is above yearly sample median, and 0 otherwise |
| MTB | Market-to-book ratio. Calculated as market capitalization divided by the book value of equity |
| NUMAF | Number of monthly active analyst followings, averaged across the fiscal year |
| OTHER | Equals 1 if both CLOW and CHIGH equal 0 |
| POWER | Managerial power. Calculated as the first principal component of FOUNDER, FAMILY, CEOOWN, and INDCHAIR. APOWER is the 4-year average of POWER. DPOWER is an indicative variable that equals 1 if POWER is above yearly sample median, and 0 otherwise. |
| PROP | Proprietary cost. Calculated as the first principal component of RD, FIRMAGE, IND_MGN, IND_RD, and HIGHTECH. APROP is the 4-year average of PROP. DPROP is an indicative variable that equals 1 if PROP is above yearly sample median, and 0 otherwise |
| RD | R&D expense divided by total assets |
| RESTRUCT | Indicator variable equals 1 if the firm reported restructuring charge (fcp > 0), and 0 otherwise |
| REVGW | Sales growth from year t– 1 to year t, scaled by sales in year t– 1 |
| ROA | Earnings before extraordinary item divided by lagged total assets |
| ROAVOLA | Standard deviation of quarterly earnings over the prior 3 years. Earnings are quarterly earnings before extraordinary item scaled by quarterly total asset |
| SALEVOLA | Standard deviation of quarterly sales over the prior 3 years. Sales are scaled by quarterly total assets |
| SI | Absolute value of special item (spi) divided by lagged total assets |
| SIZE | Natural logarithm of market capitalization. ASIZE is the 4-year average of SIZE |
| SUMCD | Total compensation disclosure score. Calculated as the sum of CD1 to CD7 |
| VOLA | Volatility. Calculated as the first principal component of CFVOLA, ROAVOLA, SALEVOLA, and BETA. AVOLA is the 4-year average of VOLA |
Acknowledgements
This study is based on my dissertation at University of Houston. I thank my dissertation committee members, Christo Karuna, Gerald Lobo (Chair), Latha Ramchand, and Shiva Sivaramakrishnan (co-chair) for their guidance and support.
Declaration of Conflicting Interests
The author(s) declared no potential conflicts of interest with respect to the research, authorship, and/or publication of this article.
Funding
The author(s) received no financial support for the research, authorship, and/or publication of this article.
Supplemental Material
Supplemental material for this article is available online.
Notes
References
Supplementary Material
Please find the following supplemental material available below.
For Open Access articles published under a Creative Commons License, all supplemental material carries the same license as the article it is associated with.
For non-Open Access articles published, all supplemental material carries a non-exclusive license, and permission requests for re-use of supplemental material or any part of supplemental material shall be sent directly to the copyright owner as specified in the copyright notice associated with the article.