



Abstract
A long line of literature documents that managers are more likely to issue guidance when the analysts’ consensus forecast is optimistic. I extend this literature by providing evidence that there exists a hierarchical order by which managers respond to individual analyst forecasts. First, I find that optimism in both the majority of individual forecasts and the influential analyst’s forecast are important determinants of management guidance in addition to optimism in the consensus forecasts. Second, I find that managers are more likely to issue guidance when the influential analyst forecast is optimistic, even when the consensus forecast is pessimistic. Third, when the influential analyst disagrees with the majority, managers are more willing to respond to the influential analyst. Taken collectively, this study provides new evidence on how individual analysts influence managers’ voluntary disclosure and suggests a hierarchy, whereby the influential analyst’s opinion is the most important factor in determining management guidance, followed by the majority or consensus.
Introduction
Prior literature documents that managers and analysts engage in an “earnings-guidance” game where analysts first issue optimistic earnings forecasts and then “walk down” their estimates to a level that firms can ultimately meet or beat (Cotter, Tuna, & Wysocki, 2006; Kross, Ro, & Suk, 2011). Most of these prior studies have conducted analyses at the consensus level, that is, by considering the expectations of analysts as a group and documenting the average effect of managers “walking down” analysts. 1 However, surprisingly little is known about the differential effect of individual analysts’ forecasts on managerial incentives to manage expectation. Prior studies show that investors may use individual analyst forecasts as additional benchmarks in evaluating reported earnings (Kirk, Reppenhagen, & Tucker, 2014). This finding raises the following question: Whether and how do managers respond to optimism in individual analyst forecasts? This study attempts to shed light on this unexplored issue.
Ex ante, whether the optimism in individual analyst forecasts affects the incidence of management guidance is unclear. On one hand, prior research finds that market reactions to earnings announcements are more positive if the firm beats a higher proportion of analyst forecasts as well as if they beat an influential analyst’s forecast (Kirk et al., 2014). If so, then managers have a strong incentive to manage the proportion of optimistic analysts and the optimism of influential analysts. On the other hand, prior literature documents that managers consider many other factors when making guidance decisions (Kross, Lewellen, & Ro, 1994; among others). Moreover, even if managers intend to manage market expectations, it is not ex ante obvious that managers are aware of how the market utilizes information contained in individual analyst forecasts.
To provide evidence on how these potentially conflicting incentives influence the management guidance decision, I use a probit model to estimate the effect of optimism in individual analyst forecasts on the incidence of management guidance. Following the prior literature, I employ two proxies to capture optimism in individual analyst forecasts—the proportion of optimistic analysts and the optimism of influential analysts. The proportion of optimistic analysts is defined as the percentage of individual analyst forecasts that are optimistic. Economic theory suggests that the guidance decision is a function of its benefits and costs. Consistent with theory, I predict that managers are more likely to provide guidance when the reward is higher and obtained with less effort. The higher the percentage of optimistic forecasts, the higher is the reward relative to the cost of providing guidance because managers can manage the expectations of more analysts through a single public announcement. Based on this discussion, I hypothesize that the higher the percentage of individual analyst forecasts that are optimistic, the more likely managers are to issue guidance (“moving the crowd” hypothesis).
Extant studies demonstrate that some analysts are more influential to investors than others (e.g., Jacob, Lys, & Neale, 1999). Moreover, these analysts’ forecasts are more likely to contain valuable private information, which cannot be captured using the consensus estimate (e.g., Altschuler, Chen, & Zhou, 2015). Accordingly, I hypothesize that managers are more likely to respond to optimistic forecasts issued by influential analysts (“moving the influential” hypothesis).
My results, using a sample of individual analyst forecasts from 2003 to 2013Q1 for firm-quarters with at least three analysts comprising the consensus, reveal the following. First, I find that the percentage of individual forecasts that are optimistic is significantly associated with the managerial propensity to guide. Moreover, both the magnitude and significance of the coefficient on the optimism in the consensus forecast drop significantly when I include the percentage measure in the model. These findings are consistent with the “moving the crowd” hypothesis that managers are more likely to issue guidance when the majority of analyst forecasts exhibit optimism.
Second, I find that optimism in the influential analyst forecast plays an important role in the guidance decision. Similar to Kirk et al. (2014), I use a regression-weighted composite-score approach to identify the influential analyst forecast. I find that managers are more likely to guide when an influential analyst issues an optimistic forecast, even after controlling for both the optimism in the consensus forecast and the percentage of optimistic forecasts. This is consistent with the “moving the influential” hypothesis that managers are more willing to play the earnings-guidance game with analysts who can exert a significant influence on investors’ expectations.
Given the above findings, one natural question that arises is how managers make their guidance decisions when the influential analyst disagrees with the majority—a question that has not been explored in the prior literature. I conduct more analyses and document two interesting findings. First, I focus on a subsample where the consensus forecast is pessimistic. I find that optimism in the influential analyst’s forecast continues to be a factor in the guidance decision even when the consensus is pessimistic. Second, I compare a scenario where the majority of analysts are pessimistic but the influential analyst forecast is optimistic with a scenario where the majority of analysts are optimistic but noninfluential. I find that the incidence of management guidance is significantly higher when the influential analyst forecast is optimistic even though the majority of analysts are pessimistic. These results suggest that managers view the influential analyst’s opinion as the most important factor in determining management guidance, followed by the majority or consensus.
Shifting attention to the effectiveness of managers’ guidance efforts, I examine how individual analysts revise their forecasts in response to the guidance decision. Cross-sectional analyses suggest that the percentage of postguidance forecasts that are optimistic is lower when there is guidance than when there is no guidance. In addition, I find that influential analysts are more likely to issue meetable or beatable forecasts in response to management guidance than other analysts. These findings are consistent with, but extend, prior literature by suggesting that management guidance is effective in walking down individual analysts.
I execute a number of additional robustness tests that continue to lend support to my hypotheses and all of my findings hold: (a) when I partition the sample conditional on a firm’s past guidance frequency, (b) when I use the mean analyst forecast as the consensus forecast, (c) when I examine unbundled forecasts and bundled forecasts separately, and (d) when I employ an ex ante measure of analyst optimism. Thus, my tests provide robust evidence of an important interplay between managers and individual analysts.
Understanding whether and how managers respond to individual analysts is important for at least two reasons. First, it furthers our understanding of the earnings-guidance game played between managers and analysts. A survey paper by Beyer, Cohen, Lys, and Walther (2010) calls for researchers to consider the interdependence between various decisions that shape the corporate information environment. Specifically, Beyer et al. (2010, p. 335) note that “research on the interplay between the information provided by sell-side security analysts, other information intermediaries, and firm’s mandatory and voluntary disclosures is warranted.” My study takes an initial step in understanding how individual analysts may influence firms’ voluntary disclosure decisions. Second, I document a hierarchical order of benchmarks, including but not limited to the consensus forecast that is used by managers for making disclosure decisions. Analyst and management forecasts are among the most important sources of information used by investors to develop firm-level earnings expectations. Hence, my study provides further empirical support for the role of information intermediaries in shaping firms’ disclosure policies.
The remainder of this article proceeds as follows. In the following section, I review related literature and develop hypotheses. Then, I discuss my data and provide descriptive statistics. Next, I present empirical analysis concerning the determinants of guidance using individual analyst forecasts, followed by an analysis of the consequences of guidance. I also conduct additional analyses and robustness tests. I conclude this article in the final section.
Prior Literature and Hypotheses Development
Expectation Management
There is growing evidence that firms engage in expectations management to meet or beat analysts’ most recently issued earnings forecasts (MBE, hereinafter). Ajinkya and Gift (1984) provide the first evidence that managers may voluntarily disclose bad news when prior analyst forecasts are optimistic. The rationale is that managers have reputational incentives to preempt negative earnings news (Skinner, 1994; Tucker, 2010). Collectively, these studies suggest that management may issue downward guidance to align market expectations.
However, market expectations are unobservable. Prior research uses the consensus forecast as an empirical proxy for expectation, which is the mean or median estimate of each analyst’s most recent forecast prior to the management guidance. Cotter et al. (2006), among others, find that when analysts’ prior consensus earnings forecasts are optimistic, managers are more likely to provide guidance. These studies, however, do not investigate the differential effect of individual analysts’ forecasts (or analyst heterogeneity) on management’s guidance decision—a literature I summarize next.
Analyst Heterogeneity
Prior studies examining analyst heterogeneity generally focus on two settings. In the first setting, researchers investigate the stock market reaction around forecast issuance or revision. The conclusion is that investors use sell-side analyst forecasts when forming expectations about a firm’s earnings (Hodge, 2003). Prior work also has examined the cross-sectional variation in how the market reacts to forecast revisions. For example, investors respond more strongly to forecasts issued by celebrity analysts (Bonner, Hugon, & Walther, 2007).
Researchers also examine analyst heterogeneity in the earnings announcement setting. Kirk et al. (2014) argue that investors may use individual analyst forecasts as additional benchmarks in evaluating reported earnings. They show that measures reflecting private information have incremental explanatory power over the consensus forecast for the market’s reaction to earnings news. Specifically, they document that the percentage of individual forecasts met and meeting the key analyst forecast are significantly associated with returns around earnings announcements.
In contrast to this prior work, I examine analyst heterogeneity in the management guidance setting. The management guidance setting is interesting and unique for the following reasons. First, though prior studies recognize analyst heterogeneity from the investors’ perspective, I investigate this issue from the managers’ perspective. This extension is not obvious because managers are considered to be insiders of the firms they operate. While investors are more interested in evaluating performance, managers are typically more focused on influencing market expectations to achieve their reporting objectives. Second, the management guidance setting allows me to examine how managers respond to individual analysts when there is disagreement among analysts. Therefore, this exercise provides a further understanding of the earnings-guidance game played between analysts and managers.
Hypotheses Development
Kirk et al. (2014) find that the market reacts more positively to earnings announcements if the firm beats a higher proportion of analyst forecasts and if the firm beats an influential analyst’s forecast. Accordingly, managers have stronger incentives to manage expectations when the majority of analyst forecasts are optimistic and when the influential analyst forecast is optimistic.
However, it is not clear whether managers always want to manage expectations. Prior literature documents that many other factors drive the guidance decision. For example, Kross et al. (1994) find that managers are more likely to issue guidance when earnings are less volatile. Moreover, managers may not have the knowledge of how the market utilizes information contained in individual analyst forecasts.
Given the arguments above, whether and how managers respond to optimism in individual analyst forecasts is an empirical question. Following Kirk et al. (2014), I use the proportion of optimistic analysts (“moving the crowd” hypothesis) and the optimism of influential analysts (“moving the influential” hypothesis) as proxies for individual analyst forecasts.
“Moving the crowd” hypothesis
Economic theory suggests that the guidance decision is a function of the benefits and costs of providing guidance. Consistent with this theory, I argue that managers may issue guidance when the effort to achieve the same reward is lower. The higher the percentage of optimistic forecasts, the lower the reward relative to the cost of providing guidance because managers can communicate the same information to more analysts through a single public announcement. Based on the discussion above, I state my first hypothesis in the alternative form:
“Moving the influential” hypothesis
The expectations management literature has documented that managers are more likely to issue guidance when existing forecasts are optimistic. The implicit assumption is that each individual analyst forecast plays an equal role in the managerial decision to provide guidance. However, both academic and anecdotal evidence suggest that this assumption may not be an accurate description of reality. There is a long line of literature suggesting that managers do not view all analysts equally. The literature has documented that managers selectively communicate with analysts in the pre-Reg FD period. Reg FD, passed in 2000, was meant to curb the differential treatment of analysts by preventing managers from privately disclosing material information to certain analysts and not others. Although selective disclosure is no longer allowed after Reg FD, empirical evidence suggests that such discrimination still exists. Mayew (2008) provides evidence that managers may discriminate across analysts during the earnings call. Anecdotal evidence outlines how managers might discriminate, including not returning their phone calls (Angwin & Peers, 2001) and not allowing them to ask questions during conference calls (Kelly, 2003). Furthermore, constituents assert that the problem is not that material information is being privately disclosed but that the public disclosure of such information suits only specific analysts.
The discussion above suggests that analysts’ forecasts are not created equally; the benefit (cost) of guiding analysts’ forecasts may vary cross-sectionally with analyst heterogeneity. Prior research indicates that some analysts are more influential than others among investors (Jacob et al., 1999; Mikhail, Walther, & Willis, 1997). This conclusion is supported by a stronger stock market reaction to the release of forecast revisions issued by these analysts. Given that these analysts exert a significant influence on investors’ expectations, it is reasonable to believe that managers will be more likely to respond to forecasts issued by these analysts. Accordingly, I state my next hypothesis in the alternative form:
Sample Selection and Descriptive Statistics
Sample Selection
From the I/B/E/S Guidance database, I obtain all management forecasts of quarterly earnings per common share (EPS) from October 23, 2000 to March 31, 2013. I limit my analysis to the post-Reg FD period after October 23, 2001 to minimize the effect of private communication between analysts and managers. 2 I then drop forecasts that might have erroneous forecast dates, such as forecast dates recorded as being after the date of data entry and forecasts with missing CUSIPs. I consider management guidance for quarter t issued between 2 days before the earnings announcement for quarter t− 1 and before the earnings announcement for quarter t. 3 If a firm provides management guidance more than once in a given quarter, I keep the first one.
I merge these data with the Zacks Investment Research Database (Zacks) from June 30, 2001 to March 31, 2013. I require that for each firm-quarter included in the sample, at least one analyst forecast and actual earnings are available in Zacks. 4 Because analysts issue multiple forecasts, it is necessary to choose a point in time to measure forecast optimism (measurement date). For firm-quarters in which a management forecast is issued, I set the measurement date as the issuance of the first management forecast for the quarter. For firm-quarters in which a management forecast is not issued, the measurement date is randomly assigned based on the distribution of the measurement dates used for the firm-quarters with management forecasts. I include analyst forecasts that are made 45 days prior to the measurement date. When an analyst issues more than one forecast for the same firm-quarter during this period, I use the most recent forecast issued. Furthermore, I require a firm-quarter to have at least three analysts to ensure that my examination of consensus versus individual forecasts is meaningful. As I require a rolling window of eight previous quarters to estimate the analyst characteristics weights for calculating the composite score for each forecast in the current quarter, I lose the years 2001 and 2002. Finally, data are also restricted by the availability of Compustat and Center for Research in Security Prices (CRSP) data needed for the variables used in the analysis. The final sample includes 59,704 firm-quarter observations from 2003 to 2013Q1 that have necessary data for the control variables.
Descriptive Statistics
All variables used in the analysis are defined in Appendix A. Table 1 provides descriptive evidence for the sample of 59,704 firm-quarter observations partitioned according to whether there is management guidance. A comparison of the same variables in the two subsamples shows that guidance quarters have a much higher percentage of forecast optimism. Specifically, 53.9% of analyst forecasts exhibit optimism in the guidance quarter, whereas only 50.3% of analyst forecasts are optimistic in the nonguidance quarter. Consistent with the notion that the guidance decision is sticky, 82% of firms who guide in the current quarter also guide in the previous quarter and 78% of such firms guide in the same quarter of the previous year. In contrast, only 6% of firms who do not provide guidance in the current quarter guide in the previous quarter and 8% of these firms guide in the same quarter of the previous year.
Descriptive Statistics.

Instances where the subsamples differ significantly at the level for two-tailed tests (1%).
Determinants of Guidance Using Individual Measure
The Percentage of Optimistic Forecasts
To test the first hypothesis (H1), I examine management guidance issued for each firm-quarter from 2003 to 2013Q1:

Equation 1 explains the propensity of management to provide guidance for firm i in quarter t. I define an indicator variable that equals 1 if the manager provides guidance during the quarter and 0 otherwise. For each firm-quarter, I define PCT_OPTIMISM as the percentage of individual analyst forecasts that are greater than the reported earnings. To ensure that forecasted and reported earnings are based on the same earnings construct, I use the actual earnings number recorded in Zacks as reported earnings.
I control for the magnitude of analysts’ forecast optimism
Economic theory also suggests that precommitment to disclosure reduces the information asymmetry portion of the cost of capital (Leuz & Verrecchia, 2000). Anilowski, Feng, and Skinner (2007) document that firms that guide in the previous quarter tend to guide in the current quarter and that the guiding practice is “sticky.” I code two indicator variables that reflect the firm’s guidance history. LMF indicates whether the firm provides guidance in the previous quarter. LMFSQ equals 1 for firm-quarters in which the firm provides guidance for the same fiscal quarter of the previous year. For obvious reasons, the coefficients on LMF and LMFSQ are expected to be positive.
Lang and Lundholm (1993) find a strong positive association between disclosure ratings and the level and variability of firm performance. Chen, Matsumoto, and Rajgopal (2011) also argue for a positive association between disclosure and financial performance. To control for performance, I include three variables, CHEPS, LOSS, and RET. CHEPS is defined as the change in Zacks actual earnings of the previous quarter deflated by the stock price at the beginning of the quarter. RET is calculated as the firm’s size-adjusted abnormal returns over the previous quarter. I expect the coefficients on both CHEPS and RET to be positive. LOSS is an indicator variable which equals 1 if the firm experiences a loss in quarter t − 1 and 0 otherwise. The coefficient of LOSS is expected to be negative. I also include EVOL, measured as the standard deviation divided by the absolute value of the mean earnings over the previous six quarters, to control for the variability of firm performance. Both Waymire (1985) and Kross et al. (1994) find that a firm’s earnings volatility is negatively related to guidance issuance. I expect the coefficient on EVOL to be negative.
Skinner (1994) provides evidence that firm-specific litigation risk is one important determinant of whether managers provide guidance. I estimate ex ante litigation risk (LIT) based on the Rogers and Stocken (2005) litigation probability model. 6 I expect the coefficient on LIT to be positive. In addition, managers of high-growth firms may have increased incentives to provide earnings forecasts to avoid a disproportional stock price response to negative earnings surprises (Skinner & Sloan, 2002). However, high growth may also indicate high proprietary costs of disclosure (Verrecchia, 1983), in which case growth would be expected to be negatively associated with the likelihood of management guidance. Following Ajinkya, Bhojraj, and Sengupta (2005), I use the market-to-book ratio, BTM, to proxy for growth. I do not have an expectation on the sign of BTM.
I control for firm size (SIZE), analyst following (ANALYST), and institutional ownership (INST) because changes in these variables over time could affect guidance decisions. Firm size is positively related to a firm’s forecast disclosure. Lang and Lundholm (1993) show that analyst following is positively related to the quality of a firm’s information disclosures. Ajinkya et al. (2005) find that institutional ownership is positively related to guidance issuance. To address potential cross-sectional and serial dependence in the data, I report z/t statistics (two-tailed) that are based on robust standard errors corrected for two-way (firm and year) clustering (Gow, Ormazabal, & Taylor, 2010; Petersen, 2009). Throughout this article, all regressions include industry and quarter indicators to control for industry and time fixed effects, respectively.
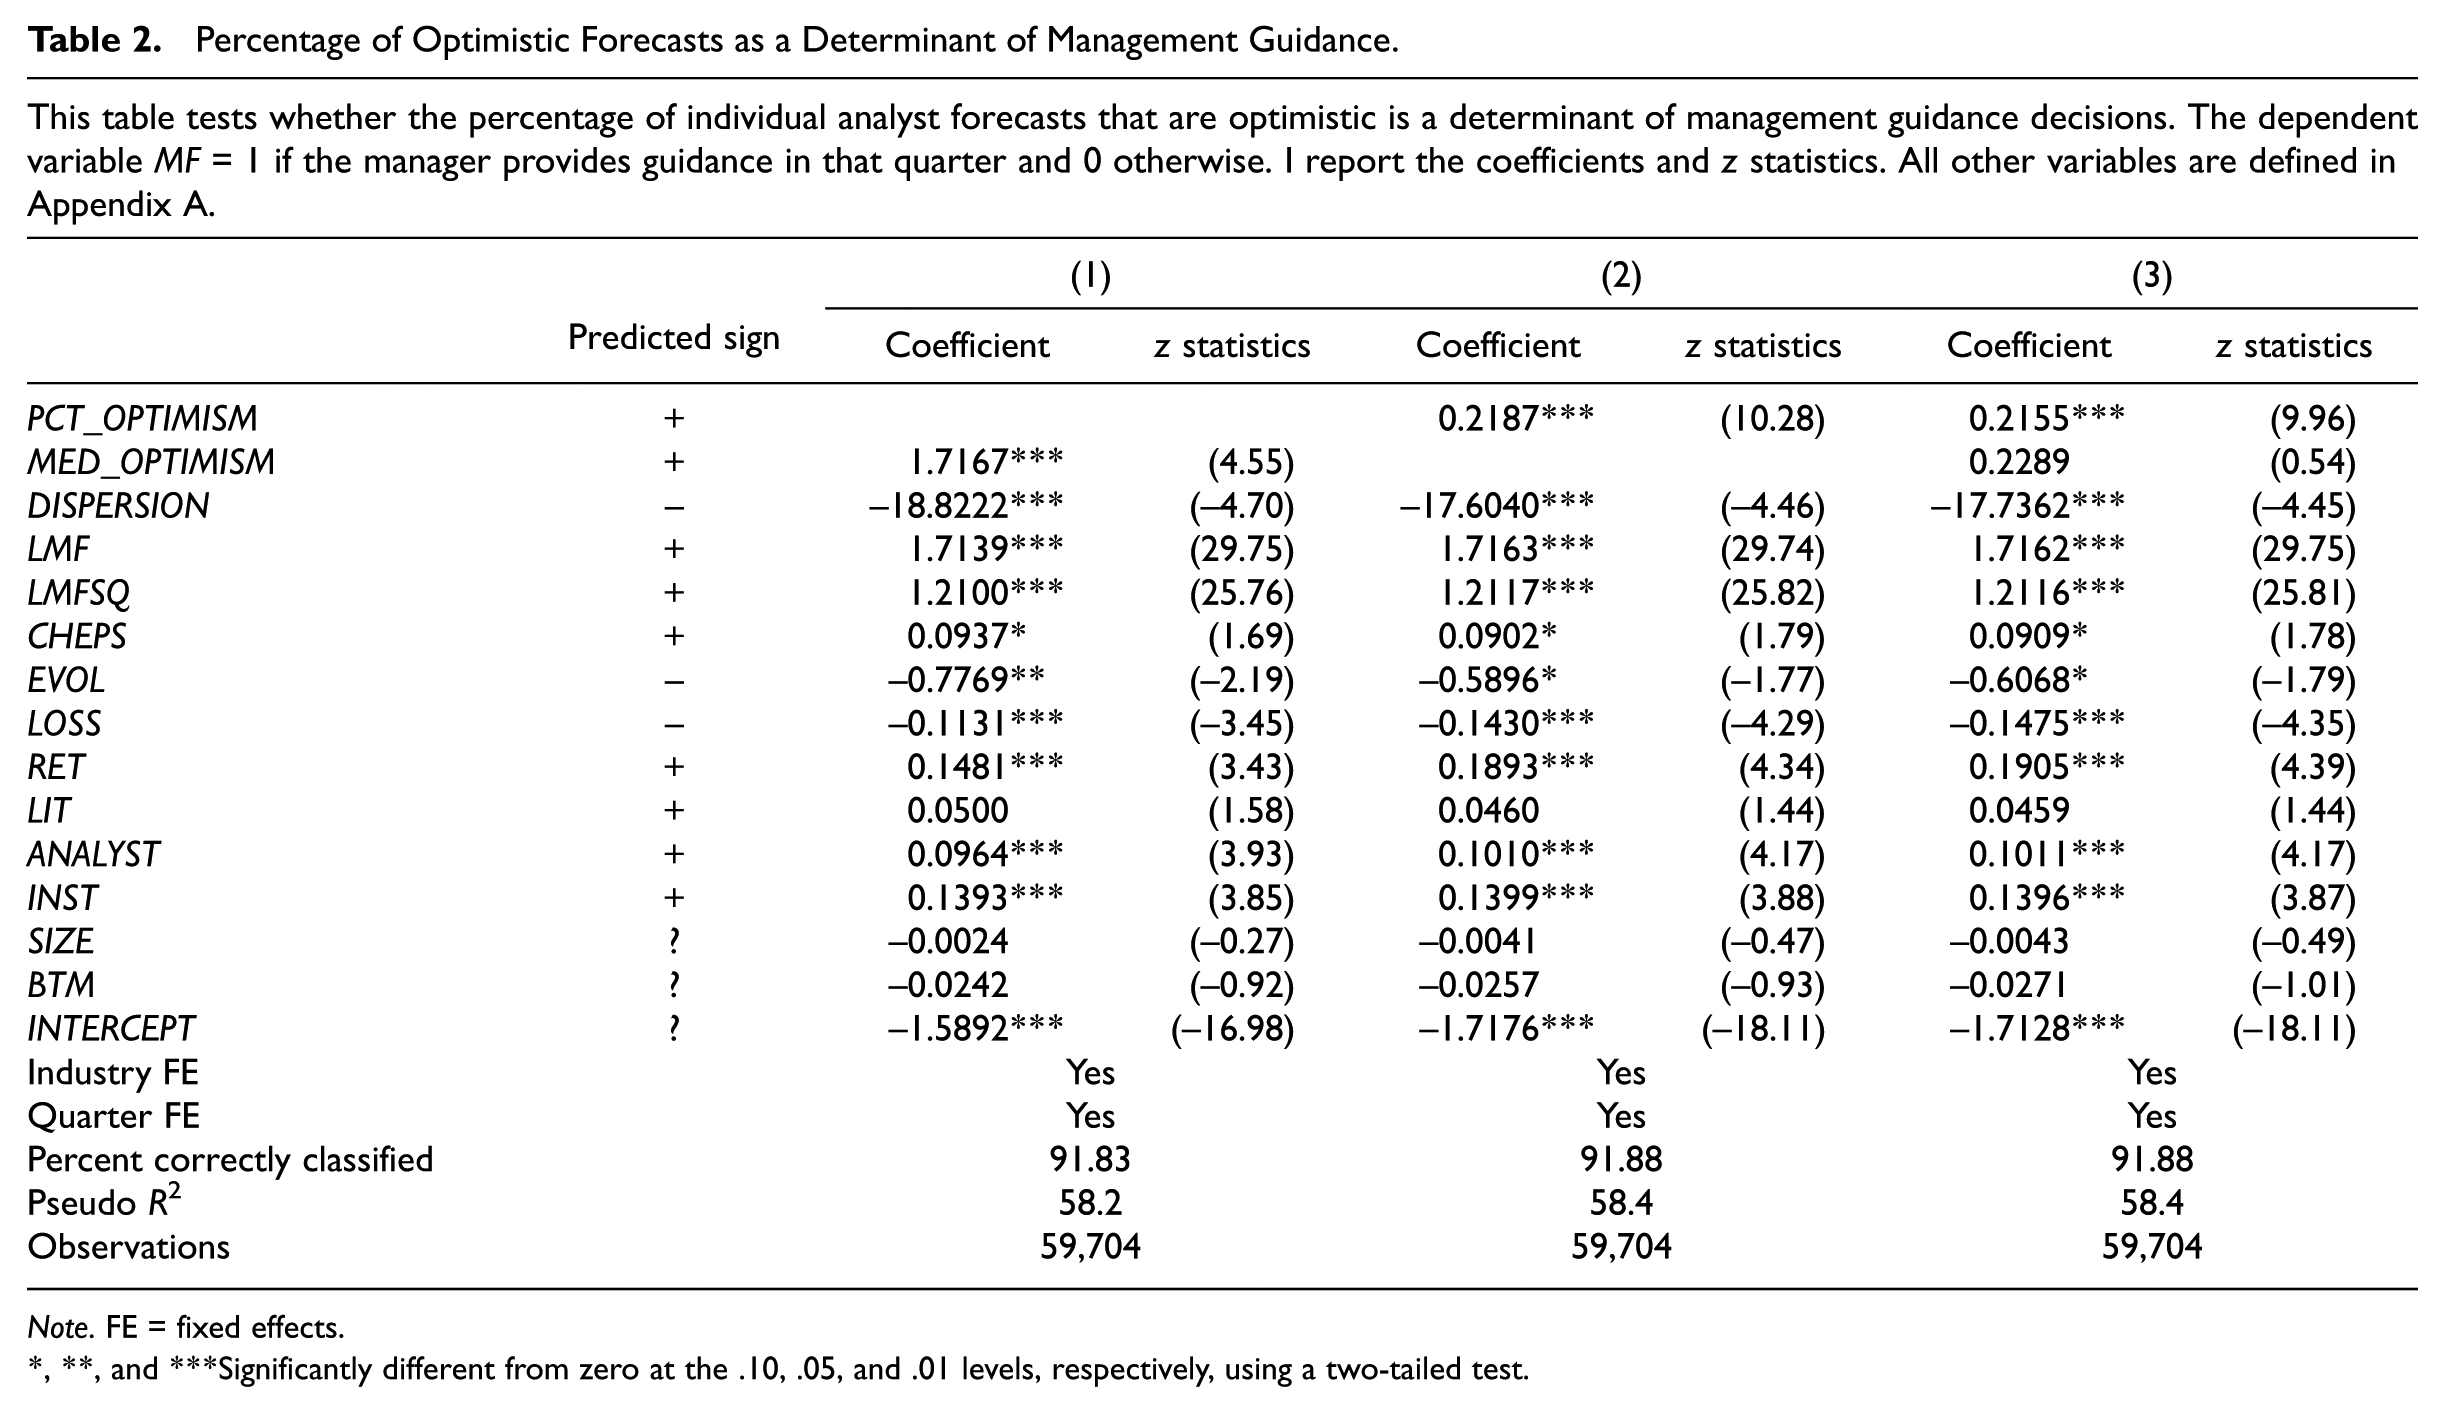
Table 2 reports the maximum likelihood probit estimates of management guidance equations. Coefficients and z statistics are reported. I first present the partial model without PCT_OPTIMISM in column (1) and the partial model without MED_OPTIMISM in column (2). In column (1), the coefficient on MED_OPTIMISM is 1.7167 and significantly positive at the 1% level. This is consistent with prior literature that management guidance is more likely when analysts’ prior forecasts are more optimistic. Turning to column (2), the coefficient on PCT_OPTIMISM is 0.2187, also significantly positive at the 1% level. 7 The full model in the last column includes both MED_OPTIMISM and PCT_OPTIMISM. I find that the coefficient on PCT_OPTIMISM remains significantly positive. However, the coefficient on MED_OPTIMISM is positive but insignificant after I include the percentage measure of optimism. Moreover, the magnitude of the coefficient on MED_OPTIMISM drops significantly from 1.7167 in column (1) to 0.2289 in column (3). In contrast, the coefficient of PCT_OPTIMISM decreases modestly from 0.2187 in column (2) to 0.2155 in column (3). These observations suggest that a portion of the economic significance previously attributed to MED_OPTIMISM in the expectation management literature draws from its correlation with PCT_OPTIMISM. Furthermore, the significantly positive coefficient on PCT_OPTIMISM suggests that the percentage of optimistic analyst forecasts may be a more important determinant of management guidance than the median level of forecast optimism, supporting H1.
Percentage of Optimistic Forecasts as a Determinant of Management Guidance.
Note. FE = fixed effects.
, **, and ***Significantly different from zero at the .10, .05, and .01 levels, respectively, using a two-tailed test.
With respect to the estimated coefficients on control variables, my results are broadly in line with the findings of prior research. Firms that guide in the previous quarter, firms that guide in the same quarter of the previous year, firms with good performance over the past year, and firms with greater analyst following and institutional ownership are more likely to provide guidance. The significantly negative coefficient on DISPERSION suggests that managers are less likely to give guidance when a firm’s earnings are less predictable.
Influential Analyst Forecast Being Optimistic
Next, I examine whether managers are more likely to provide guidance when influential analysts’ forecasts are optimistic. Following Kirk et al. (2014), I use a composite-score approach to identify the influential analyst forecast. I consider five analyst characteristics that are likely to be influential based on prior research. First, prior studies (Jacob et al., 1999; Mikhail et al., 1997) find that analysts who are more experienced, from larger brokerage houses, and All-Stars as rated by the Institutional Investor magazine are more influential among investors. EXPERIENCE is measured by the number of prior quarters in which the analyst has issued a forecast for the firm. BROKER SIZE is measured by the number of analysts employed by the brokerage firm issuing earnings forecasts in the current quarter. ALL-STAR is equal to 1 if an analyst is classified as an Institutional Investor“All-Star” when that analyst releases a forecast and 0 otherwise. “All-Star” status is determined based on the most recent Institutional Investor poll preceding the forecast release date. I expect forecasts with higher values of these characteristics to be more important. Second, Cooper, Day, and Lewis (2001) argue that some analysts are leaders in guiding other analyst forecasts. LEADER is equal to 1 if an analyst is a leader as defined in Cooper et al. (2001) and 0 otherwise. 8 I expect that managers are more likely to move the analyst if the analyst is a leader. Finally, I expect forecasts from analysts with a lower number of companies covered to be more important because these analysts are more focused on a given firm. #COMPANIES is measured by the number of companies for which the analyst issues earnings forecasts during the quarter.
I develop a composite score to summarize the five characteristics and determine the weight for each characteristic by the estimated coefficient for that characteristic. Specifically, I employ a probit regression model by using pooled cross-sectional data over the previous eight quarters. This method allows the managerial guidance decision in the recent past to determine how important a forecast characteristic is. The regression for characteristic weight determinations is as follows:

Similar to Kirk et al. (2014), the coefficient
Appendix B reports the results from estimating the above equation. The table reports the mean coefficient estimates for each variable and two-tailed p values in parentheses for testing whether the coefficient is different from 0. The forecast characteristics with the highest percentage of prediction successes are EXPERIENCE, LEADER, and #COMPANIES. Similar to Kirk et al. (2014), I find that ALL-STAR has the lowest prediction success rate.
I then estimate the following model:

I code INFLU_OPTIMISM as an indicator variable that equals 1 if the influential analyst is optimistic and 0 otherwise. The remaining variables are the same as those previously defined in Equation 1.
Columns (1) and (2) of Table 3 report the maximum likelihood probit estimates of management guidance equations. The coefficient on INFLU_OPTIMISM is 0.2671, significantly positive, consistent with H2. In column (2), I add my first measure of individual analyst optimism, PCT_OPTIMISM, to Equation 2. INFLU_OPTIMISM continues to have a significantly positive coefficient of 0.1486. Moreover, the coefficient of PCT_OPTIMISM is also positive and statistically significant. The marginal effects of INFLU_OPTIMISM and PCT_OPTIMISM are 0.034 and 0.036, respectively.
Optimism in Influential Analysts’ Forecasts as a Determinant of Management Guidance.

Note. FE = fixed effects.
, **, and ***Significantly different from zero at the .10, .05, and .01 levels, respectively, using a two-tailed test.
Overall, the results reported in Table 3 are generally consistent with the prediction in H2 that optimism in the influential analyst’s forecast is an important determinant of management guidance, after controlling for the median level of optimism and the percentage of optimistic forecasts. 9 My findings suggest that individual forecasts appear to be a more informative proxy for market expectation than the consensus forecast. 10 Given these findings, one natural question that arises is how managers make guidance decisions when the influential analyst disagrees with the majority? In the next section, I perform more analyses to explore this issue.
Whose Opinion is More Important?
Subsample analysis when the consensus forecast is pessimistic
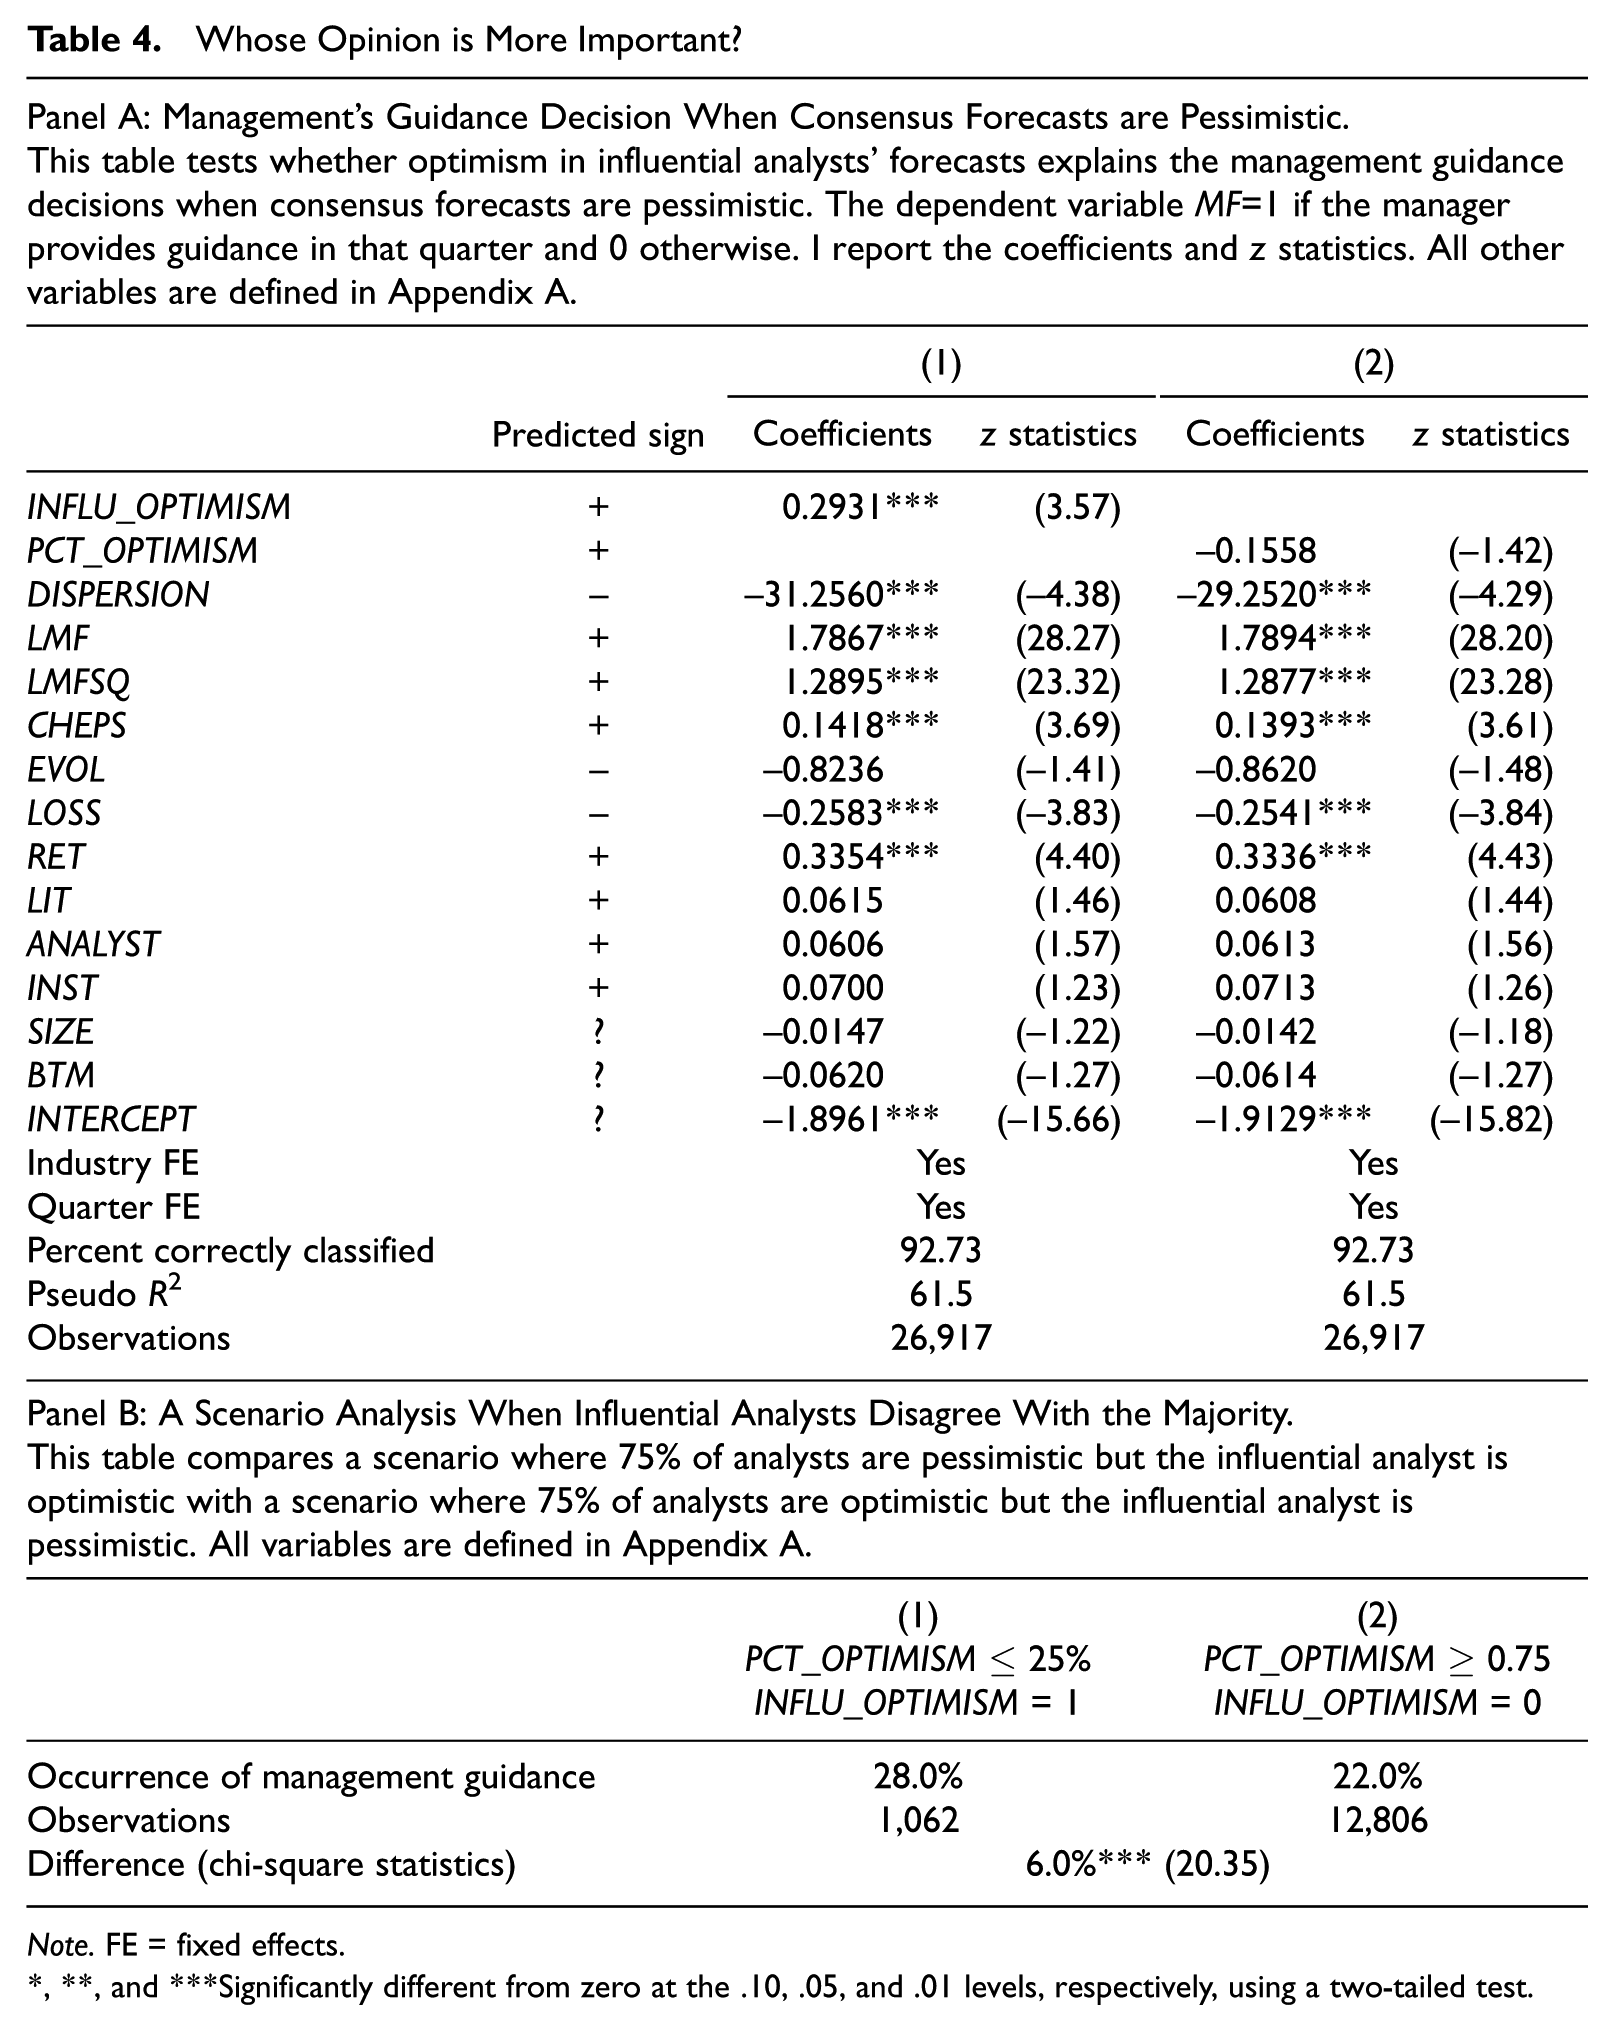
To further demonstrate that influential analysts may play an important role in the management guidance decision, I examine the occurrence of management guidance for the subsample of firms with pessimistic consensus forecasts. Panel A of Table 4 reports the results. I find that even when the consensus forecast is pessimistic, the coefficient on INFLU_OPTIMISM continues to be positive and statistically significant at the 1% level. However, the coefficient on PCT_OPTIMISM is negative and insignificant. The results for the subsample of firms with pessimistic consensus forecasts suggest that influential analysts may play a more important role in triggering management’s guidance decision than noninfluential analysts.
Whose Opinion is More Important?
Note. FE = fixed effects.
, **, and ***Significantly different from zero at the .10, .05, and .01 levels, respectively, using a two-tailed test.
A scenario when influential analysts disagree with the majority
To gain more insights into whether managers are responding to the “crowd” or the composition of that “crowd,” I examine a scenario when the influential analyst disagrees with the majority. Specifically, I compare a scenario where 75% of analysts are pessimistic but the influential analyst forecast is optimistic with a scenario where 75% of analysts are optimistic but the influential analyst forecast is pessimistic. Panel B of Table 4 reports the results of such comparison. When the majority of analysts are pessimistic but the influential analyst forecast is optimistic, the probability of management guidance is 28.0%. In contrast, when the majority of analysts are optimistic but the influential analyst forecast is pessimistic, the probability of management guidance is 22.0%. The chi-square test indicates that the difference is statistically significant at the 1% level. This suggests that when the influential analyst disagrees with the majority, managers are more likely to respond to the influential analyst.
Taken collectively, the results are consistent with my second hypothesis that managers are more likely to provide guidance when influential analyst forecasts exhibit optimism. In particular, this holds for the scenario when the consensus forecasts are pessimistic and when the influential analyst disagrees with the majority. Combining results with those from a previous section, my finding suggests that managers may apply additional rules in addition to considering the median optimism when making guidance decisions. Moreover, my analyses suggest that managers may consider the influential analyst’s opinion to be the most important factor in determining management guidance, followed by the majority or consensus.
Analysts’ Forecasts Following the Guidance
Ex ante, however, it is not obvious whether the manager’s strategy is effective. To reinforce the finding that managers provide guidance in response to individual analyst forecasts, in this section, I investigate how analysts react to management guidance. I first examine whether the percentage of optimistic forecasts changes in response to management guidance. I then test whether and how influential analysts react to management guidance.
The Percentage of Postguidance Forecasts That are Optimistic
To examine analysts’ postguidance forecasts, I include analyst forecasts that are made 45 days after the measurement date. When an analyst has issued more than one forecast for the same firm-quarter during this period, I use the earliest forecast. Figure 1 describes the sequence of events. For each firm-quarter, I define POSTPCT_OPTIMISM as the percentage of postguidance forecasts that are greater than the reported earnings. I then estimate how the percentage of optimistic forecasts changes in response to the management guidance decision in a multivariate regression model:

In the above equation, I include MF, management guidance decision, and a set of control variables proposed in the literature that are likely related to analysts’ forecast optimism. I include MED_OPTIMISM and PCT_OPTIMISM because I expect that analysts’ postguidance forecasts are related to the prior forecasts. Das, Levine, and Sivaramakrishnan (1998) find that analysts issue more optimistic forecasts for low-predictability firms than for high-predictability firms to obtain private information from managers. I use two variables, DISPERSION and EVOL, to capture earnings predictability. Cowen, Groysberg, and Healy (2006) show that analysts issue optimistic forecasts to generate trading volume, suggesting that analyst optimism is at least partially driven by trading incentives. To control for analysts’ incentive to generate trading commissions, I include trading volume (TVOL) measured as the natural logarithm of the total trading volume (million shares) over the 12 months prior to the first forecast issued after the measurement date. Prior studies have reported that the distribution of analyst earnings forecast errors is different for profit firms than for loss firms (Brown, 2001). So, I also include LOSS, an indicator variable which equals 1 if the firm experiences a loss in quarter t − 1 and 0 otherwise. Following Abarbanell and Bernard (1992), I control for the change in earnings using CHEPS. In addition, I include a number of other control variables. Previous studies find that size, greater analyst following and institutional holdings, and high growth are also related to more optimistic forecasts (Bhushan, 1989). Accordingly, I include SIZE, BTM, INST, and ANALYST as controls.
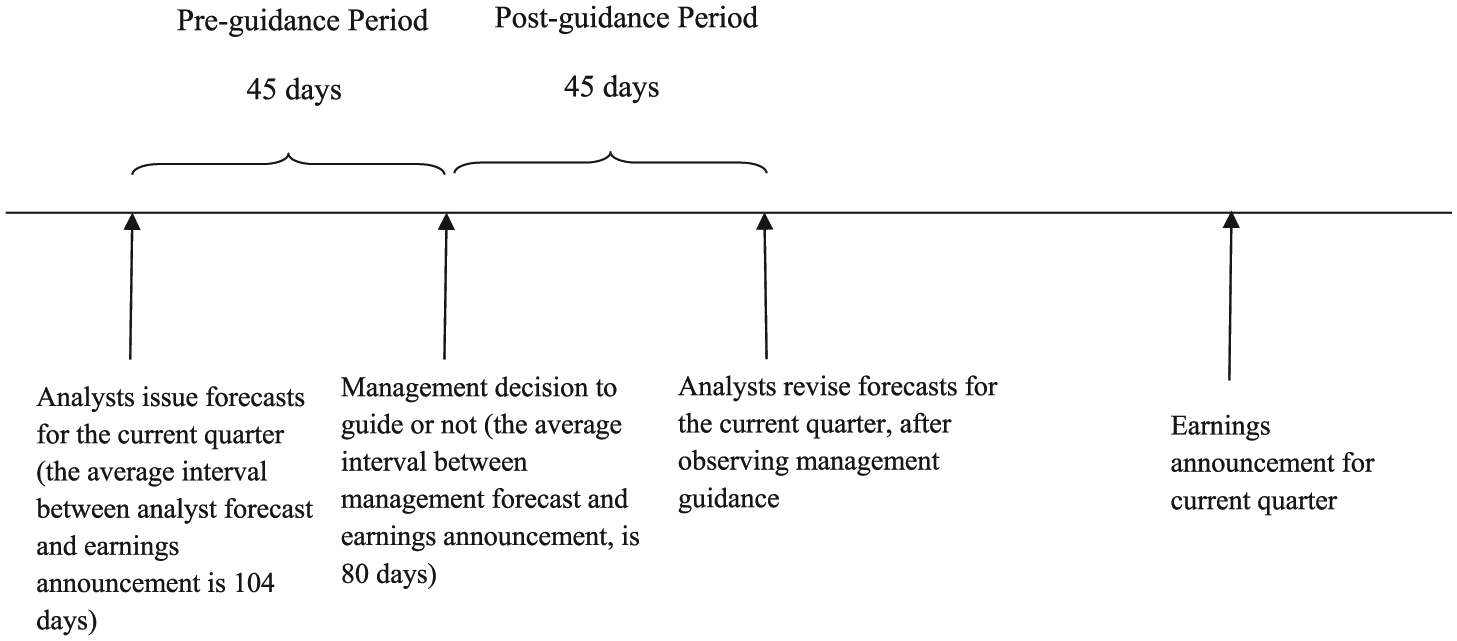
Schematic timeline of events.
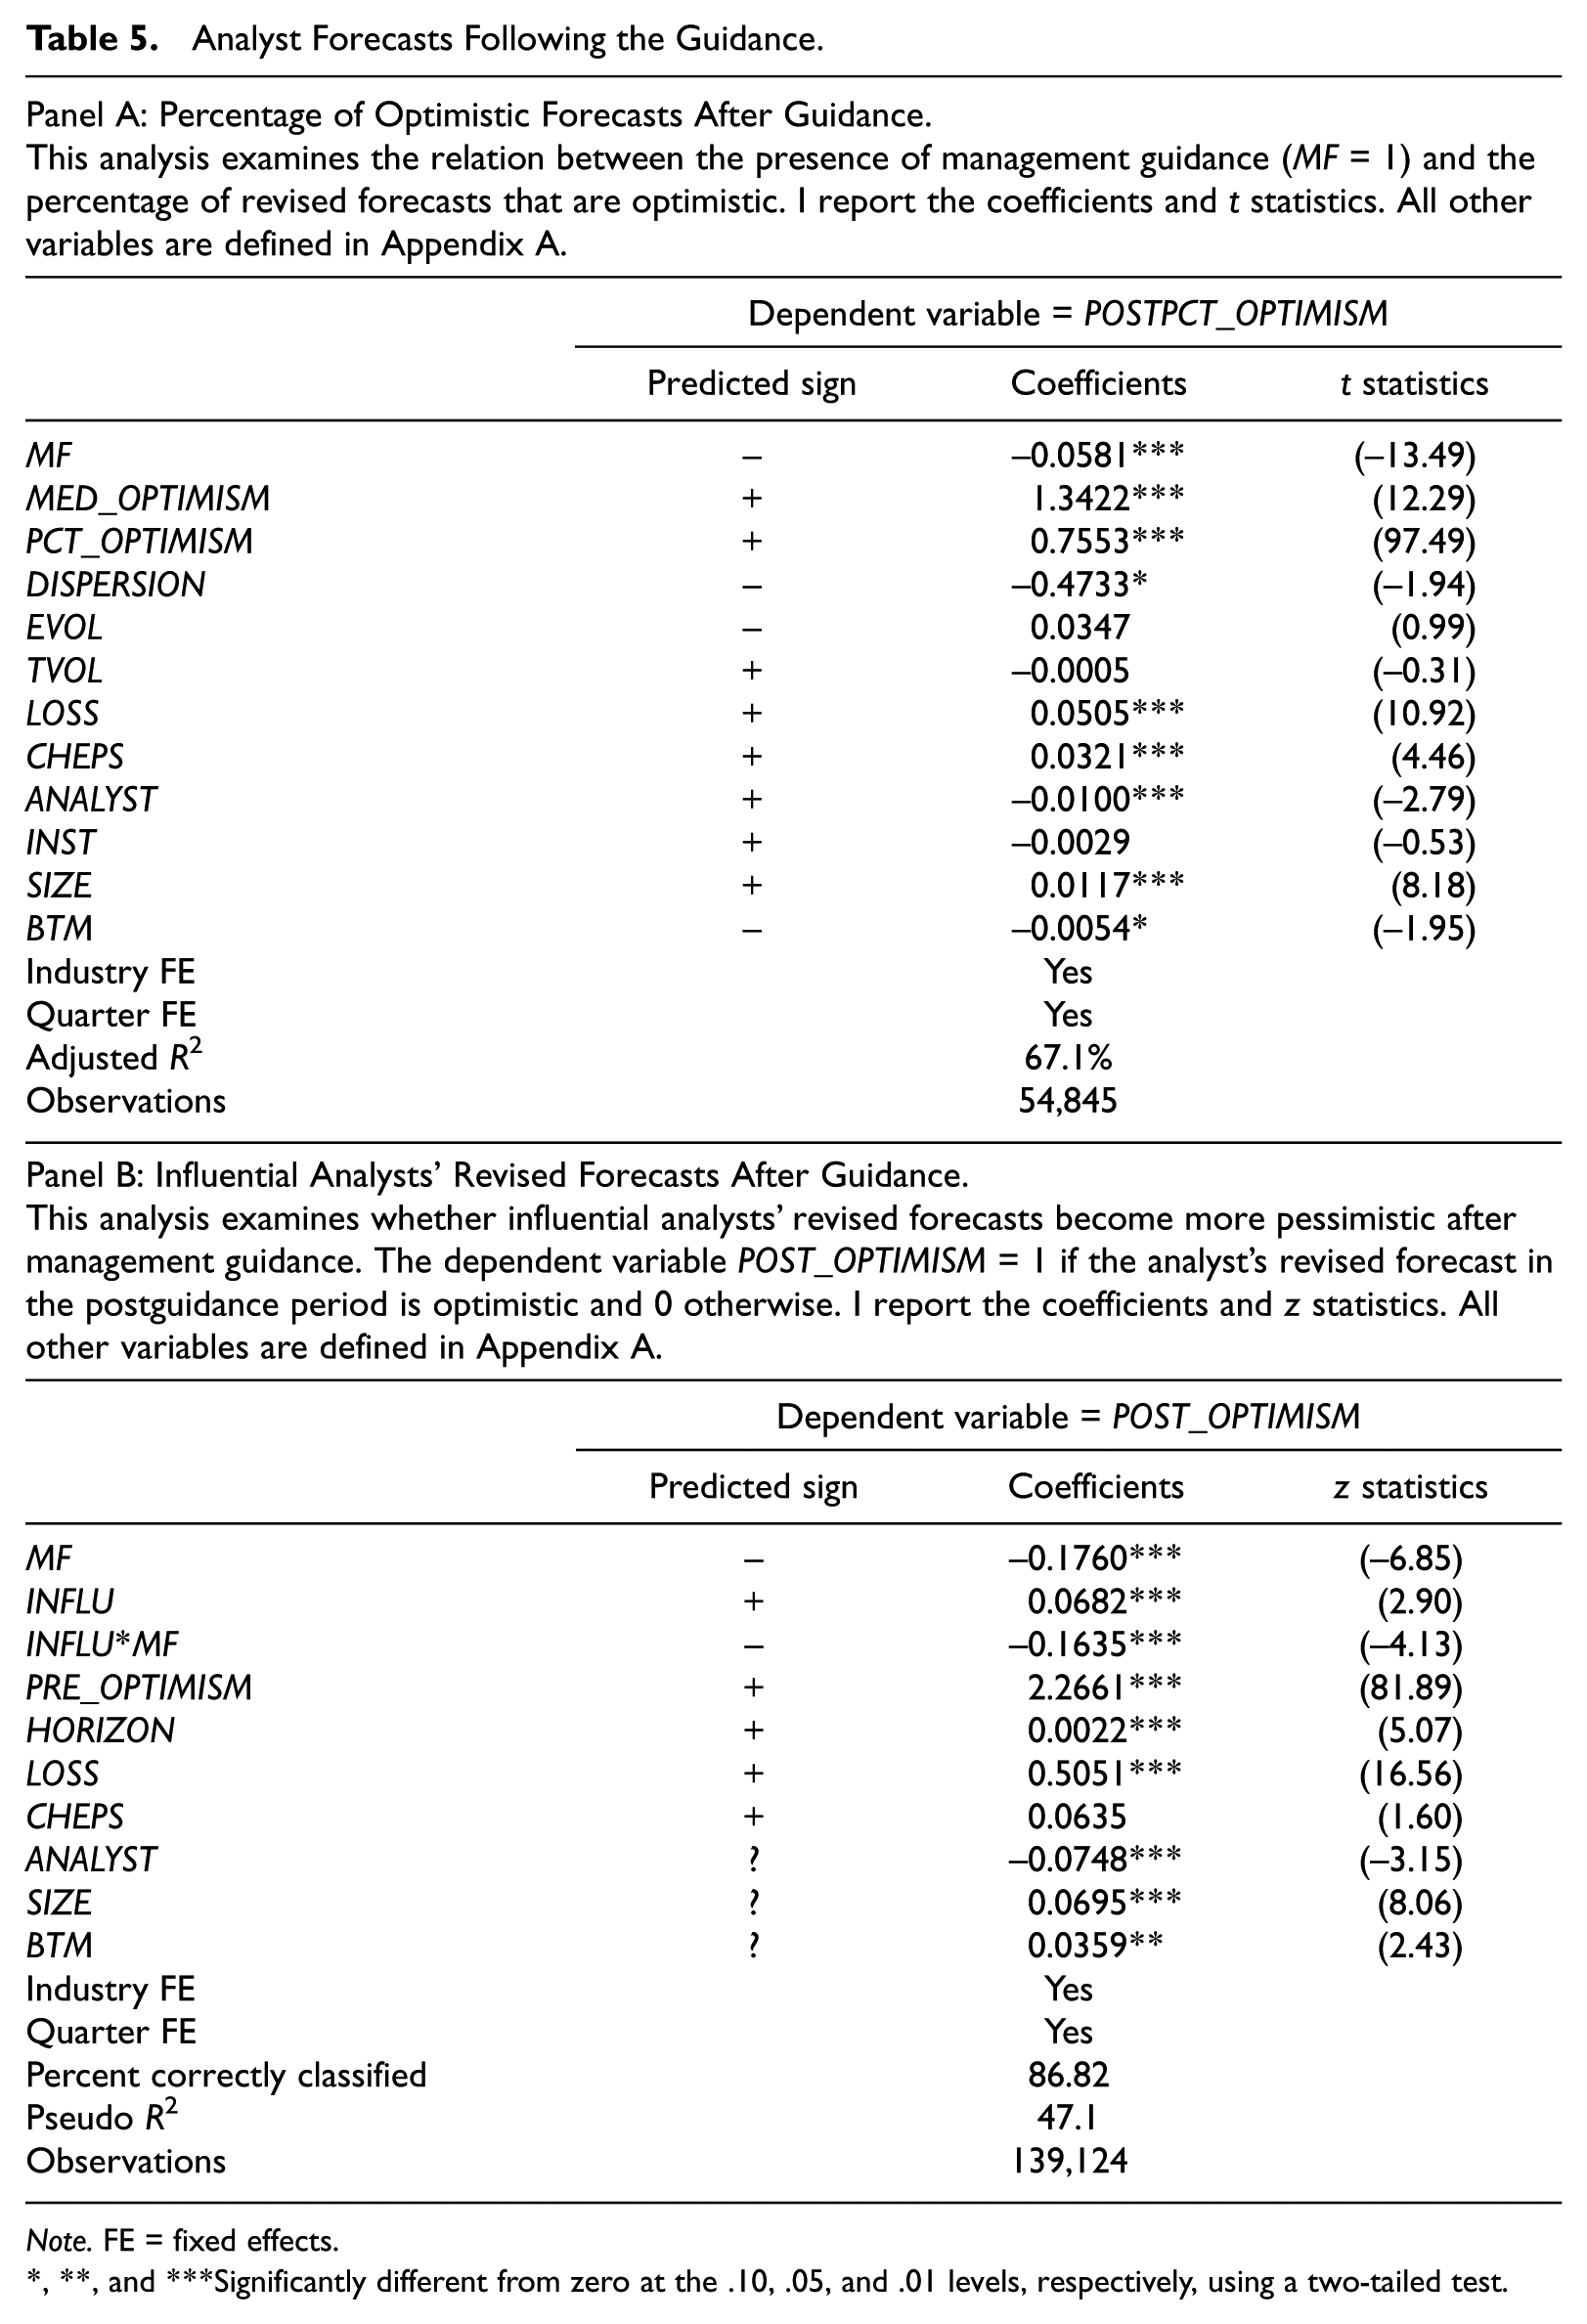
My main finding, as shown in Panel A of Table 5, is that firm-quarters with guidance have a lower percentage of optimistic forecasts than firm-quarters without guidance, as evidenced by the significantly negative coefficient on MF. 11 My results are consistent with the notion that analysts are more likely to issue meetable or beatable forecasts when the manager provides guidance.
Analyst Forecasts Following the Guidance.
Note. FE = fixed effects.
, **, and ***Significantly different from zero at the .10, .05, and .01 levels, respectively, using a two-tailed test.
Influential Analysts’ Revised Forecasts
To examine how influential analysts respond to management guidance, I include individual analyst forecasts that are made 45 days both before and after the measurement date. I keep analysts who issue at least one forecast in both the pre- and postguidance period. When an analyst has issued more than one forecast for the same firm-quarter during the preguidance (postguidance) period, I use the latest (earliest) forecast issued. These requirements result in a sample size of 139,124 analyst-firm-quarters:

In the above equation, POST_OPTIMISM is defined as an indicator variable that equals 1 if the analyst issues a revised forecast that is greater than the reported earnings in the postguidance period and 0 otherwise. MF is the management guidance decision. INFLU is defined as an indicator variable if the analyst is an influential analyst, as constructed in previous sections. INFLU*MF is the main variable of interest that interacts variable INFLU with MF. The coefficient on INFLU*MF captures how influential analysts respond to management guidance in comparison with other analysts. Similar to POST_OPTIMISM, PRE_OPTIMISM is defined as an indicator variable that equals 1 if the analyst issues a forecast that is greater than the reported earnings in the preguidance period and 0 otherwise. HORIZON is defined as the number of days between the analyst forecast date and the earnings announcement date. I expect the coefficient on HORIZON to be positive because analyst forecasts on average exhibit a downward pattern over time.
Panel B of Table 5 reports the results of the probit regressions for the effect of management guidance on individual analysts’ revised forecasts. The results show that the coefficient on MF is −0.1760 and statistically significant at the 1% level. This suggests that on average, management guidance is effective in walking down analyst forecasts. The coefficient for my main variable of interest, INFLU*MF, is −0.1635 and statistically significant at the 1% level. Moreover, the sum of the coefficients β2+β3 is also negative and statistically significantly different from zero at the 1% level, indicating that influential analysts are more likely to issue meetable or beatable forecasts when the manager provides guidance.
Other factors are also significant determinants of issuing an optimistic revised forecast. Not surprisingly, the probability of an analyst issuing an optimistic revised forecast is positively related to her prior opinion about the firm, as manifested in a positive and significant coefficient on PRE_OPTIMISM. I further find that the probability that a revised forecast is optimistic is positively associated with firm performance captured by LOSS. Finally, there is a significant time effect in that the likelihood of issuing an optimistic revised forecast is positively related to HORIZON.
Robustness Tests
Analyses Conditional on Guidance Frequency
Recent evidence indicates that there is a marked increase in the occurrence of regular forecasts (Rogers, Skinner, & Van Buskirk, 2009), suggesting that issuing management guidance appears to have become a more routine part of a firm’s disclosure practices over the recent decade. As a robustness test, I test whether my main results still hold conditional on a firm’s past guidance frequency.
I code three variables that capture a firm’s past guidance frequency: MOST_FREQ equals 1 if the firm guides in at least 8 quarters in the prior 12 quarters and 0 otherwise; LEAST_FREQ equals 1 if the firm guides in fewer than 3 quarters in the prior 12 quarters and 0 otherwise; MEDIUM_FREQ denotes firms that are neither MOST_FREQ nor LEAST_FREQ. Results partitioned into the most, medium, and least frequent guiders are reported in Table 6. As seen from Table 6, results continue to hold under various levels of guidance frequency. 12
Robustness Analysis.
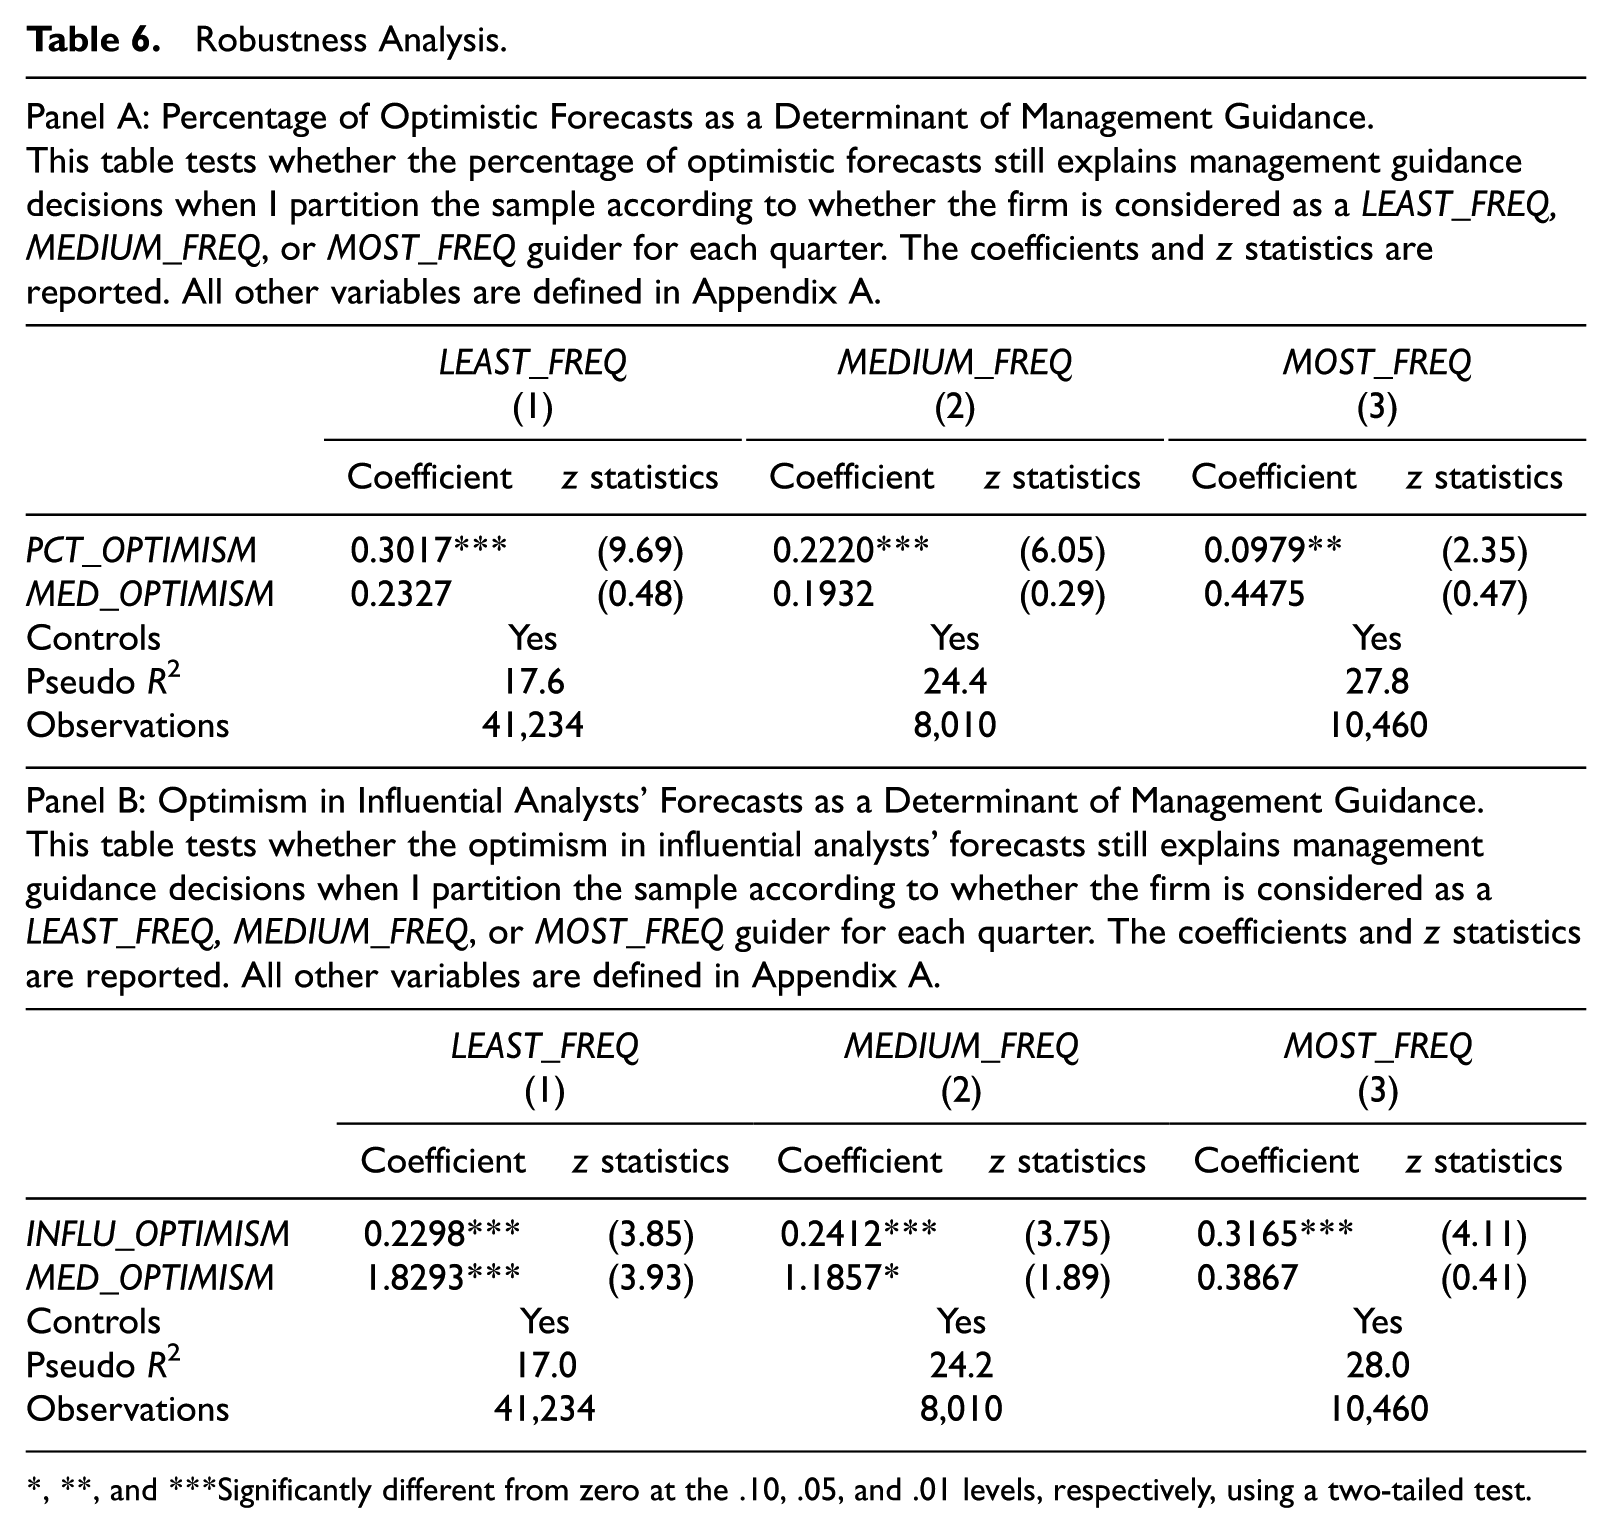
, **, and ***Significantly different from zero at the .10, .05, and .01 levels, respectively, using a two-tailed test.
Alternative Consensus Forecast Measure
In my main test, I use the median estimate as the analyst consensus forecast in constructing variables. Prior research also uses the mean estimate as the consensus measure. My results are similar when I use this alternative definition of consensus forecast and my inferences remain unchanged.
Bundled versus Nonbundled Guidance
There is a recent trend toward issuing guidance in conjunction with earnings announcements (Anilowski et al., 2007), also known as “bundled guidance.” Consistent with Anilowski et al. (2007), I find that across my sample period, these bundled forecasts make up more than 70% of the guidance. To examine whether the results are driven by bundled guidance, I perform a separate analysis on bundled and nonbundled guidance subsamples.
Following Anilowski et al. (2007), I define bundled guidance as those issued within 2 days of earnings announcements and nonbundled guidance as those issued outside of the earnings announcement periods. I partition the sample into bundled and nonbundled groups. Untabulated results show that my findings hold for both bundled and nonbundled groups. This suggests that the main result can be generalizable to both bundled and nonbundled guidance.
Measure of Optimism and Endogeneity Issue
My main measure of optimism is based on the ex post realization of earnings and therefore captures the effect of new information that occurs between the time of the forecasts and the time of the earnings announcements. It is possible that a forecast could be classified as “optimistic,” even though it was unbiased at the time it was issued based on the information available. As a robustness analysis, I employ an alternative measure of optimism used in Matsumoto (2002). Specifically, I measure analysts’ ex ante expectations of the actual earnings based on available information at the forecast date. The difference between analysts’ forecasts and the expected earnings is the ex ante measure of forecast optimism. My results are robust to this alternative measure of optimism.
Another related issue is the endogeneity in optimism. Prior literature suggests that a number of factors are likely to be related to analyst forecast optimism. Several possible explanations have been proposed, such as trading incentives (Cowen et al., 2006), earnings uncertainty (Das et al., 1998), and selection bias (McNichols & O’Brien, 1997). Recognizing the endogeneity in analyst forecasts, Zhou (2016) employs a system of simultaneous equations where analyst forecast optimism and management guidance decisions are considered as strategic choice variables. As a robustness test, I follow the methodology of Zhou (2016) and my inferences remain unchanged.
Conclusion
In this study, I examine the interplay between management guidance and individual analyst forecasts. Using a sample of firm-quarters from 2003 to 2013Q1, I find that the percentage of individual forecasts that are optimistic is an important determinant of management guidance. Consistent with prior literature that some analysts are more influential among investors than others, I find that the optimism in influential analysts’ forecasts also plays a role in prompting the issuance of management guidance. Specifically, I document two interesting findings which suggest that managers consider influential analysts’ opinions to be the most important. First, managers are more likely to issue guidance when the influential analyst forecast is optimistic, even when the consensus forecast is pessimistic. Second, when the influential analyst disagrees with the majority, managers are more willing to respond to the influential analyst. Subsequent analyses suggest that these influential analysts seem to be willing to cooperate with managers as well—they are more likely to issue meetable or beatable forecasts after managers provide guidance.
This study extends prior work on expectations management by investigating how managers use public guidance to guide individual analysts. Using both the majority of individual forecasts and the influential analysts’ forecasts as proxies for individual analyst forecasts, this study provides new evidence on how individual analysts influence managers’ voluntary disclosure and suggests a hierarchy, whereby the influential analyst’s opinion is the most important factor in determining management guidance, followed by the majority or consensus.
Footnotes
Appendix A
Variable Definitions.
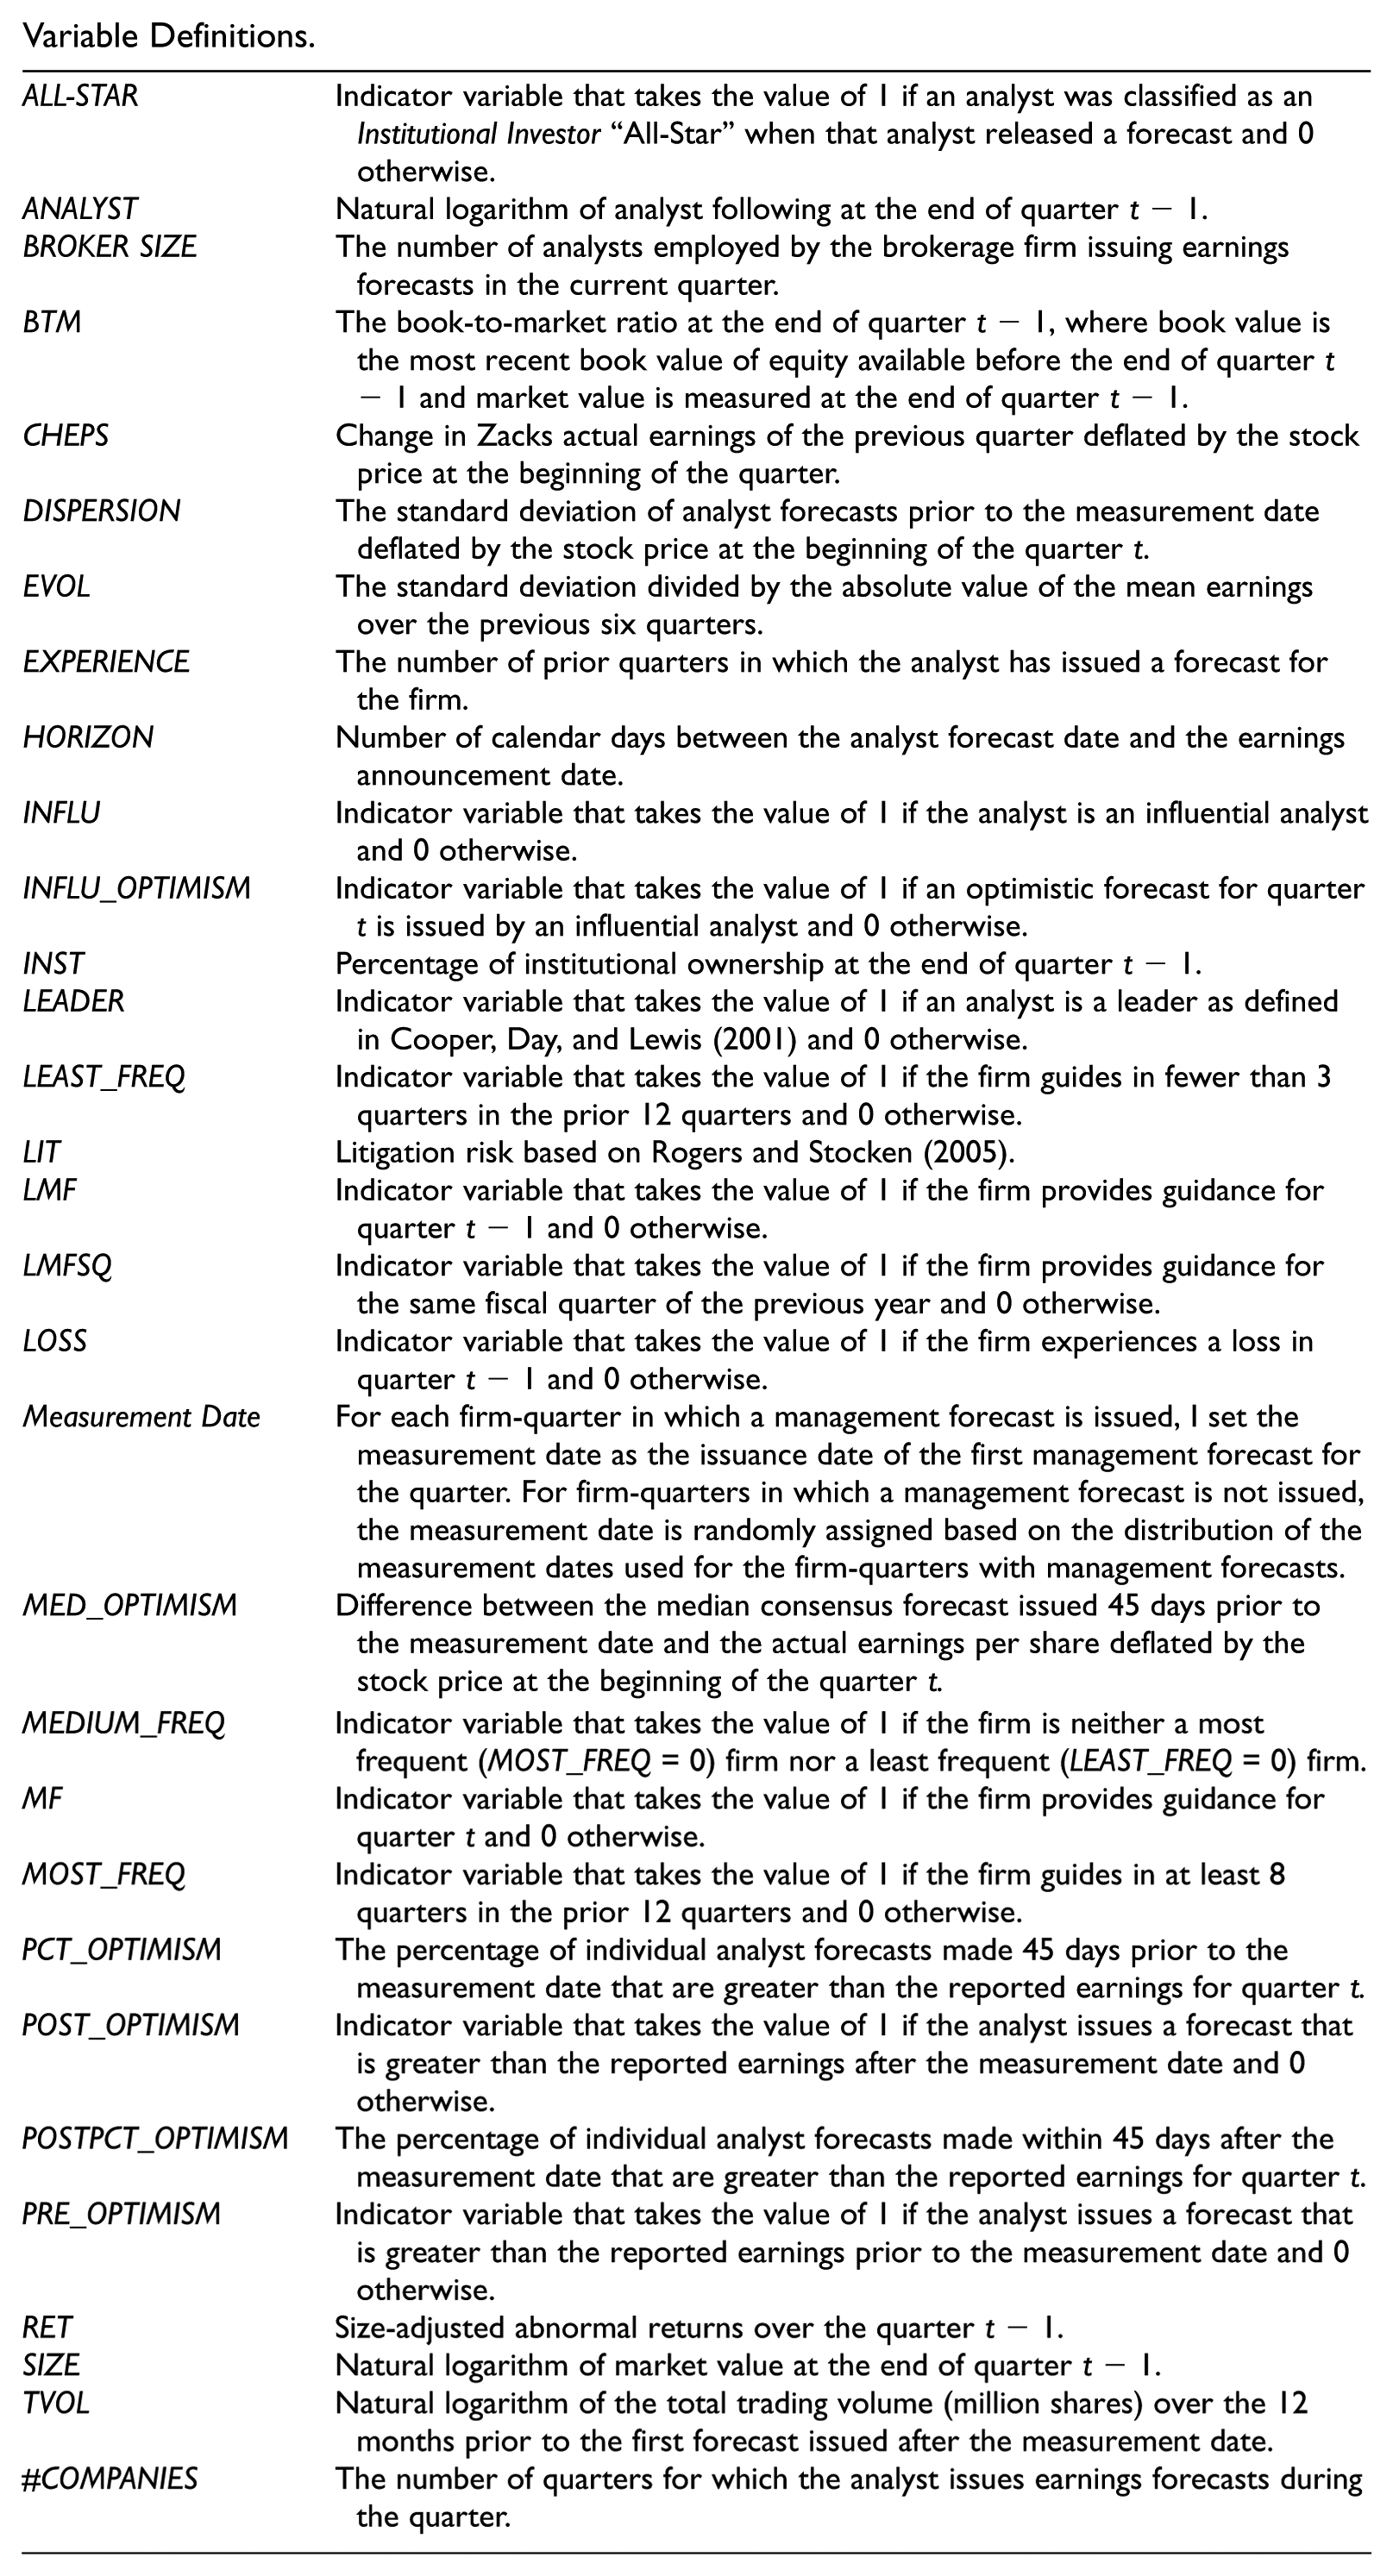
| ALL-STAR | Indicator variable that takes the value of 1 if an analyst was classified as an Institutional Investor“All-Star” when that analyst released a forecast and 0 otherwise. |
| ANALYST | Natural logarithm of analyst following at the end of quarter t − 1. |
| BROKER SIZE | The number of analysts employed by the brokerage firm issuing earnings forecasts in the current quarter. |
| BTM | The book-to-market ratio at the end of quarter t − 1, where book value is the most recent book value of equity available before the end of quarter t − 1 and market value is measured at the end of quarter t − 1. |
| CHEPS | Change in Zacks actual earnings of the previous quarter deflated by the stock price at the beginning of the quarter. |
| DISPERSION | The standard deviation of analyst forecasts prior to the measurement date deflated by the stock price at the beginning of the quarter t. |
| EVOL | The standard deviation divided by the absolute value of the mean earnings over the previous six quarters. |
| EXPERIENCE | The number of prior quarters in which the analyst has issued a forecast for the firm. |
| HORIZON | Number of calendar days between the analyst forecast date and the earnings announcement date. |
| INFLU | Indicator variable that takes the value of 1 if the analyst is an influential analyst and 0 otherwise. |
| INFLU_OPTIMISM | Indicator variable that takes the value of 1 if an optimistic forecast for quarter t is issued by an influential analyst and 0 otherwise. |
| INST | Percentage of institutional ownership at the end of quarter t − 1. |
| LEADER | Indicator variable that takes the value of 1 if an analyst is a leader as defined in Cooper, Day, and Lewis (2001) and 0 otherwise. |
| LEAST_FREQ | Indicator variable that takes the value of 1 if the firm guides in fewer than 3 quarters in the prior 12 quarters and 0 otherwise. |
| LIT | Litigation risk based on Rogers and Stocken (2005). |
| LMF | Indicator variable that takes the value of 1 if the firm provides guidance for quarter t − 1 and 0 otherwise. |
| LMFSQ | Indicator variable that takes the value of 1 if the firm provides guidance for the same fiscal quarter of the previous year and 0 otherwise. |
| LOSS | Indicator variable that takes the value of 1 if the firm experiences a loss in quarter t − 1 and 0 otherwise. |
| Measurement Date | For each firm-quarter in which a management forecast is issued, I set the measurement date as the issuance date of the first management forecast for the quarter. For firm-quarters in which a management forecast is not issued, the measurement date is randomly assigned based on the distribution of the measurement dates used for the firm-quarters with management forecasts. |
| MED_OPTIMISM | Difference between the median consensus forecast issued 45 days prior to the measurement date and the actual earnings per share deflated by the stock price at the beginning of the quarter t. |
| MEDIUM_FREQ | Indicator variable that takes the value of 1 if the firm is neither a most frequent (MOST_FREQ = 0) firm nor a least frequent (LEAST_FREQ = 0) firm. |
| MF | Indicator variable that takes the value of 1 if the firm provides guidance for quarter t and 0 otherwise. |
| MOST_FREQ | Indicator variable that takes the value of 1 if the firm guides in at least 8 quarters in the prior 12 quarters and 0 otherwise. |
| PCT_OPTIMISM | The percentage of individual analyst forecasts made 45 days prior to the measurement date that are greater than the reported earnings for quarter t. |
| POST_OPTIMISM | Indicator variable that takes the value of 1 if the analyst issues a forecast that is greater than the reported earnings after the measurement date and 0 otherwise. |
| POSTPCT_OPTIMISM | The percentage of individual analyst forecasts made within 45 days after the measurement date that are greater than the reported earnings for quarter t. |
| PRE_OPTIMISM | Indicator variable that takes the value of 1 if the analyst issues a forecast that is greater than the reported earnings prior to the measurement date and 0 otherwise. |
| RET | Size-adjusted abnormal returns over the quarter t − 1. |
| SIZE | Natural logarithm of market value at the end of quarter t − 1. |
| TVOL | Natural logarithm of the total trading volume (million shares) over the 12 months prior to the first forecast issued after the measurement date. |
| #COMPANIES | The number of quarters for which the analyst issues earnings forecasts during the quarter. |
Appendix B
Estimating the Weights for the Composite-Score Components.
The following table presents the association between management guidance and meeting individual analyst forecasts with varying characteristics (EXPERIENCE, BROKER SIZE, ALL-STAR, #COMPANIES, and LEADER, referred to as n = 1-5), estimated separately for the 42 sample quarters with each using the previous eight quarters of pooled firm-quarter observations. Panel A reports the descriptive statistics of the components. Panel B reports the mean coefficient estimate of the 42 regressions and the two-tailed p values (in parenthesis) for testing whether the coefficient is different from 0. The last column reports the percentage of regressions that produce a coefficient with the expected sign. I create the composite score for each forecast in my sample period using the characteristics of the forecasts in that firm-quarter and the estimated
Acknowledgements
I thank Bharat Sarath (the Editor), Stan Markov (the Associate Editor), and an anonymous reviewer for valuable comments. I have received constructive feedback from Jennifer Howard, Walied Keshk, and Dawn Matsumoto as well as from seminar participants at California State University Fullerton, Florida International University, National University of Singapore, and University of Technology Sydney Summer School. Part of this work is completed at the Northwestern University. All errors are mine.
Declaration of Conflicting Interests
The author(s) declared no potential conflicts of interest with respect to the research, authorship, and/or publication of this article.
Funding
The author(s) received no financial support for the research, authorship, and/or publication of this article.
