



Abstract
Using 41,648 firm-year observations from 30 countries during the period 2000–2011, we investigate the relation between analyst coverage and audit fees. We also examine whether the adoption of International Financial Reporting Standards (IFRS) and shareholder protection at the country level interacts with analyst coverage to affect audit fees. We find that auditors charge firms higher fees when the firms have greater analyst coverage. This supports our argument pertaining to analyst pressure. The positive impact of analyst coverage on audit fees is weaker for firms that adopt IFRS and in countries where there is high shareholder protection. This study enhances an understanding of the effect of analyst coverage on audit fees in relation to IFRS adoption and shareholder protection levels in an international setting.
Introduction
We investigate the impact of analyst coverage on audit fees and the interaction with country characteristics in 30 countries, that is, the adoption of International Financial Reporting Standards (IFRS) and the level of shareholder protection. The roles that security analysts play as information intermediaries in financial markets and the effects that analysts have on the business environment, which, in turn, affects business risk, have received considerable attention in the literature (e.g., Beyer et al., 2010). 1 Most previous studies relating analysts emphasize analysts’ forecast accuracy and information content, or whether analysts affect investors’ decisions and stock prices (Clement, 1999; Dechow et al., 2000b; Eames & Glover, 2003; Kross et al., 1990). However, another stream of research investigates the effect of analyst coverage on auditor behavior. For example, analyst coverage can affect how an auditor perceives a company’s audit risk and this could affect audit fees. However, previous studies of analyst coverage and audit fees provide mixed arguments on whether analyst coverage and audit fees are related.
Some researchers argue that analyst coverage will reduce audit fees. This argument is based on the view that the prevalence of analyst coverage results in improved disclosures and a richer information environment (Lang & Lundholm, 1996). Also, analysts’ monitoring behavior has the potential to reduce managers’ ability to expropriate benefits through earnings management (Healy & Palepu, 2001; Yu, 2008) and it brings with mechanisms to detect fraud (Dyck et al., 2008) and improve corporate governance and internal control. Collectively, this enables auditors to expend less audit effort. All these factors could conceivably be reflected in lower audit fees (Knyazeva, 2007; Tsui et al., 2001).
By contrast, researchers who argue for a positive relation between analyst coverage and audit fees base their argument on increased scrutiny and risk of reputation loss (Keune & Johnstone, 2012) which, in turn, are related to several factors. First, the increased visibility of a company covered by more analysts can signal that a firm might have a larger investor pool and, therefore a higher risk of the auditor being sued and suffering reputational damage if the auditor issues an inappropriate audit opinion. Second, analysts’ incentives might not always be objective and might favor management in some situations. Analysts might generate analyses that favor and benefit management due to pressure from their brokerage house (Yu, 2008). This is likely to occur when major clients have significant holdings in certain companies (Dechow et al., 2000a) or when commercial relationships exist (Nuys, 1995). Third, managers’ incentives might encourage mangers to engage in earnings management due to pressures to meet or beat analysts’ benchmark forecasts (Yu, 2008).
These competing arguments suggest that the relation between analyst coverage and audit effort is still tense (Yu, 2008). Therefore, an interesting empirical issue is to examine which of the two competing arguments better explains the relation between analyst coverage and audit fees.
The financial reporting environment in a particular country may affect the relation between analyst coverage and audit fees, for example, whether a country has adopted international accounting standards. Kim and Shi (2012a) argue that adopting IFRS encourages firms to disclose more firm-specific information. Adopting IFRS improves disclosure in general and serves to develop monitoring mechanisms in the adopter’s country more effectively. According to Kim et al. (2012), improving disclosure might affect audit fees. In a country where IFRS is not mandatory, auditors may rely more on analysts’ efforts to disseminate a company’s information compared with a country where IFRS is mandatory. Therefore, we also investigate whether the adoption of IFRS moderates the relation between analyst coverage and audit fees.
The relation between analyst coverage and audit fees is also likely to vary across countries because of the level of shareholder protection provided in different countries. In less developed countries, analysts play a different role and disseminate different kinds of information to investors (Chan & Hameed, 2006; Morck et al., 2000). Lang et al. (2004) find that the impact of analyst coverage on firm value is mitigated in countries with lower levels of shareholder protection. The level of analyst coverage in countries with low shareholder protection can result in analysts playing a role whereby they are partial substitutes for corporate governance. This strongly affects the decisions of auditors more than in countries with high levels of shareholder protection. Therefore, we examine whether the relation between analyst coverage and audit fees is related to the level of shareholder protection.
Using 41,648 firm-year observations from 30 countries during the period 2000–2011, we find consistent evidence that analyst coverage has a positive association with audit fees and that analyst coverage adds incremental explanatory power to existing audit fee models. In addition, we find the IFRS adoption and country shareholder protection have attenuating effects on the relation between analyst coverage and audit fees. Our results indicate that the adoption of IFRS results in a weaker positive association between analyst coverage and audit fees. Furthermore, our results indicate that the positive association between analyst coverage and audit fees is weaker in countries with higher shareholder protection.
Our article makes several contributions to the literature. First, to the best of our knowledge, our study is the first one to examine the association between analyst coverage and audit fees in an international setting. Our study enhances an understanding of the effect of analyst coverage on audit fees by providing a more comprehensive examination of the relation between analyst coverage and audit fees. We consider country-level characteristics that might affect the relation between analyst coverage and audit fees and find that the relation between audit fees and analyst coverage is affected by factors that affect the role of analysts, that is, IFRS adoption and the level of shareholder protection.
Second, our main results are inconsistent with those of Gotti et al. (2012), who report a negative relation between analyst coverage and audit fees using a sample of U.S. companies. However, our study differs from Gotti et al. (2012) in several ways. First, their sample was limited to U.S. firms covered by at least one analyst in the pre-GFC period. In our study, we include non-U.S. firms for international evidence. This difference is important because a country’s financial reporting framework and level of shareholder protection may affect the monitoring role of analysts and the effect of the monitoring role on audit fees. Second, their sample only included companies covered by at least one analyst. Having an analyst following and having a number of analysts following a company may have different effects on audit fees. However, the sample used by Gotti et al. (2012) does not allow for an examination of this issue. Therefore, we include both companies that have an analyst following and companies that do not have an analyst following and differentiate between these effects. Third, Gotti et al. (2012) did not properly control for endogeneity of analyst coverage. We control for endogeneity using a two-stage regression approach: the first-stage regression models analyst coverage and the second-stage regression models audit fees.
Finally, our findings indicate that the initial impact of analyst coverage on audit fees is negative, and the marginal impact of the number of analysts is positive. This suggests that when a firm’s status changes from no analyst coverage to having some analyst coverage, this leads to a lower audit fee. This may be because auditors view the change in analyst monitoring status as an improvement in external governance that may result in improved disclosure and financial reporting quality. This is the basis of the analyst monitoring argument. However, if a firm has some analyst following, a firm’s visibility might improve substantially, and auditors might perceive this as a significant change in litigation and reputation risk. This suggests that the analyst pressure and the litigation risk arguments help to explain the relation between analyst coverage and audit fees. In turn, this provides a relevant and interesting contribution to the prior literature.
The remainder of the article is organized as follows: The next section discusses the extant literature surrounding the issues examined and develops the hypotheses. We present the data and research design in the subsequent section. We then report our results, including additional tests and sensitivity tests. Finally, we conclude the article by discussing the findings.
Previous Literature and Hypothesis Development
Analyst Coverage and Audit Fees: Analyst Monitoring Versus Analyst Pressure
Hay et al. (2006) report that the importance of corporate governance has escalated in the setting of audit fees. Prior studies have called for additional research into the role governance plays in the setting of audit fees. Gillan (2006) suggests that researchers often define corporate governance mechanisms as belonging to one of the two categories: internal corporate governance and external governance. One form of external governance might manifest itself in the monitoring role of analysts, and this is believed to act as a partial substitute for internal corporate governance (Knyazeva, 2007).
Analysts play a pivotal role as information intermediaries between companies and shareholders. Analysts analyze data that companies release, including financial statements, earnings reports, and other announcements, as well as media reports such as specific news related to a company and macroeconomic news. A special feature of analysts is their ability to collect private information about companies. Analysts often have opportunities to interact with management during earnings release conference calls (Yu, 2008). They also pose questions regarding the content of a firm’s financial report to corporate executives, usually the chief financial officer, who then provides answers (Yu, 2008). Analysts use these responses to construct the information sets they use in forecasting earnings. Analysts also play a crucial role in disseminating a company’s information and details through their analyses.
There are competing arguments for both a negative and a positive relation between analyst coverage and audit fees (Yu, 2008). The arguments that lead to the expectation of a negative association between analyst coverage and audit fees relate to improved disclosures, fraud risk, and better corporate governance. First, coverage by analysts could improve a company’s disclosures and promote a better and richer information environment. Gao et al. (2018) argue that firms that receive greater coverage have lower information asymmetry between managers and investors and this reduces adverse selection problems when issuing equities. Reduced information symmetry should result in lower audit fees because of reduced information risk and a lower demand for external monitoring by auditors. Studies have documented that firms with higher quality disclosure tend to attract a greater analyst following (Barth & Hutton, 2004; Botosan & Harris, 2000; Healy & James, 1999). Firms with higher quality disclosures have lower levels of audit risk and should be charged lower audit fees. Lang and Lundholm (1996) report that higher disclosure levels are associated with greater analyst coverage, thereby creating a larger pool of potential investors. Thus, analyst coverage could have a negative relation with audit fees as analyst coverage improves disclosure and provides a better information environment.
Second, analysts can assist in fraud detection and prevention. Dyck et al. (2010) find that analysts contributed directly to discovering corporate fraud in companies such as Compaq Computer, CVS, Electronic Data System Gateway, Global Crossing, Motorola, PeopleSoft, and Qwest Communication International. In addition, Lang et al. (2004) argue that analysts help enhance transparency and add a layer of oversight to protect companies from fraud. Therefore, as analyst coverage increases, a company’s risk of fraud might decrease, which would lead to a negative relation between analyst coverage and audit fees.
Third, analysts can act as a substitute for internal corporate governance and improve internal control as an external monitoring mechanism (Knyazeva, 2007; Tsui et al., 2001). Jensen and Meckling (1976) argue that analysts contribute to a firm’s corporate governance because security analysts’ monitoring of corporate performance helps motivate managers, thereby reducing the agency costs associated with the separation of ownership and control. Griffin et al. (2008) argue that better governance enhances the quality of financial statements and internal controls, which enables auditors to decrease audit risk and reduce fees. Furthermore, better corporate governance is associated with superior financial performance (Gompers et al., 2003), and this can also reduce audit risk and thereby reduce audit fees. Bedard and Johnstone (2004) demonstrate that corporate governance affects auditors’ efforts and billing rates for their clients. They report that auditors charge higher billing rates and exert more effort for clients with higher corporate governance risks. Therefore, analyst coverage, as a substitute for corporate governance, might have a negative relation with audit fees.
Furthermore, analyst coverage could affect management’s behavior and motivation as well as the risk of earnings management. Financial analysts track financial statements on a regular basis and are likely to act as external monitors of managers (Dyck et al., 2008; Healy & Palepu, 2001; Yu, 2008). Such continuous monitoring limits managers’ ability to engage in earnings management behavior. As Healy and Palepu (2001) summarize, financial analysts collect information from public and private sources to uncover managers’ superior information, and this facilitates corporate monitoring. External monitoring arguably mitigates the conflict between current and future shareholders (Healy and Palepu, 2001). In addition, Yu (2008) finds that analysts are capable and resourceful in tracking firms regularly, and they continuously scrutinize management behavior and financial reporting irregularities. Yu (2008) suggests that analyst monitoring influences managers’ financial reporting incentives. Thus, analyst coverage and audit fees may be negatively related to the extent that a manager’s ability to engage in opportunistic earnings management decreases with analyst coverage and external auditors consider such an environmental factor in setting their fees (Gotti et al., 2012).
However, there are several reasons why there could be a positive relation between analyst coverage and audit fees. First, auditing standards encourage auditors to incorporate public information about their client into their risk assessments and audit planning. Analyst-provided information can provide two benefits to auditors: (a) information about macroeconomic and industry-wide trends, and (b) knowledge about performance targets that management is obligated to meet (American Institute of Certified Public Accountants [AICPA], 2002; Public Company Accounting Oversight Board [PCAOB], 2010). Therefore, analyst forecasts could indicate the need for heightened professional skepticism and additional procedures on the part of the auditor. Newton (2019) investigates whether auditors respond to a signal of potential misstatement risk derived from differences between auditors’ earnings expectations and analysts’ forecasts. Results indicate that auditors respond to these signals by charging higher fees and delaying the release of their audit reports which, when taken overall, suggests greater audit effort. As a result, auditors might charge a higher audit fee to compensate for the higher risk.
Second, Gao et al. (2018) argue that analyst coverage increases the attention focused on a company from other analysts, media, and the public. Therefore, auditors would incur higher costs due to lawsuits and reputational damage if they perform a poor-quality audit for firms with greater analyst coverage. Auditors are expected to expend more audit effort to reduce the expected legal and reputational costs caused by the increased visibility due to analyst coverage (Pratt & Stice, 1994).
Third, analyst coverage might pressure managers into managing earnings to meet analysts’ earnings forecasts as well as increase managers’ incentives to behave opportunistically (Yu, 2008). Keune and Johnstone (2012) demonstrate that managers are more likely to attempt to waive qualitatively material misstatements. For example, managers might argue against an auditor’s proposed adjustments, especially as analyst following increases, to meet analysts’ earnings forecast benchmarks. In addition, Bedard and Johnstone (2004) find that auditors increase planned audit efforts for clients which carry a higher risk of manipulating earnings. Therefore, analyst coverage might have a positive association with audit fees.
Given the conflicting arguments concerning the effect of analyst coverage on audit fees, we present a nondirectional hypothesis:
Impact of Country Characteristics on the Relation Between Analyst Coverage and Audit Fees
Impact of IFRS adoption
Kim et al. (2012) find that mandatory IFRS adoption led to an increase in audit fees during the year of adoption and in subsequent years. This suggests that an increase in the audit task complexity associated with IFRS adoption is the main driving force for a change in audit fees. Furthermore, they find that the IFRS-related audit premium decreases with improvements in the quality of financial reporting that adopting IFRS brought about, and with the strength of a country’s legal regime. Kim and Shi (2012a) find that IFRS adoption improved corporate disclosure. This could affect market participants’ incentives to collect, process, and trade on firm-specific information, thereby altering the information environment. Kim and Shi (2012b) find that the adoption of IFRS results in greater analyst coverage, thus increasing the visibility of a firm. Preiato et al. (2013) support the argument that analyst forecast accuracy increases after the adoption of IFRS when accounting-focused regulation enforcement is greater. Horton et al. (2013) suggest that mandatory IFRS adoption has improved the quality of information intermediation in capital markets and, as a result, improved firms’ information environment by increasing both accounting information quality and accounting comparability.
We expect a significant interaction between analyst coverage and audit fees. However, there are competing arguments about whether the marginal effect of analyst coverage on audit fees for firms that adopt IFRS will be stronger or weaker. Firms with greater analyst coverage and an increase in audit complexity resulting from IFRS adoption face higher levels of litigation risk and increased potential for reputation loss. This should result in auditors exerting more effort and charging higher audit fees. Thus, both IFRS adoption and analyst coverage could result in higher audit fees. This could result in a stronger effect on the audit fee premiums when there is greater analyst coverage.
Alternatively, analysts’ effectiveness increases in countries that mandate IFRS. Our earlier discussion suggests that more effective monitoring by analysts could result in lower audit fees. Although IFRS adoption could result in higher audit fees, more effective monitoring by analysts could moderate this effect. Therefore, the marginal effect of analyst coverage on audit fees may be weaker for firms that adopt IFRS. Given the competing arguments, we state the following nondirectional interaction hypothesis:
Shareholder protection level
Prior research finds a positive relation between the level of a country’s shareholder protection and audit fees. Taylor and Simon (1999) introduce country-specific macro variables in their comparison between 20 countries which covers litigation propensity, disclosure, and regulation. Their results indicate that increased litigation pressures, institutional traditions of increased disclosure, and increased regulation exert upward pressures on audit fees. Choi et al. (2008) develop a model explaining cross-country differences in audit fees and in particular the audit fee premiums for Big 4 firms and find that the strength of a country’s legal liability regime has a positive association with audit fees. This occurs because, as the legal regime becomes stronger, an auditor is more likely to incur a legal liability in the case of an audit failure, which leads to auditors exerting more effort and charging a higher audit fee to compensate for the increased possibility of legal liability costs. Therefore, the strength of a country’s level of shareholder protection is expected to have a positive association with audit fees because auditors are more likely to incur a liability in the case of an audit failure in stronger legal liability regimes. Therefore, we expect that the interaction between analyst coverage and the level of shareholder protection in a country will have a significant association with audit fees.
However, there are competing arguments as to whether the marginal effect of analyst coverage on audit fees will be stronger or weaker. For a higher level of shareholder protection, auditors will exert greater audit effort and charge higher audit fees because the legal liability and reputation costs are greater for countries with higher levels of shareholder protection (Kim et al., 2012). At the same time, firms with greater analyst coverage are exposed to higher levels of litigation risk and face the potential of increased reputation loss. This could result in auditors exerting more effort and charging higher audit fees. Consequently, a situation where there is both a higher level of shareholder protection and greater analyst coverage could result in higher audit fees. This could result in there being a stronger effect of analyst coverage on audit fee premiums. This argument suggests that the interaction between analyst coverage and the level of shareholder protection will have a positive association with audit fees.
However, when the law fails to protect investors, managers can expropriate benefits from outside shareholders more easily. As a result, an incremental benefit should emerge from the monitoring and disclosure improvements that analyst coverage in this setting creates. Fan and Wong (2005) suggest that management in countries with low shareholder protection might treat analysts as one of the external corporate governance mechanisms. Analyst coverage in countries with low shareholder protection can act as a partial substitute for corporate governance (Knyazeva, 2007), potentially creating an environment that more strongly affects auditor’ decisions than the same decisions in high shareholder protection countries. Therefore, the analyst coverage-related audit fee premium is expected to decrease with the strength of a country’s legal regime. This argument suggests that the interaction between analyst coverage and the level of shareholder protection will have a weaker or negative association with audit fees.
Given the competing arguments, we state the following nondirectional interaction hypothesis:
Research Design
Sample Selection
Our study uses a sample of 41,648 firm-year observations from 30 countries during the period 2000–2011. 2 As described in Table 1, the initial sample comprised 235,980 firm-year observations: 65,460 from U.S. companies and 170,520 from non-U.S. companies. The initial sample included all firms in the Worldscope database for which audit fee data were available. Company’s financial information was extracted from Compustat North America and Compustat Global. Audit fee data were obtained from Worldscope, and the analyst coverage variable was extracted from the I/B/E/S Detailed History. However, Worldscope does not provide time-series data for auditor identity. Hence, we obtained auditor names from Compustat North America and Compustat Global along with accounting data and merged the data with Worldscope and I/B/E/S to obtain the final sample.
Sample Selection.
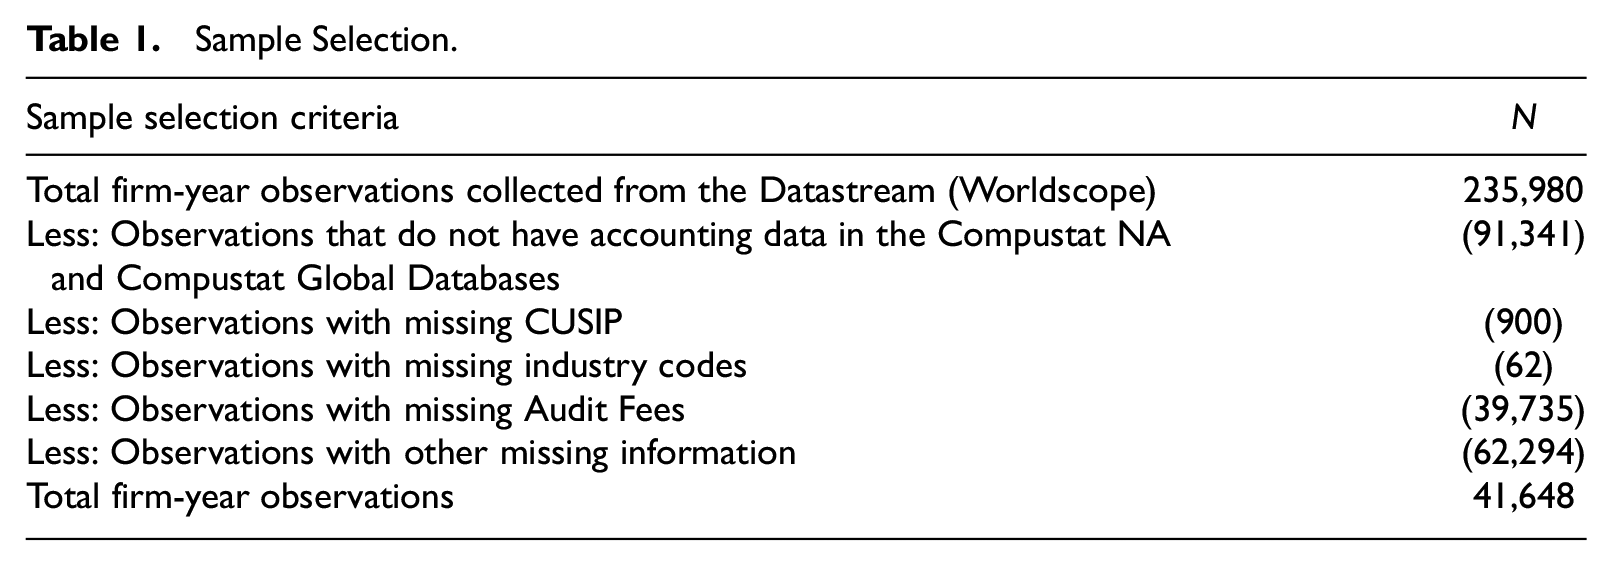
We excluded firms for which no financial information was available and firms with insufficient other information such as CUSIP and industry code. After excluding firms without relevant information required for our models, the final sample consisted of 41,648 firm-year observations: 10,009 firm-year observations for U.S. companies and 31,639 for non-U.S. companies.
Analyst Coverage is measured as the natural logarithm of the number of analysts who issued a forecast of a firm’s earnings in any given year plus 1, that is, ln(1+ number of analysts following). 3 Analysts might have less information asymmetries over a short interval, for example, close to the end of a fiscal year (Yu, 2008). Therefore, we use the last available number of analysts who made forecasts of a firm’s annual earnings in the fiscal-year-end month.
Gotti et al. (2012) restricted their sample to U.S. firms covered by at least one analyst. In their study, if a firm had no (zero) analysts following, it was excluded from their sample. Unlike Gotti et al. (2012), we include firms with zero analyst coverage in the primary analysis to reflect real-world situations, where not all firms receive analyst coverage (Hong et al., 2000), that is, ln(1) = 0. This enables us to differentiate the effects of having some analyst coverage versus no coverage from the extent of analyst coverage for those firms that do have an analyst following.
Model Specification
Analyst coverage is associated with many factors, such as firm size, performance, financial health, opportunity growth, and stock return volatility (Dechow & Dichev, 2002; Derrien & Kecskés, 2013; Lang et al., 2003). As mentioned earlier, Hong et al. (2000) indicate that larger firms and firms with better performance tend to have more analyst coverage. Bhushan (1989) also suggests that analysts have a greater incentive to follow larger firms. Hence, we include firm size (Size) in the first regression model, and we expect a positive association between firm size and analyst coverage. We use return on assets (ROA) as a proxy for firm performance in estimating analyst coverage (Hong et al., 2000). We include Issue as prior research has shown that debt issuance is associated with analyst coverage (Derrien & Kecskés, 2013). Lang et al. (2003) document that firms cross listed in the United States have greater analyst coverage; therefore, we include CrossList as in the model and we expect it to have a positive coefficient. Prior research also suggests that return variability (Volatility) has a positive association with analyst coverage, with the assumption that the cost of information acquisition is not significantly greater for firms with high return variability (Bhushan, 1989).
Following Larcker and Rusticus (2010), we use a test for the endogeneity of a regressor using the Durbin–Wu–Hausman test. The test rejects the null hypothesis that analyst coverage is exogenous in the regressions (χ2 statistic = 117.907, p < .001), which supports our use of two-stage least squares (2SLS) analyses to control for endogeneity as the main test. Therefore, to control for endogeneity of analyst coverage, we use 2SLS analyses suggested by Wooldridge (2010). This approach entails following steps. In the first step, we predict analyst coverage as an endogenous variable using an ordinary least squares (OLS) regression. In Step 2, the second-stage regressions are estimated separately with the endogenous variable (AnalystCoverage) being replaced by its fitted value (EstAnalystCoverage) from the first-stage regression. The fitted value is used as our test variable for testing our hypotheses. In testing, the interaction terms for the tests of H2 and H3, we also use the estimated analyst coverage variable when calculating our interaction variables.
We need an instrument variable that predicts analyst coverage, but which is not a determinant of audit fees. We use an instrumental variable (GlobalDow), that is, whether a firm is included in the Global Dow index, 4 which is a 150-stock index of corporations from around the world. Firms included in the index tend to have greater analyst following than similar firms not included in the index. Because the criteria for being added to the index are based on the country and sector conditions to which the firm belongs as well as on how representative a firm is of its country and sector, the difference in coverage caused by a stock’s inclusion in the Global Dow index is less likely to be influenced by audit fees.
The first-stage analyst coverage regression model is as follows:

where

Our audit fee model is based on previous studies that use proxies for risk, size, and complexity-related factors that generated the outcomes of audit services evident in fees (Fan & Wong, 2005; Gotti et al., 2012; Higgs & Skantz, 2006; Khurana & Raman, 2004; Simunic, 1980). The second-stage audit fee regression model used to test H1 is as follows:

where
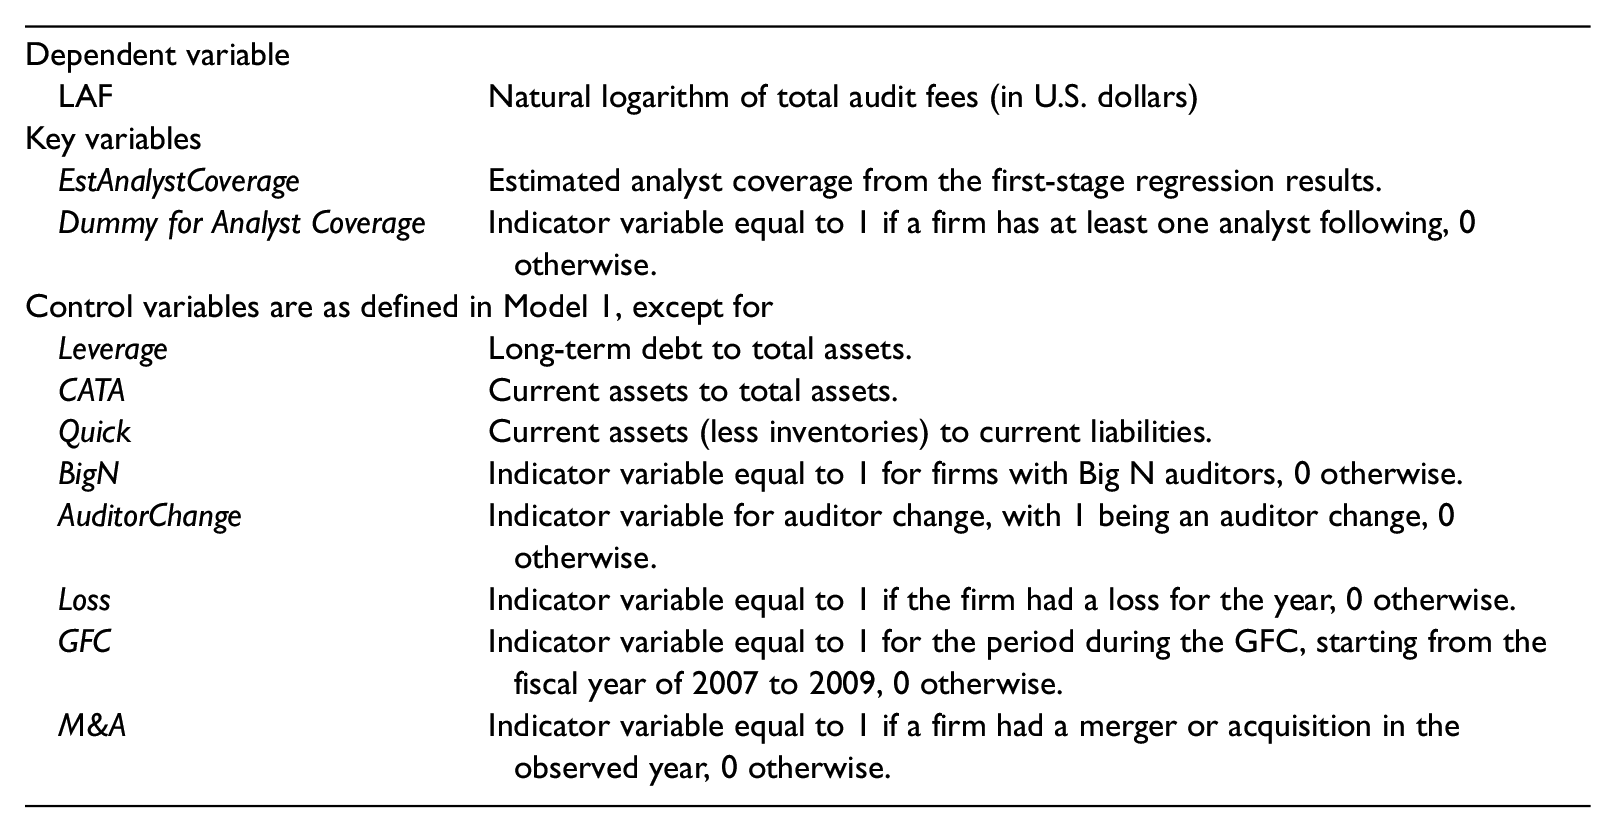
EstAnaylstCoverage is our test variable used to examine the relation between analyst coverage and audit fees. We expect EstAnalystCoverage to be significant after controlling for other factors that affect audit fees and endogeneity. To separate the initial impact of analyst coverage on audit fees from the impact of the number of analysts, we include a dummy variable for Analyst Coverage in Model 2.
Various proxies are included for audit risk known to affect both an auditor’s client acceptance decision and audit effort. These variables are the natural logarithm of total assets (Size), return on assets (ROA), the leverage of a firm (Leverage), and an indicator variable for a firm that incurs a loss in year t (Loss). As a measure of liquidity in an international setting, CATA (Current Assets per Total Assets) and the quick ratio (Quick) are used (Carson, 2009). An indicator variable for Big N auditor (BigN) is used because an auditor’s brand name might result in premium audit pricing. Following Gotti et al. (2012), we control for auditor change (AuditorChange) to control for any low-balling effect, that is, a new auditor’s incentive to set first-period audit fees below audit costs to create a long-term relationship with the client. CrossList is an indicator variable set as 1 when a company is listed on stock exchanges in more than one country and 0 otherwise. This variable is important because Bedard et al. (2010) find that auditors charge a premium due to the increased audit effort and possible liability losses caused by cross listing. We also include an indicator variable, global financial crisis (GFC), which is equal to 1 for any company that had a fiscal year end in the period 2007–2009 and 0 otherwise (Balakrishnan et al., 2016; Erkens et al., 2012). This variable is included because the GFC had an impact on auditor considerations when setting audit fees as shareholders might have a higher need for a high-quality audit and high-quality information to enhance their confidence before investing. Auditors might exert more effort to maintain high audit quality and consequently safeguard their long-term relationship with clients, prevent legal suits, and safeguard their reputation (Xu et al., 2013). A firm’s merger and acquisition activities (M&A) is included to control for a firm’s financing activities. Finally, we control for industry and year effects by adding indicator variables for industry (two-digit SIC code) and year.
We test H2 using the second-stage regression specified in Model 3. In Model 3, we add an indicator variable (IFRS) equal to 1 for the firms that adopted IFRS, and 0 otherwise, and interact this variable with EstAnalystCoverage. Many firms voluntarily adopted IFRS prior to their country’s mandatory adoption date and there are also firms that are allowed to postpone the adoption of IFRS after the mandatory adoption date. 5 If the sign of the coefficient (α4) on the interaction term between IFRS and EstAnalystCoverage is positive (negative) and significant, this indicates that the relation between analyst coverage and audit fees is stronger (weaker) for firms that used IFRS as the basis for their financial reporting systems:

where

We test H3 using the second-stage regression specified in Model 4. In Model 4, we add CountrySP, 6 the level of a country’s shareholder protection (a country-specific mechanism) is measured by ADR (a measure that ranges from 0 to 5, with higher scores corresponding to better protection), and we interact this variable with EstAnalystCoverage:

where

If the sign of the coefficient (α6) on the interaction term is significant and negative (positive), this will indicate that the positive relation between analyst coverage and audit fees is weaker (stronger) in countries that have a higher level of shareholder protection.
Empirical Results
Summary Statistics
Table 2 presents the descriptive statistics for the variables. Due to skewness, the following variables are winsorized at the 1% level: LAF, Size, CATA, Quick, Leverage, and ROA. For our sample, 70% of the sample firms were followed by at least one analyst during the studied period, whereas the average number (standard deviation) of analysts following was 7.16 (9.28) analysts per firm year. The number of unique analysts following any particular company ranges from 0 to 72 analysts throughout the sample period; 57% of the companies in our sample have a Big N auditor, and 35% of the firm-year observations occur during the GFC period. Twenty-six percent of the sample represents firms are from the firms that adopted IFRS. In the non-U.S. sample, 35% of our observations that adopted IFRS. The average ADR score (CountrySP) of our sample is high at 4.33.
Descriptive Statistics.
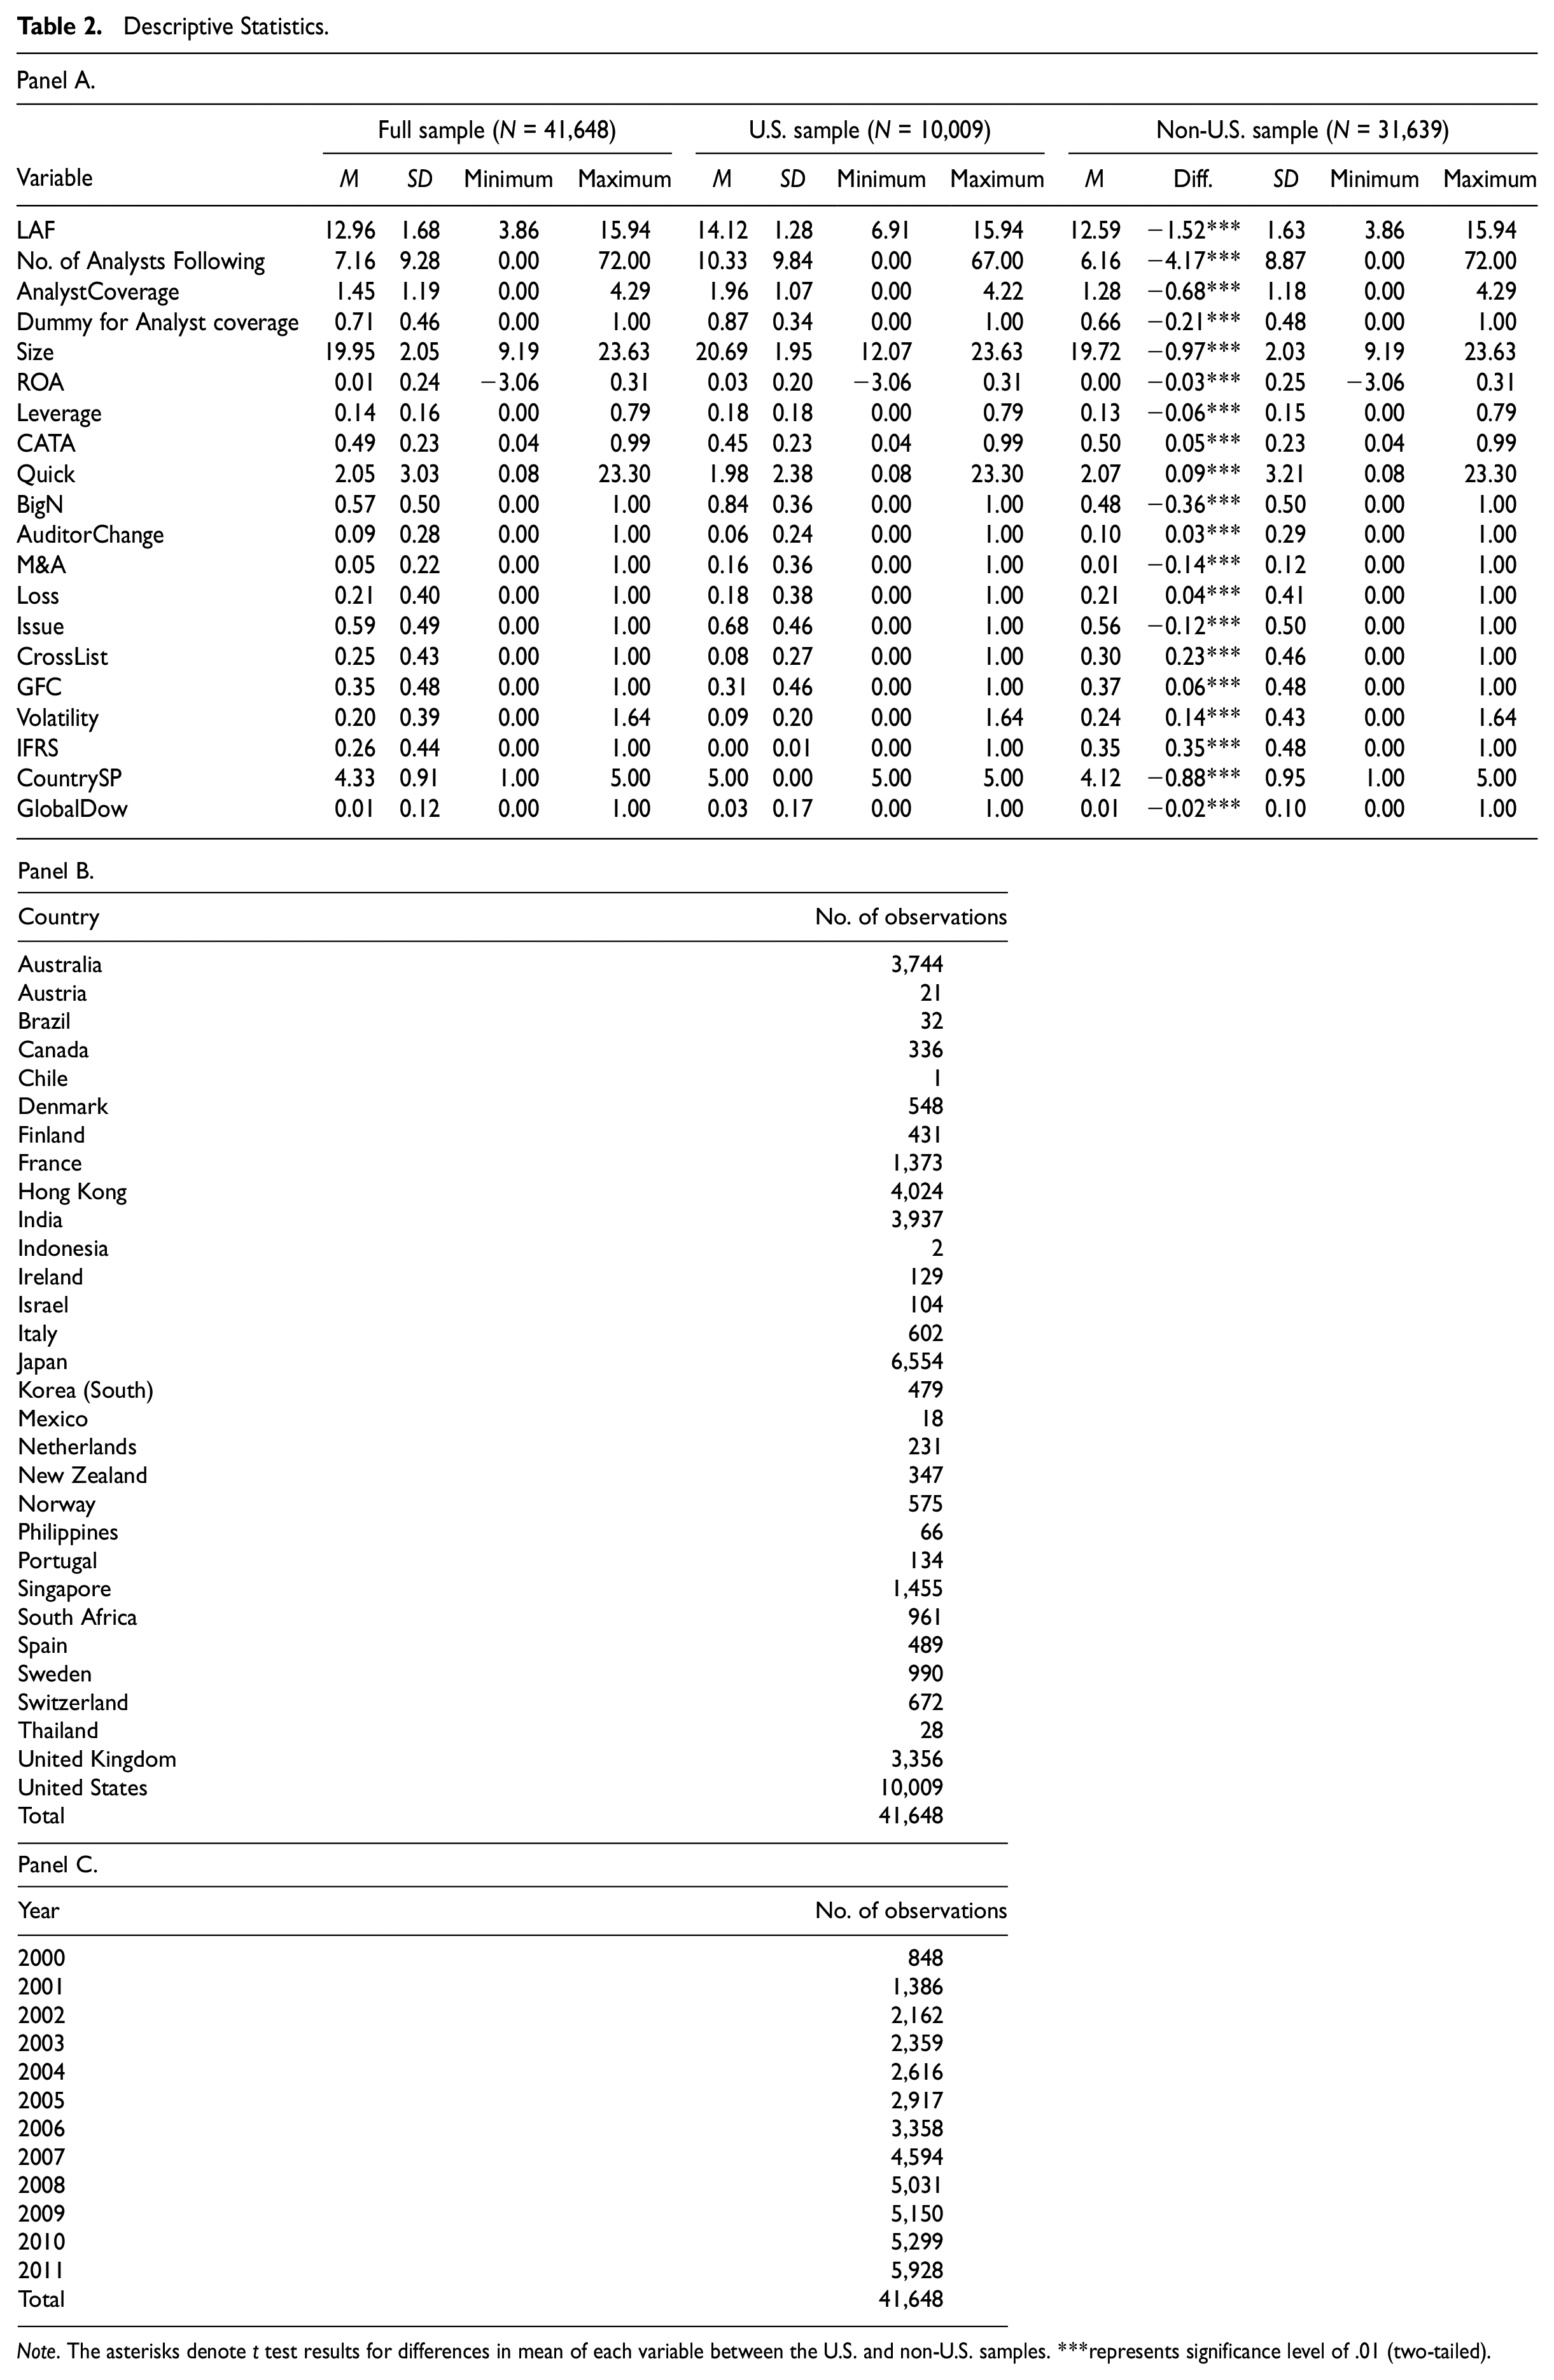
Note. The asterisks denote t test results for differences in mean of each variable between the U.S. and non-U.S. samples. ***represents significance level of .01 (two-tailed).
In Panel A in Table 2, the sample is divided into U.S. and non-U.S. firms for the additional analysis to show the composition of the sample. Panel A shows that, on average, firms in the U.S. sample are larger and have higher audit fees than firms in the non-U.S. sample. Also, on average, the U.S. sample has significantly greater analyst coverage. Panel B shows the number of firm-year observations per country. Panel C presents the distribution of the final sample by year.
Untabulated bivariate correlations indicate significant positive correlations between audit fees, analyst coverage, and firm size. Other correlations are generally low, which suggests that multicollinearity is not an issue in this setting.
First-Stage Regression Results Used to Estimate Analyst Coverage
Table 3 presents the test results for the first-stage regression model used to predict analyst coverage using an OLS regression. It shows that analyst coverage is positively associated with Size, CrossList, and GlobalDow and negatively associated with ROA, Issue, and Volatility. 7 All variance inflation factors are below 5.0, which is below the commonly used cut-off point of 10.0 for multicollinearity (Belsey et al., 1980). The estimated analyst coverage variable (EstAnalystCoverage) used in our second-stage regressions is calculated from the first-stage regression results.
First-Stage Regression Results: AnalystCoveraget = α0+α1Sizet+α2ROAt+α3Issuet+α4CrossListt+α5Volatilityt+α6GlobalDowt+ Industry fixed effects + Year fixed effects + u t (1).
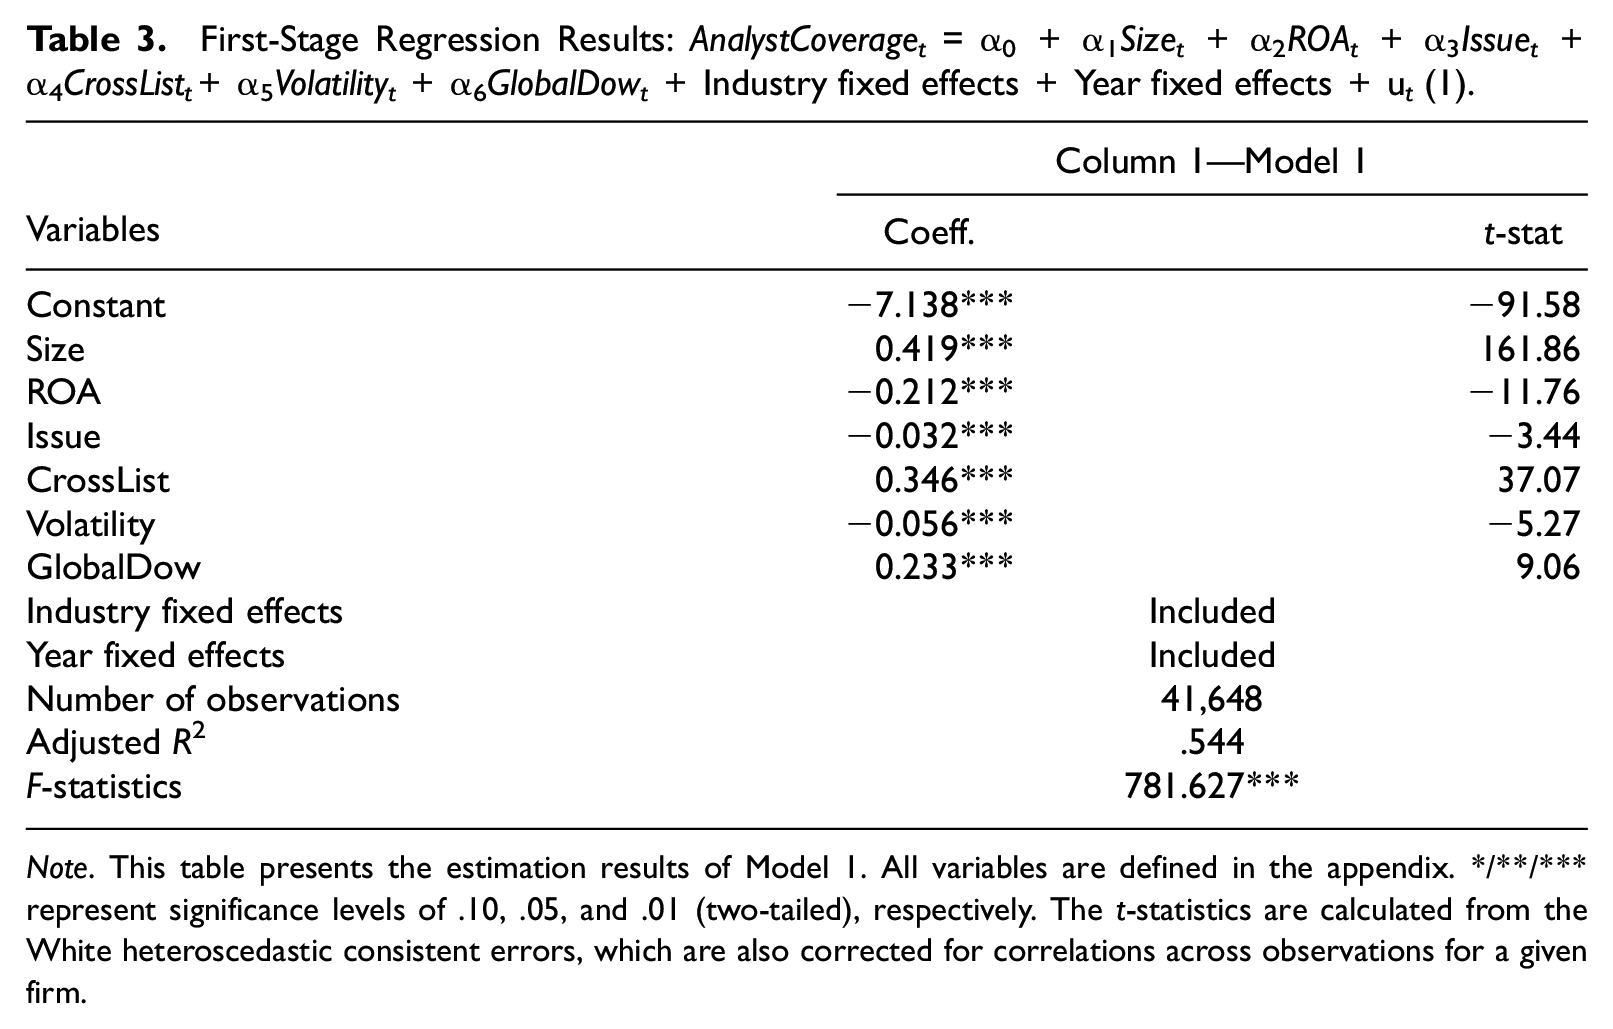
Note. This table presents the estimation results of Model 1. All variables are defined in the appendix. */**/*** represent significance levels of .10, .05, and .01 (two-tailed), respectively. The t-statistics are calculated from the White heteroscedastic consistent errors, which are also corrected for correlations across observations for a given firm.
Test of H1
The audit fee regression results are reported in Table 4. In the initial test of H1, the audit fee regression is run using EstAnalystCoverage as the variable of interest. The first column in Table 4 shows OLS regression using actual analyst coverage rather than the estimated analyst coverage from the first-stage regression results. AnalystCoverage has a positive and significant coefficient (0.212, t value 8 = 30.07). Our models using EstAnalystCoverage from the 2SLS are reported in the second and third columns in Table 4. Column 2 is the same as Column 3 except that it excludes the indicator variable for analyst coverage (Dummy for Analyst Coverage) to compare the coefficients on AnalystCoverage and EstAnalystCoverage. The 2SLS results for both models reported in Columns 2 and 3 in Table 4 demonstrate a consistently high explanatory power, with adjusted R2s of 63% to 64%. The goodness-of-fit test indicated by the Wald chi-square statistic shows a good fit for all the models.
Second-Stage Regression Results: Analyst Coverage and Audit Fees.

Note. Columns 1 and 2 present the OLS and 2SLS regression estimation results for basic model. Column 3 presents the 2SLS regression results for Model 2. All variables are defined in the appendix. */**/*** represent significance levels of .10, .05, and .01 (two-tailed), respectively. The t-statistics (z-statistics) are calculated from the White heteroscedastic consistent errors, which are also corrected for correlations across observations for a given firm.
The results reported in Column 2 indicate the coefficient of EstAnalystCoverage is 0.588 and significant (z-stat = 27.9). 9 This suggests that analyst coverage is positively associated with audit fees after controlling for other factors found to be significantly associated with audit fees in prior research. Based on the results in Panel A of Table 2 and Model 2 of Table 4, a one standard deviation increase in AnalystCoverage leads to an increase of 0.70 (0.588 × 1.19) in LAF. This is equivalent to 5.4% of the mean value of LAF (12.96), which is economically significant. Our results support the analyst pressure and litigation risk arguments, but they are contrary to Gotti et al. (2012), who find a negative relation between analyst coverage and audit fees. There are several possible reasons as to why we obtain different results: (a) we include non-U.S. firms and firms with no analyst coverage in our sample; (b) we use a sample period that includes the GFC; and (c) we control for endogeneity using a 2SLS approach. We explore possible reasons for our different results later in the article in “Reconciling Our Results With Gotti et al. (2012)” section.
In Column 3 in Table 4, we report the regression results with both estimated analyst coverage and an indicator variable for analyst following in the model. These results show a positive and significant coefficient (0.489, z-stat = 17.2) on EstAnalystCoverage and a negative and significant coefficient (−0.273, z-stat = −6.28) on Dummy for Analyst Coverage. This result suggests that the initial impact of analyst coverage on audit fees is negative, and the marginal impact on the number of analysts is positive. This provides a more comprehensive picture of the relation between analyst coverage and audit fees. This suggests that when a firm’s status changes from no coverage to having some coverage, this leads to a lower audit fee, which is consistent with the analyst monitoring argument. However, if a firm has some analyst following, the firm’s visibility might improve substantially and auditors might perceive this as a significant change in litigation and reputation risk, which is consistent with the analyst pressure and litigation risk arguments.
Tests of H2 and H3
Recall that H2 predicts a significant interaction effect between IFRS adoption and analyst coverage. We test H2 using the second-stage regression results estimated from Model 3 and they are reported in Table 5. In Column 1 of Table 5, the audit fee model includes the IFRS adoption indicator variable (IFRS), the control variables, and the interaction term between IFRS and EstAnalystCoverage. The coefficient of EstAnalystCoverage is 0.514 and significant (z-stat = 17.89), and the coefficient of IFRS is 0.436 and significant (z-stat = 20.2). This is consistent with previous studies that find a positive relation between IFRS adoption and audit fees (Kim et al., 2012). Furthermore, the coefficient of the interaction term (IFRS×EstAnalystCoverage) is −0.153 and significant (z-stat = −12.14), which suggests that the positive effect of analyst coverage on audit fees is weaker for firms that adopt IFRS.
Second-Stage Regression Results: Effects of Interaction Between IFRS Adoption and Analyst Coverage, and Interaction Between Country-Level Shareholder Protection and Analyst Coverage on Audit Fees.
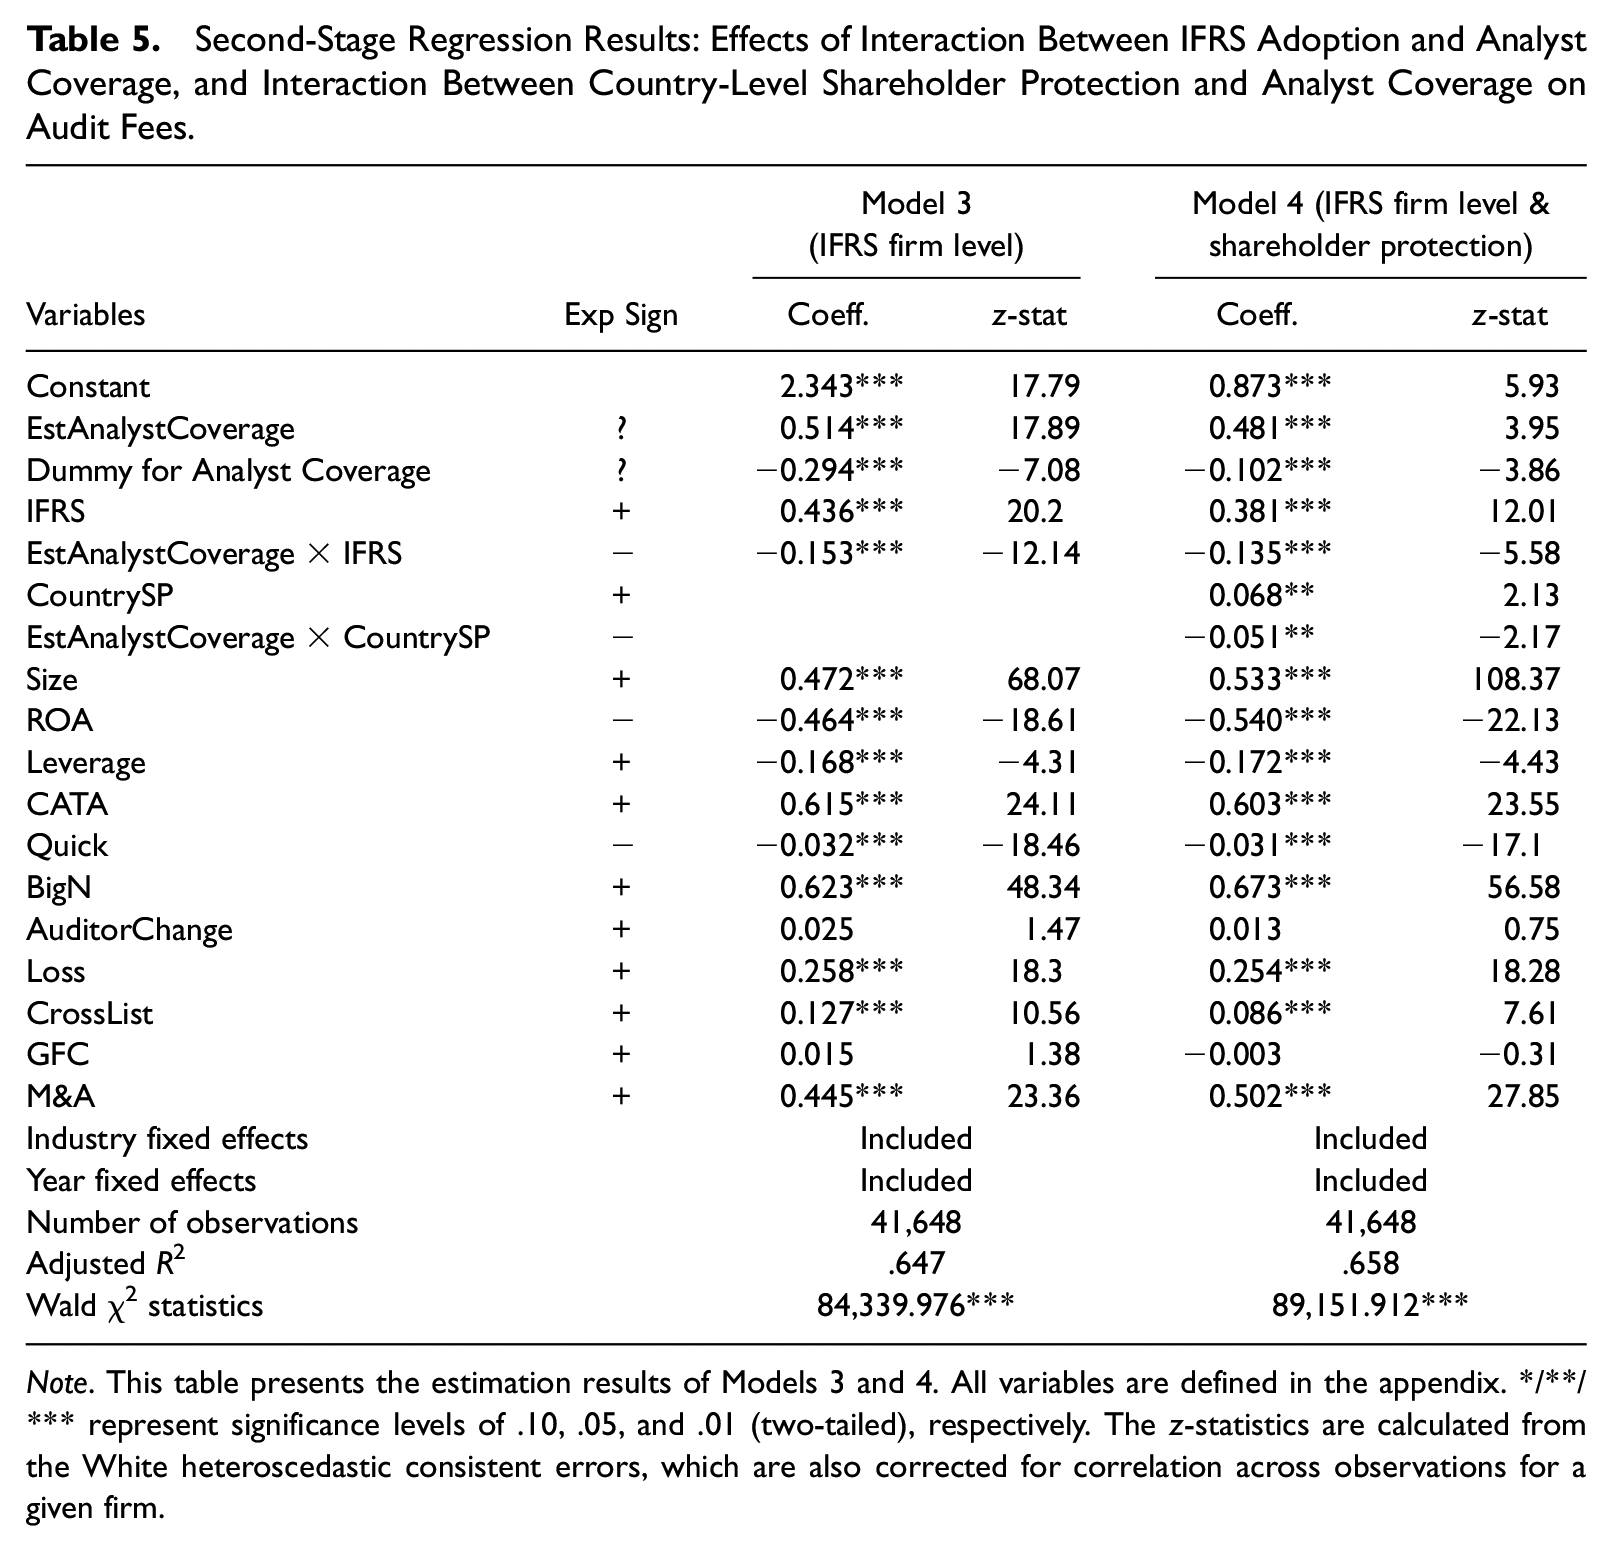
Note. This table presents the estimation results of Models 3 and 4. All variables are defined in the appendix. */**/*** represent significance levels of .10, .05, and .01 (two-tailed), respectively. The z-statistics are calculated from the White heteroscedastic consistent errors, which are also corrected for correlation across observations for a given firm.
We also use the country-level mandatory IFRS adoption year by coding the year of adoption of IFRS and all subsequent years as 1 and the years before adopting IFRS coded as 0 based on each firms’ fiscal year. We find that the results (untabulated) are qualitatively similar. 10
We point out that H3 predicts a significant interaction effect between a country’s level of shareholder protection and analyst coverage. We test H3 using the second-stage regression results estimated from Model 4, which are reported in Column 2 of Table 5. In Column 2 of Table 5, the audit fee model includes country shareholder protection level (CountrySP), the control variables, and the interaction variable (EstAnalyst Coverage×CountrySP). The coefficient of EstAnalystCoverage is 0.481 and significant (z-stat = 3.95), and the coefficient of CountrySP is 0.068 and significant (z-stat = 2.13). The coefficient of the interaction term between EstAnalystCoverage and CountrySP is −0.051 and significant (z-stat = −2.17), indicating that the positive association between analyst coverage and audit fees is weaker when the level of shareholder protection is greater. The findings are consistent with those found when analyzing the impact of IFRS adoption.
Additional Analyses
Using Data From Audit Analytics
For our main results, we obtained audit fee data from Worldscope, which has the potential problem of including nonaudit fees paid to auditors (see Kim et al., 2012). Therefore, we also obtained audit fee data from Audit Analytics for international evidence for the years 2000–2011. Audit Analytics provides audit fee data for SEC registrants 11 so this sample of foreign companies is restricted to SEC registrants. As there are some non-U.S. registrants without their equity instruments listed on a U.S. exchange, comparing non-U.S. and U.S. companies within this group could capture the country-level characteristics. However, U.S. firms make up 88.6% of the sample so that U.S. firms may be overweighted in this sample.
For the same sample period of 2000–2011, we find that auditors charge higher fees for firms with greater analyst coverage and this is consistent with our main findings. We also find that the positive impact of analyst coverage on audit fees is weaker for countries that adopt IFRS and for countries with higher levels of shareholder protection. This suggests that our main findings are robust.
Reconciling Our Results With Gotti et al. (2012)
Using data from the pre-GFC period (2000–2007), Gotti et al. (2012) report a negative relation between analyst coverage and audit fees using a sample of firms that have at least one analyst following the firm. Unlike our study, their study excludes firms that do not have an analyst following the firm. Their findings differ from our primary results. The environment for the sample of firms covered by analysts differs compared with the environment for the sample in our primary analysis. In our primary analysis, all firms, regardless of whether they are followed by an analyst or not, are included in the analysis. In discussing our main results, we suggested that our results might be different from those of Gotti et al. (2012) because of our inclusion of firms without any analyst coverage and the inclusion of non-U.S. firms, or because we use data outside the pre-GFC period, and/or because we control for endogeneity. We explore these reasons further using the results reported in Table 6.
Reconciling Our Results With Gotti et al. (2012)—A Sample With at Least One Analyst Following.
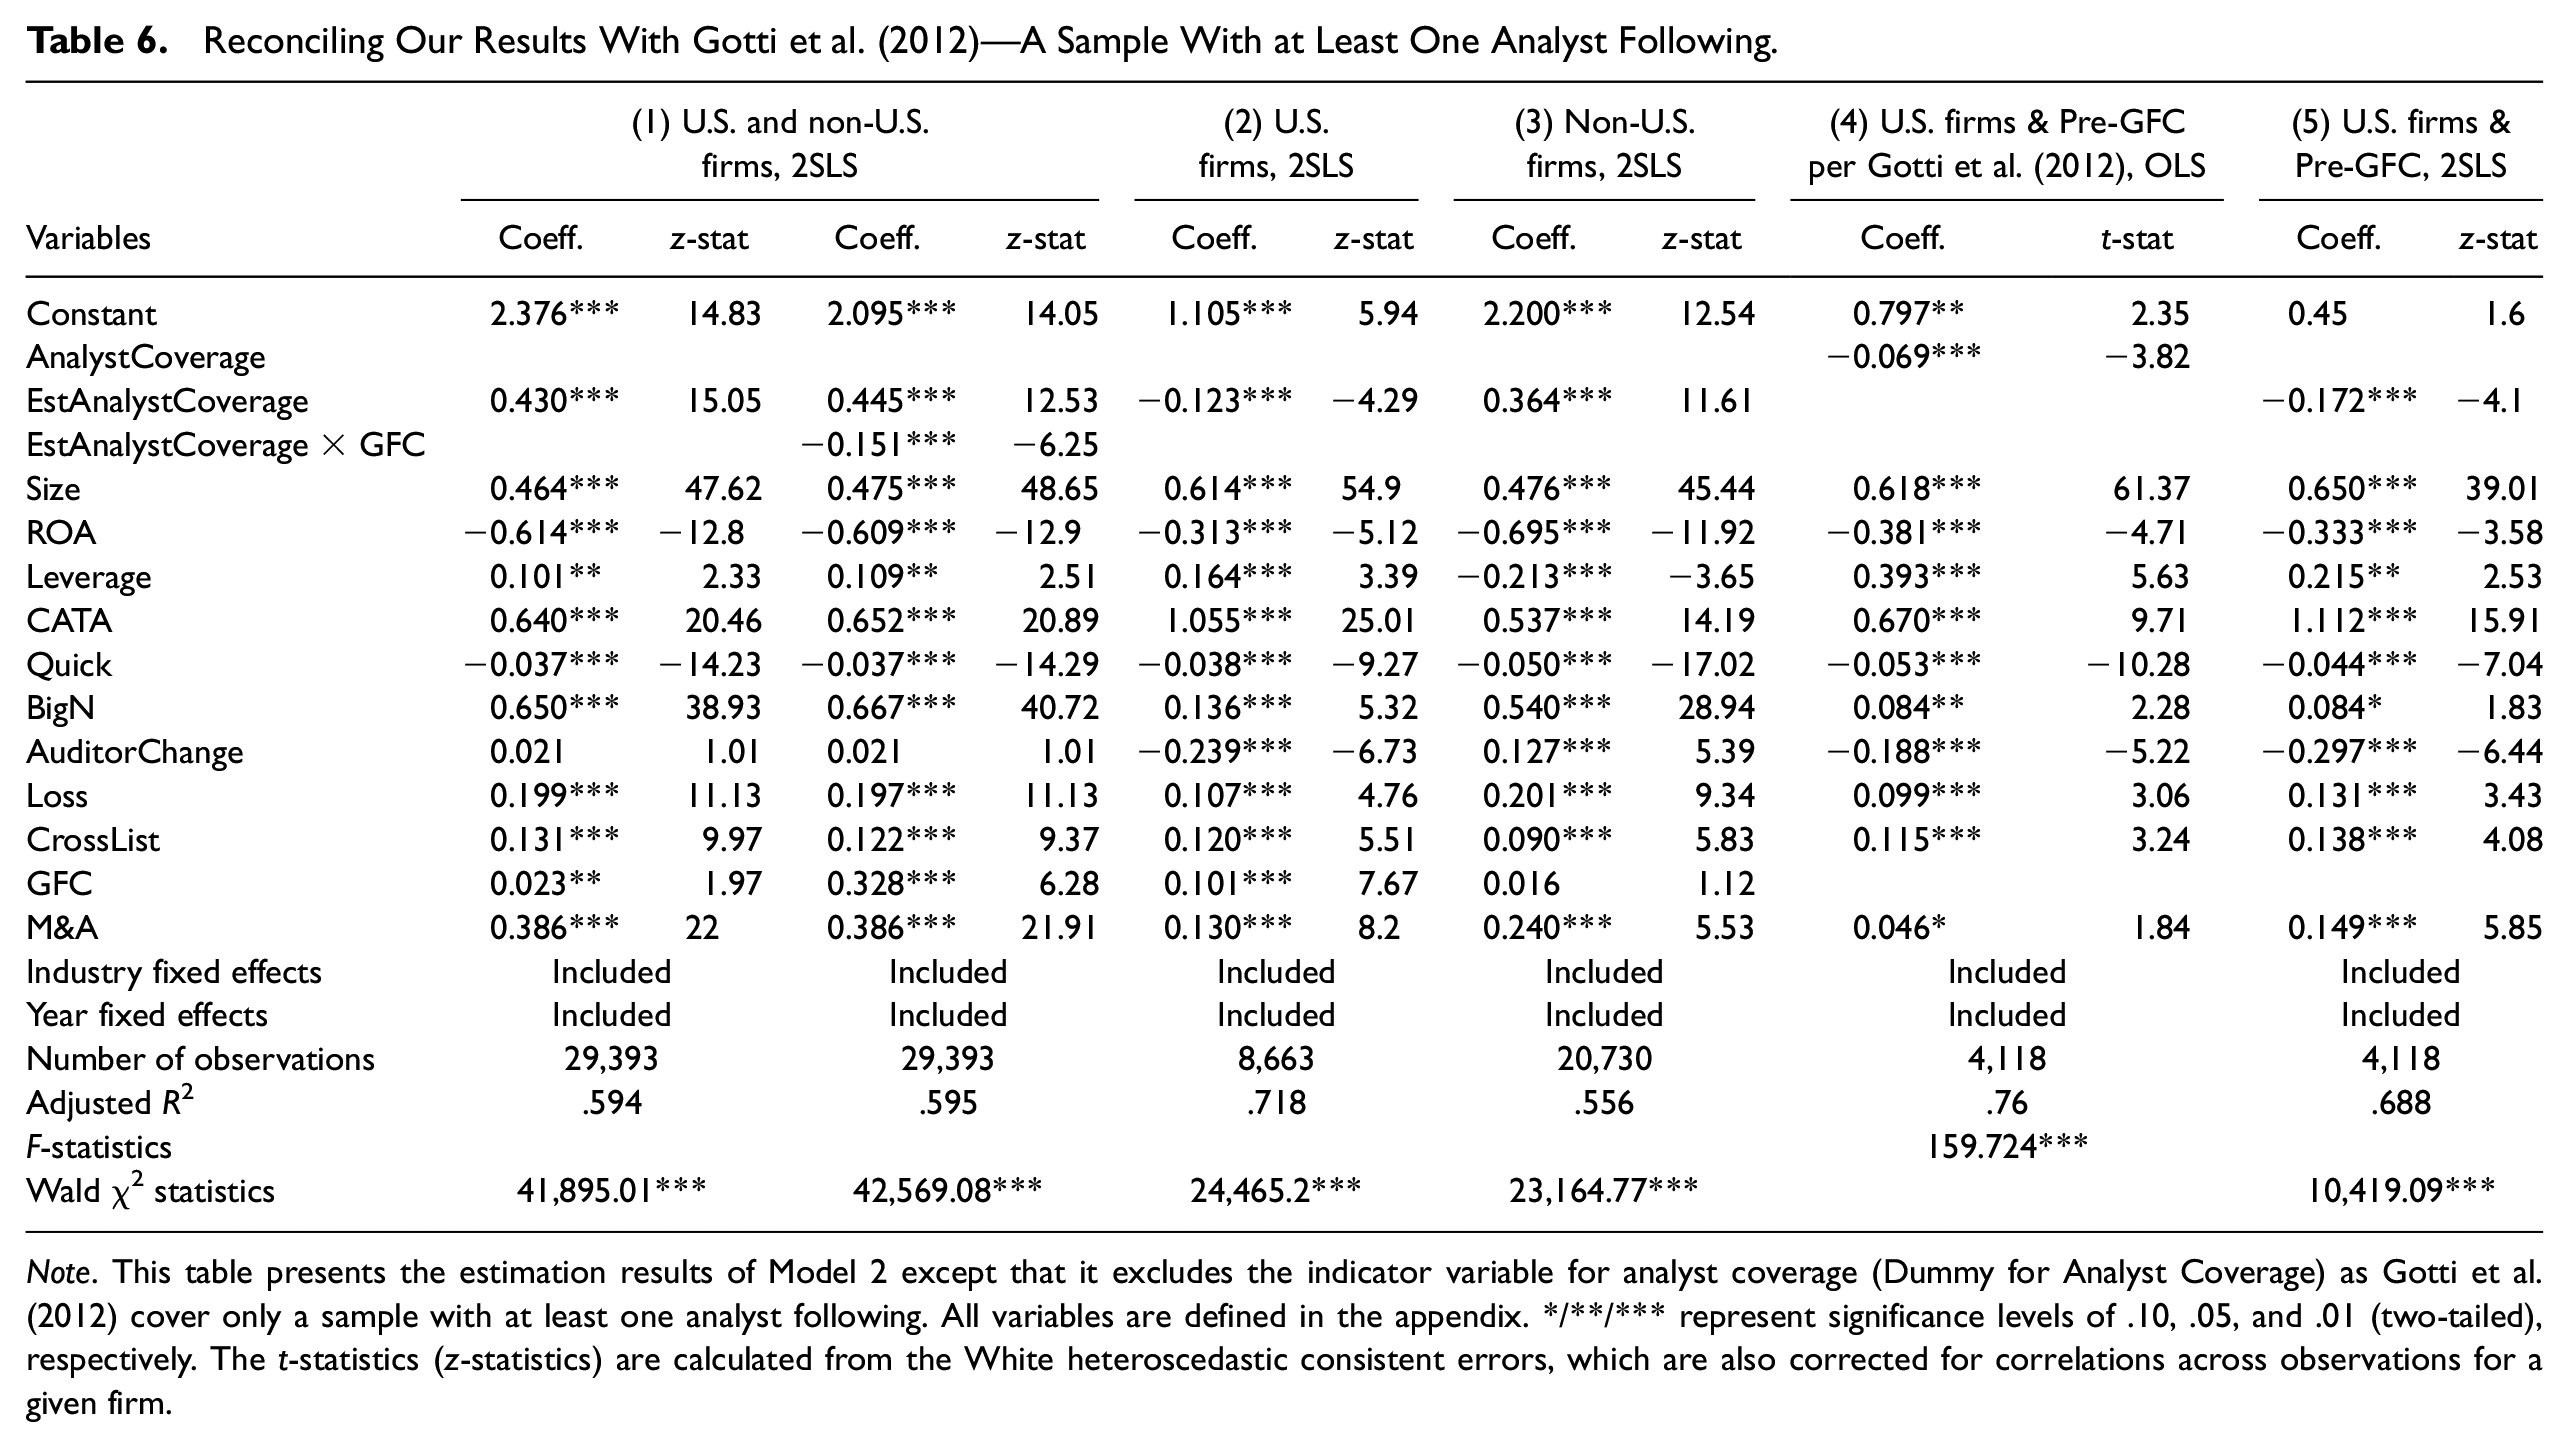
Note. This table presents the estimation results of Model 2 except that it excludes the indicator variable for analyst coverage (Dummy for Analyst Coverage) as Gotti et al. (2012) cover only a sample with at least one analyst following. All variables are defined in the appendix. */**/*** represent significance levels of .10, .05, and .01 (two-tailed), respectively. The t-statistics (z-statistics) are calculated from the White heteroscedastic consistent errors, which are also corrected for correlations across observations for a given firm.
Table 6 presents the regression results using a sample of firms followed with at least one analyst following. Column 1 of Table 6 reports the second-stage regression results on audit fees for the sample of both U.S. and non-U.S. firms with at least one analyst following. The coefficient of EstAnalystCoverage is 0.430 and significant (z-stat = 15.05), which indicates that, after controlling for other factors that affect audit fees, analyst coverage has a positive relation with audit fees for the sample of firms followed by at least one analyst. This is contrary to the results reported by Gotti et al. (2012). In Column 1 of Table 6, we find that, given the positive and significant coefficient on GFC in the regression of audit fees, audit fees increased across the board after the start of the GFC. However, when the interaction variable between EstAnalystCoverage and GFC is included, the coefficient is negative and significant (coefficient = −0.151, z-stat = -6.25), which suggests that auditors view the companies with greater analyst following as less risky during the GFC period. This is consistent with the role of analysts as external monitors.
In Columns 2 and 3 of Table 6, we find that the effect for non-U.S. firms is a positive association while the effect for U.S. firms is a negative association. This suggests that non-U.S. firms are driving the result that indicates a positive association. Thus, our findings suggest that the supposed external monitoring role of analyst coverage is more meaningful in countries with weaker institutional environments. This corresponds with our results related to country-level shareholder protection in that the positive association is weaker in countries with stronger shareholder protection. 12
Column 4 of Table 6 replicates Gotti et al. (2012) by using only pre-GFC data for a sample of 4,118 U.S. only firm-year observations in a single stage OLS regression. These results replicate the findings of the negative relation between analyst coverage and audit fees reported by Gotti et al. (2012) in the pre-GFC period. This suggests the difference between our results and those of Gotti et al. (2012) could be due to either the inclusion of non-U.S. firms in our sample or controlling for endogeneity. To address this issue, we conduct two-stage regressions using data extracted only for U.S. firms with an analyst following and with data only from the pre-GFC period.
Using a two-stage regression analysis based on a sample of U.S. firms followed by at least one analyst during the pre-GFC period, Column 5 of Table 6 shows that the coefficient of EstAnalystCoverage has a negative and significant relation with audit fees, which is consistent with the results reported by Gotti et al. (2012).
Overall, the results reported in Table 6 suggest that the main difference in our results compared with Gotti et al. (2012) is the inclusion of non-U.S. firms.
Other Robustness Tests
Impact of firm size
Smaller companies are more likely to experience increased audit effort/fees with an increase in analyst following because, for such companies, auditor skepticism may increase with greater analyst coverage. Conversely, the level of effort necessary to audit a larger company may be relatively invariant and not affected by changes such as analyst coverage. Therefore, using median Size, we divide our sample into a large firm subsample (which is larger than or equal to the median) and a small firm subsample (which is smaller than the median) and estimate the regressions. Table 7 reports these results. For both large and small firms, we find a positive and significant coefficient on EstAnalystCoverage. As expected, the coefficient (0.734) on EstAnalystCoverage for the small firm subsample is greater than the coefficient (0.496) for the large firm subsample. 13
Impact of Firm Size.
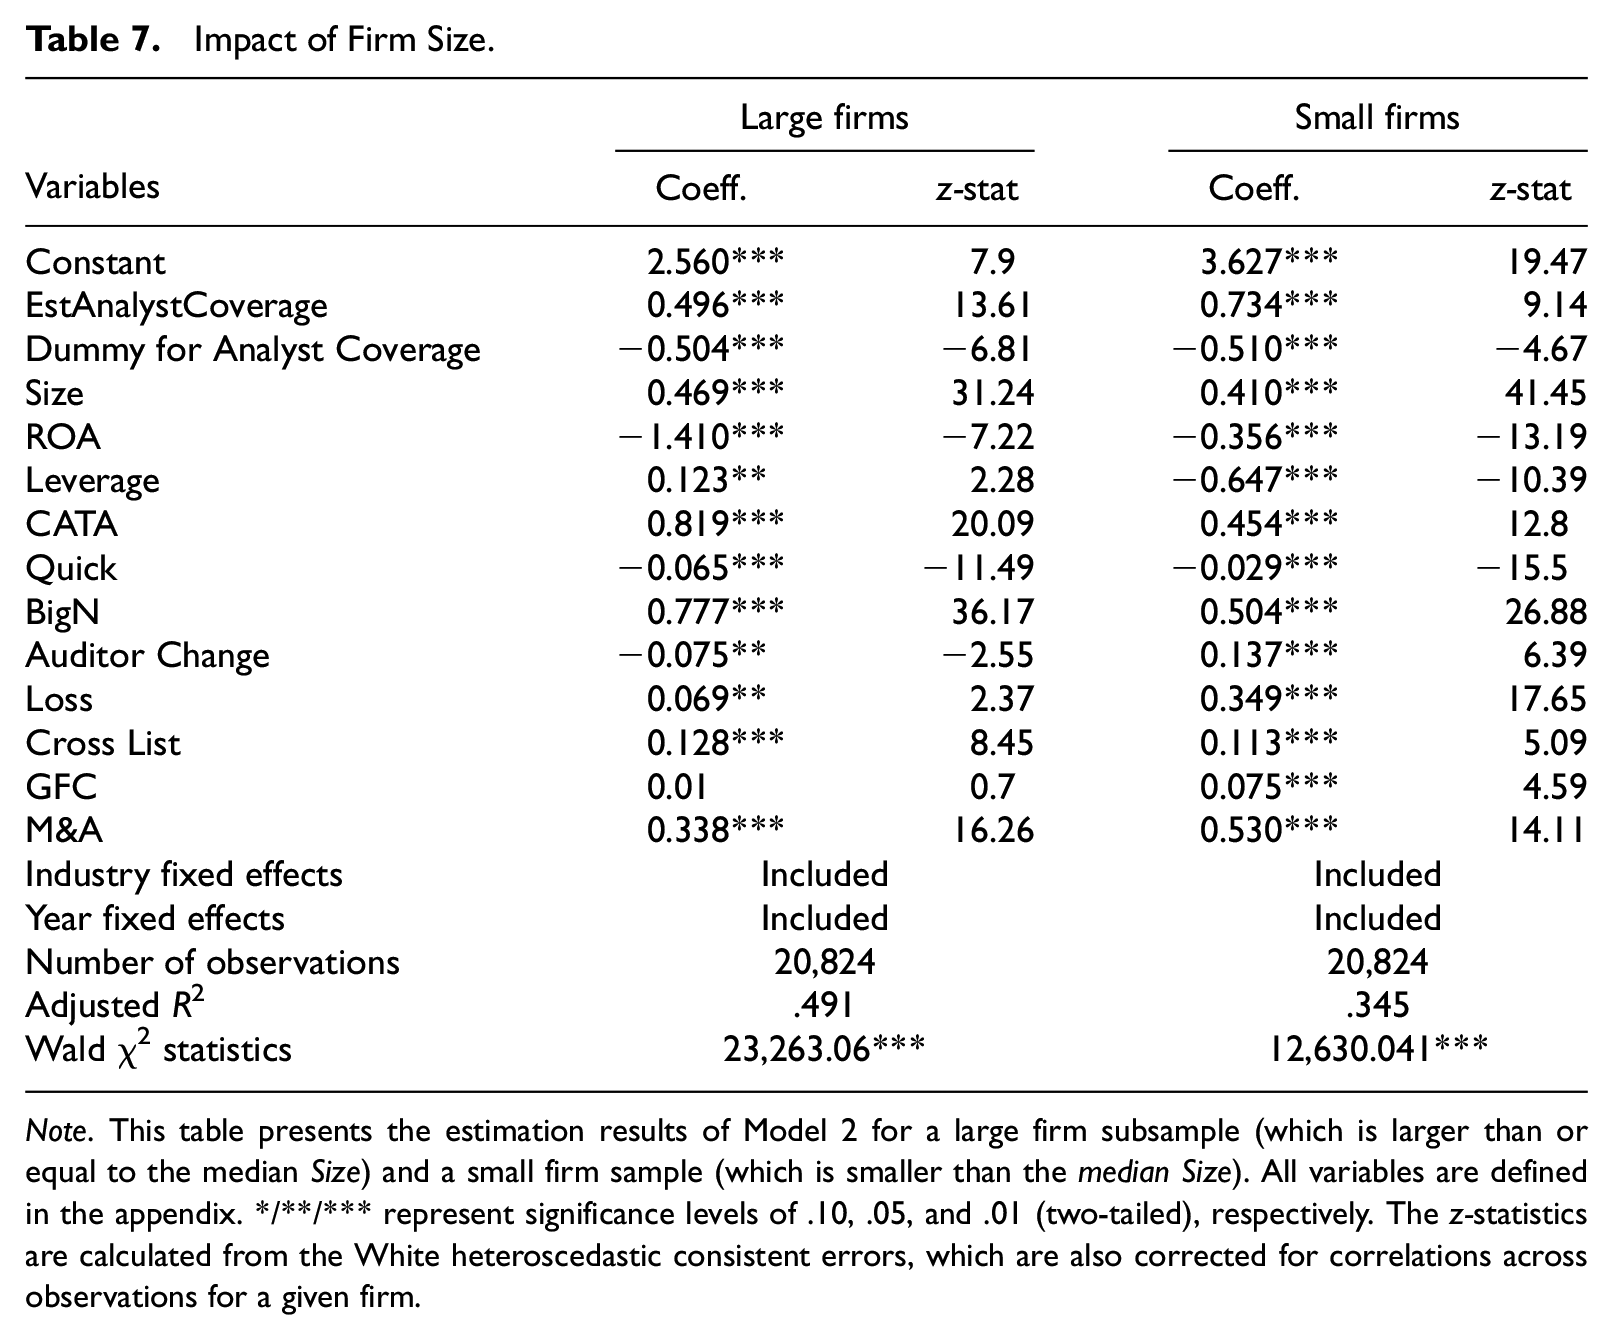
Note. This table presents the estimation results of Model 2 for a large firm subsample (which is larger than or equal to the median Size) and a small firm sample (which is smaller than the median Size). All variables are defined in the appendix. */**/*** represent significance levels of .10, .05, and .01 (two-tailed), respectively. The z-statistics are calculated from the White heteroscedastic consistent errors, which are also corrected for correlations across observations for a given firm.
Big N versus non-Big N
We test whether our results hold for Big N clients, which tend to be larger and require audits of greater complexity. We conduct additional analyses for subsamples of Big N audit clients and non-Big N audit clients. Untabulated results reveal a positive and significant coefficient on EstAnalystCoverage for both Big N clients (coefficient = 0.465, z-stat = 14.1) and non-Big N clients (coefficient = 0.150, z-stat = 2.86), which supports our argument relating to Big N audit clients.
Subsample test for companies where analyst coverage increased over time
We identify companies where analyst coverage increases/decrease/does not change 14 over time and estimate the 2SLS regressions separately for each subsample. Untabulated results show a positive and significant relation between analyst coverage and audit fees (coefficient = 0.699, z-stat= 18.7) only in the subsample with an increase in the number of analysts following a firm, which suggests that the companies with increasing analyst coverage are small. We find that the Size of the companies with increasing analyst coverage (18.76) is smaller than the companies with decreasing (20.42) and no change in analyst coverage (19.94). We also use the change regression for OLS and 2SLS regressions and find a significant and positive coefficient (0.004, z-stat = 3.12 for OLS; 0.047, z-stat = 3.25 for 2SLS) on ΔAnalyst Coverage (or ΔEstAnalystCoverage) in the regression of ΔLAF, which is consistent with our main findings.
Alterative model specifications by dropping observations for GFC = 1 or Auditor Change = 1
Instead of including the GFC variable in the model specifications, we delete observations from the turbulent GFC period (2007–2009 period or 2008 and 2009) and find that the inferences for H1, H2, and H3 continue to hold. In the same way, we delete auditor change observations by deleting observations for the Auditor Change variable being 1 in the model specifications, given that the initial year audit fee data have some unique issues. We find that the inferences continue to hold.
Alterative measures of shareholder protection
We also measure a country’s level of shareholder protection as an indicator variable (with a score equal to or more than 4 classified as high and less than 4 classified as low), following LaPorta et al. (1998). The results are consistent with the results of H3.
Conclusion
We investigate whether there is a significant association between analyst coverage and audit fees in an international setting. Specifically, we examine the effects of analyst coverage on audit fees and how the adoption of IFRS and level of shareholder protection at the country level interact with the relation between analyst coverage and audit fees.
Using two-stage regressions with 41,648 firm-year observations from 30 countries during the period from 2000 to 2011, we find consistent evidence that analyst coverage is positively associated with audit fees. This finding supports our analyst pressure and litigation risk arguments for a positive relation between analyst coverage and audit fees. We also find that the positive relation between analyst following and audit fees is moderated by the level of shareholder protection in a country and when IFRS are adopted. The positive impact of analyst coverage on audit fees is weaker for firms that adopt IFRS and for countries with higher levels of shareholder protection. This suggests that analyst coverage and the country-level information environment are substitutes in terms of audit pricing. Our findings are robust to a battery of additional analyses, including the use of audit fee data from Audit Analytics, a subsample test of Big N audit clients, non-U.S. firms, firm size, and analyst coverage changes.
Footnotes
Appendix
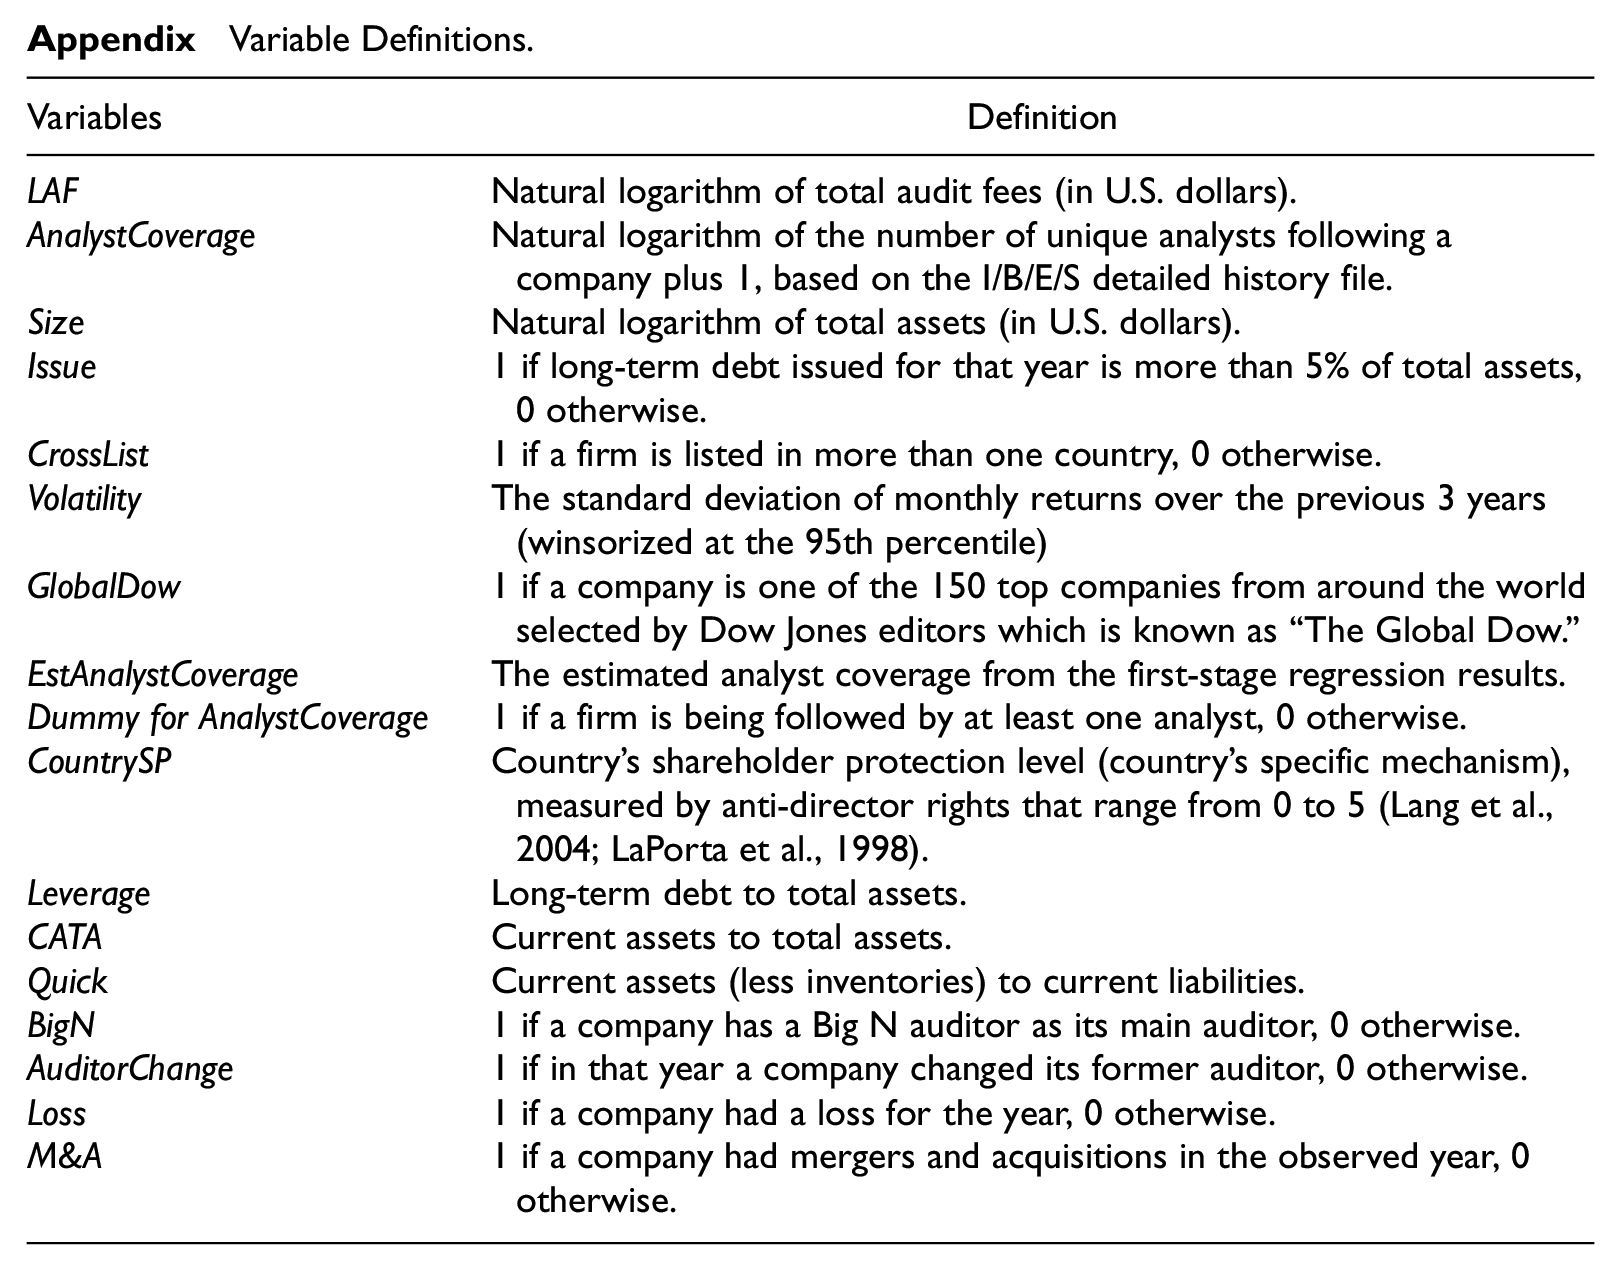
Variable Definitions.
| Variables | Definition |
|---|---|
| LAF | Natural logarithm of total audit fees (in U.S. dollars). |
| AnalystCoverage | Natural logarithm of the number of unique analysts following a company plus 1, based on the I/B/E/S detailed history file. |
| Size | Natural logarithm of total assets (in U.S. dollars). |
| Issue | 1 if long-term debt issued for that year is more than 5% of total assets, 0 otherwise. |
| CrossList | 1 if a firm is listed in more than one country, 0 otherwise. |
| Volatility | The standard deviation of monthly returns over the previous 3 years (winsorized at the 95th percentile) |
| GlobalDow | 1 if a company is one of the 150 top companies from around the world selected by Dow Jones editors which is known as “The Global Dow.” |
| EstAnalystCoverage | The estimated analyst coverage from the first-stage regression results. |
| Dummy for AnalystCoverage | 1 if a firm is being followed by at least one analyst, 0 otherwise. |
| CountrySP | Country’s shareholder protection level (country’s specific mechanism), measured by anti-director rights that range from 0 to 5 (Lang et al., 2004; LaPorta et al., 1998). |
| Leverage | Long-term debt to total assets. |
| CATA | Current assets to total assets. |
| Quick | Current assets (less inventories) to current liabilities. |
| BigN | 1 if a company has a Big N auditor as its main auditor, 0 otherwise. |
| AuditorChange | 1 if in that year a company changed its former auditor, 0 otherwise. |
| Loss | 1 if a company had a loss for the year, 0 otherwise. |
| M&A | 1 if a company had mergers and acquisitions in the observed year, 0 otherwise. |
Acknowledgements
We thank Bharat Sarath (the editor), Kannan Raghunandan (the associate editor), an anonymous reviewer, Sutrisno Suwardi, Michele Henney, Wen He, and Dianne Massoudi and workshop participants at UNSW Sydney, the 2012 Accounting and Finance Association of Australia, and New Zealand annual conference and 2013 American Accounting Association Annual conference.
Declaration of Conflicting Interests
The author(s) declared no potential conflicts of interest with respect to the research, authorship, and/or publication of this article.
Funding
The author(s) received no financial support for the research, authorship, and/or publication of this article.