



Abstract
CEO compensation in Canada is significantly lower than that in the United States. In this article, we examine the choice of, and impact on Canadian CEO Compensation, using U.S. firms in their compensation peer groups. Using a two-stage model to control for endogeneity, while we find the choice of peers associated with labor market factors, we still find that the use of U.S. peers positively associated with higher Canadian CEO compensation. This finding is after controlling for the traditional determinants of CEO compensation, as well as use of domestic peers. While this result holds for all components of the compensation package, we also find that having U.S. peers is associated with a greater proportion of equity in the compensation package. Our results are robust to various formulations including change models and using an earlier time period when peer disclosure was voluntary.
Introduction
In this article, we examine whether the use of U.S. firms in their compensation peer groups affects the amount and form of compensation paid to Canadian CEOs, a heretofore unexamined area. 1 Historically, Canadian CEOs have been “paid substantially lower than their U.S. counterparts” (Zhou, 1999). 2 For example, Towers Perrin (2006) find that Canadian CEOs earned approximately half of what their U.S. counterparts made: $1,068,964 versus $2,164,952; while Fernandes et al. (2013) find that a CEO of a hypothetical U.S. firm reporting $1 billion in sales would earn annual total compensation of $2.7 million in 2006 compared to approximately $1.8 million for a Canadian CEO. 3 This difference exists despite Canada and the United States sharing a common language and having similar customs, corporate governance regimes, management education institutions, and a long border with significant free trade in goods and services.
In the absence of labor mobility restrictions, it is reasonable to assume that the best and the brightest CEOs will gravitate across jurisdictions or borders to companies that pay the most. However, Hargreaves (2014) questions whether the global talent pool of senior executives is mobile. In Global CEO Appointments: A Very Domestic Issue (High Pay Centre, 2013), the authors point out that there were no non-American CEOs in the 142 U.S. companies included in the Fortune Global 500. Furthermore, the report asserts that CEOs moved very little even within Europe and that poaching of CEOs across (tax) jurisdictions within the Fortune Global 500 accounted for only 0.8% of CEO appointments. 4 This evidence suggests that senior executives are not mobile.
The evidence of a pay gap between U.S. and Canadian CEOs, and the absence of cross-border mobility for CEOs, provides Canadian CEOs with the incentive and opportunity to use the compensation of their U.S. peers to increase their own compensation. While prior to 2009 disclosure of peers was voluntary, beginning in January 2009, Canadian securities legislation required disclosure of benchmarks used for compensation purposes, as well as identification of the companies included in the benchmark group. 5 In this article, we use this newly disclosed information to investigate the impact of Canadian firms using U.S. firms as compensation peers on Canadian CEO pay. Given the cross-border pay gap, our expectation is that these U.S. peers pay higher compensation than the Canadian firms using them as a benchmark. Thus, the use of U.S. firms as peers could reflect opportunistic choices by Canadian firms to justify increased executive compensation.
However, the utilization of U.S. firms as compensation peers need not be opportunistic. The adoption of U.S. peers, and consequently pay practices, may simply reflect the reality that Canadian corporations are becoming increasingly North American or even global. For example, based on asset size, as of April 2016, Toronto Dominion Bank is the 31st largest bank in the world, 23rd largest among OECD countries, and fifth largest in North America. 6 Thus, the use of U.S. peers is also consistent with Canadian firms integrating into the North American labor and capital markets. 7
We use a two-stage model to control for endogeneity in the choice of peer firms. 8 In the first stage of our analyses, we look at the factors associated with a Canadian firm choosing a U.S. compensation peer. Our results show the following factors positively associated with choosing U.S. peers: being cross-listed on a U.S. exchange, having a higher percentage of U.S. firms in their SIC code, 9 being in an industry where other Canadian firms report having U.S. peers, and mentioning U.S. more often in their annual report. 10 We also find that the choice of U.S. compensation peer is inversely related to the percentage of independent directors.
In the second stage of our analysis, we examine the impact of having a U.S. peer on the compensation of Canadian CEOs after controlling for the standard determinants of CEO compensation, that is, size, profitability, risk, growth, board composition, inside and institutional ownership, and industry. We also include U.S. cross-listing following Southam and Sapp (2010), as well as the use of non-U.S. peers. We find the use of U.S. peers associated with higher CEO compensation, which is consistent with Faulkender and Yang (2010, 2013) who find that U.S. firms appear to select highly paid peers to justify their compensation. We also find that Canadian firms that select U.S. companies as peers have higher proportions of equity compensation. To the extent that these firms’ compensation packages are riskier, our results are consistent with those in Fernandes et al. (2013) and Conyon et al. (2011), both of whom document that the difference in compensation between U.S. and non-U.S. firms is in part due to the difference in riskiness of compensation, that is, the structure of compensation is riskier in the United States. However, we find that the selection of U.S. peers positively associated with all forms of Canadian CEO compensation, for example, salary as well as equity, so increased compensation risk does not fully explain our findings.
While our primary analysis focuses on Canadian firms, in additional analysis we incorporate a matched sample of U.S. firms. We continue to find the use of U.S. peers associated with higher compensation for Canadian CEOs. While we do not find consistent evidence that Canadian CEOs using U.S. peers receive compensation commensurate with their U.S. counterparts, we do find at a minimum, Canadian CEOs using U.S. peers narrow the gap.
The remainder of the article is organized as follows. Section “Literature Review and Hypotheses Development” presents a brief literature review and motivates our hypotheses. Section “Data and Models” describes our data. The empirical evidence is presented in the “Results and Discussion” section and we conclude in the “Conclusion” section.
Literature Review and Hypotheses Development
Influence of Peer Groups on Executive Compensation
In much of the literature, managers are assumed to be risk averse and under-diversified, whereas shareholders are risk neutral and diversified (Gibbons & Murphy, 1990; Holmström, 1979). Evaluating managers’ performance relative to peers can increase the efficiency of incentives by filtering out factors outside of the managers’ control. This is echoed by Holmström and Kaplan (2003) who argue that benchmarking represents an efficient way to determine managers’ reservation wage and therefore an important input in determining compensation levels. In contrast, Elson and Ferrere (2013) argue against benchmarking to the external market. They claim that successful CEOs have a vast accumulation of firm-specific skills as opposed to generic skills, and therefore, benchmarking to peers outside the narrow industry or even outside the firm may be inefficient.
Implementing relative performance evaluation may be problematic if managers can strategically select the benchmark against which they are evaluated (Gibbons & Murphy, 1990). Bizjak et al. (2008) find that firms tend to select peers that are aligned along multiple dimensions such as correlated stock returns in addition to obvious features such as size. They acknowledge that benchmarking “can lead to increases in executive pay not tied to firm performance” if managers strategically select peer groups to bias compensation upward, but that benchmarking could also be explained by the board’s desire to adjust pay upward for retention purposes. Consistent with retention, Gao et al. (2015) find that firms raise the pay of their remaining executives after losing an executive to a competitor, thereby mitigating the “deficiency in executive compensation relative to its industry peer firms.”Albuquerque et al. (2013) and Cadman and Carter (2014) also argue that labor market explanations justify peer group selection. Furthermore, Albuquerque et al. (2013) argue that the positive “peer-pay-effect” could reflect both higher CEO talent and opportunistic behavior, finding some support for each.
A problem with the retention argument is that it could justify the choice of almost any peer group as executives may take positions with firms in different industries and of different sizes. Morgenson (2006) observes that peer groups are “populated with companies that are anything but comparable.”Faulkender and Yang (2010) find that “the median compensation of the peer group generates significant incremental explanatory power” in explaining executive compensation, finding that even peers outside the firm’s industry and size group have a significant upward influence on executive compensation. 11 Bizjak et al. (2011) find that compensation peer groups contain firms that are generally in the same industry, and are similar in size and scope, reflecting commonalities related to the labor market. However, they find that firms appear to exercise significant discretion in choosing peer firms, with larger firms and firms with higher CEO pay more likely to be selected as benchmarks. 12 Their evidence suggests that “selected peers are chosen in a manner that biases compensation upward.”Faulkender and Yang (2013) document that peer benchmarking manipulation became more severe after enhanced mandatory disclosure. Pittinsky and DiPrete (2013) document that when firms go outside their size/industry peer population, they tend to choose peers larger and better paid than themselves.
Bizjak et al. (2017) compare firms that use a narrow custom peer group versus those that use a broad market index for benchmarking and find that only the latter results in higher compensation. They also find that CEO rent extraction is mitigated by the overlap of peers used for relative performance evaluation and peers used for compensation benchmarking. Shin (2017) shows that one-sided peer choices (as opposed to mutual selection of each other as peers) are more likely to be associated with rent extraction.
Drake and Martin (2017) hypothesize and find that compensation committees choose compensation peers that share the same life cycle stage, even when those peers are outside their industry. The authors also find that firms alter their peer groups to look outside of their industry when industry peers provide noisy information on systematic risk and look outside their life cycle stage when these peers less fully reflect common shocks.
In summary, the above papers offer (a) some evidence of opportunistic behavior by management to justify their compensation levels and (b) some evidence of labor market explanations for the choice of peer groups. The studies differ on the magnitude of (a) relative to (b).
Hypotheses Development
While the influence of compensation peer groups has been well-studied for U.S. firms, to our knowledge this is the first study to examine similar influence on Canadian firms, which have been required to disclose their compensation peer groups since 2009. 13 To the extent Canadian and U.S. firms share a common market for executive talent and similar corporate governance and disclosure regimes, it is conceivable that Canadian firms may also select U.S. firms as compensation peers. The relatively smaller size of Canadian firms (relative to U.S. firms) may increase the incentive and the opportunity for Canadian firms to strategically select higher paying U.S. peers. As there are also relatively few large firms in Canada (Leung & Rispoli, 2011), even in the absence of opportunism, large Canadian firms may look to the United States for suitable compensation peers.
While the literature suggests that peer firms are, on average, larger, better performing, and have more highly paid executives, the result cannot hold for all firms. That is, the largest, most successful firms are unable to pick larger, more successful peers. So while Bizjak et al. (2011) report that the median peer of all firms is approximately 18% larger with 7% higher compensation than the focal firm, within the S&P 500 the median peer was actually 7.5% smaller with 9.3% lower executive compensation. For non-S&P 500 firms, the median peer was 19% larger and total pay was 11% higher than the focal firm. Canadian firms are more likely to behave like non-S&P 500 firms due to their relatively smaller size and the traditionally lower level of CEO compensation in Canadian firms.
Assuming the objective of picking larger, more highly compensated peers, is to increase the level of the test firms’ compensation—which the evidence presented in the “Influence of Peer Groups on Executive Compensation” section tends to support in varying degrees—we expect the selection of a U.S. peer by a Canadian firm will have the same impact. Thus, our first hypothesis (in alternative form) predicts, ceteris paribus:
In addition to U.S. firms paying higher compensation, prior research (e.g., Conyon et al., 2011; Fernandes et al., 2013) documents that U.S. firms pay more of their compensation in the form of equity, in particular stock options. This may lead to increased equity compensation for Canadian firms who benchmark their compensation to U.S. firms. This increase could take the form of substituting equity for non-equity compensation, or simply increasing the amounts of equity compensation awarded without a corresponding offset in the compensation package. Consequently, our expectation is that Canadian firms who benchmark their compensation to U.S. firms will also pay more of their compensation in the form of equity. Our second hypothesis (also in alternative form) predicts:
Data and Models
Sample Selection
Detailed CEO compensation data, for example, salary, bonus, value of option grants, and so on., for the largest 300 Canadian firms listed on the Toronto Stock Exchange (TSX 300) were collected from Capital IQ for the years 2009–2011, where 2009 was the first year disclosure of compensation peers was mandated. Disclosure of references to peer groups, specific peer companies, and peer countries was collected from the annual Management Information Circulars (MICs) available at www.sedar.com. Of the 900 potential firm-years, 14 158 did not have compensation data. The resulting dataset was merged with financial statement and market data from Compustat. Missing data resulted in a final sample of 725 Canadian firm-year observations. Our sample selection procedure is summarized in Table 1.
Sample Selection.

Note. TSX = Toronto Stock Exchange.
TSX 300 firms for 2009–2011.
Univariate Analysis
Descriptive statistics are presented in Table 2 (variable definitions are presented in the Appendix). 15 Panel A shows that the average salary, bonus, and equity compensation are $580,000, $653,000, and $1,277,000 Canadian dollars, respectively. Equity compensation is on average 33.8% of total CEO compensation. Panel B presents the descriptive statistics for our independent variables. In general, the firms are large and profitable, that is, mean total assets are $16 billion, mean market return is 21.2%, and mean return on assets (ROA) is 2.3%. Panel C presents descriptive statistics on the use of U.S. and non-U.S. peers by Canadian firms, as well as whether the firm is cross-listed in the United States. The use of U.S. peers by Canadian firms increased from 67 in 2009 to 73 in 2011, but still only represent a minority of Canadian firms. Overall, 206 Canadian firms use at least one U.S. peer, 361 use exclusively non-U.S. peers, and 158 do not use peers. In contrast, the number of Canadian firms cross-listing in the United States is fairly constant over our sample period, 49, 50, and 49 in 2009, 2010, and 2011, respectively. However, this does not imply that the same firms are cross-listed each year. For example, while Pembina Pipeline first listed on the New York Stock Exchange in 2010, Frontier Gold, which was cross-listed, merged and ceased reporting after 2010. The final row of Panel C contains the intersection of firms using U.S. peers and those cross-listing. Surprisingly, the intersection is rather low, which is consistent with the Pearson correlation between the two variables in Panel D, which is .159. Overall, our correlations seem relatively modest, with the largest .501 being between firm and board size.
Summary Statistics for Dependent and Independent Variables.

Note. Variables are defined in the Appendix. ROA = return on assets.
Table 3 presents a univariate comparison of firms that have at least one U.S. peer, exclusively non-U.S. peers, and no peers. In general, we find that firms that have U.S. peers have the highest compensation, those with non-U.S. peers exclusively are the next highest, and those without peers are the lowest. 16 We note, however, that these univariate comparisons do not control for differences across firms, such as industry, performance, size, and cross-listing which could be driving these differences. Somewhat surprisingly, we generally do not find our control variables, for example, market returns and ROA, differing across groups in this univariate analysis. This suggests that, while descriptive in nature, the differences in compensation could be the result of opportunism.
Comparison of Firm Characteristics Between US_Peer, Non-US_Peer, and Non-Peers.

Note.*, **, and *** indicate statistical significance at the 10%, 5%, and 1% levels, respectively. Variables are defined in the Appendix.
Table 4 shows the distribution of Canadian firms by SIC industries and by year. In our sample, 261 firm-year observations are from mining and construction (two-digit SIC codes 10-17) and 130 observations are from manufacturing (SIC codes 20-39), which when combined account for 54% of the sample. However, they also represent 56% of the Toronto Stock Exchange (TSX) 300, providing some comfort that our final sample selection is representative of the population from which it was drawn.
Distribution of Canadian Firms by SIC Industries.

Models
Our variable of interest is U.S. Peer, which is an endogenous binary treatment variable. Consequently, the compensation and equity ratio equations cannot be estimated directly because the same factors that drive the choice of U.S. Peers may also influence compensation. To control for this, we first model the choice to have a U.S. Peer as a function of a vector of explanatory variables. As U.S. directors have better knowledge of the firms in the United States, we expect that Canadian firms with U.S. directors are more likely to include U.S. firms in their compensation peer group. We also expect Canadian firms that have a harder time finding Canadian peers will be more likely to select U.S. Peers. To examine this, we construct two variables from the Compustat North America dataset: % U.S. Firms in SIC code and % U.S. Firms in Size Decile. The higher the percentage of U.S. firms in the SIC code (size decile), the harder it would be to find a Canadian peer, hence the firm would be more likely to select one or more U.S. peers. Our next variable % Foreign represents the amount of pretax income received from outside of Canada. 17 Our expectation is that the more of its profits the firm gets from outside of Canada, the greater the likelihood of selecting non-Canadian, that is, U.S. peers. Similarly, we expect that Canadian firms that are cross-listed on a U.S. exchange (or NASDAQ) will be more likely to include U.S. firms as peers. We also incorporate the % Industry using U.S. Peer, expecting that Canadian firms’ decision on selection of U.S. peers would be affected by the practices of other Canadian firms in the same industry. We incorporate the number of times that the firm mentions US, U.S., or United States in their financial reports, which might indicate a focus on the United States and thus expect the firms would be more likely to include U.S. firms in their peer group. We include various proxies, for example, board size, CEO duality, percentage of independent directors, percentage institutional ownership, and percentage of shares held by insiders, as controls, but do not predict their influence on the use of U.S. peers. Finally, we incorporate the managerial ability score from Demerjian et al. (2012) to control for the possibility that managerial ability influences the choice of peers. Our model for choice of U.S. Peers is as follows:

where
U.S. Peer = indicator variable that takes the value of 1 if a Canadian firm reports using one or more U.S. firms as peers and 0 otherwise;
% U.S. Director = the percentage of directors on the Canadian firm’s board who are U.S. citizens;
% U.S. Firms in SIC code = the percentage of firms in the Canadian firm’s SIC code who are U.S. based;
%U.S. Firms in Size Decile = the percentage of firms in the Canadian firm’s size decile who are U.S. based;
% Foreign = ratio of absolute value of foreign pretax income to the sum of absolute values of foreign pretax income and domestic pretax income;
% Industry using U.S. peers = the percentage of Canadian firms in SIC code that use U.S. peers;
Total U.S. mentions = the standardized number of “US” mentions in annual report or annual financial statements.
Cross-listing = indicator variable that takes the value of 1 if the Canadian firm is cross-listed on a U.S. exchange (or NASDAQ) and 0 otherwise;
Board Size = The natural logarithm of one plus the number of directors;
CEO-Chairman = Dummy variable equal to 1 if the CEO is also the chairman of the board, 0 otherwise;
% Independent Directors = The percentage of independent directors on board of directors;
% Institutional Ownership = The percentage of the firm owned by institutional investors;
% Closely Held = The percentage of closely held shares by insiders (Worldscope item 8021);
Managerial Ability = The managerial ability score estimated by Demerjian et al. (2012).
To test our first hypothesis, we use the following model where compensation, alternatively salary, total cash, equity, and total compensation are used as dependent variables. Our test variable is an indicator variable that takes the value of 1 if the Canadian firm reports using one or more U.S. peers, and 0 otherwise. We control for the use of non-U.S. peers to examine whether the effect of U.S. peers is the same as the effect of non-U.S. peers. 18 We incorporate the basic determinants of compensation, that is, ROA, stock market return, size, growth, and risk (e.g., Core et al., 1999) as independent variables. Lagged accounting and stock market return measures are included in the regression model to control for the effect of lagged performance on CEO compensation (Banker et al., 2013; Jensen & Murphy, 1990b). We also include proxies for corporate governance as prior literature (e.g., Fernandes et al., 2013) find it related to both the compensation level and mix. Finally, we include the managerial ability score (Demerjian et al., 2012) which we expect to be positively associated with the level of compensation. We include indicator variables for cross-listing, year, and two-digit SIC industry codes. The former allows the level of compensation to differ depending on whether a firm is cross-listed or not, while the latter allows compensation to vary by industry and year. Formally, our model is:
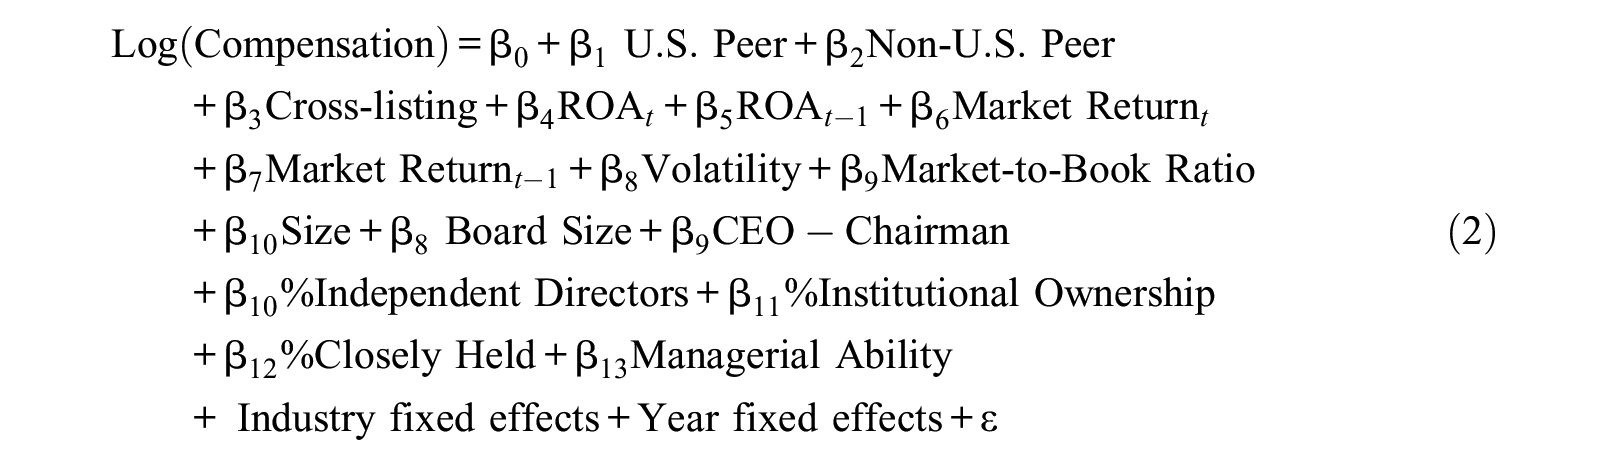
where
Log (Compensation) = natural log of 1 plus, alternatively, salary, total cash compensation which includes salary plus bonus, equity which includes the Black-Scholes value of options plus the value of stock grants, or total compensation which is the reported total compensation obtained from Capital IQ database;
U.S. Peer = indicator variable that takes the value of 1 if at least one peer is U.S.-based and 0 otherwise;
Non-U.S. Peer = indicator variable that takes the value of 1 if none of the peers disclosed are U.S.-based and 0 otherwise;
Cross-listing = indicator variable that takes the value of 1 if the Canadian firm is cross-listed on a U.S. exchange (or NASDAQ) and 0 otherwise;
ROA = the ratio of net income to the end-of-year total assets;
Market Return = annual stock return, including dividends;
Volatility = variance of annual market return over the past 10 years;
Market-to-Book Ratio = market value of a firm divided by its book value at end of year t;
Size = the logarithm of total assets measured at end of year t;
Industry fixed effects = indicator variables for two-digit SICs;
Year-fixed effects = indicator variables for 2010 and 2011, 2009 subsumed by intercept; and all other variables are as defined above.
To test our second hypothesis, we use the following model where the ratio of equity to total compensation is our dependent variable, and our test variable is an indicator variable that takes the value of 1 if the Canadian firm reports using one or more U.S. peers, and 0 otherwise. As above, we control for the use of non-U.S. peers to examine whether the effect of U.S. peers is the same as the effect of non-U.S. peers. Our control variables include the effective tax rate, leverage, operating cash flows, size, growth, volatility, governance, managerial ability, and industry (Fernandes et al., 2013; Klassen & Mawani, 2000; Lewellen et al., 1987; Sloan, 1993), as well as indicator variables for cross-listing, industry, and year. Formally our model is:

where
Equity ratio = ratio of equity compensation to total CEO compensation;
ETR = income tax expense divided by pretax income, variable is truncated at 0% and 50% following Hanlon and Slemrod (2009);
Leverage = ratio of total debt to total assets;
Operating Cash Flow = operating cash flow deflated by book value of shareholders’ equity;
Growth in assets = total assets at end of current year less total assets at end of prior year deflated by total assets at end of prior year; and all other variables are as defined above.
Results and Discussion
Determinant of U.S. Peer Selection
We employ the widely used latent variable approach to estimate the true effect of the endogenous treatment variable U.S. Peer (Clougherty et al., 2016). We use STATA command “etregress” with option “MLE” to simultaneously estimate the U.S. Peer selection model and the compensation model. 19 Table 5 presents the results for the selection model of U.S. peers. As the selection model is run simultaneously with the compensation model, we actually run the model 5 times, corresponding to the five dependent variables in the outcome model, that is, salary, cash compensation, equity compensation, total compensation, and compensation ratio. While the magnitudes of the coefficients differ slightly from one column to the next, the signs and significance of the coefficients are identical. Thus, for brevity, we only discuss the model in column (4), which corresponds to total compensation. As expected, the coefficient estimates on % U.S. director, % U.S. Firms in SIC code, % U.S. Firms in Size Decile, % Industry using U.S. peers, and Total U. S. mentions, and Cross-listing are positive and statistically significant. In contrast, we get a negative and significant coefficient on % Independent Directors. Overall, we find that the use of U.S. peers is not random and is consistent with firms having greater U.S. integration, that is, % U.S. director, Cross-listing, Total U.S. mentions; fewer comparable Canadian firms, that is, % U.S. Firms in Size Decile; and industry norms, that is, % Industry using U.S. peers. However, the negative and significant coefficient on % Independent Directors, a proxy for good governance, could be construed as evidence that choice of U.S. peers is opportunistic.
Why Canadian Firms Choose U.S. Peers a (N = 725).

Note. Variables are defined in the Appendix. Z-statistics are presented in parentheses. *, **, and *** indicate statistical significance at the 10%, 5%, and 1% levels, respectively.
Table 5, 6, and 7 present the regression results of the U.S. peer selection and compensation models. The selection model is separately estimated for each of five dependent variables (i.e., salary, cash compensation, equity compensation, total compensation, and compensation ratio) in the compensation model.
Determinants of CEO Compensation (N = 725).

Note. Variables are defined in the Appendix. Z-statistics are presented in parentheses. *, **, and *** indicate statistical significance at the 10%, 5%, and 1% levels, respectively. ROA = return on assets.
Online Appendix Table A1 presents the results for the subsample of firms that report using peers, that is, we drop those firms that don’t use peers, because they could not have U.S. Peers. Our analysis parallels that of Table 5, so once again we focus our discussion on column (4), which corresponds to total compensation. We observe some differences from Table 5, primarily the coefficient estimates on % U.S. director and % U.S. Firms in Size Decile lose significance. Other than that, the signs and statistical significance and hence interpretations are identical to those in Table 5.
Analysis of CEO Compensation
In the second stage of our model, we examine the impact of U.S. peers on compensation, presenting our results in Table 6. 20 Our test variable is the existence of U.S. Peers, where the U.S. Peer indicator variable is coded 1 when the Canadian firm discloses that it has one or more U.S. peers and 0 otherwise. In both panels, the columns represent four different dependent variables consisting of different elements of compensation. Consistent with hypothesis 1, in both Panels A and B, firms that disclose using U.S. peers pay their CEOs higher levels of salary, total cash compensation, equity, and total compensation. These coefficients are not only statistically significant but also economically significant. As an example, the coefficient of 1.337 on U.S. Peer in Column (4) indicates that, on average, CEOs of firms that with U.S. peers earned 281% more in total compensation after controlling for other factors. 21 This contrasts to the coefficient of 0.260 on non-U.S. Peer which indicates that, on average, CEOs of firms that exclusively used non-U.S. peers earned 30% more in total compensation than firms not using compensation peers. As shown at the bottom of the table, F-statistics indicate that the difference in coefficients between U.S. Peer and non-U.S. peer is statistically significant, with p-values of .039 or less, in each of the four compensation regressions. This suggests that while the use of any peer(s) is associated with higher levels of compensation, the use of U.S. peer(s) increases CEO compensation more that of non-U.S. peers. Online Appendix Table A2, which presents analysis for the subsample of firms that report using peers, and which drops the non-U.S. peer variable to avoid over specifying the model, provides similar results and interpretations, that is, use of a U.S. peer increases Canadian CEO compensation.
Turning to our control variables, we note that our associations vary by component of compensation. Size is positive and strongly significant in all of our models. In contrast we find very little association between either contemporaneous or lagged performance and CEO compensation, that is, only market return is positive and significantly associated with compensation, and then only in the total compensation model. Other variables exhibiting some significance include Managerial Ability and % Institutional Ownership, but only for Salary and Cash Compensation; and CEO-Chairman, which is negative and significantly associated with equity and total compensation.
Analysis of Compensation Mix
In Table 7, we examine the effects of U.S. peers (hypothesis 2) on the use of equity compensation for Canadian CEOs, finding that Canadian firms that report using U.S. peers pay their CEOs more of their total compensation in the form of equity. The coefficient on non-U.S. peers is also positive but not significant, and the F test shows that the difference between coefficients on US_Peer and Non-US_Peer is significant at the 1% level. The difference between the two coefficients is also economically (i.e., 0.283 vs. 0.024) significant. Surprisingly, we do not find that Canadian firms that are cross-listed in the United States use more equity compensation. We do, however, find positive and significant coefficients on size and growth, that is, the market-to-book ratio, and negative and significant coefficients on CEO-Chairman, and Managerial Ability. Online Appendix Table A3, which presents analysis for the subsample of firms that report using peers, provides similar results and interpretations.
Determinants of Equity Ratio (N = 711).

Note. Variables are defined in the Appendix. *, **, and *** indicate statistical significance at the 10%, 5%, and 1% levels, respectively. ETR = effective tax rate.
Additional Analyses of Canada and U.S. Matched Sample
To compare the level and composition of Canadian CEOs’ compensation with those of U.S. CEOs, we create a matched sample by size, industry, and year. Specifically, we begin by identifying U.S. firms that are in the same two-digit SIC code and have the same fiscal year as the Canadian firms in our sample. Next, we select the U.S. firm whose total assets are closest to that of the Canadian firm, ensuring that total assets is at least 50% of, but no more than, 200% of the total assets of Canadian firms. 22 Our matched sample includes 626 pairs, or a total of 1,252 firm-year observations. 23 Table 8 presents the means of the CEO compensation components, equity ratio, and total assets for both Canadian and U.S. firms. While the difference in size is not statistically significant, U.S. CEOs are paid significantly more and receive more of their compensation in the form of equity.
Comparison of Means for Canada and U.S. Firms Matched Sample (SIC Code and Size Matched).

Note. For the comparison between Canadian and U.S. firms, Canadian dollar data are converted to U.S. dollars using the calendar year average exchange rate in 2011 (1 USD = 0.989 CAD), 2010 (1 USD = 1.030 CAD), and 2009 (1 USD = 1.142 CAD). Data source: http://www.bankofcanada.ca/rates/exchange/legacy-noon-and-closing-rates/annual-average-exchange-rates/
Table 9 presents the results of a multivariate analysis where we augment Model (2) with an indicator variable, U.S. Indicator, which takes the value of 1 if the firm is incorporated in the United States, and 0 otherwise. Because components of CEO compensation are often jointly determined, we run seemingly unrelated regression to estimate the system of equations for salary, cash, equity, and total compensation. 24 The coefficients on U.S. Indicator are positive and statistically significant, consistent with CEOs in U.S. firms receiving higher compensation than their Canadian counterparts even after controlling for the traditional determinants of CEO compensation. 25 We continue to find the coefficients on U.S. Peer and Non-U.S. Peer to be positive and statistically significant, consistent with Canadian CEOs in firms that use peers receiving higher compensation. 26 In addition, we continue to find that having a U.S. peer has, in three of the four models, a statistically greater effect than having only Non-U.S. Peers, on the compensation of Canadian CEOs. Most importantly, when we compare the coefficients on U.S. Indicator, and U.S. Peers, we observe no statistical difference, implying that using U.S. Peers allows Canadian CEOs to achieve compensation parity with U.S. CEOs. This contrasts with our findings in Online Appendix Table A4, the analysis of the subsample of Canadian firms using peers, where we observe a statistically significant greater coefficient on the U.S. Indicator when Cash, Equity, and Total Compensation are the dependent variables. The combined results suggest that while the use of a U.S. peer increases the compensation of a Canadian CEO, we cannot conclude that it allows a Canadian CEO to achieve parity with his or her U.S. counterpart.
Seemingly Unrelated Regression Results of Compensation Models With Matched U.S. Firms (N = 1,252).
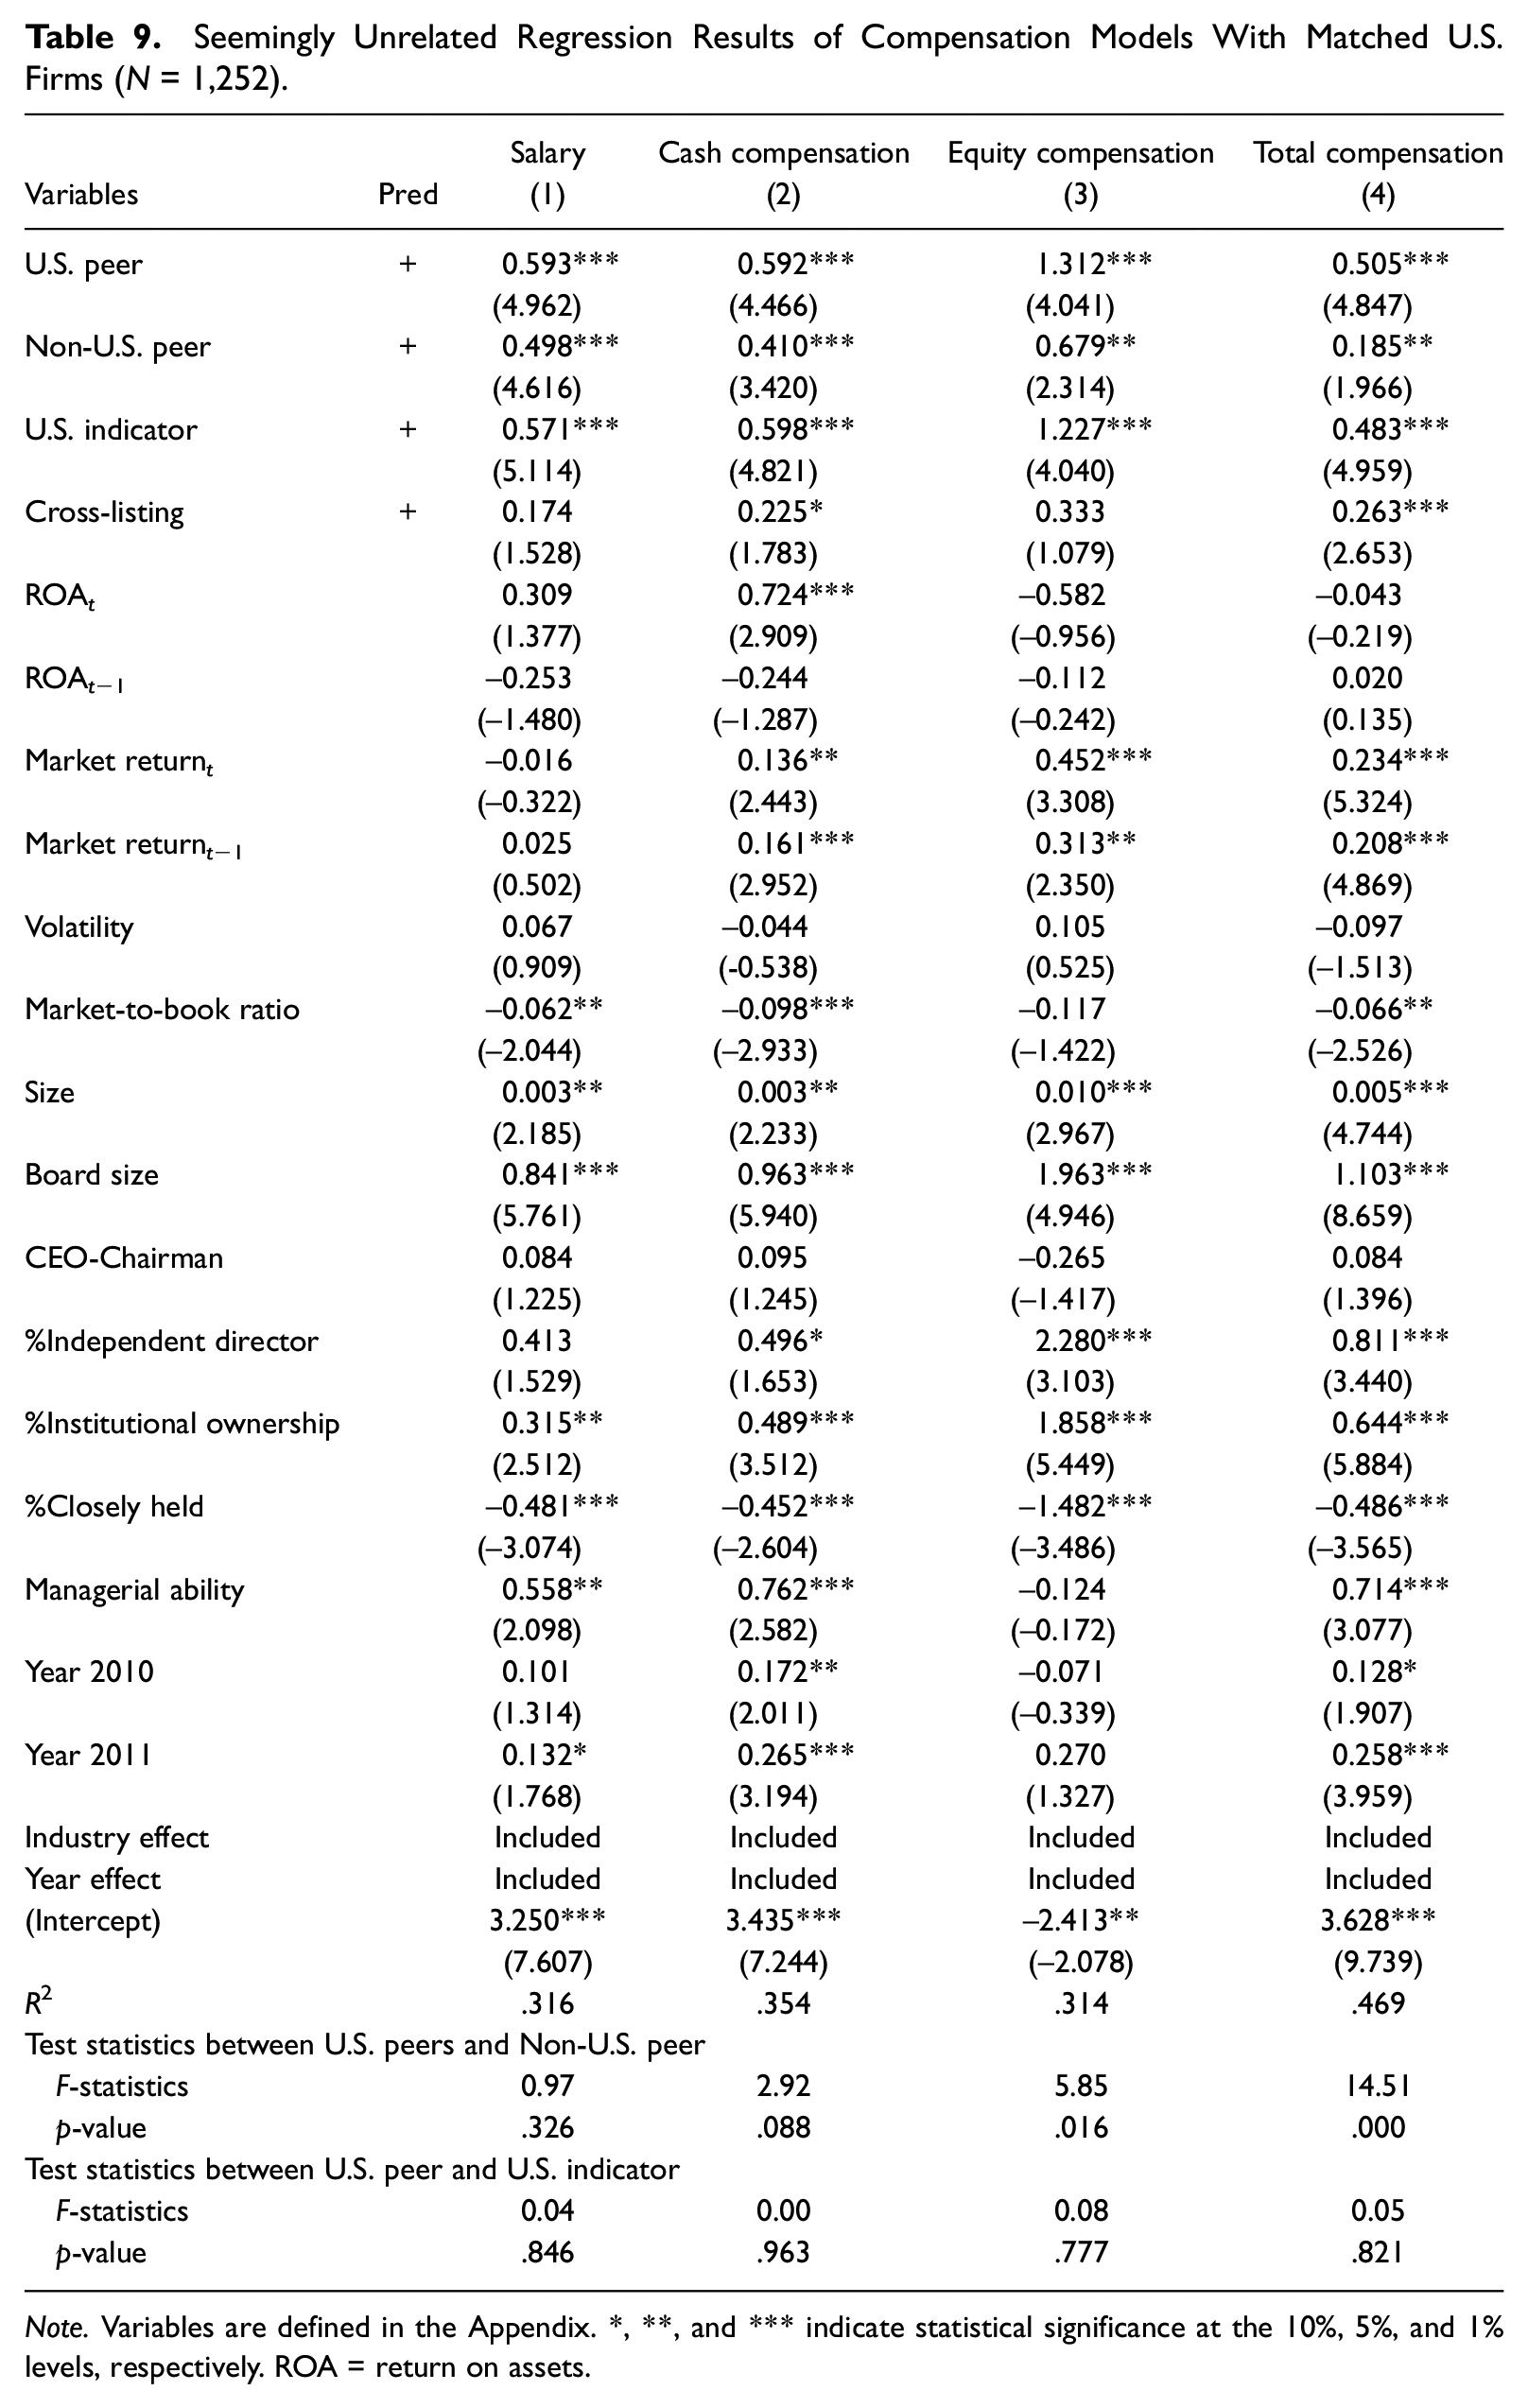
Note. Variables are defined in the Appendix. *, **, and *** indicate statistical significance at the 10%, 5%, and 1% levels, respectively. ROA = return on assets.
In Table 10, we augment Model (3) with a U.S. Indicator. The coefficient on U.S. Indicator is positive and statistically greater than 0, as are the coefficients on U.S. Peer and Non-U.S. Peer. We find the impact of having a U.S. Peer statistically greater than that of having a Non-U.S. Peer. However, we do not find a statistically significant difference between the coefficient on U.S. Indicator and U.S. Peer, indicating that the compensation mix is comparable for U.S. firms and Canadian firms using U.S. peers. Online Appendix Table A3, which presents analysis for the subsample of firms that report using peers, provides similar results and interpretations.
Tobit Regression Results of Compensation Mix Model With Matched U.S. Firms (N = 1,244).
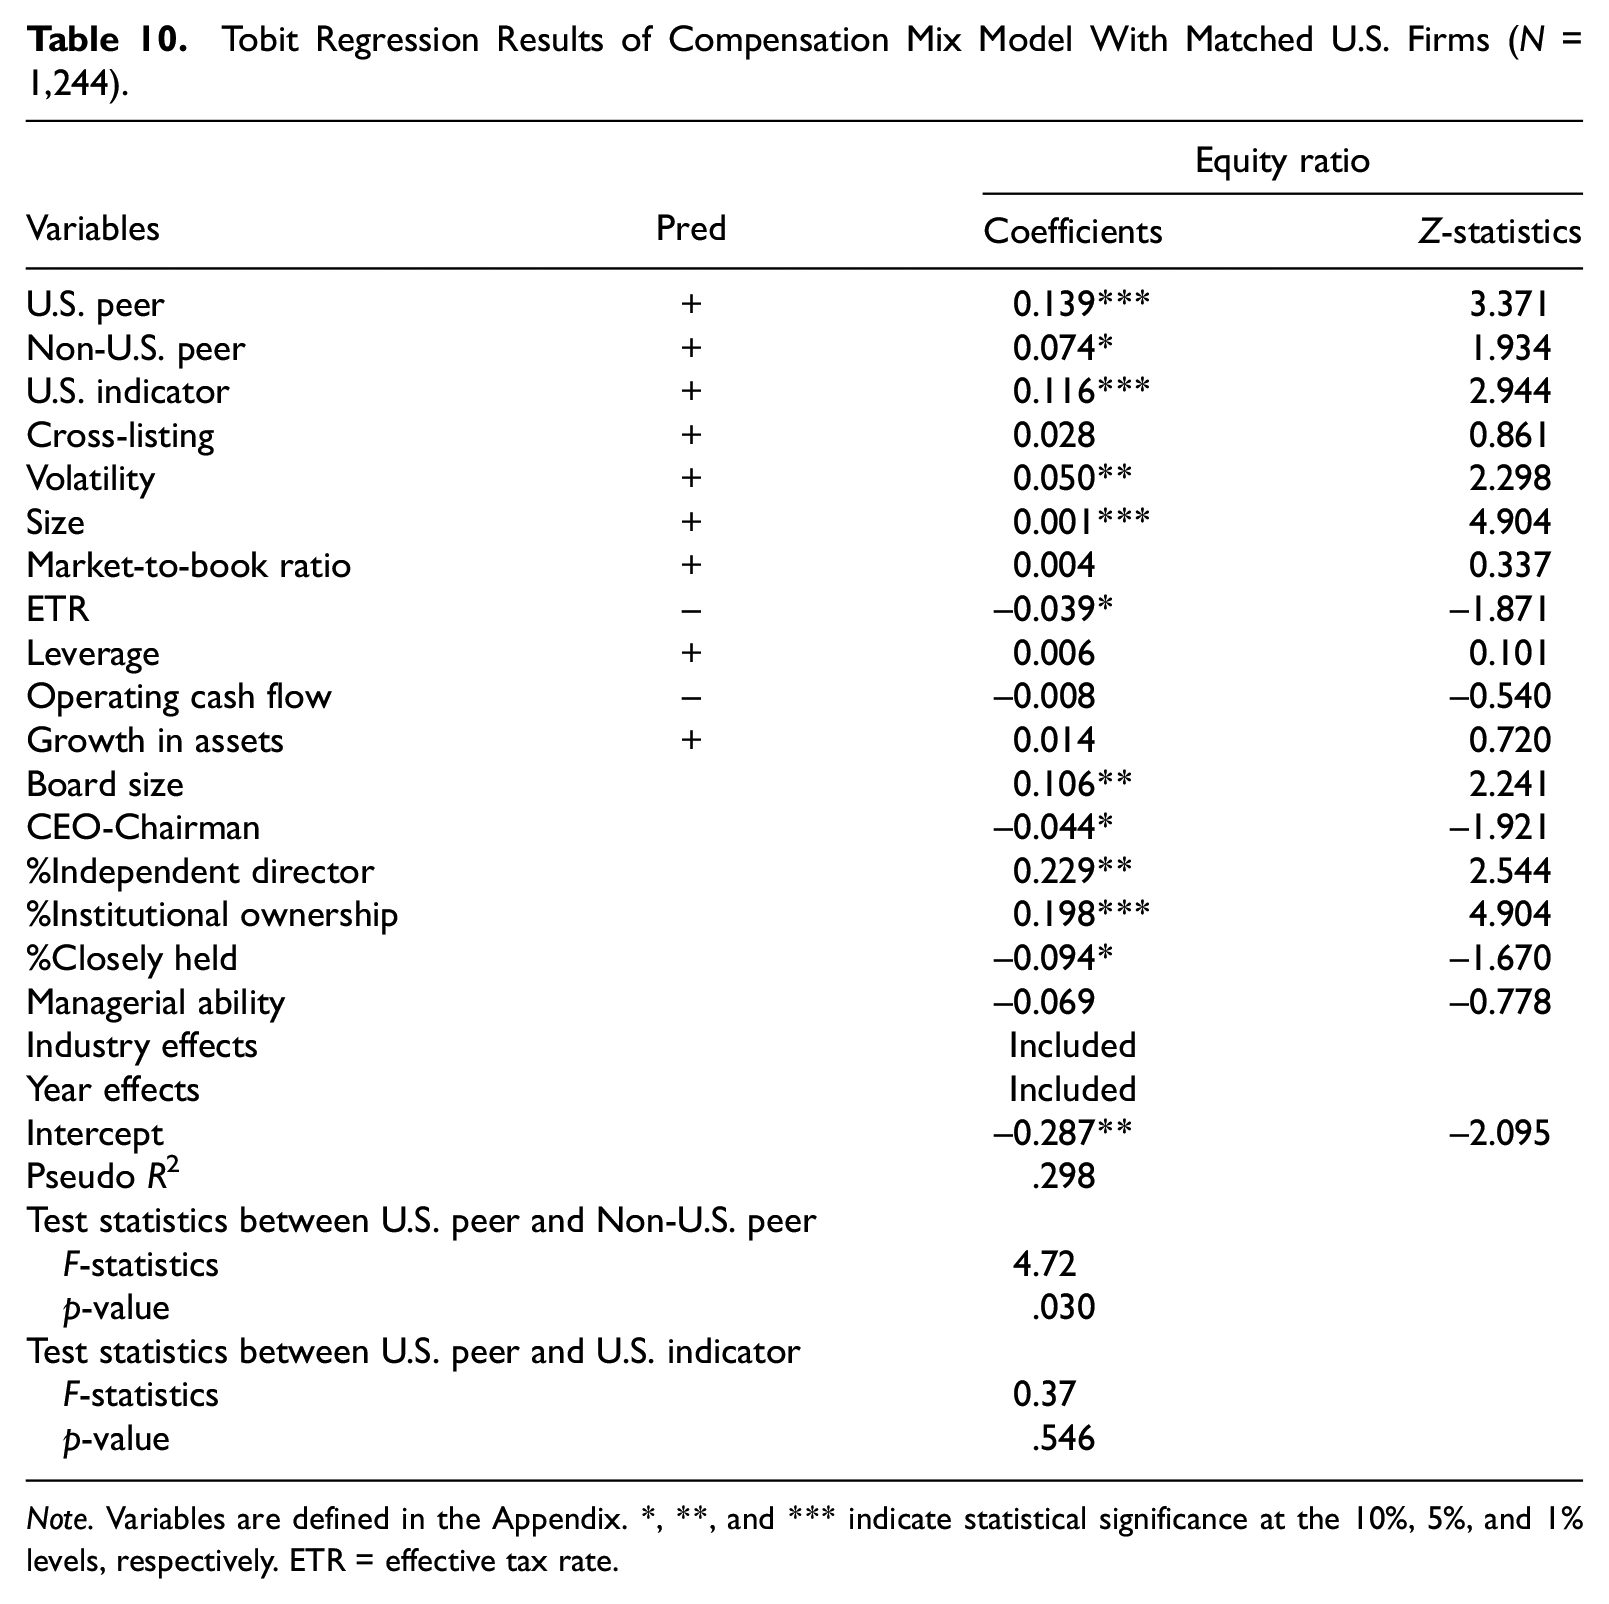
Note. Variables are defined in the Appendix. *, **, and *** indicate statistical significance at the 10%, 5%, and 1% levels, respectively. ETR = effective tax rate.
In summary, this section confirms that using peers increases the compensation, as well as the percentage of equity in the compensation package, of Canadian CEOs. The evidence also confirms that this increase is greater than that of Canadian firms using only Non-U.S. peers. This section also provides mixed evidence as to whether using U.S. peers allows Canadian CEOs to achieve pay parity with their U.S. counterparts.
Voluntary Disclosers
Prior to 2009, Canadian firms that used compensation peers did not have to disclose that fact. Therefore, CEOs might use their influence to select peer companies with highly compensated CEO, for example, U.S. peers, to influence the board or its compensation subcommittee, while keeping that information from outside monitors, for example, shareholders. 27 Thus, in the pre-mandatory disclosure period, there were two choices that a Canadian firm had to make: the choice to use a U.S. peer and the choice to disclose. It is possible that when the choice of peers could not be justified using labor market explanations, the firm would not disclose. Consequently, it is possible that the results found above would not hold in the voluntary disclosure regime. Subject to that caveat, we run a difference-in-difference analysis using the years 2001–2005, a period that predates the plethora of regulatory changes beginning in 2006, where the firms disclosing peers are the test firms, and the firms not-disclosing are the control firms. In untabulated analysis, we continue to find firms disclosing peers, and firms disclosing U.S. peers, receive higher levels of compensation.
Functional Form of Compensation Variables
Log levels, levels, and change models have all been utilized in compensation research. While the analysis above uses the log transformation, a commonly used technique to mitigate skewness, the possibility exists that the results may differ using other functional forms. Consequently, we rerun our analyses using the level and the change in level of compensation. In untabulated analyses, we find qualitatively comparable results.
Conclusion
In this article, we have examined the use of U.S. compensation peers by Canadian firms and its impact on Canadian CEO Compensation. The use of U.S. peers may signal that Canadian firms are more integrated with U.S. labor and capital markets and/or reflect strategic choices by Canadian corporations to bias their executive compensation upward. We begin by modeling the choice of large Canadian firms to include U.S. peers in their compensation peer groups, finding the choice to be associated with integration into the U.S. market, lack of appropriate-sized Canadian peers, and industry norms, that is, labor market factors. In the second stage of our model, we find that after controlling for use of non-U.S. peers, cross-listing on a U.S. exchange, size, industry, profitability, and growth, Canadian firms that select U.S. companies as their peers have higher levels of CEO compensation and tend to include more equity in their compensation mix.
To the best of our knowledge, this is the first study to examine cross-border compensation peer groups. Our findings that the use of U.S. peers is associated with higher compensation adds to the prior literature suggesting the strategic selection of peers leads to higher compensation for U.S. firms (Bizjak et al., 2011; Faulkender & Yang 2010, 2013). However, we cannot rule out the possibility that our findings are driven by retention, that is, that CEOs in firms selecting U.S. peers are relatively more mobile and hence receive higher compensation to disincentivize them from leaving the firm, possibly for a U.S.-based competitor.
Future research could examine the extent to which labor market characteristics explain CEO compensation. Despite the theoretical ease of cross-border mobility by executives, in practice it is rarely observed (High Pay Centre, 2013). Consequently, compensation levels remain significantly different between Canada and the United States. This suggests that the Canadian labor market is distinct and different from the U.S. labor market. In some industries, however, the cross-border flow of executive talent may be significant enough to broaden the scope to a North American managerial labor market. Investigation of these and other factors could better explain Canada-U.S. differences in executive compensation in a manner analogous to Conyon et al. (2011) who explain differences between compensation of U.S. and U.K. executives.
Supplemental Material
Internet_Appendix – Supplemental material for The Impact of the Use of Cross-Border Compensation Peers: The Case of Canadian Companies Using U.S. Peers
Supplemental material, Internet_Appendix for The Impact of the Use of Cross-Border Compensation Peers: The Case of Canadian Companies Using U.S. Peers by Steven Balsam, Hong Fan, Amin Mawani and Daqun Zhang in Journal of Accounting, Auditing & Finance
Footnotes
Appendix
Variable Definitions.
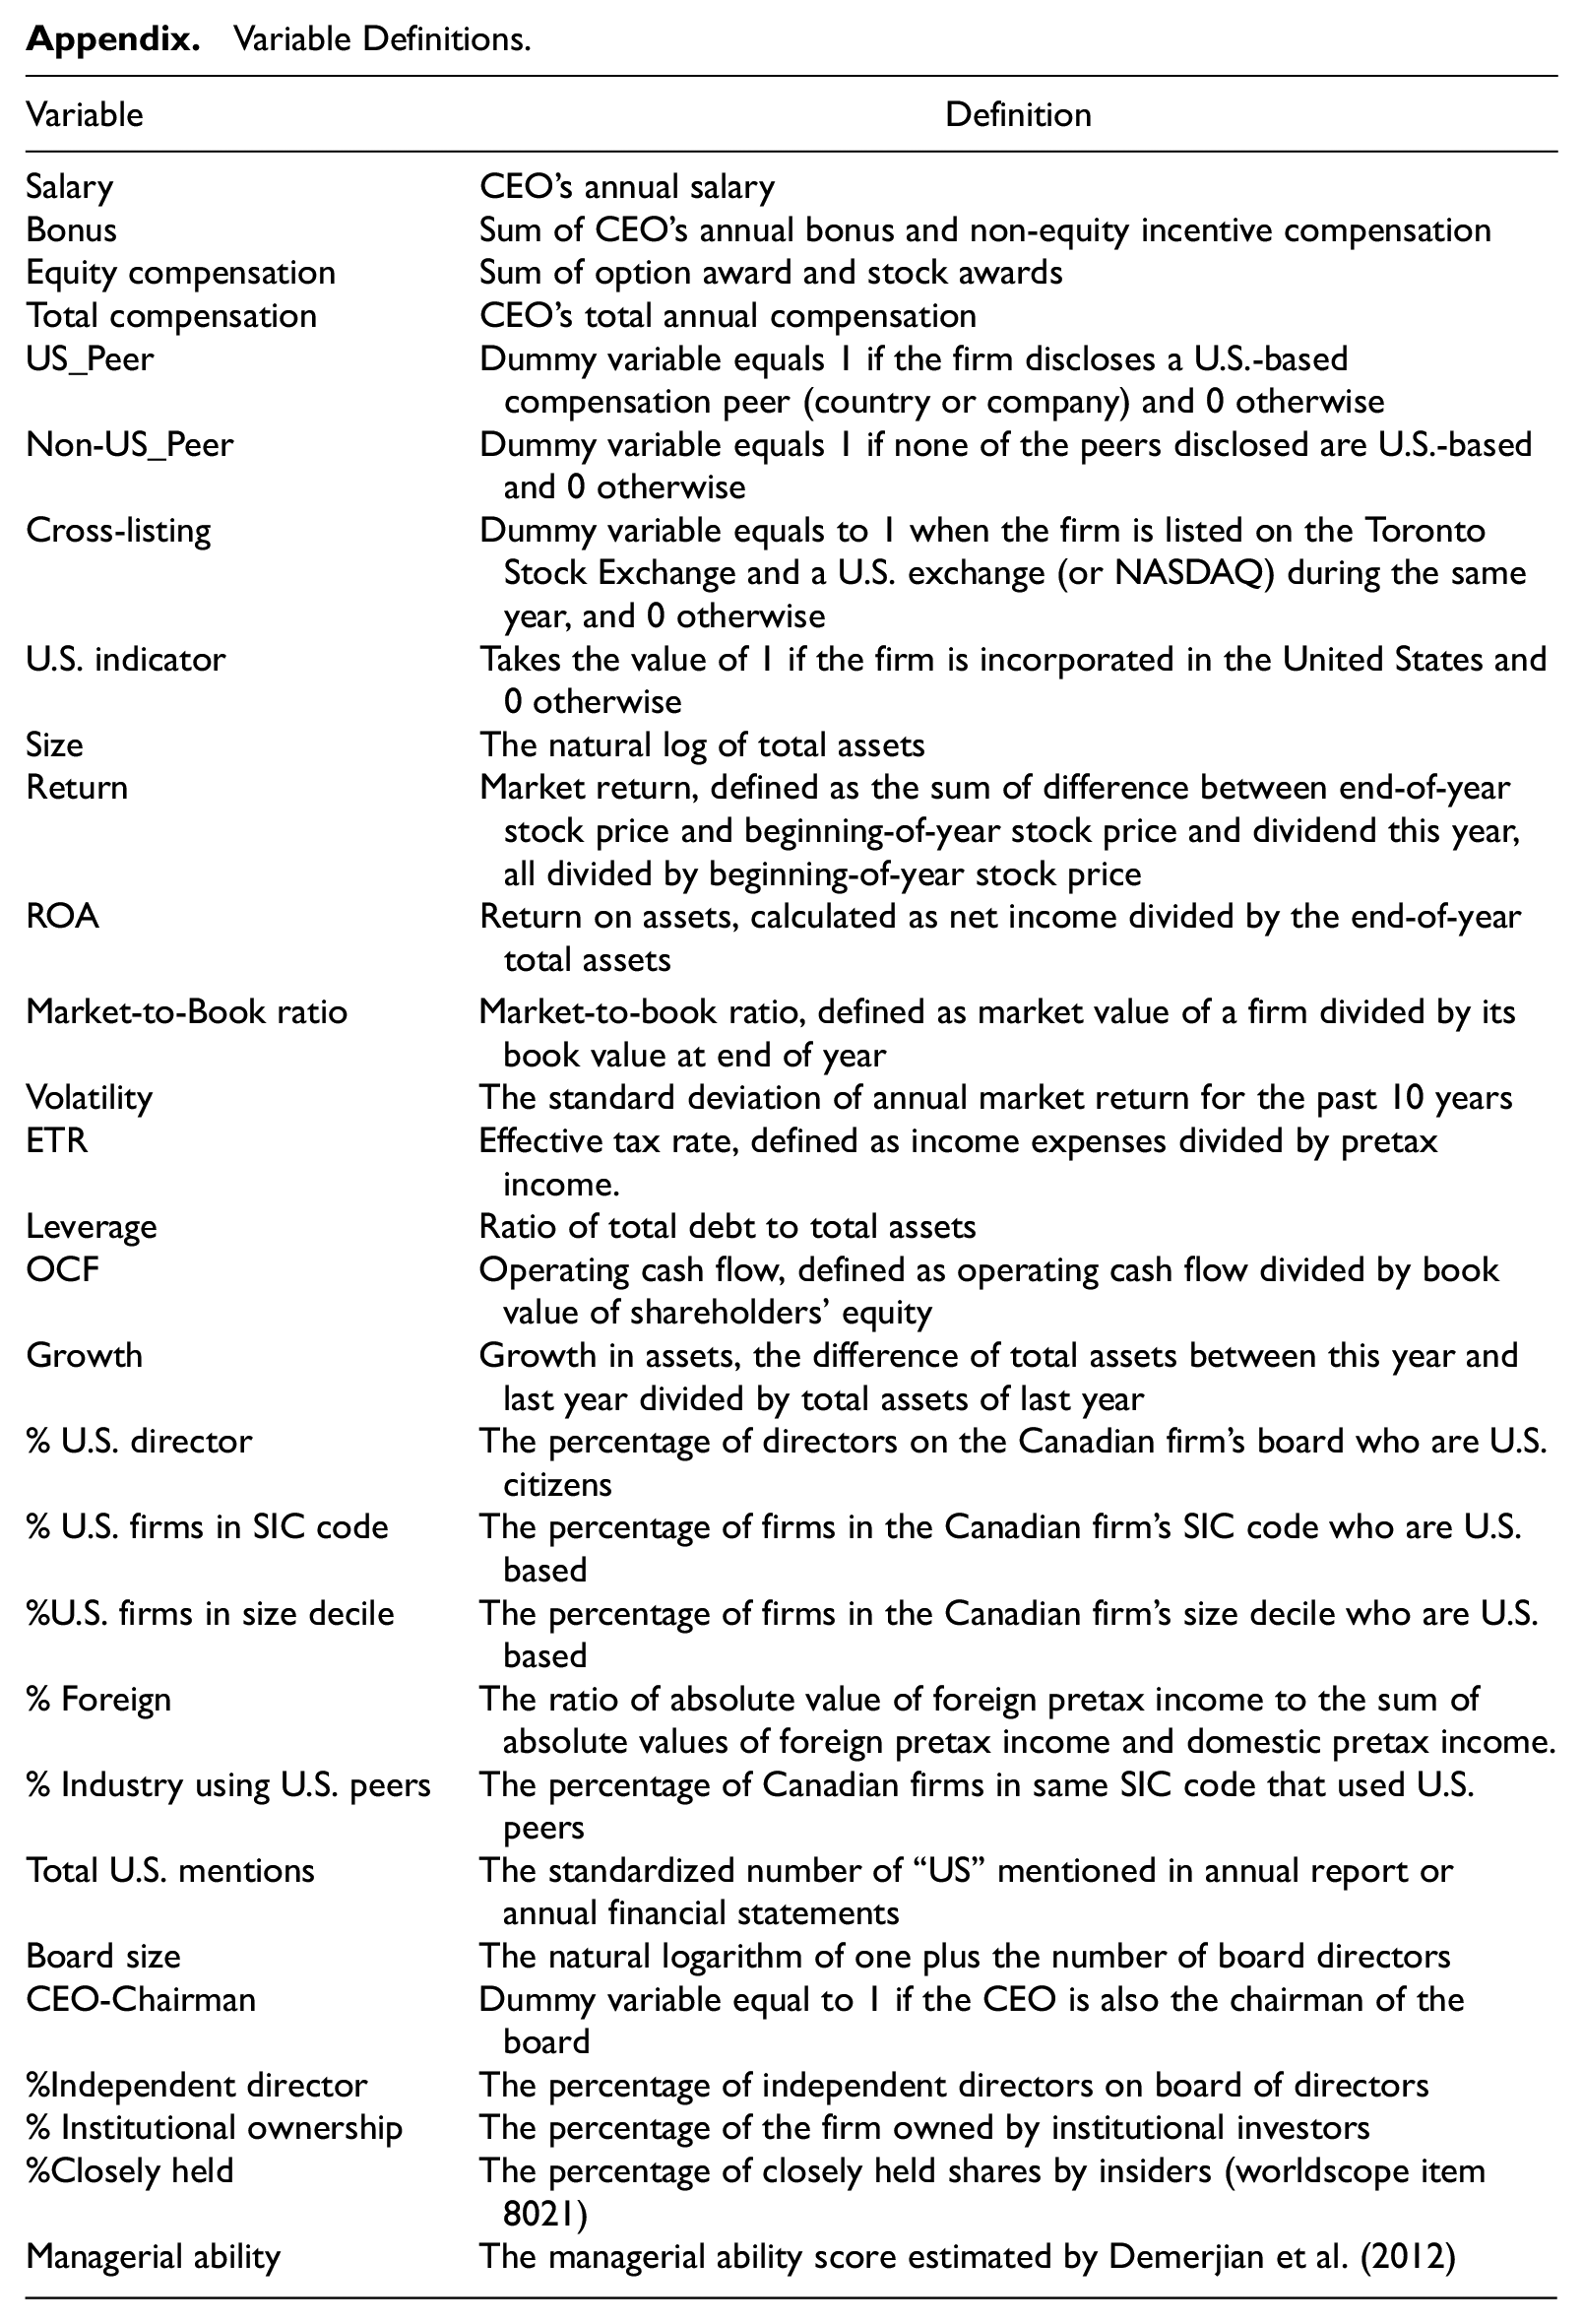
| Variable | Definition |
|---|---|
| Salary | CEO’s annual salary |
| Bonus | Sum of CEO’s annual bonus and non-equity incentive compensation |
| Equity compensation | Sum of option award and stock awards |
| Total compensation | CEO’s total annual compensation |
| US_Peer | Dummy variable equals 1 if the firm discloses a U.S.-based compensation peer (country or company) and 0 otherwise |
| Non-US_Peer | Dummy variable equals 1 if none of the peers disclosed are U.S.-based and 0 otherwise |
| Cross-listing | Dummy variable equals to 1 when the firm is listed on the Toronto Stock Exchange and a U.S. exchange (or NASDAQ) during the same year, and 0 otherwise |
| U.S. indicator | Takes the value of 1 if the firm is incorporated in the United States and 0 otherwise |
| Size | The natural log of total assets |
| Return | Market return, defined as the sum of difference between end-of-year stock price and beginning-of-year stock price and dividend this year, all divided by beginning-of-year stock price |
| ROA | Return on assets, calculated as net income divided by the end-of-year total assets |
| Market-to-Book ratio | Market-to-book ratio, defined as market value of a firm divided by its book value at end of year |
| Volatility | The standard deviation of annual market return for the past 10 years |
| ETR | Effective tax rate, defined as income expenses divided by pretax income. |
| Leverage | Ratio of total debt to total assets |
| OCF | Operating cash flow, defined as operating cash flow divided by book value of shareholders’ equity |
| Growth | Growth in assets, the difference of total assets between this year and last year divided by total assets of last year |
| % U.S. director | The percentage of directors on the Canadian firm’s board who are U.S. citizens |
| % U.S. firms in SIC code | The percentage of firms in the Canadian firm’s SIC code who are U.S. based |
| %U.S. firms in size decile | The percentage of firms in the Canadian firm’s size decile who are U.S. based |
| % Foreign | The ratio of absolute value of foreign pretax income to the sum of absolute values of foreign pretax income and domestic pretax income. |
| % Industry using U.S. peers | The percentage of Canadian firms in same SIC code that used U.S. peers |
| Total U.S. mentions | The standardized number of “US” mentioned in annual report or annual financial statements |
| Board size | The natural logarithm of one plus the number of board directors |
| CEO-Chairman | Dummy variable equal to 1 if the CEO is also the chairman of the board |
| %Independent director | The percentage of independent directors on board of directors |
| % Institutional ownership | The percentage of the firm owned by institutional investors |
| %Closely held | The percentage of closely held shares by insiders (worldscope item 8021) |
| Managerial ability | The managerial ability score estimated by Demerjian et al. (2012) |
Acknowledgements
We acknowledge comments from seminar participants at Simon Fraser University, University of Calgary, and McMaster University; the American Accounting Association’s Annual Meeting; as well as the Editor, Bharat Sarath, and an anonymous reviewer. We also acknowledge financial support from the Social Sciences and Humanities Research Council of Canada.
Declaration of Conflicting Interests
The author(s) declared no potential conflicts of interest with respect to the research, authorship, and/or publication of this article.
Funding
The author(s) received no financial support for the research, authorship, and/or publication of this article.

Supplemental Material
Supplemental material for this article is available online.
Notes
References
Supplementary Material
Please find the following supplemental material available below.
For Open Access articles published under a Creative Commons License, all supplemental material carries the same license as the article it is associated with.
For non-Open Access articles published, all supplemental material carries a non-exclusive license, and permission requests for re-use of supplemental material or any part of supplemental material shall be sent directly to the copyright owner as specified in the copyright notice associated with the article.
