
Abstract
We decompose analysts’ earnings forecast error into predictable and unpredictable components and investigate individual vis-à-vis institutional investors’ reactions to each of these components. We find that in the immediate post-earnings announcement window, only individuals under-react to the predictable component, while both individuals and institutions under-react to the unpredictable component. The price drift in this window is driven primarily by investors’ under-reaction to the unpredictable component. This drift remains highly significant in larger firms and intensifies in firms with complex financial reports, suggesting that it likely represents the slow and noisy process of price discovery. Around the next quarterly earnings announcement, only individuals under-react to the previous quarter’s predictable component, and this fixation drives the entire price drift in this window. This drift disappears in larger firms and gets exacerbated in firms with greater forecast error autocorrelations, suggesting that it is likely attributable to incomplete processing of earnings information by individuals.
Introduction
In the extant empirical literature, a standard proxy variable for an earnings surprise is the analyst earnings forecast error (henceforth AFE) computed as the difference between reported earnings and the consensus forecast. A large body of work, however, contends that aspects of AFE are predictable and classifies the predictable aspects into the following broad categories: (a) strategic biases in earnings forecasts, (b) behavioral biases in earnings forecasts, and (c) strategic biases in reported earnings. Strategic biases in forecasts arise when analysts intentionally bias their forecasts to curry favor with the management (Das et al., 1998; Lim, 2001) or to generate more trading for their brokerage clients (Beyer & Guttman, 2011; Groysberg et al., 2011). Managers also have incentives to guide analysts to lower their forecasts (Matsumoto, 2002; Payne & Robb, 2000). Previous research also contends that behavioral traits, such as under-reaction to prior earnings (Abarbanell & Bernard, 1992), herding (Hong et al., 2000), or inexperience (Mikhail et al., 2003) can lead to biased forecasts. Finally, numerous prior studies present evidence of managerial efforts to upwardly bias reported earnings.
A recent and growing literature utilizes a variety of public information sources to incorporate the effects of the systematic biases and the strategic games in estimating a predictable component of AFE (Abarbanell & Park, 2017; Barton & Simko, 2002; Hughes et al., 2008). A large body of prior work documents evidence of post-earnings announcement drift (PEAD), where prices continue to react to earnings news well after the earnings announcement. In this study, we investigate how PEAD returns are associated with the predictable component and the unpredictable or “true surprise” component of AFE. In addition to examining overall market returns, we also investigate how less sophisticated individual investors and more sophisticated institutional investors react to the two components of AFE. Our inquiry has the potential to shed light into the underlying mechanism and the investor clienteles that drive PEAD. For instance, the interpretation of PEAD documented in prior literature may change once one entertains the possibility that a portion of AFE is predictable.
Following Barton and Simko (2002) and Abarbanell and Park (2017), we employ 15 independent variables to capture the value-relevant public information available prior to the earnings announcement to decompose AFE into a predictable component and an unpredictable component. We repeat analyses using two alternative model specifications and obtain qualitatively similar results. We document that abnormal returns in the 3-day window surrounding the earnings announcement are significantly associated with both the predictable and unpredictable components of AFE. We find that both individual and institutional investors react to the predictable as well as the unpredictable components in this window, although institutions’ reaction to the predictable portion is less than that of individuals. This suggests that even institutions’ reaction to the predictable component is not fully complete before the announcement.
We next examine investors’ reactions during the weeks immediately following the earnings announcement. First, we examine the relations between aggregate market returns and components of AFE, and observe that PEAD in this period is characterized primarily by the market’s under-reaction to the unpredictable component. Digging deeper, we find that only individual traders continue to respond to the predictable component of AFE in the immediate post-announcement window. This suggests that individual investors do not fully incorporate the predictable aspects of AFE even after the earnings announcement, while institutions’ reaction to the predictable component is complete. In contrast, both individuals and institutions under-react to the unpredictable component of AFE in this window, suggesting that even professional investors take time to digest information that is truly unexpected and surprising. We further observe that the under-reaction to the unpredictable component is attenuated, but remains highly significant in large firms and firms with high analyst following. This suggests that standard “limits to arbitrage” argument is unlikely to explain the price drift associated with the unpredictable component in the immediate post-earnings window. In addition, we find that this under-reaction is greater in firms with more complex reporting quality. Collectively, these results suggest that the price drift associated with the unpredictable component immediately after the earnings release likely represents the noisy process through which price converges to the new fundamental value.
Prior research suggests that a non-trivial fraction of investors’ under-reaction is clustered around the next quarterly earnings release (e.g., Ayers et al., 2011; Bernard & Thomas, 1990). Consequently, we next focus on the short window surrounding the following quarter’s earnings announcement. When we examine aggregate market returns, we observe that the entire PEAD around the following quarter’s earnings announcement is attributable to the predictable component (and not the unpredictable component) of the current quarter’s AFE. This puzzling evidence implies that a segment of the market is reacting to the predictable component of AFE one full quarter after the earnings announcement. We find no evidence of institutional under-reaction to any component of AFE in this window.
We probe further to understand what prompts individual investors to trade on current quarter’s predictable component of AFE around the next quarter’s earnings announcement. Prior research contends that a segment of the market does not seem to fully understand the autocorrelation structure in quarterly earnings time-series, and as a result, may not realize that earnings forecast errors in adjacent quarters are autocorrelated (e.g., Battalio & Mendenhall, 2005; Bernard & Thomas, 1990; Bhushan, 1994). Failure to fully grasp this autocorrelation may induce investors to react to the lagged predictable forecast error during the subsequent quarter’s earnings announcement. Consistent with this notion, we observe that the delayed price reaction to the lagged predictable component is significantly more pronounced in firms with greater adjacent quarter autocorrelations. Finally, we observe that the under-reaction around the subsequent earnings announcement window persists only in smaller, thinly followed firms. Collectively, these results suggest that the drift around next quarter’s earnings announcement is likely attributable to incomplete processing of earnings persistence information by individual investors, and this mispricing is arbitraged away in larger, more visible firms.
Our study makes the following contributions to the literature. First, our decomposition of earnings surprise into a predictable component and an unpredictable component and examination of investors’ reactions to each piece enable us to observe two distinct price drifts, driven by fundamentally different processes and different investor clienteles in the two post-announcement periods that has gone unnoticed in prior research. In the window immediately following the earnings announcement, the under-reaction seems consistent with a price discovery explanation instead of a behavioral explanation based on biased or incomplete information processing. Consistent with this notion, this drift does not seem to be bounded by liquidity and transactions costs that limit information arbitrage. In contrast, the PEAD surrounding next quarter’s earnings announcement seems a manifestation of incomplete processing of earnings persistence information by individual investors. This drift is well within the bounds of arbitrage forces, however, as it is non-existent in large and more liquid firms. In addition, our evidence that individual investors are unable to efficiently assimilate even the predictable aspects of AFE long after the earnings announcement extends a body of work (e.g., Miller, 2010) that argues that merely mandating public disclosures may not be sufficient to level the playing field between institutions and individuals.
Background and Hypotheses Development
Testable Hypotheses
A number of recent studies incorporate the effects of the various systematic biases and the strategic games in estimating an expected component of AFE (Abarbanell & Park, 2017; Barton & Simko, 2002; Hughes et al., 2008). Even though these studies demonstrate that publicly available information can be used to decompose AFE into predictable and unpredictable components, less sophisticated individual investors may lack the necessary data acquisition and processing capabilities to anticipate the predictable component. Bhattacharya (2001) and Battalio and Mendenhall (2005) argue that individual investors anchor on a naïve seasonal random-walk model to form their earnings expectations and largely ignore more informative analysts’ forecasts. Maines and McDaniel (2000) also provide experimental evidence that non-professional investors lack investment expertise and have ill-defined valuation models. Consequently, we conjecture that retail investors are less capable of mining large volumes of past data necessary for anticipating the predictable aspects of analyst forecast errors. Hence, we expect that individual investors’ reaction to the predictable component of AFE will not be complete before and during the earnings announcement, and they will continue to respond to this component of AFE in the post-earnings announcement period. This leads to our first directional hypothesis:
Given retail investors’ limited expertise and processing capabilities, it is unlikely that they will be able to interpret and assimilate the component of earnings surprise that is unpredictable and truly surprising. This motivates our second directional hypothesis:
More sophisticated market professionals, such as institutions, are more likely than individuals to anticipate the predictable aspect of analyst forecast error by gleaning necessary information from large volume of publicly available data (Bushman et al., 1996; Fischer & Verrecchia, 1999). Institutions’ advantage over retail investors in processing information also stems from their superior resource bases (Clement, 1999; Jacob et al., 1999). Institutional traders also herd on earnings news, however (Chen et al., 2017). Overall, however, we expect that institutional investors’ reaction to the predictable component of AFE should be (more) complete. Thus, our third directional hypothesis is as follows:
Given institutional investors’ superior expertise and vast resource bases, it is plausible that they are able to quickly assimilate the news contained in the unpredictable component of AFE promptly after the earnings announcement. Furthermore, institutions also enjoy access to private information (e.g., Ali et al., 2004; Brown et al., 2015). Announcements for which institutions have access to ample and credible private information, even a portion of the unpredictable component of AFE is likely preempted. Consequently, one could argue that there will be little or no under-reaction to the unpredictable component of AFE by institutions in the post-earnings announcement period.
On the contrary, a growing literature argues that when investors are truly surprised, they may take time to vet and incorporate new information. Brav and Heaton (2002) argue that extant models of behavioral heuristics are mathematically similar to Bayesian rational information processing frameworks wherein subjects slowly process signals that have greater parameter uncertainty. Hong and Stein (1999) develop a model that shows that firm-specific information diffuses slowly across investors, and the speed of diffusion is a function of the complexity of the information. Several empirical studies provide evidence consistent with the theoretical predictions (Cohen & Lou, 2012; Gleason & Lee, 2003). Consequently, ex ante, it is unclear whether institutions promptly assimilate the unpredictable portion of earnings news within the short earnings announcement window, or they take time to verify and digest truly unexpected information. Hence, we propose the following non-directional hypothesis:
Prior research documents that a non-trivial fraction of PEAD is clustered around the next quarterly earnings announcement as abnormal returns are predictably concentrated around the subsequent earnings release (e.g., Ayers et al., 2011; Bernard & Thomas, 1990; Cao & Narayanamoorthy, 2012). This suggests that some investors continue to under-react to earnings surprises one full quarter after the earnings announcement. Clearly, the individual investor clientele is the prime candidate for such a delayed response to earnings news. It is, however, unclear whether the drift around the subsequent quarterly earnings announcement is driven by individuals’ under-reaction to the predictable component, or the unpredictable component, or both. Therefore, we propose the following sets of hypotheses concerning individual investors’ reactions around the next quarterly earnings announcement to the current predictable and unpredictable components of AFE:
Given institutions’ superior expertise, large resource bases, and access to private information, they are able to process new and surprising information relatively quickly. There is also intense competition for information among institutions because their trading profit is contingent on swift and efficient response to public announcements (Baron et al., 2018; Foucault et al., 2016). Therefore, it is highly unlikely that institutional investors fail to assimilate even the unexpected portion of the earnings surprise one full quarter after the earnings announcement. These arguments motivate our final set of predictions concerning institutions’ reactions around the next quarterly earnings announcement to the current predictable and unpredictable components of AFE:
Data and Sample
We collect financial analysts’ earnings forecasts and actual earnings per share (EPS) figures of all quarterly earnings announcements from 1983 onwards published by the Institutional Brokers Estimation System (I/B/E/S). We use the I/B/E/S file that is unadjusted for stock splits. We collect stock price and returns data from Center for Research in Security Prices (CRSP) database and obtain financial statement information from Standard and Poor’s Compustat database. Data for institutional holdings are collected from Thomson-Reuters Institutional Holdings (13F) Database. Drawing on Livnat and Mendenhall (2006), we require that the earnings announcement date recorded in I/B/E/S be within 1 day of the earnings announcement reported in Compustat to ensure the correctness of our sample announcement dates. We also stipulate the stock price to be greater than US$1 to alleviate small denominator effects and require the book value of equity to be greater than US$5 million to exclude very small firms with low liquidity.
We use three different approaches to generate estimates of the predictable component of AFE. These prediction models employ numerous explanatory variables and we require non-missing data items to compute these variables. Furthermore, these models are estimated using 12-quarter rolling-window regressions, and as a result, the first 3 years’ observations are not included in our empirical analyses. The sample for our primary empirical analyses is composed of 78,814 quarterly earnings announcements from 1986 to 2011.
Finally, we collect a subset of institutional transactions of U.S. equity between 1999 and 2010 compiled by Abel Noser Solutions, a consulting firm that helps institutional investors to analyze transaction costs. The Abel Noser database covers approximately 10% of all U.S. institutional trading activity (Cready et al., 2014). The database uses a unique identifier for each institution and provides the complete transaction history of institutional orders, including the CUSIP codes of stocks traded, execution date, execution time, execution price, the number of shares executed, an indicator of whether the execution is a buy or sell, and the commissions, fees, and taxes paid on the execution.
Research Design and Empirical Results
Estimating the Predictable and Unpredictable Segments of AFE
Following prior research, we employ three different approaches to capture the various aspects of the strategic interactions between managers and analysts to arrive at an estimate of the predictable portion of AFE. AFE is defined as the actual EPS minus the median value of analysts’ forecasts issued within 90 days prior to the earnings announcement, scaled by the stock price at the fiscal quarter end date. First, we closely follow the approach outlined in Barton and Simko (2002) and Abarbanell and Park (2017) and estimate the following Logit regression to generate a likelihood of meeting or beating analysts’ earnings expectation (MBE):
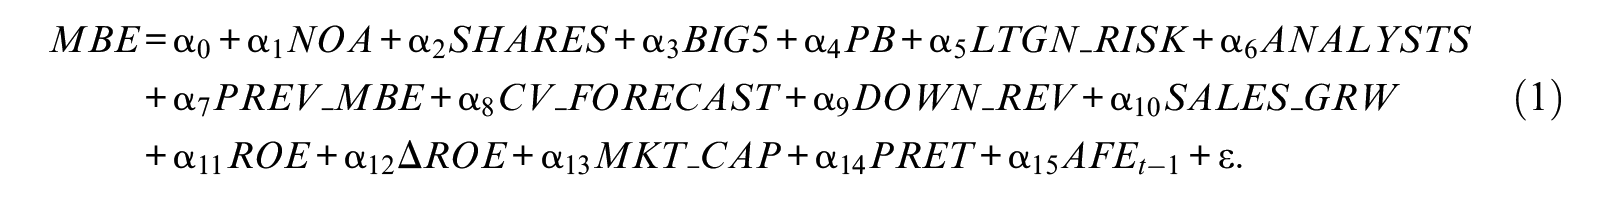
Detailed definitions of variables are provided in the Appendix. The independent variables included in Model 1 are intended to capture managers’ attempts to inflate reported earnings, managers’ efforts to guide analysts, analysts’ actions to curry favor with managers, and predictable patterns of analysts’ under-reaction to pre-disclosure information.
Equation 1 is estimated using 12-quarter rolling-window Logit regression based on data from 1983 to 2011. Once the coefficients of the independent variables are estimated using a set of 12 quarters of data, they are then applied to the values of the independent variables in the prediction quarter (i.e., the 13th quarter following any 12-quarter estimation window) to generate an out-of-sample probability of meeting or beating AFE. 1 This ex ante probability of meeting or beating forecasts (denoted PMBE) represents the market’s expectation about the realized earnings surprise.
As PMBE represents a likelihood or probability of meeting or beating analysts’ consensus forecast, a linear decomposition of AFE using PMBE is not possible. Consequently, we resort to a simple algebraic manipulation to ascertain investors’ reactions to the predictable vis-à-vis the unpredictable components of AFE. We first express market’s reaction to earnings announcement as a function of both AFE and PMBE and a set of control variables:

where cumulative abnormal return, CAR, captures aggregate market’s reaction to earnings news. Assuming AFE contains both predictable and unpredictable components, while PMBE is an estimate of the predictable segment, Equation 2 can be rewritten as: 2

Rearranging and collecting common terms, the above equation can be represented as:

Consequently, when we estimate Equation 2, β1 captures the loading on the unpredictable component, while (β1+β2) represents the loading on the predictable component of AFE. Therefore, β2 denotes the difference between investors’ response to the predictable component and their reaction to the unpredictable portion.
Our second approach entails extracting the predictable component of AFE using OLS estimation. The dependent variable for this specification is AFE and we include the same set of independent variables utilized in Equation 1. We denote the predictable component of AFE obtained from this specification as PFEOLS. Fama-Macbeth coefficient estimates and p-values from this estimation are reported in Table 1.
Estimation of the Predictable Component of Analyst Earnings Forecast Error.
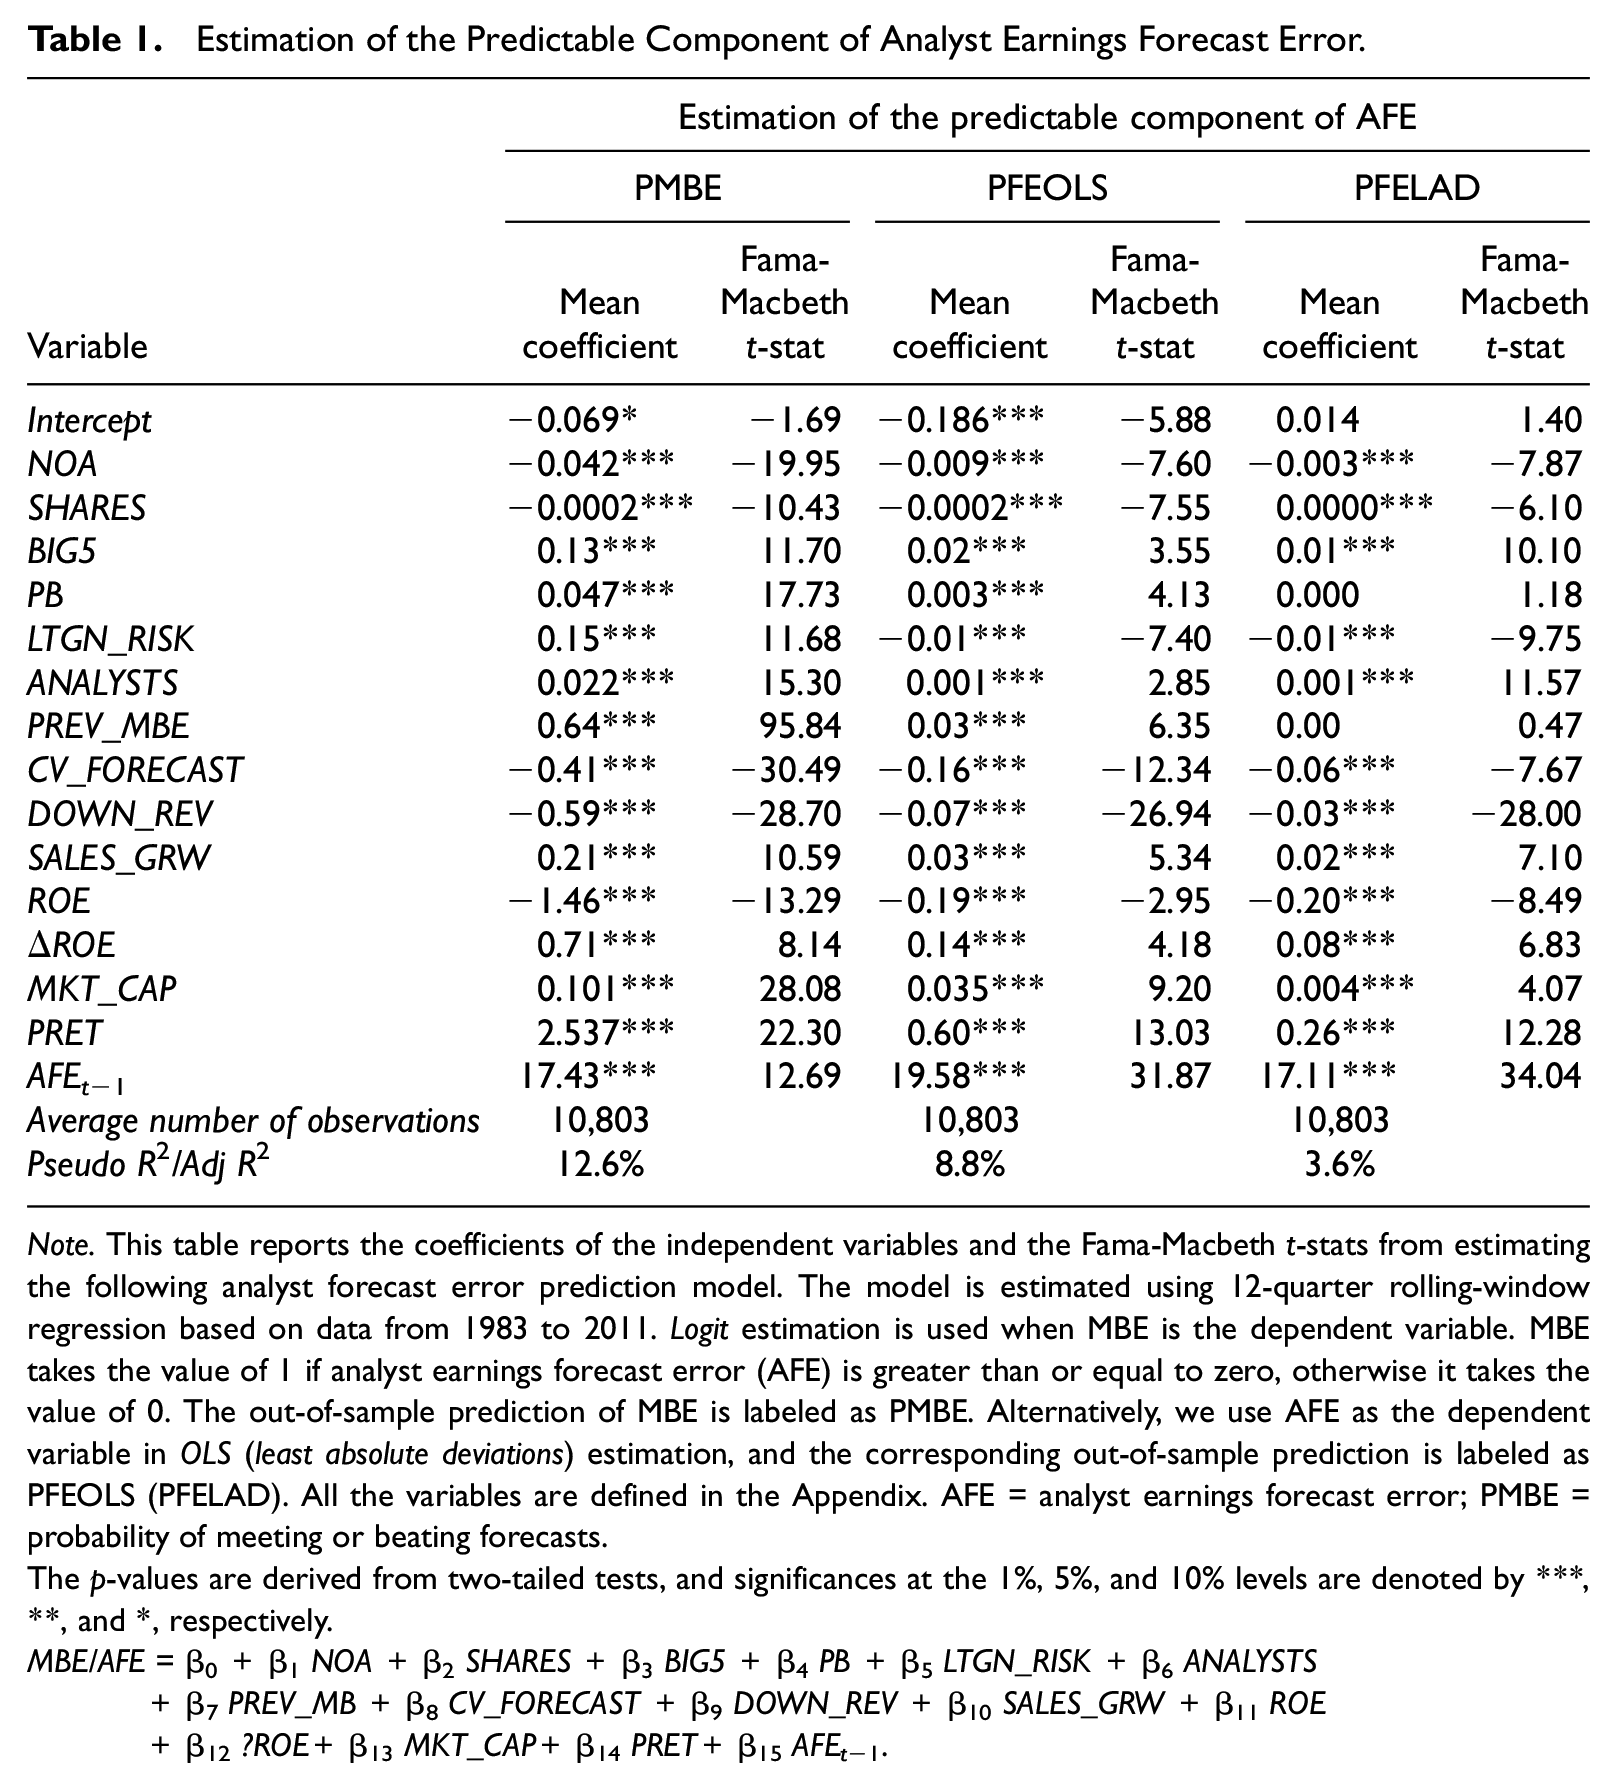
Note. This table reports the coefficients of the independent variables and the Fama-Macbeth t-stats from estimating the following analyst forecast error prediction model. The model is estimated using 12-quarter rolling-window regression based on data from 1983 to 2011. Logit estimation is used when MBE is the dependent variable. MBE takes the value of 1 if analyst earnings forecast error (AFE) is greater than or equal to zero, otherwise it takes the value of 0. The out-of-sample prediction of MBE is labeled as PMBE. Alternatively, we use AFE as the dependent variable in OLS (least absolute deviations) estimation, and the corresponding out-of-sample prediction is labeled as PFEOLS (PFELAD). All the variables are defined in the Appendix. AFE = analyst earnings forecast error; PMBE = probability of meeting or beating forecasts.
The p-values are derived from two-tailed tests, and significances at the 1%, 5%, and 10% levels are denoted by ***, **, and *, respectively.
MBE/AFE =β0+β1NOA +β2SHARES +β3BIG5 +β4PB +β5LTGN_RISK +β6ANALYSTS +β7PREV_MB +β8CV_FORECAST +β9DOWN_REV +β10SALES_GRW +β11ROE +β12ΔROE+β13MKT_CAP+β14PRET+β15AFEt−1.
Our final approach involves a procedure outlined in Hughes et al. (2008). They implement a specification involving least absolute deviations (LAD) instead of least square deviations to generate an estimate of the expected component of AFE. They argue that LAD is a more robust estimator and it is less influenced by outliers. The expected component of AFE is labeled as PFELAD. Again, Table 1 reports the results of this estimation.
For ease of exposition and to facilitate comparisons across the three approaches, we employ the regression specification outlined in Equation 2 for all three approaches. Hence, Equation 2 takes the following more general form, where CAR captures aggregate market’s reaction to earnings news:

In this specification, PREDICTABLE stands for the predictable component of AFE and is measured using PMBE, PFEOLS, and PFELAD. This specification confers another advantage. One of the study’s objectives is to understand the different forces that drive PEAD in the two post-earnings announcement windows. Including AFE and PREDICTABLE simultaneously in a regression model enables us to ascertain how a subset of investors adjusts the traditional PEAD trading strategy (embodied by AFE) by incorporating the predictable component into their expectation. For example, a significantly negative β2 will indicate that the profitability of the traditional PEAD strategy is diminished (the magnitude of β2 capturing the degree of attenuation) once investors incorporate a portion of analysts’ earnings expectation. 3
We include book-to-market ratio (BM), market beta (BETA), and financial leverage (LEV) as control variables in the regression model. Our measure of abnormal return is the size-adjusted stock return obtained from CRSP. 4 We follow the approach outlined in prior PEAD literature and transform our independent variables into decile ranks (e.g., Ke & Ramalingegowda, 2005; Liang, 2003; Livnat & Mendenhall, 2006). To facilitate interpretation, as in Livnat and Mendenhall (2006), we multiply the stock returns by 100 to convert them to percentages.
We examine several earnings announcement and post-announcement windows in our analyses. Our earnings announcement window is a 3-day period centered on the earnings announcement day. Thus, CAR t [−1, 1] is the cumulative abnormal returns over a 3-day window centered on the current quarter’s earnings announcement date (day 0). We tabulate results for two immediate post-earnings announcement windows spanning: (a) day 2 through day 16 and (b) day 2 through day 31. Hence, CAR t [2, 16] stands for cumulative abnormal returns from days 2 to 16, while CAR t [2, 31] represents cumulative abnormal returns from days 2 to 31. Finally, we examine a 3-day window centered on the next quarter’s earnings release; CARt+1 [−1, 1] is the cumulative abnormal returns over a 3-day window centered on the next quarter’s earnings release date.
To investigate how less sophisticated individual investors vis-à-vis sophisticated institutional investors react to the predictable and the unpredictable components of AFE, we follow a large body of prior work and use institutional ownerships from 13F disclosures as a proxy for institutional, relative to individual, trading activities (e.g., Bartov et al., 2000; Ivashina & Sun, 2011; Sias & Starks, 1997; Walther, 1997). We modify Equation 3 in the following way to introduce the institutional holding proxy:

HI_IH is the institutional holding proxy, and it takes the value of 1 if a firm’s institutional holding is greater than the median institutional holdings in a given calendar quarter, and it is 0 otherwise. 5 Thus, HI_IH takes the value of 1 (0) in firms where the trading clientele is primarily institutions (individuals). As earlier, the PREDICTABLE independent variable is measured using PMBE, PFEOLS, and PFELAD. As we interact HI_IH with both AFE (containing the predictable and unpredictable components of forecast error) and PREDICTABLE (representing the predictable portion of forecast error), individual and institutional investors’ reactions to the predictable and unpredictable components are determined as follows. Individual investors’ reaction to the unpredictable segment of AFE is captured by γ1, and their response to the predictable segment is captured by the sum of γ1 and γ2. Likewise, institutional investors’ response to the unpredictable component of AFE is represented by the sum of γ1 and γ4. Finally, institutional response to the predictable component is given by the sum of γ1, γ2, γ4, and γ5.
We also corroborate our findings regarding institutional reactions to earnings news using complete stock transactions history for a subset of institutions compiled by Abel Noser Solutions. These data enable us to actually track buy/sell trading activities of institutions on a day-by-day basis. We adopt the approach outlined in Chae (2005) and compute an institutional abnormal trading response metric in the following way. First, we define the daily net buy volume measure (hereafter, daily net buy) for each firm by subtracting the sum of all institutional sell transactions of that firm on that day from the sum of all institutional buy transactions of the same firm on the same day, and scaling the measure by the number of shares outstanding. Next, we compute the average daily net buy measure in the pre-announcement period by taking the mean of daily net buy measures over days −40 to −11, where day 0 is the earnings announcement day of the current quarter. We calculate institutional abnormal trading over days 2 to 31, IAT t [2, 31], by subtracting the pre-announcement average daily net buy from the average daily net buy over days 2 to 31. Likewise, we calculate IATt+1 [−1, 1] by subtracting the pre-announcement average daily net buy from the average daily net buy over days −1 to +1 around the next quarterly earnings announcement (day 0 being the next quarterly earnings announcement date). We estimate the following model to ascertain how institutional abnormal trading responses in the two post-earnings announcement windows are influenced by the predictable and unpredictable components of AFE:

The dependent variable is institutional abnormal trading response (IAT). We include a few additional control variables in this model. Prior research documents a negative association between firm-specific information asymmetry and trading volume (e.g., Chae, 2005; Copeland & Galai, 1983; Venkatesh & Chiang, 1986). Our proxy for information asymmetry is average daily bid-ask spread scaled by average daily stock price over days −70 to −41 (SPREAD). Overall market liquidity is argued to be positively related to firm-specific trading volume (Bamber et al., 1999; Kim & Verrecchia, 1991). Consequently, we include a proxy for market-wide liquidity (MKTVOL). It is calculated as the log of average daily trading volume in NYSE and NASDAQ scaled by the average outstanding shares in these two exchanges, and these averages are calculated over the same windows used for computing the dependent variables. Firm size is inversely related to trading volume (Bamber et al., 1999), and our SIZE variable, computed as the market value of equity, accounts for this association. Prior work also shows that institutional investors’ decisions to follow a firm depend on the firm’s growth potential as well as its riskiness (Bushee, 2001; Bushee & Noe, 2000). Thus, we use BM to account for growth prospect, and BETA and LEV to control for risk, and these variables are defined earlier.
Reactions to the Predictable and Unpredictable Components of AFE in the Short Window Surrounding the Earnings Announcement
We begin our empirical analysis by examining aggregate market’s reactions to the predictable and unpredictable components of AFE in the short window surrounding the earnings announcement. Hence, we estimate Equations 3 and 4 when CAR t [−1, 1] is the dependent variable. Untabulated results show that investors react strongly to the unpredictable component of AFE. We also observe that (as denoted by the significance levels from the F-tests) for PMBE, PFEOLS, and PFELAD, implying that investors also react to the predictable component. Thus, investors (at least a subset of them) do not seem to fully incorporate the predictable aspects of the strategic interactions between managers and analysts before the earnings announcement. Finally, the coefficient on PREDICTABLE (β2) is significantly negative for PMBE, PFEOLS, and PFELAD, indicating that investors react much more strongly to the unpredictable component (the “pure surprise” portion) compared to the predictable component, which seems consistent with the notion that the predictable segment has been partially preempted. Turning to reactions regarding investor clienteles, we find that individual investors react to both the unpredictable and predictable components. Similar results are obtained for institutional investors, but their reaction to the predictable component is significantly smaller than that of individual investors. These results suggest that individuals as well as institutions do not fully incorporate the predictable aspect of AFE before the earnings announcement. The evidence is consistent with the Bayesian sequential learning framework that suggests that belief revision takes place even when actual realization simply corroborates a prior belief (e.g., Brav & Heaton, 2002).
Reactions to the Predictable and Unpredictable Components of AFE in the Weeks Immediately Following the Earnings Announcement
We again first examine the overall market’s responses to the predictable and unpredictable components of AFE in the weeks immediately following the earnings announcement. Thus, we estimate Equation 3 using CAR t [2, 31] as the dependent variable. Table 2 reports results of this estimation. We find that the coefficient on AFE, β1, is highly significantly positive for each of the forecast error predictability measures (PMBE, PFEOLS, PFELAD). This suggests that investors under-react to the unpredictable component of AFE in the weeks immediately following the earnings announcement. Significantly negative coefficient on PREDICTABLE, β2, in all three columns suggests that the market’s response to the predictable component is significantly smaller than its reaction to the unpredictable component. The sum of β1 and β2 is insignificant in all three columns, suggesting that investors’ reaction with regard to the predictable component of AFE is complete in the [2, 31] post-announcement window.
Market’s Reactions to the Predictable and Unpredictable Components of Analyst Earnings Forecast Error in the Weeks Immediately Following the Earnings Announcement.
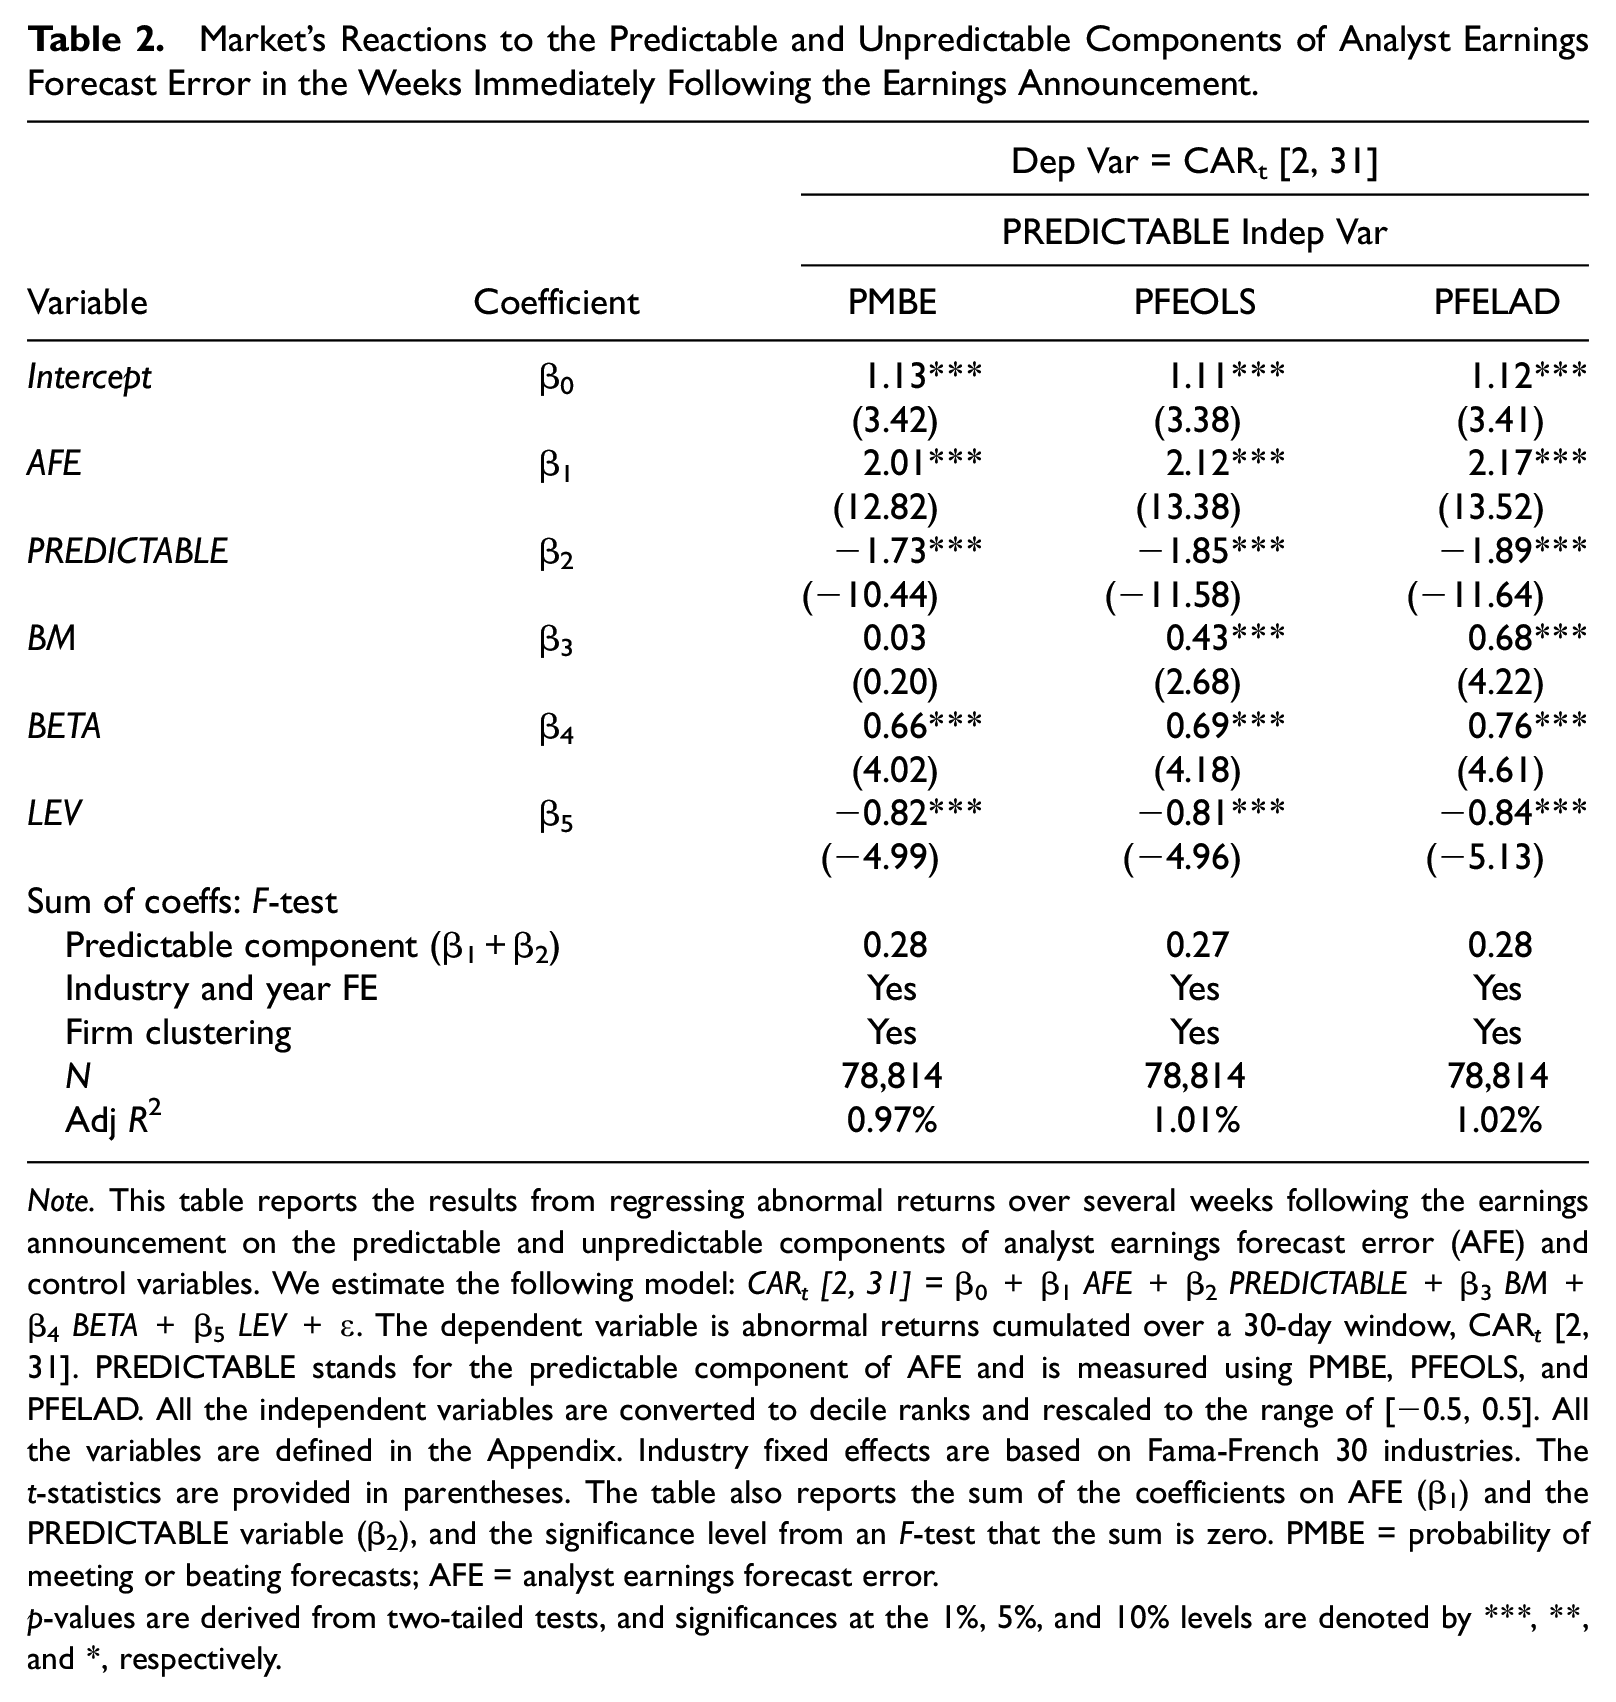
Note. This table reports the results from regressing abnormal returns over several weeks following the earnings announcement on the predictable and unpredictable components of analyst earnings forecast error (AFE) and control variables. We estimate the following model: CARt [2, 31] =β0+β1AFE +β2PREDICTABLE +β3BM +β4BETA +β5LEV +ϵ. The dependent variable is abnormal returns cumulated over a 30-day window, CAR t [2, 31]. PREDICTABLE stands for the predictable component of AFE and is measured using PMBE, PFEOLS, and PFELAD. All the independent variables are converted to decile ranks and rescaled to the range of [−0.5, 0.5]. All the variables are defined in the Appendix. Industry fixed effects are based on Fama-French 30 industries. The t-statistics are provided in parentheses. The table also reports the sum of the coefficients on AFE (β1) and the PREDICTABLE variable (β2), and the significance level from an F-test that the sum is zero. PMBE = probability of meeting or beating forecasts; AFE = analyst earnings forecast error.
p-values are derived from two-tailed tests, and significances at the 1%, 5%, and 10% levels are denoted by ***, **, and *, respectively.
In untabulated analysis, we estimate Equation 3 using CAR t [2, 16] as the dependent variable and find results very similar to those reported in Table 2. The only difference is that we find that two of the three F-statistics are significant: the sum of the coefficients on AFE and PMBE and the sum of the coefficients on AFE and PFEOLS are significantly positive. This indicates that some investors continue to under-react to the predictable component of AFE even after the earnings release. However, the magnitudes of these sums in the post-announcement period are appreciably smaller than those during the announcement window. 6 Collectively, the results suggest that investors take time to assimilate portion of earnings news that is unpredictable and truly surprising, and under-reaction to the unpredictable component of AFE largely gives rise to the price drift in the weeks immediately after the earnings announcement.
We next investigate to what extent this under-reaction is attributable to institutional vis-à-vis individual trading activities. We estimate Equation 4 where CAR t [2, 31] is the dependent variable, and the results are reported in Panel A of Table 3. A positive and significant γ1 in all three columns indicates that individual investors react strongly to the unpredictable component of AFE in the weeks following the earnings announcement. The sum of (γ1+γ2) is also significantly positive suggesting that individuals respond strongly to the predictable component as well in this window. Thus, individuals seem unable to fully incorporate the predictable aspects of AFE even several weeks after the earnings announcement. These results are consistent with H1a and H1b.
Institutional and Individual Investors’ Reactions to the Predictable and Unpredictable Components of Analyst Earnings Forecast Error in the Weeks Immediately Following the Earnings Announcement.
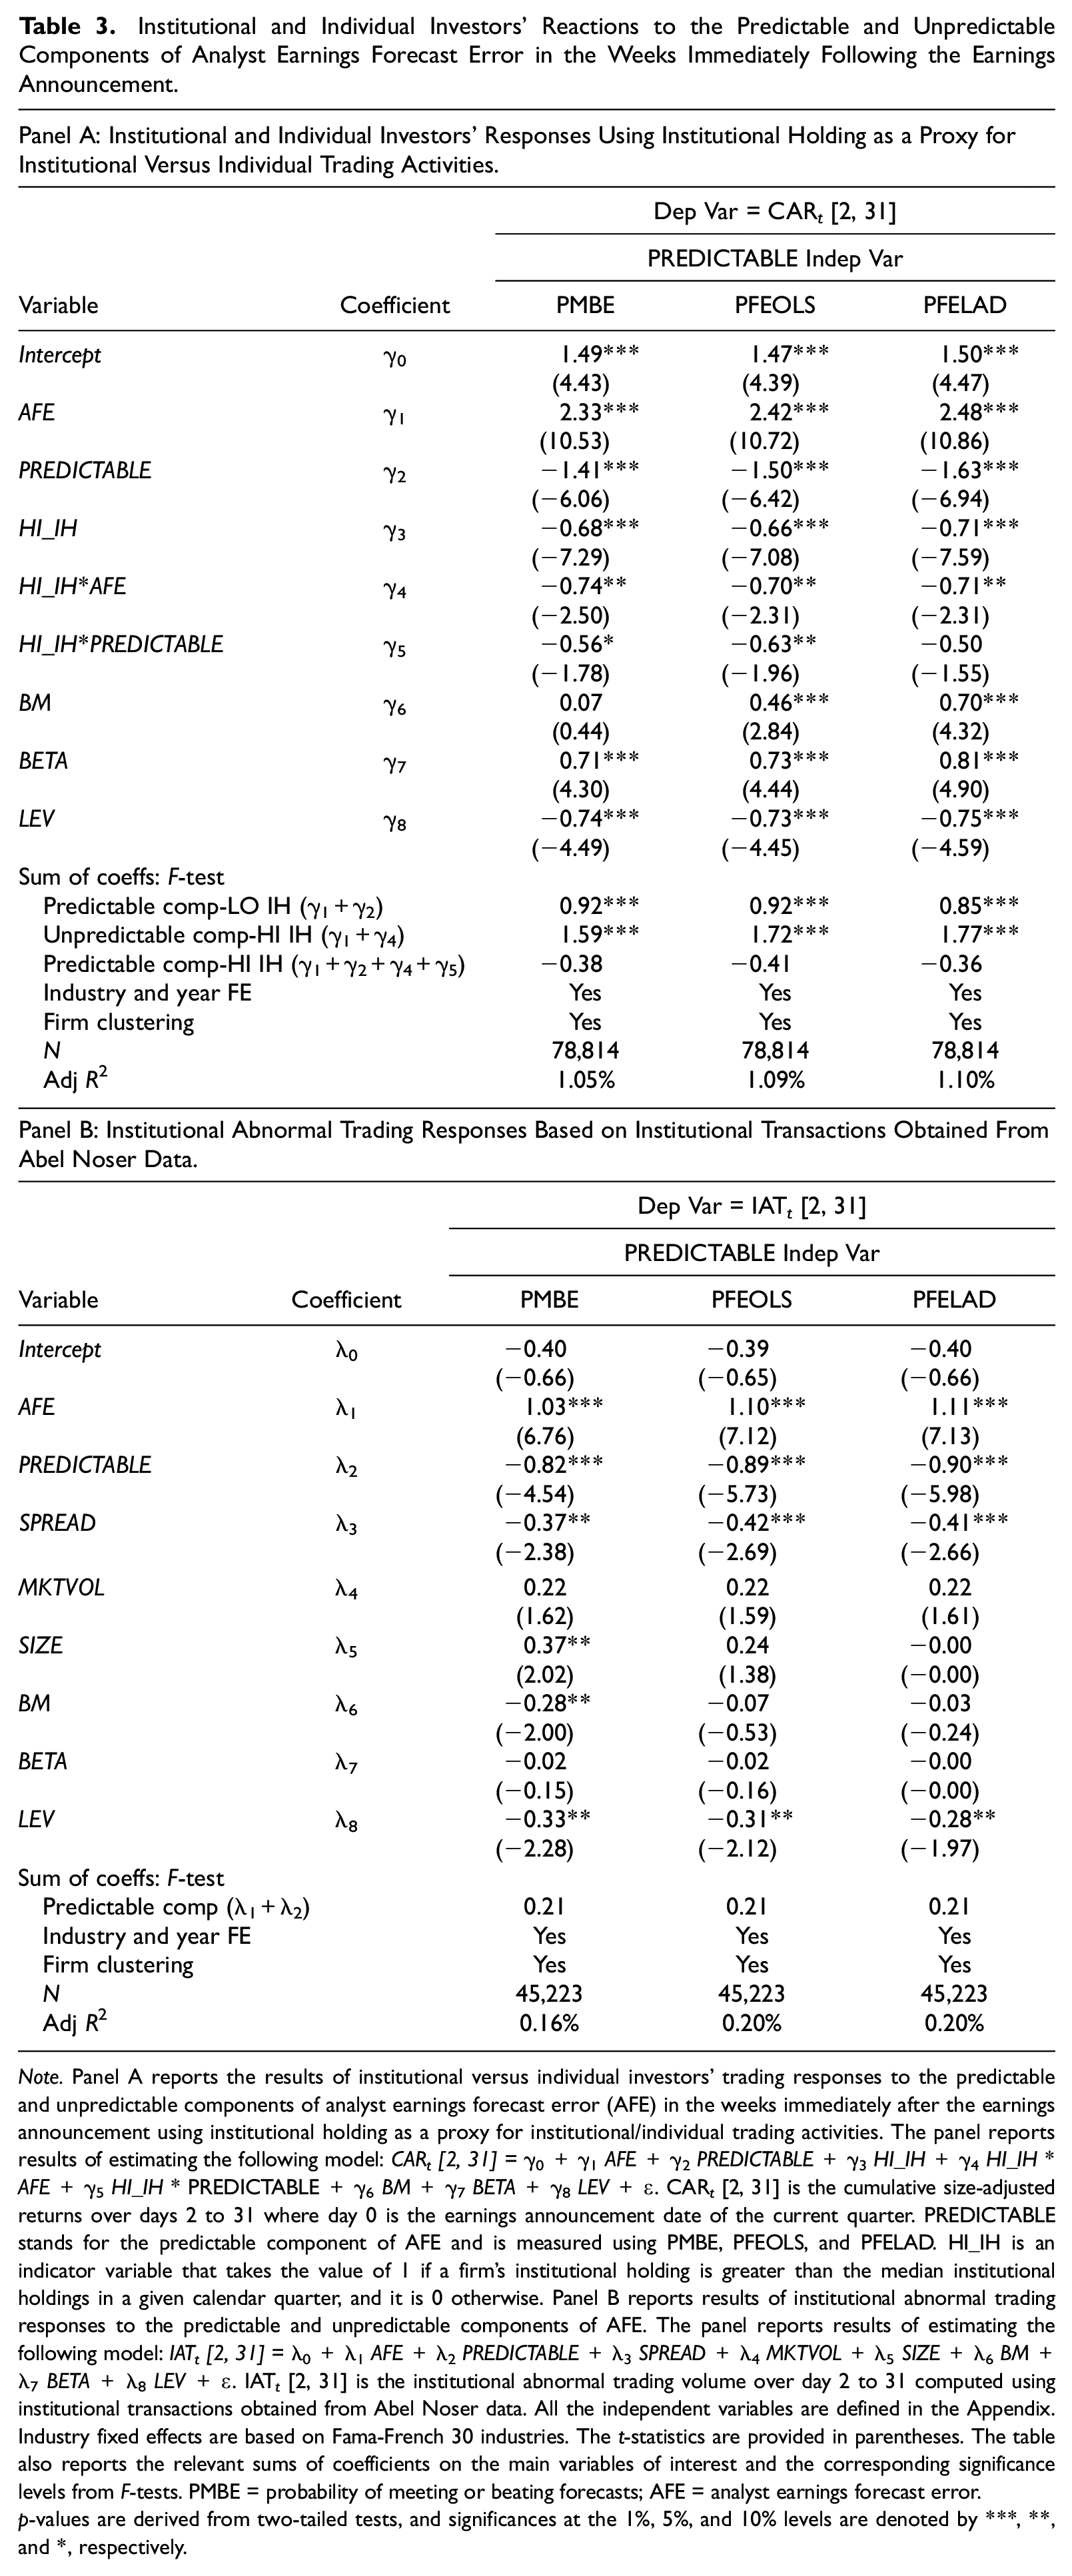
Note. Panel A reports the results of institutional versus individual investors’ trading responses to the predictable and unpredictable components of analyst earnings forecast error (AFE) in the weeks immediately after the earnings announcement using institutional holding as a proxy for institutional/individual trading activities. The panel reports results of estimating the following model: CARt [2, 31] =γ0+γ1AFE +γ2PREDICTABLE +γ3HI_IH+γ4HI_IH * AFE+γ5HI_IH* PREDICTABLE +γ6BM +γ7BETA +γ8LEV +ϵ. CAR t [2, 31] is the cumulative size-adjusted returns over days 2 to 31 where day 0 is the earnings announcement date of the current quarter. PREDICTABLE stands for the predictable component of AFE and is measured using PMBE, PFEOLS, and PFELAD. HI_IH is an indicator variable that takes the value of 1 if a firm’s institutional holding is greater than the median institutional holdings in a given calendar quarter, and it is 0 otherwise. Panel B reports results of institutional abnormal trading responses to the predictable and unpredictable components of AFE. The panel reports results of estimating the following model: IATt [2, 31] =λ0+λ1AFE +λ2PREDICTABLE +λ3SPREAD +λ4MKTVOL +λ5SIZE +λ6BM +λ7BETA +λ8LEV +ϵ. IAT t [2, 31] is the institutional abnormal trading volume over day 2 to 31 computed using institutional transactions obtained from Abel Noser data. All the independent variables are defined in the Appendix. Industry fixed effects are based on Fama-French 30 industries. The t-statistics are provided in parentheses. The table also reports the relevant sums of coefficients on the main variables of interest and the corresponding significance levels from F-tests. PMBE = probability of meeting or beating forecasts; AFE = analyst earnings forecast error.
p-values are derived from two-tailed tests, and significances at the 1%, 5%, and 10% levels are denoted by ***, **, and *, respectively.
We further observe that the sum of γ1 and γ4 is also significantly positive in all columns indicating that institutions also take some time to assimilate the information that is unpredictable. We, however, find no evidence that institutions under-react to the predictable component of AFE; the sum of γ1, γ2, γ4, and γ5 is insignificant for all three measures of the PREDICTABLE variable. Thus, our evidence supports H2a, that is, institutions’ reaction to the predictable portion of AFE is complete. Regarding the non-directional hypothesis H2b, our evidence suggests that even sophisticated institutional investors take time to verify and digest unexpected information, and as a result, under-react to the unpredictable component of AFE.
To further assess the robustness of our finding reported in Panel A of Table 3, we simultaneously control for firm size, analyst following, idiosyncratic volatility, and high turnover that are known to affect PEAD, and are also correlated with institutional holdings (Alford & Berger, 1999; Gompers & Metrick, 2001; Mendenhall, 2004; O’Brien & Bhushan, 1990). Untabulated results confirm that our main inference is robust to controlling for these various additional factors and alleviate the concern of a potential correlated omitted variable bias.
Next, we confirm our findings regarding institutional trading responses using institutional transactions history for a subset of institutions compiled by Abel Noser Solutions. We estimate Equation 5 where IAT t [2, 31] is the dependent variable and report these results in Panel B of Table 3. In all three columns, the coefficient on AFE (λ1) is highly significantly positive indicating that institutions continue to under-react to the unpredictable component of AFE. However, institutions’ reaction to the predictable component of AFE is complete; the sum of λ1 and λ2 is never significant. Thus, our analysis using actual institutional trades confirms our prior findings based on institutional holding as a coarse proxy for institutional trading response.
In sum, we observe that individual investors continue to under-react to both the predictable and unpredictable components of AFE in the weeks following the earnings announcement. In contrast, institutions under-react to the unpredictable segment of AFE in this window, while their reactions to the expected segment seem complete. These results also explain our prior finding that the price drift immediately following the earnings announcement is driven primarily by investors’ under-reaction to the unpredictable component. Aggregate market returns are shaped more by institutional responses than by individual responses. As institutions’ reaction to the predictable segment is complete and they only under-react to the unpredictable segment, it is not surprising that post-earnings abnormal returns are correlated primarily with the unpredictable segment.
Reactions to the Predictable and Unpredictable Components of AFE Around Next Quarter’s Earnings Announcement
As before, we first examine the association of abnormal returns around the next quarterly earnings announcement (quarter t+1) with components of AFE in the current quarter (quarter t). 7 Thus, we estimate Equation 3 where CARt+1 [−1, 1] is the dependent variable, and the results of this estimation are reported in Table 4. We find that the coefficient on AFE (β1) is not significant, suggesting investors, on average, do not react to the unpredictable component of AFE. This is not surprising because the unpredictable component of AFE in period t is not expected to persist into period t+1. Surprisingly, the predictable component of AFE significantly loads (the sum of β1 and β2 is significantly positive) in all three columns. Also, the coefficient on the PREDICTABLE variable (β2) is highly significantly positive in all three columns suggesting that investors’ response to the predictable component is substantially higher than their response to the unpredictable component. This surprising result suggests that some investors fail to fully comprehend the persistence of the predictable component, and they are surprised when quarter t+1 earnings are announced and trade on the predictable component. Interestingly, these results indicate that the price drift surrounding the next quarter’s earnings announcement is likely attributable to investors’ under-estimation of the persistence of the predictable component from the quarter before.
Market’s Reactions Surrounding the Next Quarterly Earnings Announcement to the Predictable and Unpredictable Components of Analyst Earnings Forecast Error From the Current Quarter.
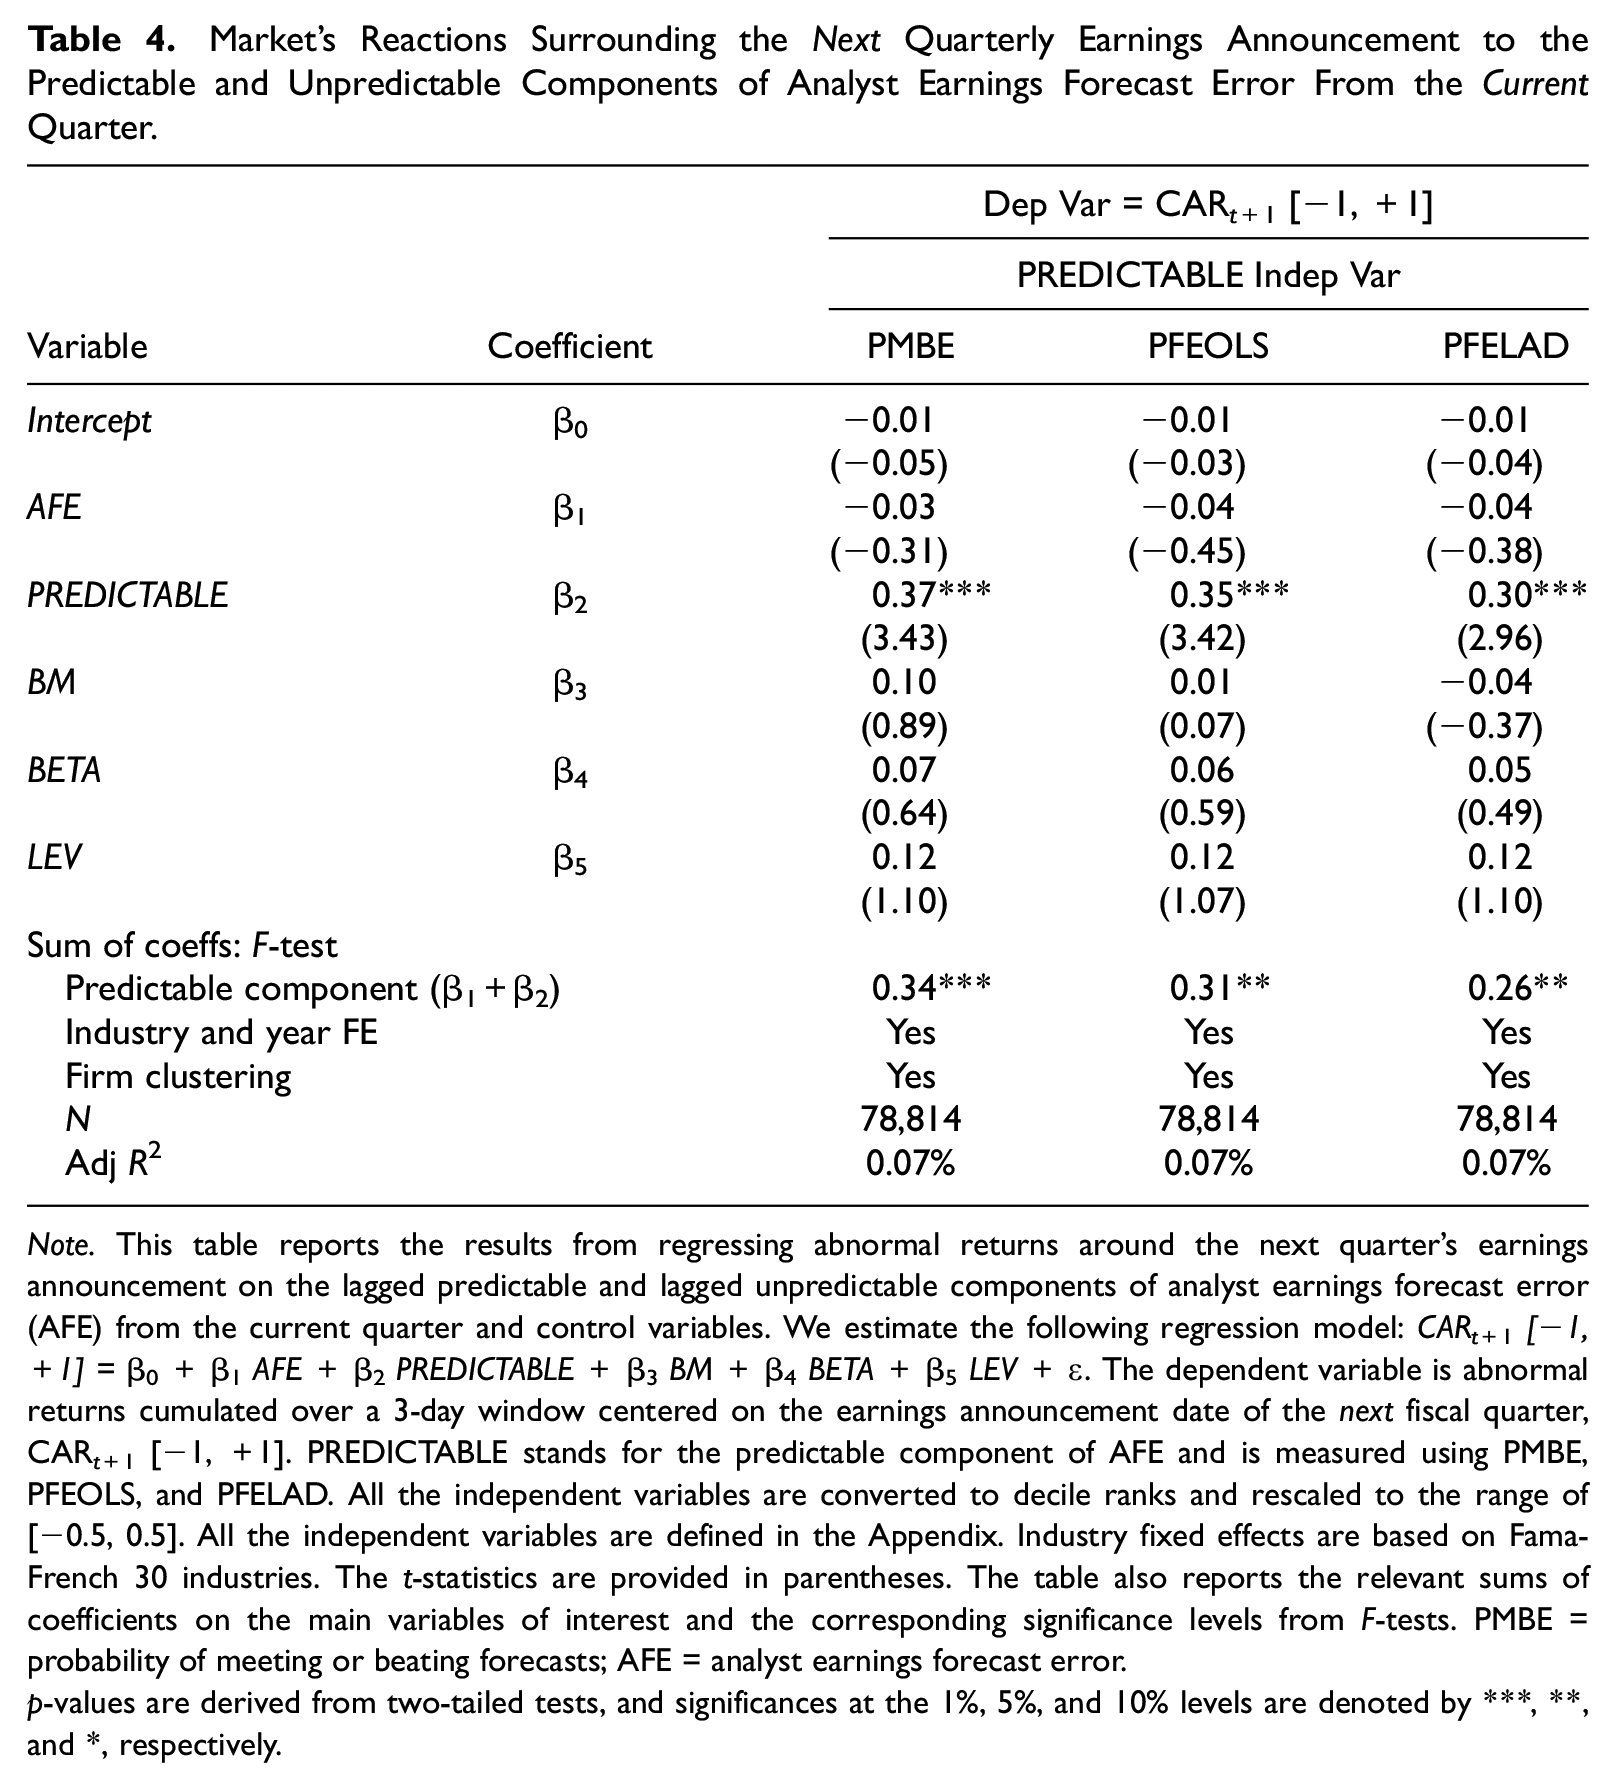
Note. This table reports the results from regressing abnormal returns around the next quarter’s earnings announcement on the lagged predictable and lagged unpredictable components of analyst earnings forecast error (AFE) from the current quarter and control variables. We estimate the following regression model: CARt+1[−1, +1] =β0+β1AFE +β2PREDICTABLE +β3BM +β4BETA +β5LEV +ϵ. The dependent variable is abnormal returns cumulated over a 3-day window centered on the earnings announcement date of the next fiscal quarter, CARt+1 [−1, +1]. PREDICTABLE stands for the predictable component of AFE and is measured using PMBE, PFEOLS, and PFELAD. All the independent variables are converted to decile ranks and rescaled to the range of [−0.5, 0.5]. All the independent variables are defined in the Appendix. Industry fixed effects are based on Fama-French 30 industries. The t-statistics are provided in parentheses. The table also reports the relevant sums of coefficients on the main variables of interest and the corresponding significance levels from F-tests. PMBE = probability of meeting or beating forecasts; AFE = analyst earnings forecast error.
p-values are derived from two-tailed tests, and significances at the 1%, 5%, and 10% levels are denoted by ***, **, and *, respectively.
To understand what investor clienteles drive this fixation on the lagged predictable component of AFE around subsequent quarterly earnings announcement, we estimate Equation 4 where CARt+1 [−1, 1] is the dependent variable. The results of this estimation appear in Panel A of Table 5. We find that retail investors do not trade on the unpredictable component (i.e., γ1 is insignificant), while they trade vigorously on the predictable component of AFE from the quarter before (the sum of γ1 and γ2 is significantly positive for all measures of PREDICTABLE). Thus, our results are consistent with H3a (i.e., individuals under-react to the lagged predictable component), while they do not support H3b (i.e., individuals do not under-react to the lagged unpredictable component). We find no evidence that institutions trade on the lagged predictable component of AFE. We, however, find weak evidence that institutions trade in the opposite direction of the lagged unpredictable component of AFE; the sum of γ1 and γ4 is significantly negative at the 10% level in the first two columns and at the 5% level in the third column. Again, the overall inference is unchanged when we simultaneously control for firm size, analyst following, idiosyncratic volatility, and high turnover.
These results seem consistent with the following explanation. Institutions appear to fully grasp the persistence of the predictable component and do not react to it. Institutions, however, may erroneously attribute some persistence to the unpredictable component and trade accordingly. Consequently, when quarter t+1 earnings are announced and the transitory nature of the unpredictable component is revealed, institutional trading exhibits a slight reversal. Retail investors, however, fail to fully assimilate the persistence of the predictable component, and as a result, their ex ante trading on this component is insufficient. They, therefore, engage in ex post trading on the predictable component once the t+1 earnings are announced and the true persistence of the predictable segment is revealed. In sum, our results support H4a and H4b.
We continue to confirm our findings regarding institutional trading responses using institutional transactions data from Abel Noser database. We estimate Equation 5 where IATt+1 [−1,1] is the dependent variable and report the results in Panel B of Table 5. The panels show that there is no evidence that institutions trade on the lagged unpredictable component of AFE. Interestingly, the sum of λ1 and λ2 is significantly negative for all three measures of the predictable segment. This suggests that institutions trade in the opposite direction of the sign of the lagged predictable component of AFE. Note that Panel A of this table shows that in this interval, retail investors trade vigorously in the same direction of the sign of the lagged predictable component. Thus, our analyses using institutional trading data from Abel Noser confirm our findings based on 13F disclosures and provide stronger support for H4a and H4b.
In summary, our analyses thus far reveal two distinctly different types of price drifts in the two post-earnings announcement windows. PEAD in the weeks immediately after the earnings announcement is driven by both institutions’ and individual investors’ under-reactions to the unpredictable component of AFE. In contrast, PEAD around the next quarterly earnings announcement is attributable entirely to individual investors’ under-reaction to the predictable component of AFE from the quarter before.
Institutional and Individual Investors’ Responses Around the Next Quarterly Earnings Announcement to the Predictable and Unpredictable Components of Analyst Earnings Forecast Error From the Current Quarter.
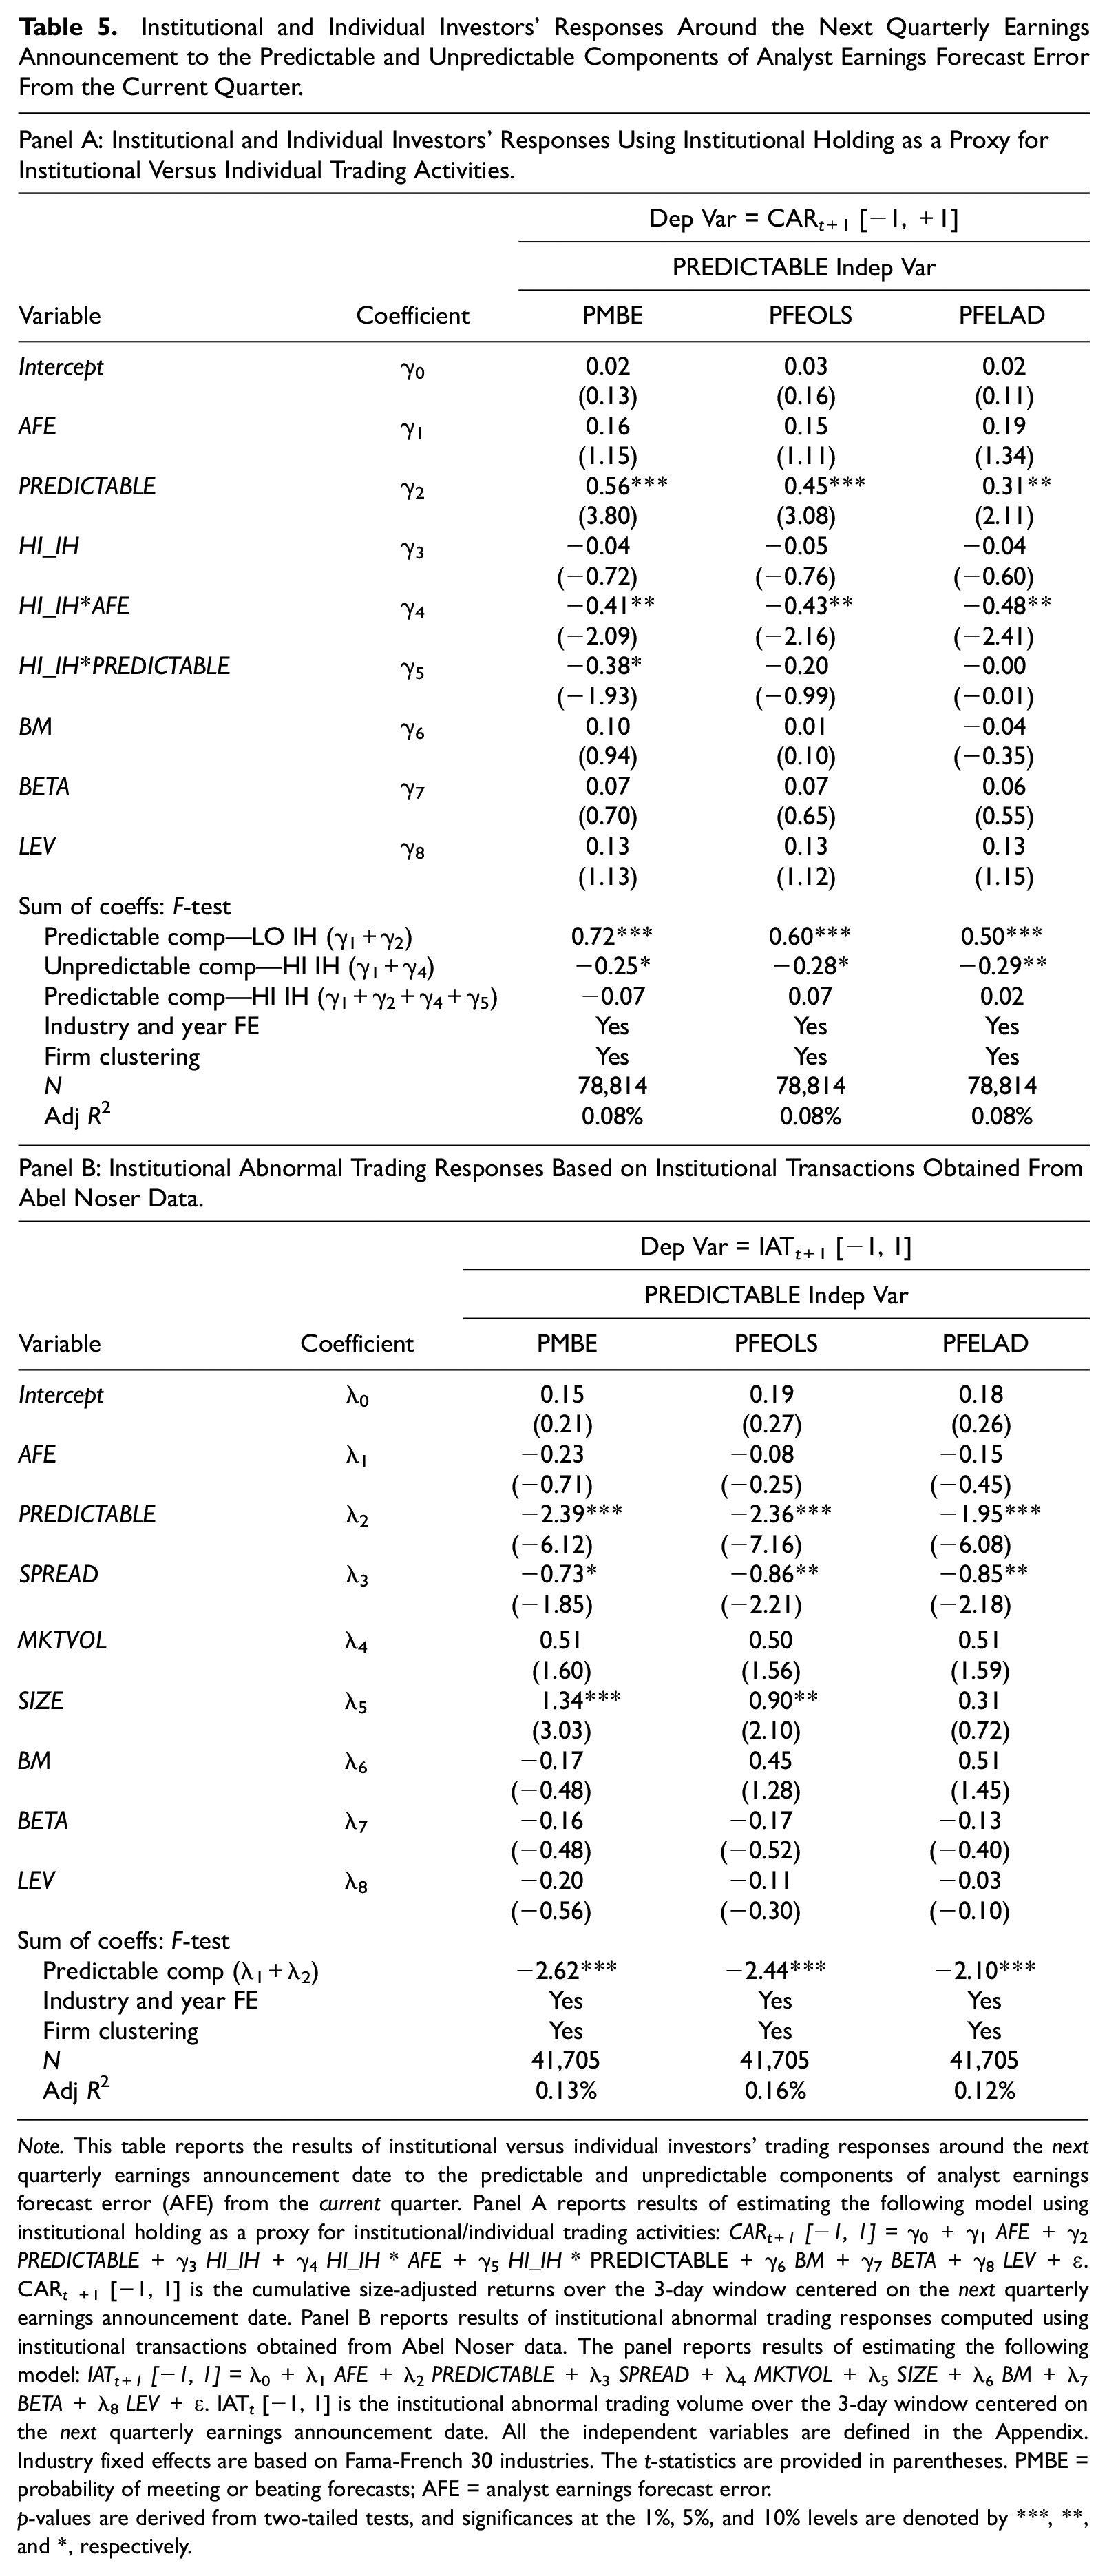
Note. This table reports the results of institutional versus individual investors’ trading responses around the next quarterly earnings announcement date to the predictable and unpredictable components of analyst earnings forecast error (AFE) from the current quarter. Panel A reports results of estimating the following model using institutional holding as a proxy for institutional/individual trading activities: CARt+1 [−1, 1] =γ0+γ1AFE +γ2PREDICTABLE +γ3HI_IH+γ4HI_IH * AFE+γ5HI_IH* PREDICTABLE +γ6BM +γ7BETA +γ8LEV +ϵ. CARt+1 [−1, 1] is the cumulative size-adjusted returns over the 3-day window centered on the next quarterly earnings announcement date. Panel B reports results of institutional abnormal trading responses computed using institutional transactions obtained from Abel Noser data. The panel reports results of estimating the following model: IATt+1 [−1, 1] =λ0+λ1AFE +λ2PREDICTABLE +λ3SPREAD +λ4MKTVOL +λ5SIZE +λ6BM +λ7BETA +λ8LEV +ϵ. IAT t [−1, 1] is the institutional abnormal trading volume over the 3-day window centered on the next quarterly earnings announcement date. All the independent variables are defined in the Appendix. Industry fixed effects are based on Fama-French 30 industries. The t-statistics are provided in parentheses. PMBE = probability of meeting or beating forecasts; AFE = analyst earnings forecast error.
p-values are derived from two-tailed tests, and significances at the 1%, 5%, and 10% levels are denoted by ***, **, and *, respectively.
Arbitrage Forces and Investor Under-Reactions in the Two Post-Earnings Announcement Windows
We next investigate to what extent the two distinct price drifts we document in the two different post-earnings announcement windows persist in firms with more binding limits to arbitrage. We use firm size as our first proxy of arbitrage cost as it has been used widely in the literature. We estimate the following model:

The dependent variable is CAR, and we separately examine the two post-earnings announcement windows mentioned earlier. Panel A of Table 6 reports results where CAR t [2, 31] is the dependent variable, while Panel B of Table 6 shows results where CARt+1 [−1, 1] is the dependent variable. The variable LRG_SIZE takes the value of 1 if a firm’s market value of equity is greater than the median value of all sample firms in a given calendar quarter, and it is 0 otherwise. Thus, δ1 represents investors’ reaction to the unpredictable segment of AFE for small firms, while the sum (δ1+δ2) denotes investors’ reaction to the predictable segment for small firms. The sum (δ1+δ4) captures investors’ reaction to the unpredictable component for large firms. Finally, the reaction to the predictable component in large firms is given by the sum of δ1, δ2, δ4, and δ5.
Intensity of Under-Reactions in the Two Post-Earnings Announcement Windows for Large Versus Small Firms.
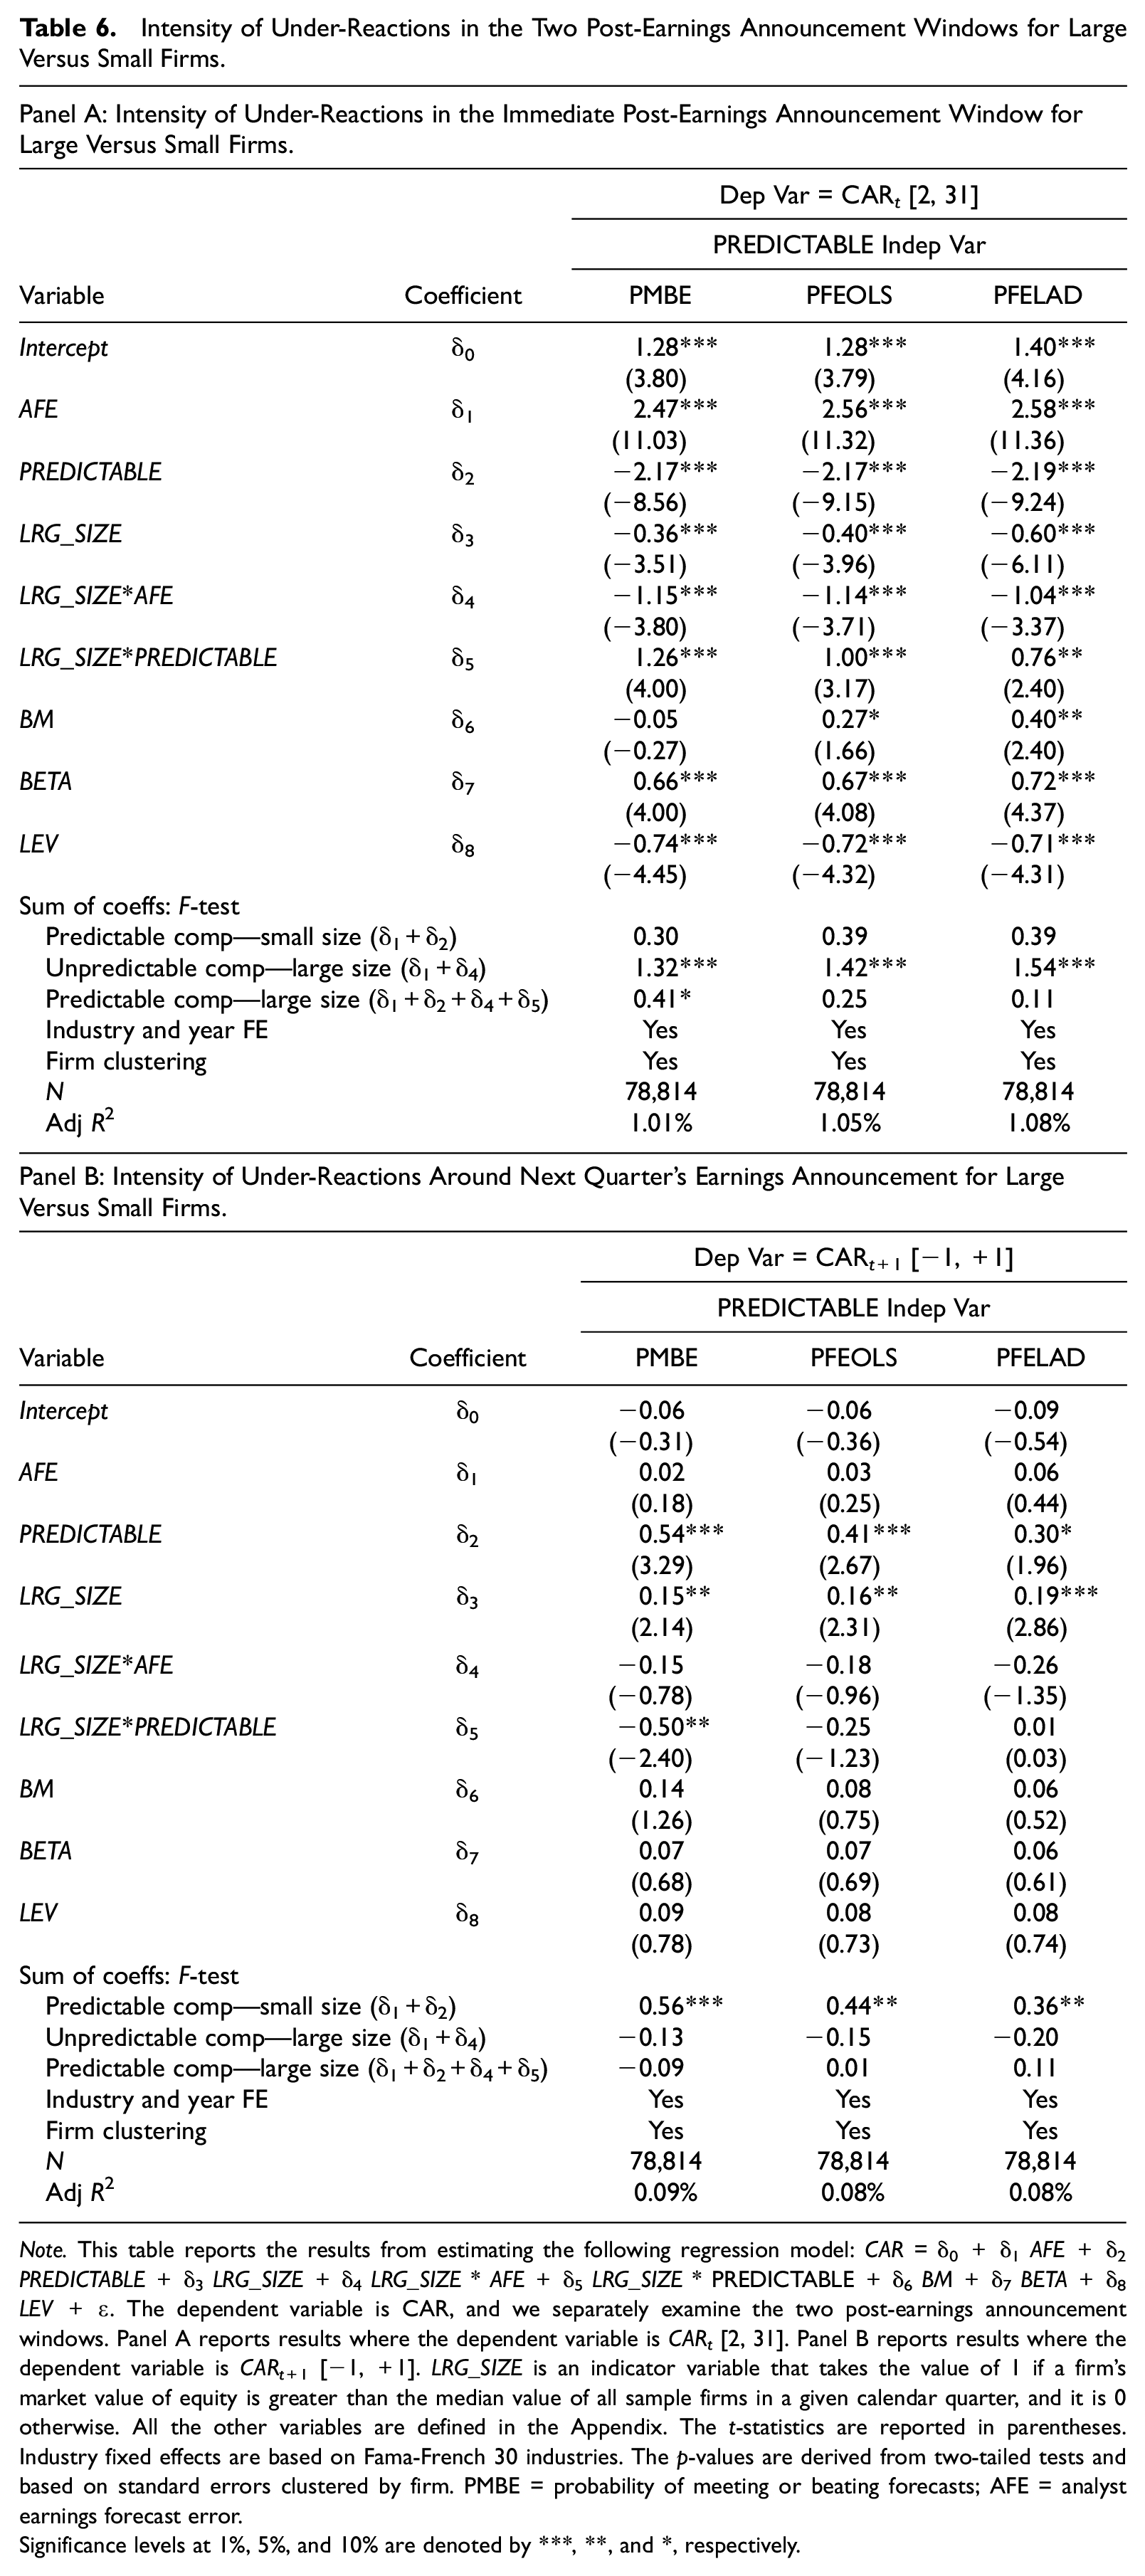
Note. This table reports the results from estimating the following regression model: CAR =δ0+δ1AFE +δ2PREDICTABLE +δ3LRG_SIZE+δ4LRG_SIZE * AFE+δ5LRG_SIZE* PREDICTABLE +δ6BM +δ7BETA +δ8LEV +ϵ. The dependent variable is CAR, and we separately examine the two post-earnings announcement windows. Panel A reports results where the dependent variable is CARt [2, 31]. Panel B reports results where the dependent variable is CARt+1 [−1, +1]. LRG_SIZE is an indicator variable that takes the value of 1 if a firm’s market value of equity is greater than the median value of all sample firms in a given calendar quarter, and it is 0 otherwise. All the other variables are defined in the Appendix. The t-statistics are reported in parentheses. Industry fixed effects are based on Fama-French 30 industries. The p-values are derived from two-tailed tests and based on standard errors clustered by firm. PMBE = probability of meeting or beating forecasts; AFE = analyst earnings forecast error.
Significance levels at 1%, 5%, and 10% are denoted by ***, **, and *, respectively.
We expect arbitrage forces to be stronger for larger firms. Table 6 shows that the unpredictable segment of AFE loads strongly for both small and large and firms; both δ1 and the sum (δ1+δ4) are significantly positive. In contrast, we find no consistent evidence that investors, on average, under-react to the predictable component of AFE. The predictable component of AFE does not load for small or large firms for the various definitions of PREDICTABLE except it loads only marginally in large firms for the PMBE measure. These results again confirm our prior finding that the price drift in the weeks immediately following the earnings release is attributable to investors’ under-reaction to the unpredictable component of AFE. But more importantly, we find evidence that arbitrage forces do not eliminate this drift. The under-reaction to the unpredictable component attenuates, but it is still highly significant even for larger firms (the sum of δ1 and δ4 is significantly positive in all three columns) where information arbitragers are active and arbitrage cost is low. Turning to Panel B where CARt+1 [−1, 1] is the dependent variable, we observe that the unpredictable segment does not load anywhere for small or large firms. Interestingly, the predictable segment loads significantly in all three columns, but only for small firms; it is never significant for large firms.
Using analyst following as an alternative proxy for arbitrage intensity, we find results that are nearly identical to those reported in Table 6. To conserve space, we do not tabulate the results based on analyst following. Collectively, the analyses reported in this section reveal that PEAD in the weeks immediately after the earnings announcement is attributable to both individual and institutional investors’ under-reaction to the unpredictable segment of AFE. This drift persists in larger, heavily followed firms, and therefore, conventional “limits to arbitrage” argument is incapable of explaining this drift. In sharp contrast, PEAD around the next quarterly earnings announcement is driven entirely by individual investors’ under-reaction to the predictable component of AFE from the quarter before. This mispricing, however, is concentrated in smaller, thinly followed firms and completely arbitraged away in larger, more visible firms.
Further Inquiry Into the Underlying Dynamics of Price Drifts in the Two Post-Earnings Announcement Windows
In this section, we attempt to gain insights into the underlying processes that drive the two qualitatively different price drifts in the two post-earnings announcement periods. As documented earlier, the price drift during several weeks following the earnings announcement is driven primarily by investors’ under-reaction to the unpredictable component of AFE, suggesting that investors take longer to digest new and unexpected information. Furthermore, this drift persists in large, liquid firms, implying that the under-reaction is unlikely to be a manifestation of temporary mispricing that information arbitragers can readily exploit. Therefore, the under-reaction in this period seems at least partially attributable to the slow and noisy process through which investors discover the new equilibrium price. This line of reasoning suggests that investors’ under-reaction to the unpredictable component will further intensify in firms where the information environment is relatively less transparent and earnings signals are more difficult to interpret. We test this conjecture by borrowing a measure of financial statement opacity from Hutton et al. (2009). In an untabulated test, we find that investors’ under-reaction to the unpredictable component is further exacerbated when the underlying information is more complex, further confirming the notion that the price drift in the immediate post-announcement window represents investors’ efforts to unravel complex information and discover the new equilibrium price.
We next turn our attention to the earnings announcement of next quarter and try to understand what induces investors to trade on the predictable component of AFE from the quarter before. As documented earlier, the drift in this period is driven entirely by retail investors, and these investors likely lack the necessary expertise to incorporate autocorrelations in quarterly earnings. To test this possibility, we split our sample based on the degree of autocorrelations in adjacent quarter AFEs. Our untabulated test shows that the drift around the next quarter’s earnings release is concentrated only in firms with high autocorrelations in adjacent quarter forecast errors, further supporting the notion that this drift is attributable to retail investors’ failure to fully incorporate in their expectation the time-series nature of quarterly earnings.
Conclusion
Drawing on prior research, we use three alternative model specifications to incorporate the strategic interactions between analysts and managers as well as analysts’ forecasting biases to decompose AFE into a predictable component and an unpredictable or “true surprise” component. In the weeks immediately following the earnings release, we find that post-earnings abnormal returns are correlated primarily with the unpredictable segment of AFE. We next document that individuals under-react to both the predictable and unpredictable components of AFE. In contrast, institutions under-react only to the unpredictable portion, suggesting that even professional investors take time to assimilate information that is unexpected and surprising. In addition, we find that the price drift to the unpredictable component remains highly significant in larger firms and is more pronounced in firms with more complex financial reports, suggesting that the drift in this period seems partially attributable to investors’ efforts to discover the new equilibrium price.
Surprisingly, we observe that abnormal returns around the subsequent quarterly earnings announcements are significantly correlated with the lagged predictable component (and not with the lagged unpredictable component) of AFE from the previous quarter. We observe that individual investors under-react to the lagged predictable component around the next quarterly earnings announcement, but their reaction is complete with respect to the lagged unpredictable component. Institutions’ reaction is complete with respect to both the lagged predictable and unpredictable components around the next quarterly earnings release. These results imply that the price drift to the lagged predictable segment of AFE around the subsequent quarterly earnings release is driven entirely by individual investors’ delayed reaction to this segment. Taken together, it appears that the drift around the next quarterly earnings announcement seems a manifestation of individual investors’ failure to fully incorporate the time-series properties of quarterly earnings.
Footnotes
Appendix
Authors’ Note
We would like to thank the Editors, and anonymous reviewers, and Qiang Cheng, Joe Comprix, Hemang Desai, Doug Hanna, Jim Linck, Russ Lundholm, Stan Markov, Craig Nichols, Katherine Schipper, Jake Thomas, Rex Thompson, Kumar Venkataraman, conference and seminar participants at the 2018 Journal of Accounting, Auditing and Finance Conference, the 2017 annual meeting of the American Accounting Association, the Singapore Management University, and Southern Methodist University for many helpful suggestions.
Declaration of Conflicting Interests
The author(s) declared no potential conflicts of interest with respect to the research, authorship, and/or publication of this article.
Funding
The author(s) received no financial support for the research, authorship, and/or publication of this article.