
Abstract
The regular pattern of quarterly earnings announcements sets up a predictable pattern of information asymmetry in the market. Both regulatory restrictions and voluntary corporate restrictions direct trading to low information asymmetry periods. To understand the effect of these restrictions, this study examines insider trading in three different windows: white windows (3–12 trading days after the earnings announcement, periods with low information asymmetry), black windows (all the other days in the quarter, periods with higher information asymmetry), and the blackest windows (the last 10 trading days of the black window, periods with the highest information asymmetry). First, our results show that a large proportion of insider trading in the United States takes place in the black window. Second, we document that trading in the white period exhibits a strong self-selection bias. We also show that the excess returns earned by black period trades vanish if postponed to the next white period following the earnings announcement. Finally, we show that a relatively large proportion of pre-specified trading under SEC-sponsored 10b5-1 plans are filed for black window periods, but the difference across black and white window plans is a matter of frequency of trade rather than the magnitude of profits. Overall, these results suggest that insiders balance the risk and profitability of their trading in white and black windows and that insider trading restriction in high-information asymmetry periods is not effective in practice.
Keywords
In the interest of transparency for this article, which was co-authored by the editor, the editor wishes to add that the Journal’s peer review process used the following procedures: An Associate Editor managed the peer review of this article. Two independent reviewers provided comments and recommendations on the manuscript without knowledge of any author identities. After receipt of the reviews, the Associate Editor provided an Accept recommendation and the Editor made the official decision to Accept as is currently required on the peer review platform.
Introduction
Insider trading restrictions raise complex issues both from an economic perspective and a legal perspective. As a consequence, there are differing perspectives on how insider trading is to be regulated. In particular, trading by corporate insiders ahead of their earnings report is restricted in the United Kingdom but permitted in the United States as long as it is consistent with company policy. The main goal of this article is to analyze the timing pattern of insider trading in the United States relative to the timing of quarterly corporate earnings reports. Specifically, we establish that considerable trading takes place in the United States in time periods where insiders may be reasonably expected to have information about the next earnings report (such trading is prohibited in the United Kingdom) and that trades in these high-information asymmetry periods earn significant abnormal profits relative to benchmark returns models. Our findings suggest that internal corporate controls are not particularly effective in stopping insiders from capitalizing on foreknowledge regarding reported earnings.
Insider trading increases information flow to the markets (Manne, 1966, 1973) but insiders can extract rents from uninformed investors (Ausubel, 1990; Bebchuk & Fried, 2003; Leland, 1992). In addition, the fear of transacting with informed traders (i.e., adverse selection concerns) can reduce liquidity and thereby the information impounded in prices. Thus, the net effect of insider trading could result in an overall loss of informational efficiency (Fishman & Hagerty, 1992). Carlton and Fischel (1983) took this analysis one step further and suggested that the negative aspects of adverse selection could be avoided if insider trading can be clearly identified. Huddart et al. (2001) noted that mandatory disclosure of insider trades may result in insiders attempting to conceal information through complex trading strategies, but even such strategic behavior will not completely impede the flow of useful information to investors. In summary, the main thrust of the economic analysis in this area is to analyze the trade-off between the positive effects of increased information and the negative effects of adverse selection in a setting where insiders can trade freely but their trades are identified through timely disclosures.
Insider trading regulations mirror the arguments for the costs and benefits outlined in the academic literature. Trading is generally permitted, but the SEC is allowed to sanction insiders who trade on information that was obtained as part of fiduciary responsibilities. Prosecutions of insider trading typically invoke Section 10b-5 of the 1934 Securities Act which is very broad in scope and forbids the use of “any act or omission resulting in fraud or deceit in connection with the purchase of sale of any security.” The SEC has never tried to devise a statute that explicitly defines “illegal” insider trading. This lack of a statutory definition has recently led to a claim that any prosecution of insider trading is unconstitutional. 1
While the SEC has never tried to make explicit regulations about insider trading, Congress enacted in 1988 the Insider Trading and Securities Fraud Enforcement Act (“ITSFEA”) which expanded the powers of the SEC to prosecute insider trading. Specifically, the act authorized the SEC to impose civil penalties upon any person who directly or indirectly controlled the person who committed the illegal insider trading (Friedman, 1990). This provision led broker-dealers to exercise greater scrutiny over their clients and corporations to implement policies that ensured their employees’ trades conformed with the law. Bettis et al. (2000) examined how corporations were responding to their responsibility under ITSFEA for ensuring that their employees did not violate insider trading laws. They conducted a survey and found that 92% of their final sample (626 firms) had some insider trading policy and 78% had explicit blackout periods during which insiders are prohibited from trading. The most common corporate policy specified an “acceptable window for trade” (hereafter, white window) of 3 to 12 trading days after the earnings announcement and restricted or forbade trade outside this window (hereafter, black window). They found that “insider trading activity in the blackout period is less than one-third of that during allowed trading periods” and concluded that “our data indicate that blackout periods successfully suppress trading.”Bettis et al. (2000) is one of the most cited papers on corporate voluntary policies to restrict insider trading and many papers have used their framework. 2
However, to our knowledge, few papers have addressed trading outside the white window (i.e., in the black window), perhaps assuming that it is minimal. Contrary to Bettis et al. (2000), we find that about 33% of insider open-market trades (coded P or S on Form 4 disclosures) occurs in the white windows and 67% occurs in the black windows (Figure 1). This pattern is consistent across both insider purchases and insider sales (Figures 2 and 3)—both purchase and sale volumes are highest on trading days in white windows, but the volumes are still quite high (and never zero) on trading days in black windows. Figures 2 and 3 complement Figure 1 and show that insider trading in black windows result from both insider purchases and insider sales.
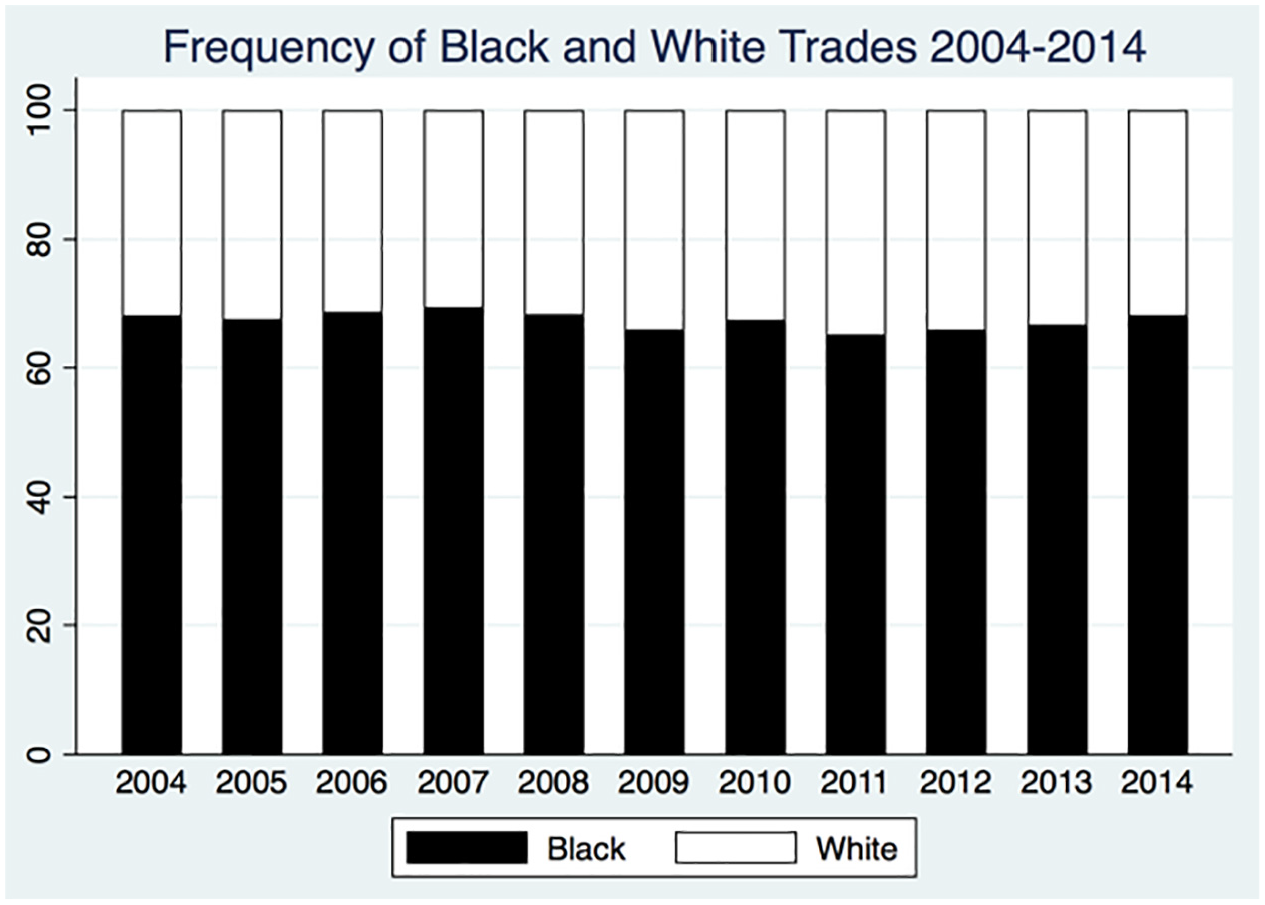
Frequency of black and white trades.

Frequency of insider purchases.
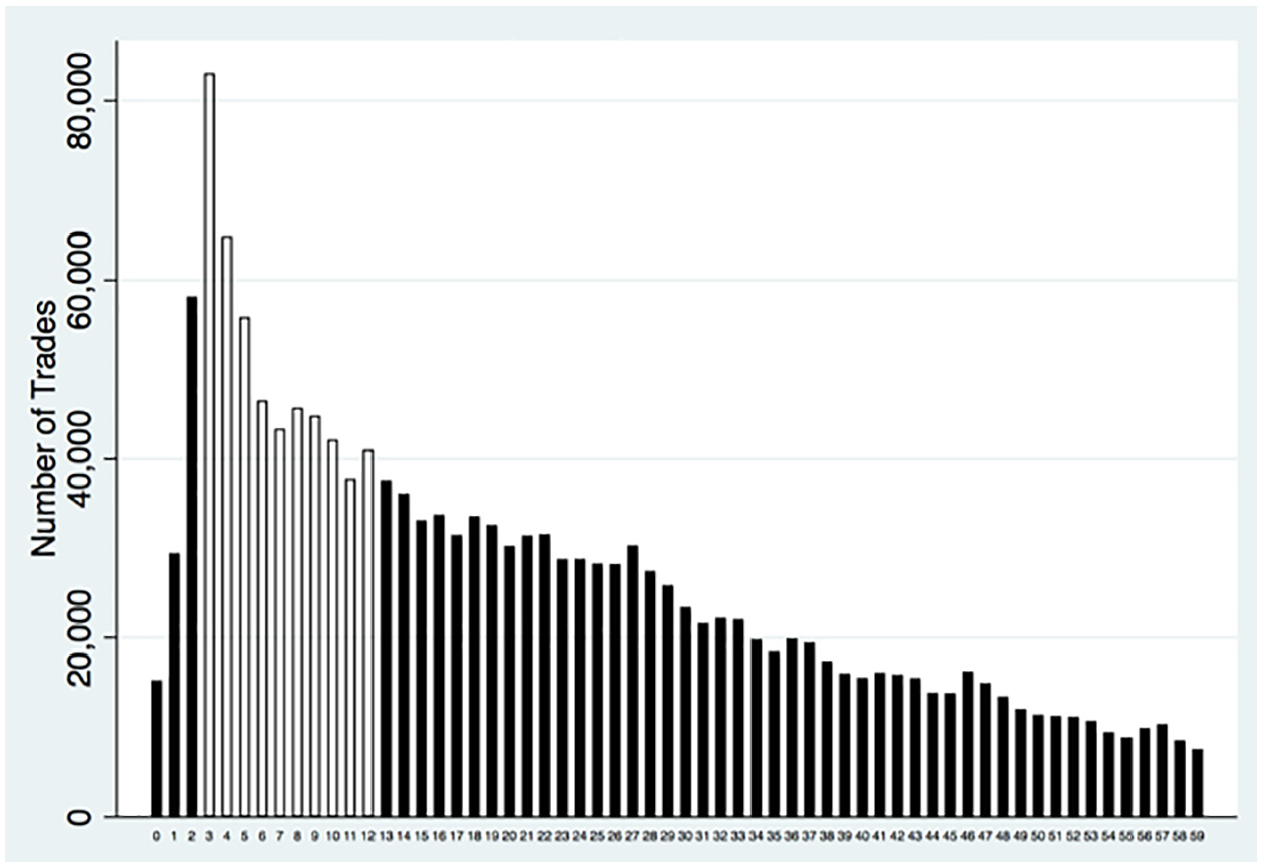
Frequency of insider sales.
The first question to ask is why our evidence differs markedly from the picture conveyed in Bettis et al. (2000). It is impossible to answer this conclusively because their paper collected data through a survey and cannot be replicated. Bettis et al. (2000) surveyed 1,915 firms about their voluntary insider trading policies in 1996. Their final sample includes 626 firms and a further 223 firms were eliminated for lack of other data and most of the tests focus on 403 firms. That is, their analysis covers less than 33% of the firms surveyed and their detailed information covers less than 25% of the firms. In addition, in their survey period, firms were still responding to the ITSFEA and were more sensitive to their risk under this act for trading conducted by their employees. So, firms that had no policies for regulating insider trading may not have wished to respond to the survey. This could have led to a severe self-selection bias in their sample. Bettis et al. (2000) are aware of the selection bias and presented their results with this condition: “If it is the case that the subsample reflects the population accurately, with minimal selection bias, then these figures represent the true population proportions.” Our study intends to use a more comprehensive data set to represent the true population proportions. Our sample includes 7,134 firms over 11 years starting from 2004 to 2014. The data are from mandatory disclosure forms required by the SEC and do not suffer from the self-reporting and self-selection issues.
Furthermore, how a company enforces its trading policy can be quite different from the policy itself. For example, a recent complaint (US SEC vs. Gene Daniel Levoff) 3 filed by the SEC discloses that Apple has a policy that no insider can trade in a black window for any reason. Apple sends emails each quarter several days before the black window starts reminding its employees of this policy. However, in practice, the enforcement of the policy is lacking. Insider trading is quite noticeable within the black window as evidenced by the many Form 4s filed by Apple. For all these reasons, our archival data set has very different characteristics and provides different insights from the data set of Bettis et al. (2000).
Our next step is to examine the profitability of insider trading in different windows. Besides white window and black window, we define a blackest window as starting from 8 days before the earnings announcement to the start of the white window which begins 2 days after the earnings announcement. Thus, a blackest window is right before a white window and has the same length (10 days), facilitating the comparison of trades across these two windows. The blackest windows are expected to have the highest information asymmetry within an earnings cycle. We find that insiders earn (avoid) significant profits (losses) in the white, black, and blackest windows for purchases (sales). This differs from some earlier studies that have not found significant returns to insider sales (e.g., Aboody & Lev, 2000; Huddart & Ke, 2007). The difference probably stems from the fact that we aggregate all trades in a particular window, whereas most other papers use a subsample of trades.
However, we do not find insider trading profitability in black windows to be higher than that in white windows. To understand this result better, we compare the profits from insider purchases (sales) in white windows with those from a strategy of purchasing (selling) stocks that exhibit a positive (negative) earnings surprise. We find that this public information-based trading strategy has a lower return than the actual white window insider trades. These results suggest that insiders earn extra abnormal returns by cherry-picking specific white windows to trade based on their private information rather than simply through exploitation of “good” (positive earnings surprise) and “bad” (negative earnings surprise) earnings.
We next examine what would happen if the blackest window trades were postponed to the next white window and find that trading profits drop through such a postponement. This finding suggests that the motivation for trading in the blackest window is related to information that will become public soon through this quarter’s earnings announcement and thus insiders choose to trade before the disclosure becomes public. 4
Finally, we examine the timing of 10b5-1 plans which are filed in advance with the SEC specifying long-term trading strategies. Unfortunately, as a matter of law, it is impossible to prosecute a trader if no transaction takes place, that is, if the planned trade is not executed. Therefore, 10b5-1 plans essentially provide an option to trade at the scheduled date which may be selectively exercised. Jagolinzer (2009) argues that both the initiation and termination of 10b5-1 are strategically timed to maximize this option value. We find that 10b5-1 plans are more likely to be filed in the blackest windows relative to the white windows, even though both white windows and blackest windows have the same length of time period, 10 trading days. In terms of the likelihood of trade, 80% of the trading under 10b5-1 plan takes place in the black window relative to 67% for non-10b5-1 trading, that is, 10b5-1 plans are more heavily concentrated in black windows than non-plan trades. Finally, we find that while the returns of 10b5-1 plan trading in white windows are similar to those of non-plan trades, this is not true for the black or blackest windows. The findings may be interpreted as follows. In the white windows, whether there is a 10b5-1 plan or not, insiders can trade whenever there is an opportunity for profit. On the contrary, in the black or blackest windows, some insiders may be precluded from taking advantage of profitable trading opportunities because they do not have the protection of a 10b5-1 plan, whereas those that have a pre-filed plan can capitalize on the opportunity.
The rest of this article is laid out as follows. In Section “Literature Survey, Insider Trading Laws, and Enforcement Rules,” we discuss the insider trading literature and regulatory background. In Section “Hypotheses Development,” we develop our hypotheses. In Section “Data,” we describe the data while the research design and empirical tests are presented in Section “Research Design.” The results are presented in Section “Results.” Section “Conclusion” concludes the article.
Literature Survey, Insider Trading Laws, and Enforcement Rules
There are three strands of literature pertinent to our study: (a) The information cycle associated with quarterly earnings report, (b) legal literature about regulation and enforcement pertaining to insider trading, and (c) empirical literature about the profitability of insider trading. We discuss each in turn starting with the information cycle before explaining how these themes relate to the analysis in our article.
Beaver (1968) argues that the magnitude of stock price changes should be larger immediately before the earnings announcement because investors take different positions based on their private beliefs regarding the impending news. More generally, French and Roll (1986) argue that stock return volatility is higher in any news period and lower in non-news period and this has been confirmed in many subsequent studies (e.g., Boudoukh et al., 2019). As applications, Lee et al. (1993) show that bid-ask spreads widen prior to the earnings announcement and the implied volatility of options, a traditional measure of uncertainty, drops significantly after the earnings announcement in most, but not all, cases. 5 Reduction of option volatility implies convergence in beliefs and decreasing value of private information. Our data set conforms to these traditional assumptions with regard to the earnings cycle: volatility is the lowest in the white window, higher in black windows, and the highest in the blackest window.
The conventional implication of this finding is that private information should be more valuable in the black and blackest windows rather than in the white window, that is, insiders hold the least informational advantage in the white window and represents the time period that corporations can allow their management to trade freely. As the quarter unfolds, insiders start acquiring information about the next quarter’s results and the level of asymmetric information starts to increase. In the last few days immediately preceding the earnings announcement, many insiders are aware of the earnings to be announced and have an informational edge over outside investors. It is this natural cycle of information asymmetry that we use in our analysis of insider trading.
The legal situation with regard to insider trading is complex and, as noted in the introduction, depends on case law rather than statutes. On one hand, the US SEC prohibits trading on the basis of “material” and “non-public” information that has been obtained in the course of performing corporate duties. On the other hand, the US SEC also acknowledges that “Many investors believe that reports of directors’ and executive officers’ transactions in company equity securities provide useful information as to management’s views of the performance.” 6 U.S. regulations try to balance these forces by approaching insider trading on a case-by-case basis rather than through a statute that distinguishes between legal and illegal insider trading. Although Section (16) of the 1934 Securities Act is more directly related to insider trading, most cases are brought under Section 10b-5 that pertains broadly to all types of market manipulation and only incidentally to insider trading. In particular, insider sales ahead of bad news may be used as evidence for proving scienter, that is, asserting that managers’ open-market sales reflected knowledge of bad news that was not disclosed in a timely fashion, but are rarely prosecuted in their own right. In any case, the number of insider trades in any given year is hundreds of thousands whereas the annual rate of prosecutions is about 50. 7 So, only extreme cases are typically addressed by the SEC.
The majority of the SEC prosecutions of directors and officers involve purchases ahead of a merger that has not yet been made public. 8 Such prosecutions may involve acting on direct knowledge or through the use of information obtained illegally from others. Prosecuting insider purchases is easier than prosecuting sales. Sales may be made because cash is needed for expenses or alternative investments and prosecution of sales typically involve some special circumstances, and the examples typically involve non-earnings-related information. 9 However, an open-market purchase is typically made for one main reason—a strong belief that the stock price will go up. 10 Uncertainties abound in case law; for example, in 2014, the first and second circuit appeals courts reached almost opposite judgments regarding the legality of information acquisition in the cases US vs. McPhail and US vs. Newman. For these reasons, the SEC is able to prosecute only the most blatant cases.
Given the limitations in the ability to prosecute insider trading, Congress enacted the ITSFEA in 1988, which, among other clauses that empower the SEC, imposed a burden on those who may control the insider either legally or constructively. The act introduced whistleblower awards and encouraged firms to introduce better controls over trading by insiders. However, by allowing employers in the securities industry to avoid liability for the actions of their employees in most instances, the act’s efficacy was reduced (Conard, 1992). In spite of this, Anderson (2016) argues that in response to the need for compliance of the ITSFEA without a clear definition of insider trading, “issuers adopt over-broad insider trading compliance programs that come at a heavy price in terms of corporate culture, cost of compensation, share liquidity, and cost of capital.”
While the main purpose of the ITSFEA was to curb potentially informed insider trading by shifting the burden of enforcement, Rule 10b5-1, enacted in 2000, followed a different approach. The idea here was to allow the insider to execute trades without profiting from inside information by planning a regular pattern of trades years in advance before any specific information became available. However, 10b5-1 plans do not compel trade—as a matter of law, nobody can be prosecuted if they fail to execute the planned trade. As a consequence, the 10b5-1 plans endowed the insider with an option to trade. While allowing insiders an orderly way to liquidate holdings, 10b5-1 also created opportunities for abuse. Jagolinzer (2009) argues that the initiation and termination of 10b5-1 plans exploited private information while Shon and Veliotis (2013) document that firms delay news until they are able to trade under the 10b5-1 plan.
The empirical literature on the returns following insider trading is quite extensive. In common with most of these papers, we only examine open-market trades that are not associated with option exercises or any other linked equity transaction. A sale following an option exercise is more likely to be driven by liquidity rather than informational concerns, and we exclude these transactions from our data in common with earlier studies (Jagolinzer, 2009; Ke et al., 2003; Kraft et al., 2014). All these studies as well as earlier literature such as Ausubel (1990), Leland (1992), and Bebchuk and Fried (2003) document abnormal returns following insider trades. Insider sales are less predictive of future negative returns than insider purchases are of future positive returns and some recent studies concentrate only on insider purchases (Gao et al., 2014). Other studies have tried to separate “routine” insider transactions from those driven by private information based on the regularity and frequency of the trades (Cohen et al., 2012) and shown that non-routine sales are predictive of future negative returns.
Hypotheses Development
Bettis et al. (2000) indicate that blackout period policies have successfully prevented black window insider trading among their surveyed firms. These arguments have been repeated either indirectly or directly in many subsequent studies such as Roulstone (2003), Ke et al. (2003), Cheng and Lo (2006) among others. We begin by hypothesizing that all insider trading occurs in the white window. This is the simplest test of the efficiency of regulation in stopping insiders from trading at time points where they are likely to hold inside information about earnings. We state this hypothesis in null form. 11
The rationale behind permissible insider trading windows is that there is less information asymmetry in the white windows. This is consistent with well-established findings such as reductions in the bid-ask spread and the implied volatility of options following earnings announcements. Based on this argument, we expect that white window returns to insiders should be insignificant, whereas there could be a positive profit from trading in the black window. However, there is a further point to be considered. Insider trading in the black window can be legitimate as long as the insider does not trade based on inside information. Furthermore, as black window trading may be vetted more carefully and may pose higher litigation risks, it is possible that profitable trades are blocked in black windows such that the total returns may be insignificant or even lower than white window trades. Under these arguments, it is unclear whether we should expect the cumulative abnormal returns (CARs) following a trade to be high in the black or blackest windows. Thus, we state our Hypothesis 2 in the null form as follows:
If white window returns turn out to be significant, a question arises as to whether this is unrelated to private inside information. In particular, it is well known that there is a drift following earnings announcements (Ball & Brown, 1968). Therefore, the returns earned by insiders may simply be a consequence of a stock price drift and not due to an informational edge. To answer this question, we examine whether a trading strategy based on post earnings announcement drift (PEAD) in every white window can explain the abnormal returns earned by insider trading in white windows. Our trading strategy based on PEAD consists of purchases in white windows after good earnings news and sales in white windows after bad earnings news. If the insiders trade only on publicly available news in the earnings reports, the actual trades that happened in the white windows selected by insiders should earn returns commensurate with our trading strategy. We summarize this argument in the next hypothesis.
As the blackest window (8 days before the earnings announcement to the start of the white window which begins 2 days after the earnings announcement) is right before the white window (3–12 trading days after the earnings announcement), we ask why insiders would choose to trade in the blackest window instead of postponing the trade to the upcoming white window, especially when the litigation risk of trading in the blackest window is much higher. It is reasonable to presume that insiders cannot postpone their trading and are willing to take this risk because they have private information that might be revealed in the earnings report. This leads to our next hypothesis that insiders will lose their information advantage if they play safe and wait to execute their trades in the next white window, which we state again in null form as follows:
10b5-1 plans were created primarily to allow insider sales that were compatible with the award of stock (or option) compensation. Jagolinzer (2009) finds that insiders execute sales under pre-registered 10b5-1 plans before bad news, generating abnormal forward-looking returns. On the contrary, Sen (2008) finds no significant differences in stock price performance following plan and non-plan sales. Shon and Veliotis (2013) also provide evidence of strategic exploitation of 10b5-1 plans with regard to voluntary news disclosures. Motivated by these arguments, we ask whether 10b5-1 plans are more likely to be scheduled in the black or blackest windows. Filing a 10b5-1 plan (either for purchases or sales) provides the insider with an option: they can either follow the plan or cancel it. As with any option, the greatest value comes in periods of greater uncertainty, that is, in the black or blackest windows. As 10b5-1 plans reduce the costs of being sanctioned for insider trading, we expect more trading in black windows under these plans. This leads us to the next hypothesis stated in the null form:
Our last hypothesis concerns the returns under 10b5-1 plans. The existence of a 10b5-1 plan protects insiders from potential liability and reduces risk. This might lead to offsetting effects with regard to the comparison of returns between plan trades and non-plan trades. On one hand, because there is no cost, insiders may be willing to make plan trades under weaker private information which might reduce the average return of plan trades relative to non-plan trades. On the other hand, insiders may be willing to trade even if it is clear they have valuable private information because they have the protection of a 10b5-1 plan whereas they forgo these trades in the absence of a plan. Taken together, we do not have a clear (directional) alternative to the following (null) hypothesis.
Data
Thomson Reuters TFN Insiders Data consists of two tables which cover the period starting from January 1, 1986. Table I of TFN Insiders Data contains non-derivative transactions and holdings information filed on Forms 3, 4, and 5. Table II contains derivative transactions and holdings information filed on Forms 3, 4, and 5. Officers, directors, and beneficial owners who own more than 10% of a company’s shares are required by Section 16(a) of the Securities and Exchange Act of 1934 to report any transaction to the SEC on Forms 3, 4, and 5. According to SEC regulations, the initial filing should be reported on Form 3 within 10 days of becoming an officer, a director, or a beneficial owner. Changes in ownership should be filed on Form 4 within two business days after a trade. Any transactions that should have been reported on Form 4 earlier or were eligible for deferred filing should be filed on Form 5. In this article, we focus on Form 4s which are reported under Table I, as those are the ones documenting insider trading. The sample consists of 5,882,837 transactions made by 152,269 insiders from 2004 to 2014. We eliminate transactions with a form type other than Form 4, and we only keep open-market transactions (transaction code “P” and “S”). Following Ke et al. (2003), Kraft et al. (2014), and many other papers in the insider trading literature, we exclude stock grants and option grants from the sample. Based on Ke et al. (2003), as the quantity and timing of grants of stock-based compensation are not entirely at the discretion of the insider who receives them, these transactions are not sensitive to insider information. We further eliminate all the transactions with shares less than 1 traded and with “cleanse” variable other than “H” or “R” which identifies the level of confidence in each record. “H” means all data cleansing updates were made with high confidence and “R” means record passed all cleansing checks for reasonableness. All this reduces the sample to 2,271,306 transactions. Furthermore, we match the trades with Compustat to identify the timing of the trade in a quarter and that reduces the sample to 1,934,097. Panel A of Table 1 presents the data collection procedure.
Data Collection and Summary.
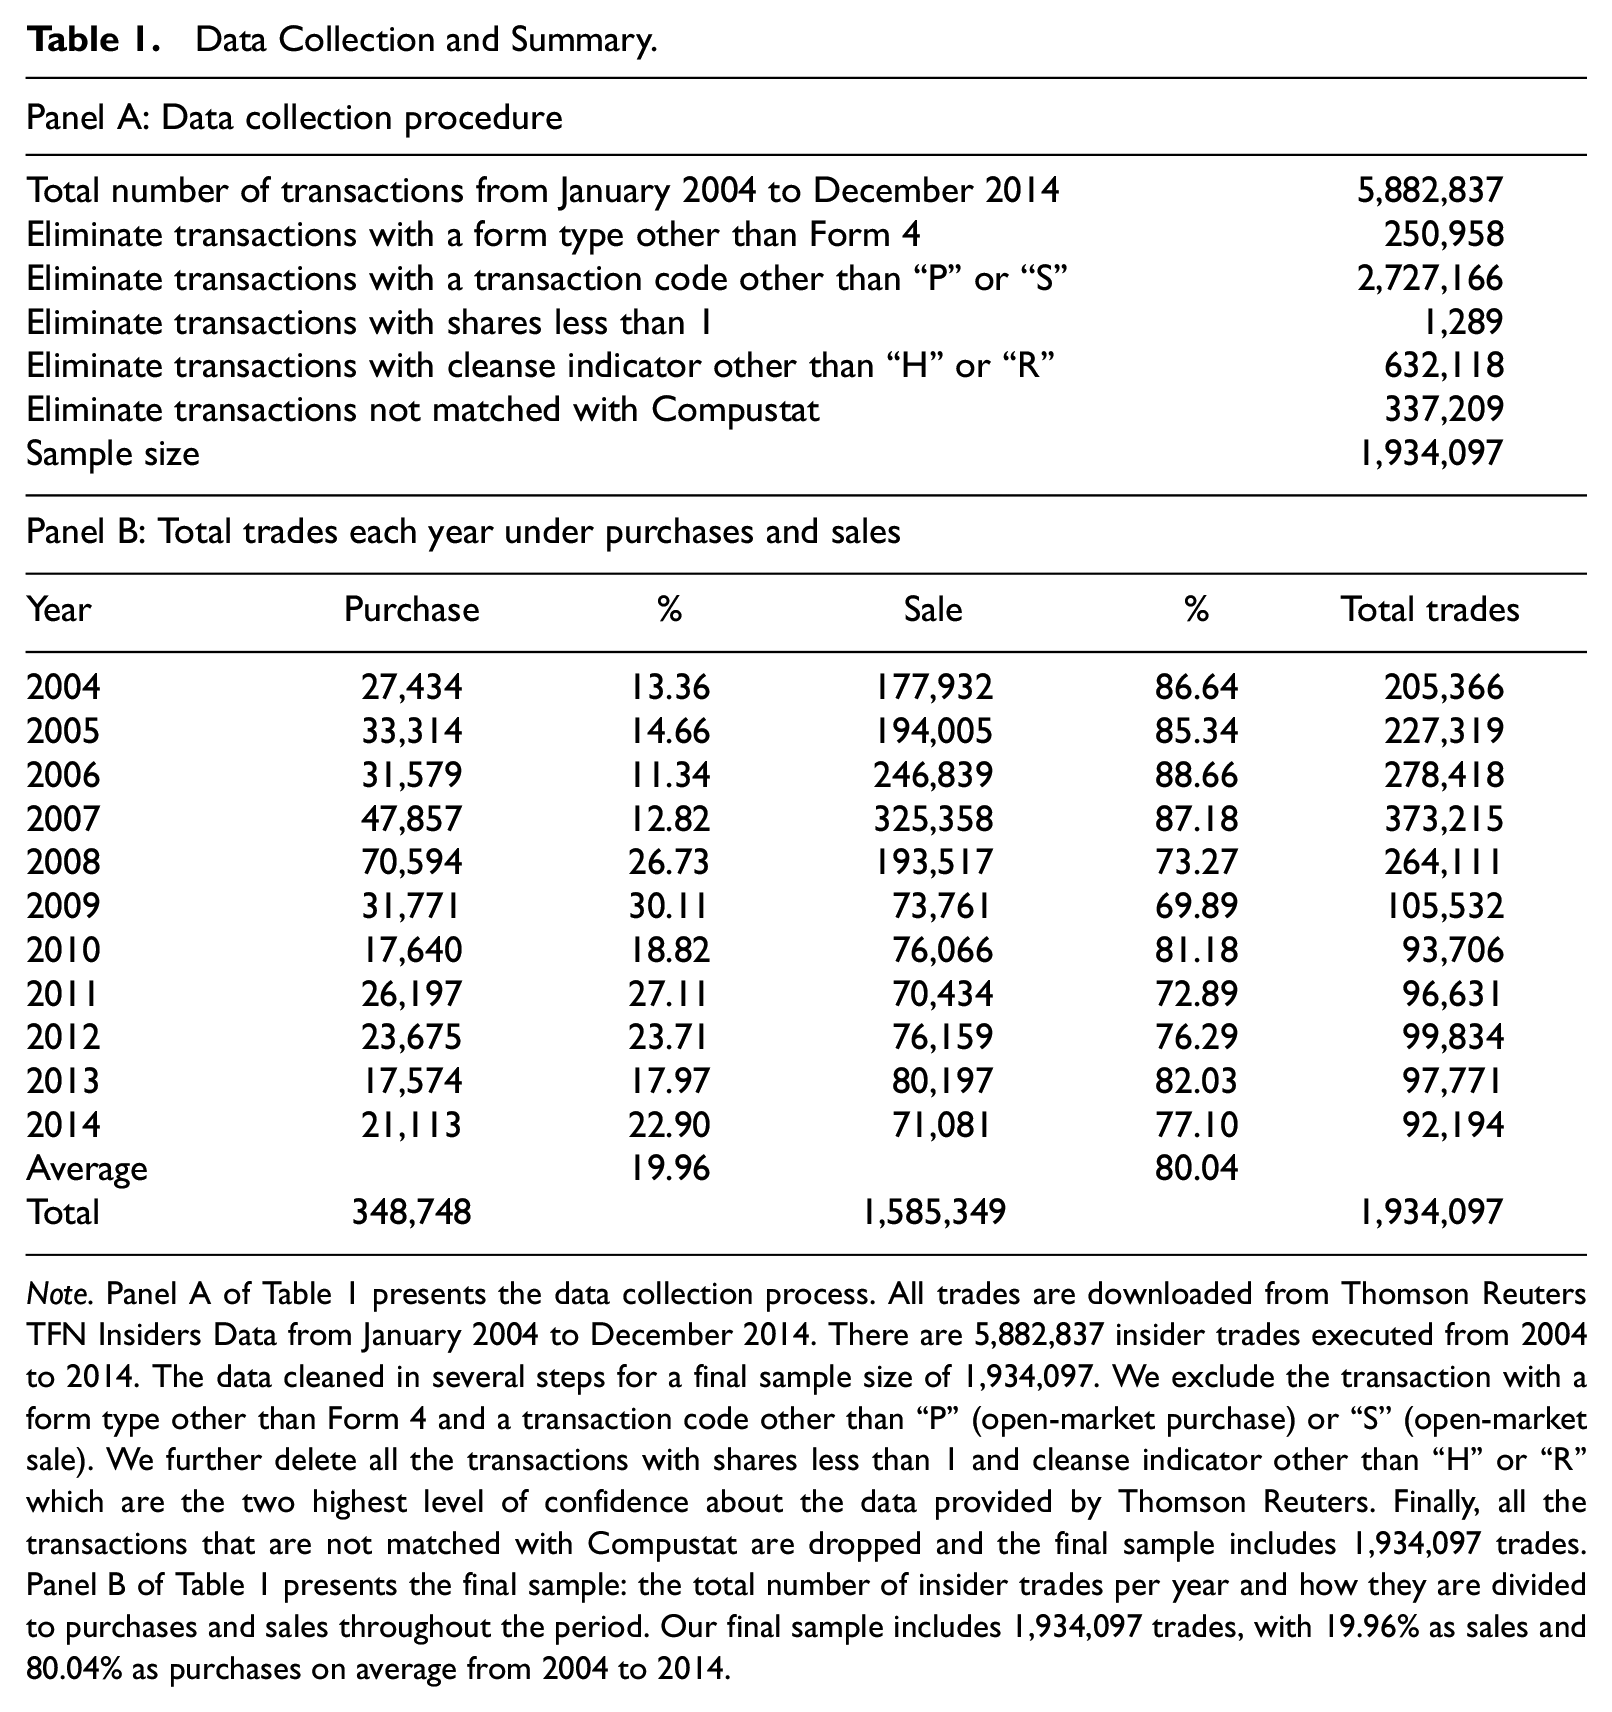
Note. Panel A of Table 1 presents the data collection process. All trades are downloaded from Thomson Reuters TFN Insiders Data from January 2004 to December 2014. There are 5,882,837 insider trades executed from 2004 to 2014. The data cleaned in several steps for a final sample size of 1,934,097. We exclude the transaction with a form type other than Form 4 and a transaction code other than “P” (open-market purchase) or “S” (open-market sale). We further delete all the transactions with shares less than 1 and cleanse indicator other than “H” or “R” which are the two highest level of confidence about the data provided by Thomson Reuters. Finally, all the transactions that are not matched with Compustat are dropped and the final sample includes 1,934,097 trades. Panel B of Table 1 presents the final sample: the total number of insider trades per year and how they are divided to purchases and sales throughout the period. Our final sample includes 1,934,097 trades, with 19.96% as sales and 80.04% as purchases on average from 2004 to 2014.
The variables collected from TFN files are as follows:
Company name and CUSIP;
Person ID which is an identical id for each insider;
Form Type (Form 4) and Transaction Code (“P” for open-market purchase and “S” for open-market sale);
Transaction date, transaction price, and the number of shares in the transaction;
Cleanse (“H” for all data with high cleansing confidence and “R” for records passed all cleansing checks for reasonableness).
Panel B of Table 1 presents the final sample: the total number of insider trades per year and how they are divided to purchase and sale trades throughout the period. Our final sample includes 1,934,097 trades, with 80.04% as purchases and 19.96% as sales on average from 2004 to 2014.
The earnings announcement data is collected from Compustat Industrial Quarterly filings. We align each transaction between two earnings announcement dates. The former earnings announcement date is the one that we use to place the transaction in the timeline. Variable “timediff” is defined to count the number of trading days between the transaction date and the former earnings announcement date. For the number of trading days to be counted correctly, we put together a data set with all the stock market holidays and exclude those when computing “timediff.” Values for the variable “timediff” can vary from 0 to 59, because each quarter consists of 60 trading days. Zero timediff for a transaction means that the transaction has occurred on the same day as the earnings announcement date. The transactions with timediff value between 3 and 12 are considered “white window” trades, and all the others are “black window” trades. We further introduce “blackest window” trades as transactions which take place in the very last 10 days of the black window. Closing price data for all the companies is downloaded from Center for Research in Security Prices (CRSP) daily files.
J3 Services Group (J3SG) provides data on 10b5-1 and non-10b5-1 transactions. This database covers open-market purchases and sales that can be clearly identified as 10b5-1 or non-10b5-1 trades. There are 886,504 open-market purchases and sales from 2004 to 2014, out of which 240,029 (27.08%) are filed under 10b5-1 plan. We only include the 807,743 trades that can be matched with CRSP and Compustat, 204,592 of which are filed under 10b5-1 plan. We use the same method to align the trades in the timeline of one quarter using the earnings announcement dates from Compustat.
Research Design
Patell and Wolfson (1981, 1984) and Beaver (1968) document that stock prices are more volatile in the period right before the earnings announcement because of the search for information regarding the impending announcement. When the earnings news is released to the public, the advantage of information search is eliminated, and we observe less volatility in the stock price. The rationale behind the white, black, and blackest windows is based on this finding. We expect private information to be of greater value in periods of higher uncertainty and that insiders would wish to trade in these periods. However, if there is a lot of insider trades, this could lead to wider bid-ask spreads as well as reduced liquidity. According to Bettis et al. (2000), this led corporations to restrict the period of insider trading to a white window. Their results indicate that insider trading is concentrated heavily in white windows, with insider trading activity in black windows at less than one third of that during white windows. However, we find that an average 67.69% of all open-market trades from 2004 to 2014 have been executed in the period where trading is discouraged (Figures 1–3). We think the difference is mainly caused by how data is collected. This study collects data from mandatory disclosure forms required by the SEC. Bettis et al. (2000) used a survey to collect data. Because a survey relies on its responses for data, it can have self-selection bias: in this case, companies with voluntary insider trading policies and strong enforcement were most likely to respond to the survey and thus ended in their sample, which can result in much fewer insider trades in black windows.
The information cycle associated with earnings announcements suggests that information asymmetry becomes the lowest soon after earnings are announced and rises to its highest level just before the earnings announcement. However, trading on clearly identifiable earnings information could constitute a potential violation of Section 10b-5. This basic tension motivates our research questions and methodology. Do insiders trade in the black windows because it is more profitable, or do they forego these trades out of fear of prosecution? Would they be able to profit from their trades and avoid potential risks by waiting for a few days and trading after the earnings announcement? To answer these questions, we carefully analyze the relationship between insider trading and CARs across each of the windows.
We use a standard event study approach to calculate the CAR for each insider trade. 12 Each security in the sample is regressed for a time series of daily returns against the yields from a market index using the equation:
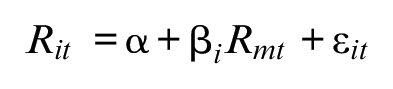
where Rit denotes the return on the security for day t, Rmt denotes the CRSP value-weighted market return for day t, and ϵ it represents a firm-specific error term (Lintner, 1965; Sharpe, 1963, 1964). This procedure yields a measure of the firm’s beta. 13 The beta is used to calculate abnormal returns that are earned subsequent to the insider trade.
The first step is to see if insider trades generate significant CARs, that is, whether purchases are followed by positive CARs and sales by negative CARs. We conduct several additional tests to see if the inference of private information regarding the earnings announcement can be supported by other evidence.
As the accumulation of private information increases over the quarter, insider trading could be more profitable in the black window than insider trading in the white window. However, the litigation risk of insider trading also increases over the quarter alongside the increases of private information, which could result in fewer profitable insider trading if insiders want to avoid the perception of trading based on private information. Thus, it is not clear as to what the consequences of these two off-setting factors will be and it becomes an open empirical question.
Next, we examine whether investors carefully choose the white window in which they trade. As is known from Ball and Brown (1968), there is a systematic PEAD in returns, upward drift after good earnings news and downward drift after bad earnings news. We therefore examine whether the CARs following insider trades is significant after adjusting for the drift. We calculate the average CAR of three trades made on the first, the middle, and the last day of the white window of a given quarter (the 3rd day, the 8th day, and the 12th day of a quarter) from a trading strategy based on PEAD: purchase after good earnings news and sale after bad earnings news. We define “good (bad) earnings news” as higher (lower) earnings relative to prior quarter’s earnings. As our analysis centers on private information regarding earnings, we compare the returns of actual purchases with purchases in every good news quarter and the returns of actual sales with sales in every bad news quarter.
We then design another test to understand why insiders choose to trade in the blackest window when it has the highest litigation risk and they can wait for merely several days to trade in a following white window. We hypothetically postpone a trade in the blackest window to the following white window. Similar to the previous test, we calculate the average CAR of three trades made on the first, the middle, and the last day of the following white window (the 3rd day, the 8th day, and the 12th day of a quarter) as the CAR for the hypothetically postponed trade. We then examine the differences between the actual blackest windows trades’ CARs and the postponed white windows trades’ CARs.
Turning to 10b5-1 plans, both Jagolinzer (2009) and Shon and Veliotis (2013) examine whether insiders strategically time disclosures and trades to exploit private information under the protection of the safe harbor provided by these plans. We first check how the trades based on 10b5-1 plans are spread throughout the quarter. For each trade in a quarter the timediff variable shows the number of days past the earnings announcement date, which gives us the opportunity to classify the trades into white, black, and blackest windows. The associated research question is whether insiders are using 10b5-1 plans to schedule trades in the black or the blackest windows. We then examine CARs generated by the 10b5-1 participant trades and non-participant trades in white, black, and blackest windows.
Results
Numbers of Insider Trades in White, Black, and Blackest Windows
Table 2 summarizes the amount of insider trading across different windows.
Insider Trading in Different Windows.

Note. In Panel A, p-value (the percentage of white window trades =100%): .000; p-value (the percentage of white window trades = the percentage of black-excluding-blackest window trades): .0235; p-value (the percentage of white window trades = the percentage of blackest window trades): .0009. In Panel B, p-value (the percentage of white window trades = 100%): .000; p-value (the percentage of white window trades = the percentage of black-excluding-blackest window trades): .0425; p-value (the percentage of white window trades = the percentage of blackest window trades): .0053. Table 2 presents the numbers and percentages of purchase (Panel A) and sale (Panel B) trades executed each year in different windows. A financial quarter is divided to two windows—a white window (3–12 trading days after the earnings announcement, consisting of 10 trading days) and a black window (the rest of the quarter, consisting of 50 trading days). Within the black window, we define the very last 10 trading days of it as the “blackest” window because information asymmetry is at its highest in this window. Hence, there are three exclusive windows in a quarter: white (10 trading days), black excluding blackest (40 trading days), and blackest (10 trading days). Panel A shows that on average 33.99% of purchases are executed in the white window, 51.40% in the black excluding blackest window, and 14.61% in the blackest window. Panel B shows that on average 32.47% of sales are executed in the white window, 53.82% in the black excluding blackest window, and 13.71% in the blackest white window. p-values are from a two-sample Wilcoxon rank-sum test. The p-values comparing the percentage of white window insider purchase and sale trades and 100% are both significant. This result rejects Hypothesis 1 which states that all insider trading takes place in white windows. In Panel C, p-value (White column = Blackest column): .9215. Panel C of Table 2 presents the average number of trades by each insider in each year from 2004 to 2014. We focus on the comparison between the white window and the blackest window because they are both 10 days long. The p-value is from a two-sample Wilcoxon rank-sum test. The p-value comparing the number of the white window insider trades per person and the number of the blackest window insider trades per person is insignificant (.9215), suggesting that insiders trade similar amounts in these two windows which rejects Hypothesis 1 on a per person level.
Table 2 presents the number and percentage of purchase (Panel A) and sale (Panel B) trades executed each year in each window. A financial quarter is divided into two windows—a white window (3–12 trading days after the earnings announcement, consisting of 10 trading days) and a black window (the rest of the quarter, consisting of 50 trading days). Within the black window, we define the very last 10 trading days of it as the “blackest” window because information asymmetry is at its highest in this window. Hence, there are three exclusive windows in a quarter: white (10 trading days), black excluding blackest (40 trading days), and blackest (10 trading days). Table 2 illustrates that 33.99% (32.47%) of all purchases (Panel A) and sales (Panel B) are executed in the white window on average from 2004 to 2014, 51.40% (53.82%) in the black excluding blackest window, and 14.61% (13.71%) in the blackest windows.
Hypothesis 1 states that all insider trading takes place in white windows. The p-value comparing the percentage of white window insider trades and 100% is significant (.000) for both purchases and sales. Thus, Hypothesis 1 is rejected. The p-values comparing the percentage of white window trades and the percentage of black excluding blackest window trades are significant for both purchases and sales (.0235 and .0425, respectively), suggesting that insiders trade more in the black excluding blackest windows than in the white windows. This is different from Bettis et al.’s (2000) result that “insider trading activity in the blackout period is less than one-third of that during allowed trading periods.” The p-values comparing the percentage of white window trades and the percentage of blackest window trades are significant for both purchases and sales (.0009 and .0053, respectively), suggesting that insiders trade less in the blackest window than in the white window, while both windows are 10 days long. Some insiders might stay away from trading in the blackest window because this window is associated with the perception of having most insider information right before the earnings announcement.
Panel C of Table 2 presents the average number of trades by each insider in each year from 2004 to 2014. We focus on the comparison between the white window and the blackest window because they are both 10 days long. The p-value comparing the number of the white window insider trades per person and the number of the blackest window insider trades per person is insignificant (.9215), suggesting that insiders trade similar amount in these two windows per person, which rejects Hypothesis 1 (on a per person level).
CARs in White, Black, and Blackest Windows
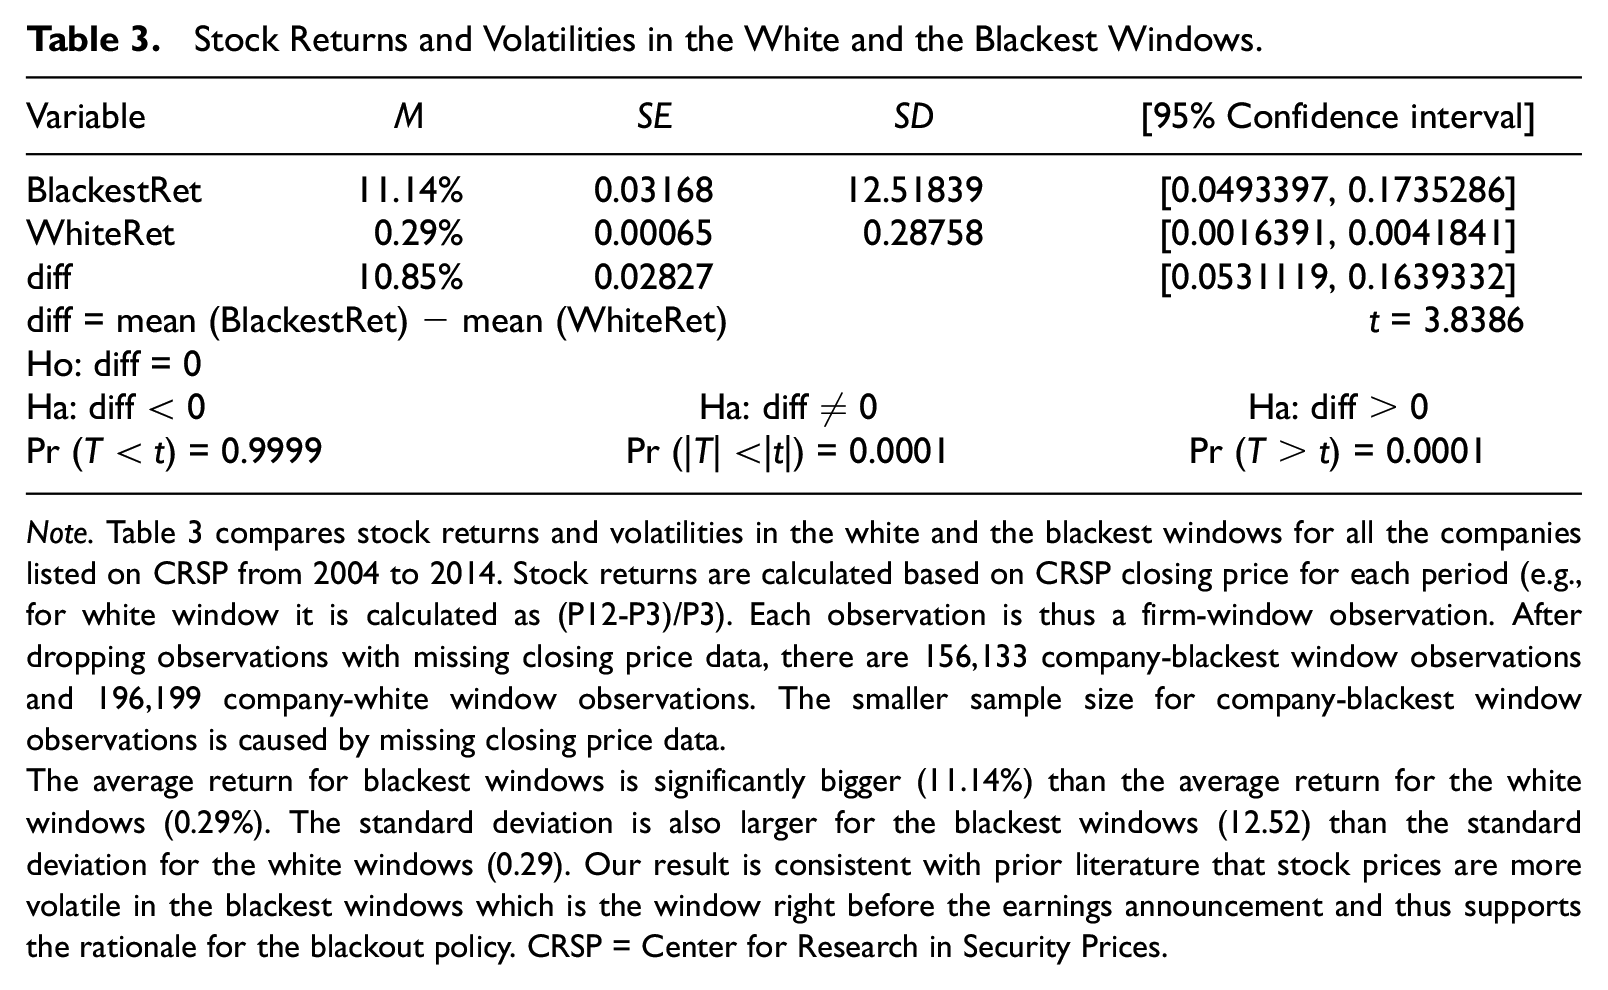
We first compare stock returns and volatilities in the white and the blackest windows to examine the information cycle associated with quarterly earnings announcements which is the underlying rationale for the blackout policy. Stock returns are calculated using CRSP closing prices for each window (e.g., for a white window, the return is calculated as (P12-P3)/P3). Each observation is thus a firm-window observation. Table 3 presents the results for all the companies listed on CRSP with closing price data available on the first and last date for white and blackest windows from 2004 to 2014. After dropping observations with missing closing price data, there are 156,133 company-blackest window observations and 196,199 company-white window observations. The smaller sample size for company-blackest window observations is caused by missing closing price data.
Stock Returns and Volatilities in the White and the Blackest Windows.
Note.Table 3 compares stock returns and volatilities in the white and the blackest windows for all the companies listed on CRSP from 2004 to 2014. Stock returns are calculated based on CRSP closing price for each period (e.g., for white window it is calculated as (P12-P3)/P3). Each observation is thus a firm-window observation. After dropping observations with missing closing price data, there are 156,133 company-blackest window observations and 196,199 company-white window observations. The smaller sample size for company-blackest window observations is caused by missing closing price data.
The average return for blackest windows is significantly bigger (11.14%) than the average return for the white windows (0.29%). The standard deviation is also larger for the blackest windows (12.52) than the standard deviation for the white windows (0.29). Our result is consistent with prior literature that stock prices are more volatile in the blackest windows which is the window right before the earnings announcement and thus supports the rationale for the blackout policy. CRSP = Center for Research in Security Prices.
Table 3 shows that the average return for blackest windows is significantly bigger (11.14%) than the average return for the white windows (0.29%). The standard deviation is also larger for the blackest windows (12.52) than the standard deviation for the white windows (0.29). Our result is consistent with prior literature that stock prices are more volatile in the blackest windows which is the window right before the earnings announcement and thus supports the rationale for the blackout policy.
Table 4 presents CARs over six different periods following an insider trade, (0; 1), (0; 2), (0; 10), (0; 30), (0; 60), and (0; 90), to examine if there are drifts or reversals in the returns. The drift in the returns is similar to PEAD that was first analyzed in Ball and Brown (1968). The results suggest that the CARs following an insider trade are increasing over a quarter which could result either from a reaction to the disclosure of the insider trade itself or due to the fact that the private information underlying the insider trade is made public in the rest of the quarter following the earnings announcement.
Average CARs Following Insider Trades.

Note.Table 4 reports the average cumulative abnormal return of insider trades in different windows and the difference of returns in white windows compared with other windows for the years 2004 to 2014. Panel A and B shows the result for purchases and sales, respectively, for white, black, and the blackest windows. The results are mixed and do not confirm the argument that black window trades generate greater CARs overall compared with white window trades. In many cases, we see the opposite that returns after insider trades in white windows are larger than returns after insider trades in other windows. For the purchase side, Panel A compares the CARs generated after a white window purchase trade with CARs generated after a black and blackest purchase trade. Based on this panel, in all periods, with the exception of (0; 30), we see CARs generated after a white window purchase are greater than CARs generated after a black or blackest window. In Panel B, which compares CARs after insider sales in white, black, and blackest windows, we see that for the longer windows (e.g., 30, 60, and 90 days) black window sales generate larger CARs compared with white window sales. In summary, returns to insider trades in black, white, and blackest windows are significant (based on t-test), and a white window insider purchase is followed by higher returns as compared with other window purchase whereas the same is not true for insider sales. These results reject Hypothesis 2 which states white, black, and blackest windows should generate insignificant abnormal returns to insiders. We checked the estimates using the Carhart four-factor model as well and found very minor differences. For the purchases, just like we observe in Panel A, in all periods, with the exception of (0; 30), we see CARs generated after a white window purchase are greater than CARs generated after a black or blackest window. For the sales, we see that for the longer windows (e.g., 30, 60, and 90 days) black window sales generate larger CARs compared with white window sales. The only difference is with respect to comparison of white and blackest windows on the sale side. Using the Carhart four-factor model, blackest window sales generates larger CAR over only 60 and 90 days windows (excluding 30 days window). All returns to insiders in white, black, and blackest windows are significant based on t-tests. CAR = cumulative abnormal return.
Table 4 also compares returns after insider trades in white, black, and blackest windows. Panel A shows the result for purchases in white, black, and blackest windows and Panel B reports the results for sales over the same windows. These results do not confirm the idea that black window trades generate larger CARs (reflecting greater levels of private information) than white window trades. Instead, returns after insider trades in white windows are larger than returns after insider trades in other windows in many cases. In addition, there are mixed results across purchases and sales. For example, in Panel A which compares CARs after insider purchase trades in different windows, insider purchases earn more in the white windows than insider purchases in the black windows with the only exception of the (0; 30) period. In contrast, in Panel B for the sales, for the longer periods (e.g., 30, 60, and 90 days), black window sales generate larger CARs than white window sales. The 30-day CAR for the black window sale is −2.49%, significantly more negative (t = 18.7) than −2.01% for the white window. This pattern continues with the 60-day and 90-day CARs. In summary, returns following insider trades in all windows are significant. A white window insider purchase is followed by higher returns than other windows with the only exception of the (0; 30) period. A white window insider sale generates higher returns than other windows in the (0; 1), (0; 2), and (0; 10) periods but generates lower returns than other windows in the (0; 30), (0; 60), and (0; 90) periods. All the t-values that test whether the abnormal return to insiders are equal to zero in white, black, and blackest windows are significant. These results reject Hypothesis 2 which states white, black, and blackest windows should generate insignificant abnormal returns to insiders.
In interpretation of these results, it is important to keep in mind that there are two factors at play here. The first is the availability of private information and the second is the ability to trade safely on this information. These factors act in offsetting directions, that is, while the value of information increases in the black and blackest windows, the likelihood of being charged with a misuse of private information also increases. The SEC actions alleging illegal insider purchase is much higher than that alleging illegal insider sales. For this reason, insiders may refrain from profitable purchases but have no inhibitions about executing profitable sales. These results are also consistent with the insider trading literature which argues that market reactions to insider purchases are stronger than market reactions to insider sales. As purchases are riskier than sales, they should earn correspondingly higher returns. In addition, insider sales are more likely to be driven by financial liquidity needs unrelated to private information, and this provides another reason why insider purchases should, on average, earn higher returns than insider sales.
Selective Trading in White Windows
To examine whether insiders selectively pick specific white windows in which they might have private information to trade base on, we compare the average CAR following the actual white window insider trades and the average CAR following a trading strategy based on PEAD. Specifically, we compare the returns of actual insider purchases (sales) in a white window with the returns of hypothetical purchases (sales) in every good (bad) news quarter. Table 5 indicates that the actual white window insider trades generate significantly larger CARs than the PEAD-based strategy for both purchases and sales (all t-values are significant except for the (0; 1) period following purchases). This finding leads to a rejection of Hypothesis 3.
Average CARs Following Actual White Window Insider Trades and PEAD Strategy Insider Trades.

Note.Table 5 compares the average CAR following the actual white window insider trades and the average CAR following a trading strategy based on PEAD. Specifically, we compare the returns of actual insider purchases (sales) in a white window with the returns of hypothetical purchases (sales) in every good (bad) news quarter. The results indicate that the actual white window insider trades generate significantly larger CARs than the PEAD based strategy for both purchases and sales (all t-values are significant except for the (0; 1) period following purchases). This finding leads to a rejection of Hypothesis 3. CAR = cumulative abnormal return; PEAD = post earnings announcement drift.
Selective Trading in the Blackest Windows
As the blackest windows are associated with the perception of highest insider information, we ask what might motivate insiders to take the litigation risk of trading in the blackest windows. To answer this question, we examine if postponing an actual blackest window trade to the following white window results in a loss of information advantage and a decrease of CAR. Table 6 indicates that the actual blackest window insider trades generate significantly larger CARs than the hypothetically postponed insider trades into the following white window (all t-values are significant). This suggests that insiders would lose significant information advantage and profits by waiting for just several days to trade in the next white window and that this greater return is sufficient to offset the added litigation risk of trading in the blackest window. Hence, Hypothesis 4 is rejected.
Average CARs Following Actual Blackest Window Insider Trades and Postponed White Window Insider Trades.

Note.Table 6 examines if postponing an actual blackest window trade to the following white window results in a loss of information advantage and a decrease of CAR. The results indicate that the actual blackest window insider trades generate significantly larger CARs than the hypothetically postponed insider trades into the following white window (all t-values are significant). This suggests that insiders would lose significant information advantage and profits by waiting for just several days to trade in the next white window and that this greater return is sufficient to offset the added litigation risk of trading in the blackest window. Hence, Hypothesis 4 is rejected. CAR = cumulative abnormal return.
Trading Patterns Under 10b5-1 Plans
In our last set of results, we compare the importance of pre-filed 10b5-1 plans in facilitating black window insider trading. Specifically, we pose two possibilities: (a) trades under 10b5-1 plans are more prevalent in black windows relative to non-10b5-1-trades and (b) the returns from 10b5-1 trades have different profitability from non-10b5-1 trades.
Table 7 presents the summary statistics of the 10b5-1 trades based on the J3SG database. This database provides information on whether a trade is executed based on a 10b5-1 plan or not. To identify the timing of a trade in a quarter, we need to match the trade with Compustat. All the trades that are not matched with Compustat are dropped. The “Purchase” (“Sale”) column shows the number of insider purchase (sale) trades from the J3SG database matched with Compustat. The “10b5-1 P” (“10b5-1 S”) column shows the number of insider trade purchase (sale) trades that are executed under a 10b5-1 plan. On average, based on this database, 3.74% of all purchases and 54.10% of all sales are executed under a 10b5-1 plan from 2004 to 2014. This asymmetry between purchases and sales is quite reasonable given that most insiders have such a concentration of holdings in their firms through options and other grants that there is little incentive for open-market purchases.
Summary Statistics of the 10b5-1 Trades.
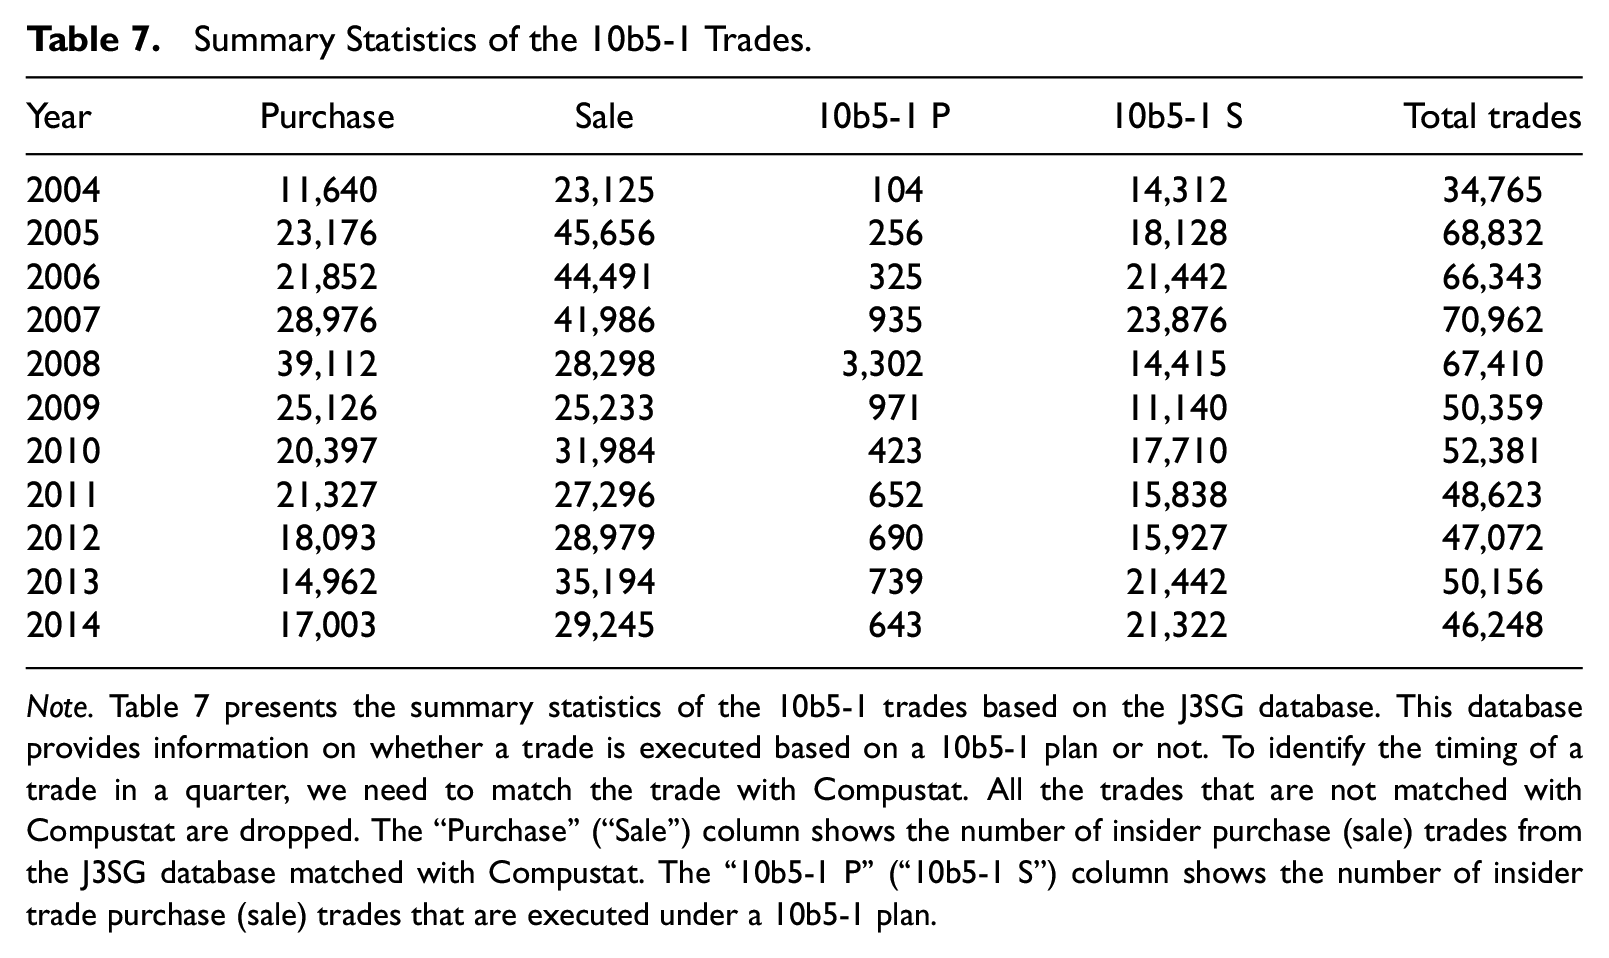
Note.Table 7 presents the summary statistics of the 10b5-1 trades based on the J3SG database. This database provides information on whether a trade is executed based on a 10b5-1 plan or not. To identify the timing of a trade in a quarter, we need to match the trade with Compustat. All the trades that are not matched with Compustat are dropped. The “Purchase” (“Sale”) column shows the number of insider purchase (sale) trades from the J3SG database matched with Compustat. The “10b5-1 P” (“10b5-1 S”) column shows the number of insider trade purchase (sale) trades that are executed under a 10b5-1 plan.
Table 8 presents the numbers and percentages of 10b5-1 trades that are executed in each year over different windows. Panel A shows that on average 13.50% of 10b5-1 purchases are executed in the white windows, 57.21% in the black excluding blackest windows, and 29.29% in blackest windows. Panel B shows that on average 18.86% of 10b5-1 sales are executed in the white windows, 49.45% in the black excluding blackest windows, and 31.70% in blackest windows. p-values comparing the percentage of white window trades and the percentage of blackest window trades are significant for both purchases and sales, suggesting that more 10b5-1 plans are more likely to be scheduled in the blackest windows raising the option value of selective training by filing a plan. This is in contrast with the results of Table 2 which shows that significantly more trades take place in the white windows than blackest windows with the sample of all open-market insider trades. Thus, Hypothesis 5 is rejected.
10b5-1 Trades in Different Windows.

Note. In Pane A, p-value (the percentage of white window trades = the percentage of black-excluding-blackest window trades): .0028; p-value (the percentage of white window trades = the percentage of blackest window trades): .0328; p-value (the percentage of white window trades = the percentage of black-excluding-blackest window trades): .0001. In Panel B, p-value (the percentage of white window trades = the percentage of blackest window trades): .0002. Table 8 presents the numbers and percentages of 10b5-1 trades each year divided in different windows. Panel A shows that on average 13.50% of 10b5-1 purchases are in the white window, 57.21% in the black excluding blackest window, and 29.29% in blackest window. Panel B shows that on average 18.86% of 10b5-1 sales in the white windows, 49.45% in the black excluding blackest windows, and 31.70% in blackest windows. p-values are from a two-sample Wilcoxon rank-sum test. p-values comparing the percentage of white window trades and the percentage of blackest window trades are significant for both purchases and sales, suggesting that more 10b5-1 plans are more likely to be scheduled in the blackest window raising the option value of selective training by filing a plan. This result rejects Hypothesis 5.
CARs Under 10b5-1 Plans
Tables 9 and 10 report average CARs following insider purchases and sales, respectively, that are executed under a 10b5-1 plan or without a 10b5-1 plan in black, white, and the blackest windows. Descriptively, the sample of purchases under 10b5-1 plans is relatively small (as compared with 10b5-1 sales or open-market trades; see Tables 2 and 8) and this has to be borne in mind when comparing CARs across these categories.
Average CARs Following 10b5-1 Plan Purchases and Non-Plan Purchases.

Note.Table 9 reports average CARs following insider purchases that are executed under a 10b5-1 plan or without a 10b5-1 plan in different windows. Panel A shows that for white window purchases, average CARs are not statistically different between plan purchases and non-plan purchases. Panel B shows that for black window purchases, average CARs are statistically larger for plan purchases than non-plan purchases, with the only exception of (0; 1) period. Panel C shows that for the blackest window purchases, average CARs are statistically larger for plan purchases than non-plan purchases, with the exception of (0; 1) and (0; 2) periods. CAR = cumulative abnormal return.
Table 9 reports average CARs following insider purchases under 10b5-1 plan or without 10b5-1 plan in different windows. Panel A shows that for white window purchases, average CARs are not statistically different between plan purchases and non-plan purchases. Panel B shows that for black window purchases, average CARs are statistically larger for plan purchases than non-plan purchases, with the exception of the (0; 1) return period. Panel C shows that for the blackest window purchases, average CARs are also statistically larger for plan purchases than non-plan purchases, with the exception of the (0; 1) and (0; 2) return periods.
Table 10 reports average CARs following insider sales under 10b5-1 plan or without a 10b5-1 plan in different windows. Panel A shows that for white window sales, average CARs are statistically more negative for plan sales than non-plan sales for the longer return periods of (0; 60) and (0; 90), but it is not the case for the shorter (0; 1), (0; 2), (0; 10), and (0; 30) periods. Panel B shows that for black window sales, average CARs are statistically more negative for plan sales than non-plan sales, with the exception of the (0; 1) and (0; 2) return periods. Panel C shows that for the blackest window sales, average CARs are statistically more negative for plan sales than non-plan sales, with the exception of the (0; 1) return periods.
Average CARs Following 10b5-1 Plan Sales and Non-Plan Sales.

Note.Table 10 reports average CARs following insider sales that are executed under a 10b5-1 plan or without a 10b5-1 plan in different windows. Panel A shows that for white window sales, average CARs are statistically more negative for non-plan sales than plan sales for (0; 1), (0; 2), (0; 10), and (0; 30) periods, but the comparison reversed for (0; 60) and (0; 90) periods. Panel B shows that for black window sales, average CARs are statistically more negative for non-plan sales than plan sales for (0; 1) and (0; 2) periods, but the comparison reversed for (0; 10), (0; 30), (0; 60), and (0; 90) periods. When it comes to the blackest window sales, Panel C shows that the average CAR is only statistically more negative for non-plan sales than plan sales for (0; 1) period, while average CARs are more negative for plan sales in all the other periods. CAR = cumulative abnormal return.
The significant larger returns for plan trades than non-plan trades in the longer return periods are consistent with insiders using 10b5-1 plans to schedule their trading in the black and blackest windows prior to earnings announcements and then trading under the plan based on private information. Overall, the results of Tables 9 and 10 reject Hypothesis 6.
For the shorter return periods, plan trades have smaller returns than non-plan trades. Table 10 even shows that average returns are positive for both plan and non-plan sales rather than negative for the (0; 1) return period. There are several possible reasons: (a) the private information has not been publicly announced yet; (b) Form 4 is required to be filed, and thus becomes publicly available, within two business days after the insider trade; and (c) investors pay less attention to insider trades especially sales in the first day or two after the trade.
When comparing Tables 9 and 10, we see that the differences between returns following plan purchases and non-plan purchases are larger than the differences between returns following plan sales and non-plan sales. For example, for the (0; 90) returns period, black window plan purchases outperform black window non-plan purchases by 3.84% whereas the corresponding value for sales is −0.38%. This suggests that the effect of risk reduction through the use of a plan is stronger for purchases than sales, which is consistent with the notion that private information exploitation and reduction of litigation risks are facilitated by 10b5-1 plans.
Conclusion
Insider trading is regulated by the SEC because fear of privately informed traders can reduce market liquidity. The main regulatory instrument is the use of lawsuits under Section 10b-5 that broadly prohibits trading on non-public information, but as such, raises many complex legal issues. For this reason, other regulations such as the ITSFEA shifts the burden of enforcement against insider trading to controlling parties such as employers and broker-dealers who may be better able to monitor whether insider trades are motivated by private information. As part of their corporate responsibility, firms often limit trading to windows of low private information in the earnings announcement cycle. We examine the actual consequences of these policies and find that they are ineffective in limiting insider trading in low private information windows and that the majority of insider trading in the United States takes place at time points where trading is forbidden in the United Kingdom.
To further analyze these trades, we split the quarter into three windows that we term “white” (low information about the next earnings report), “black” (some information about the next earnings report), and blackest (likely full knowledge of the next earnings report). We compare the patterns of (average) abnormal returns following insider trades in each of these windows. Prior literature has mostly analyzed subsamples of insider trades and found mixed results on whether they are profitable on average. We consider all insider trades and find that on average, insiders earn significant abnormal returns for trades in all three windows for both open-market purchases and open-market sales.
While this result is not unexpected, what is more surprising is that trades in black or blackest windows do not consistently outperform trades in the white window. We argue that this is due to two effects: (a) selective trading in only some white windows and (b) foregone profitable trades in black windows because of litigation risk concern. We analyze the profitability of purchasing in every good news white window and selling in every bad news white window and find that this strategy produces significantly lower returns than actual white window trades. In addition, we find that postponing trades from the blackest window for just several days to the next white window also reduces profitability. In other words, the greater profitability offsets the added litigation risk of trading in the blackest window.
One way to avoid the risk of insider trading sanctions is to file a 10b5-1 plan. Prior literature has pointed out that these plans provide an option to either trade or not to follow through based on private information. Current laws preclude the possibility of prosecuting insiders who do not follow through the 10b5-1 plan. This option value of selective trading would be highest if the dates of plan trades are scheduled in the blackest windows. We find that significantly more trading takes place in the blackest window under 10b5-1 plans relative to non-plan trades. In addition, we find that 10b5-1 plan trades generate larger returns than non-plan trades in the longer return periods, which is consistent with insiders using 10b5-1 plans to schedule their trading in the black and blackest windows prior to earnings announcements and then trading under the plan based on private information.
It should be noted that our article focuses on earnings disclosure and insider trading profits driven by foreknowledge of information not yet impounded in prices. Another source of insider profit is the management manipulation through influencing analyst forecasts, strategic management forecasts, back dating options, or lowering the strike price of options through bad news forecasts. Such alternative methods for profiting from insider trading are not explored in our study.
Footnotes
Declaration of Conflicting Interests
The author(s) declared no potential conflicts of interest with respect to the research, authorship, and/or publication of this article.
Funding
The author(s) received no financial support for the research, authorship, and/or publication of this article.