




Abstract
We examine the impact of organized labor on the debt-like components of CEO compensation. In initial findings, we demonstrate a positive association between unionization intensity with measures of debt-like compensation intensity used in the extant literature. This finding is robust to alternative measures of union-bargaining strength and empirical approaches. Consistent with the view that managers substitute cash for accrued compensation to improve their bargaining position over labor, this result is robustly driven by the deferred component of debt-like compensation. Our results collectively suggest that unions play an important role in the use of deferred compensation.
Introduction
The structure of executive compensation represents an important contracting mechanism when viewing the firm as a nexus of contracts. Motivated by the wealth-maximizing objective of financial stakeholders, a well-developed literature examines if incentive compensation effectively aligns shareholder and managerial interests (e.g., Coles et al., 2006; Guay, 1999; Morck et al., 1988; Murphy, 1985) and if financial stakeholders such as institutional investors influence equity incentives (e.g., Core et al., 1999; Yermack, 1995). Labor unions are unique yet important external stakeholders whose objective is to maximize the wealth of their constituent members. In their role as collective bargaining agents, extant research confirms that organized labor alters the contracting environment. Consistent with the view held by some unions that executives capture an excessive share of firms’ returns (Banning & Chiles, 2007), prior research reports a negative association between union presence and compensation. 1 For example, Banning and Chiles (2007) document a negative relation between unionization rate and total CEO compensation, while Gomez and Tzioumis (2011) find that CEOs of unionized firms have lower performance sensitivities than those of nonunionized firms. In recent work, Huang et al. (2017) provide evidence indicating that highly unionized firms strategically reduce current executive pay components, particularly equity compensation, prior to union contract negotiations to increase their bargaining power. As top executives have considerable influence over their own pay arrangements (Bebchuk & Fried, 2004), their evidence suggests that managers make strategic choices regarding the structure and level of their compensation when faced with strong labor union presence. However, whether these choices extend to the debt-like components of CEO compensation is unexplored in the extant literature.
In this article, we explore if organized labor plays a role in the level and intensity of managerial debt-like compensation and its components. A growing line of research explores the prevalence and impact of debt-like compensation in executive pay. 2 Recent work finds that executive compensation typically includes a substantial amount of pension and deferred compensation along with cash and equity incentives (e.g., Bebchuk & Jackson, 2005; Wei & Yermack, 2011). For example, Bebchuk and Jackson (2005) report that in 2003 the average actuarial value of pension holdings was $19.6 million for the CEOs of S&P 500 firms with ages between 63 and 67, indicating that debt-like compensation is a significant component of CEO pay packages.
A growing inside debt literature (e.g., Cassell et al., 2012) suggests debt-like compensation promotes greater alignment with creditor interests. As with wages paid to unionized workers, debt-like compensation has a fixed payoff that is contingent on the firm’s long-term survival; therefore, labor unions may prefer more debt-like compensation in CEO pay relative to other forms of compensation that reward risk-increasing policy choices. At the same time, unions are sensitive to executive pay levels that contribute to a larger CEO-worker pay gap. 3 Consistent with this argument, the American Federation of Labor and Congress of Industrial Organizations (AFL-CIO) closely monitors executive compensation (Farber et al., 2012), and labor unions are prolific sponsors of shareholder proposals addressing CEO compensation (Del Guercio & Woidtke, 2012; Ertimur et al., 2010). Therefore, it is plausible that labor unions are more tolerant of executive debt-like compensation. Alternatively, prior research establishes that managers of firms in more unionized industries strategically make corporate decisions to gain bargaining advantages over unions; for example, Klasa et al. (2009) find that firms choose lower cash holdings as a means of sheltering corporate income. In a similar vein, there are reasons to believe that the deferral of current period cash compensation could be used to manage the optics of executive compensation negotiations with unions. In addition to potentially low valuation transparency, deferred compensation plans also voluntarily expose the CEO to various risks that are associated with nonguaranteed deferred income. These characteristics of deferred compensation, along with the influence of top executives over their own pay arrangements (Bebchuk & Fried, 2004) could be used by managers and board compensation committees to strategically improve their bargaining position.
Our study contributes to the literatures on union presence and managerial compensation policy as follows. We identify a significant union effect on several measures of total debt-like compensation intensity that is robust to the alternative use of firm-level unionization information, model specifications, and controls for potential endogeneity. Consistent with prior evidence demonstrating that compensation components can be used to increase bargaining power in the face of a strong union, these associations are driven by the deferred compensation component of inside debt. A difference-in-differences approach using union contract negotiations during our sample period yields corroborating results.
We structure the remainder of the paper as follows. Section “Union Presence and Corporate Policy” provides a brief review of the relevant labor union literature. Section “Hypotheses Development” describes our hypotheses. Section “Data and Empirical Results” reports the empirical results of our hypotheses. Section “Additional Tests of Robustness” provides brief discussions of robustness check. Finally, section “Conclusions” summarizes our findings and offers concluding remarks.
Union Presence and Corporate Policy
As collective bargaining agents, unions seek to maximize the utility of their members. As such, a well-developed body of research confirms that workers in unionized firms enjoy higher pay and greater job security than those in nonunionized firms (e.g., Abraham & Medoff, 1984; Card, 1996; Lewis, 1986). Unions are also motivated to curb what they perceive to be excessive executive compensation. Banning and Chiles (2007) find the unionization rate is negatively correlated with total CEO compensation, while Gomez and Tzioumis (2011) add that the negative correlation is primarily driven by option compensation where stock market participants penalize strong union presence which in turn reduces the value of equity incentive compensation.
Organized labor and bondholders share common objectives. In a contingent claims context, unions seek to maximize the utility of workers, resulting in a payoff function that resembles those of bondholders. Similar to a bondholder’s payoff, worker wages resemble a long position in the firm’s assets and a short call option position written on the same assets (Merton, 1973). In solvent states, the wages paid to workers are fixed; in insolvent states, promised payments are unfulfilled by the firm, thereby creating a payoff with limited upside potential and potentially unlimited loss. Since shareholders capture the positive payoffs from risky investments while workers and bondholders bear the consequences of negative payoffs, unions and creditors share a preference for safe investments. Consistent with this preference, prior research finds that unions influence corporate policies that result in greater alignment with their preference for lower risk. For example, Connolly et al. (1986) and Hirsch and Link (1987) find that union strength is negatively associated with R&D expenditure, while Chen et al. (2012) demonstrate that firms in more unionized industries have less risky investment policies and are less likely to become acquisition targets. In recent work, Hamm et al. (2018) confirm that managers cater to union preferences for less bankruptcy and unemployment risk by smoothing earnings through the management of accruals and R&D expenditures.
While the interests of unions broadly reflect those of bondholders, they diverge with shareholders. As labor costs are frequently one of firms’ largest expenses, managers have an incentive to improve their bargaining position against unions as a means of maximizing firm value. A line of research highlights this tension between management and unions by providing evidence that managers strategically counteract unions’ rent-seeking behavior using corporate decisions. In early work, DeAngelo and DeAngelo (1991) find that steel manufacturers significantly reduce dividends prior to their negotiations with unions. Bronars and Deere (1991) determine that firms credibly reduce funds potentially available to unions by issuing debt, thereby sheltering income from union demands. More recently, Klasa et al. (2009) argue that managers adjust cash holdings downward to strengthen their bargaining position over organized labor. In addition, Matsa (2010) finds that managers strategically use debt financing when corporate liquidity is high to improve their bargaining position with organized labor. Finally, Huang et al. (2017) report managers and boards of directors strategically reduce CEO compensation based on the premise that unions use the level of CEO compensation to gauge the firm’s well-being. Firms that curb CEO compensation experience lower likelihoods of labor strikes, thereby providing a rationale for lower CEO pay.
Hypotheses Development
Prior research provides a theoretical framework and empirical evidence for the notion that debt-like compensation can be used to dissuade managers from taking excessive risk at the expense of bondholders. Jensen and Meckling (1976) hypothesize that debt-like compensation may alleviate risk-shifting conflicts between stockholders and bondholders that result from equity incentive compensation. In a firm facing agency costs of debt and equity, Edmans and Liu (2011) postulate that firms use managerial inside debt to mitigate shareholder-bondholder agency conflicts. For example, if the agency cost of debt is more significant than the agency cost of equity, then greater proportions of managerial inside debt-to-equity, relative to firm debt-to-equity, can reduce the agency cost of debt relative to equity by increasing the manager’s relative exposure to debt-like payoffs. Their model predicts that managers with higher proportions of CEO-firm debt-equity ratios are more likely to choose conservative operating policies. Consistent with this prediction, Sundaram and Yermack (2007) document a negative relation between the level of managerial pension holdings and the probability of default, suggesting that managers with high inside pension debt behave more conservatively. Similarly, Cassell et al. (2012) find that the level of inside debt held by the CEO influences the riskiness of the firm’s investment and financial policies: when CEO inside debt is higher, future stock return volatility, R&D expenditure, and financial leverage are lower while the extent of diversification and asset liquidity are higher. Furthermore, Phan (2014) provides evidence that firms with high CEO-firm relative debt-equity ratios experience significantly greater likelihoods of diversifying acquisitions, while Anantharaman et al. (2014) present empirical evidence that bank loans have higher prices and fewer covenants when the CEO-firm relative debt-to-equity ratio is higher.
While the inside debt literature generally uses the aggregate balances of all pension and other deferred compensation (ODC hereafter) plans to measure managerial inside debt holdings, there are differences between these components. Similar to cash compensation (e.g., salary), pension expenses reduce the firm’s current period income. However, instead of the expense being settled in cash that same period, the pension expense is recorded as a liability for the amount of the unpaid pension expense for that period which is subsequently paid out in cash in the future. As a result, unpaid pension liabilities accumulate over time as reflected by the reported actuarial present value of the CEO’s accumulated pension balance. Executive pension plans may include tax-qualified broad-based “rank-and-file” (RAF hereafter) plans that all firm employees participate in as well as nontax-qualified supplemental executive retirement plans (SERPs hereafter) that only select “highly compensated” executives participate in. 4
Unlike RAF plans, SERPs can be custom designed to meet the specific needs of the executive and are often used to incentivize executives to remain with the firm for a long period of time (Parker, 2018). 5 As each SERP agreement is individualized, SERPs have greater flexibility as the firm has more discretion to award (or cut back on) additional benefits (Bebchuk & Fried, 2004). As Anantharaman et al. (2014) discuss, there are important differences in risk-taking incentives between these plans. Underfunded RAF plan deficits are partially insured by the Pension Benefit Guaranty Corporation in the event of insolvency, thereby making them relatively less debt-like. In contrast, SERP plans do not have to be secured and are often unfunded for tax reasons. Therefore, Anantharaman et al. (2014) argue that SERPs better reflect risky unsecured corporate debt payoffs than RAF plans because SERPs have greater exposure to the risk of loss.
Unlike pension plans, executives elect to defer income into ODC plans and agree to withdraw it at a later date, thereby avoiding income tax on the income deferred until it is paid out. As with pension plans, unpaid deferred compensation liabilities accumulate over time as an unpaid balance based on the CEO choosing to not withdraw cash compensation expenses accrued in a given period. As McKenna (2018) points out, ODC plans share broad similarities with 401(k) plans and Roth IRAs as they allow participants to reduce their current period taxable income and allow for tax-deferred compounded growth; as such, ODC plans are often used as a supplement to 401(k) plans. In contrast, most ODC plans are not secured or funded (Anantharaman et al., 2014). ODC plans may be invested in the firm’s own stock and may offer repayment prior to retirement according to a prespecified schedule (e.g., Wei & Yermack, 2011), although there is considerable heterogeneity in the rules that govern ODC plans. For example, some plans may allow deferral for short time periods while other plans may require that funds are locked up until retirement.
Union presence does not have a clear expected relation with pension compensation. There are two arguments for a potential direct association. Sundaram and Yermack (2007) and related work demonstrate that pension debt-like compensation reduces the riskiness of corporate policies and cash flow volatility. Therefore, unionized firms could view pension compensation as a mechanism to align CEO and union interests, based on the similarities of payoffs to pension inside debt and risky bonds. In a similar vein, the use of pension compensation may allow firms more scope to strategically disguise the amount of executive compensation in the face of union pressure to the extent that pension compensation is harder to value than equity-linked compensation. However, as noted above, pension contracts are typically written based on parameters including the compensation base, a multiplier, and years of service. To the extent that these parameters do not change much (particularly with respect to RAF contracts), the relative inflexibility of pension contracts may render them unwieldy for these purposes.
Alternatively, a line of research provides evidence that union presence may directly affect firm policies. For example, Connolly et al. (1986) find that the level of unionization negatively impacts the firm’s R&D investments, while Chen et al. (2012) report that firms in more unionized industries are more likely to invest less in risky investments thereby lead to a negative relation between the unionization rate and firm’s cost of debt capital. Bradley et al. (2017) report a negative impact of labor unions on firms’ innovation activities. Leung et al. (2009) and Osma et al. (2014) find that highly unionized firms are associated with more accounting conservatism, while Chyz et al. (2013) find a negative association between unionization and tax aggressiveness. Due to these conflicting arguments, we state Hypothesis 1 in the null form to refrain from making a directional prediction about the relation between union strength and pension inside debt:
In contrast to H1, the ODC component of inside debt compensation could be strategically used to improve the CEO’s bargaining position with unions. There are two (not necessarily mutually exclusive) rationales for this conjecture. First, cash compensation is typically disclosed when earned, not paid. In other words, salary components that are not withdrawn in cash in the current period typically do not affect total reported current compensation in the summary compensation table (SCT). However, deferred cash compensation could potentially reduce reported current pay components that are deferred into equity. According to Kailer (2008), [s]alary or bonus deferred or foregone at the election of [a CEO] under which equity-based compensation instead has been received by the NEO [named executive officer] is to be reported in the column of the SCT applicable to the other form of compensation rather than the Salary or Bonus column if the arrangement is within the scope of FAS 123R (e.g., the right to stock settlement is embedded in the terms of the award.)
In other words, the deferral could reduce the pay component’s reported SCT value while increasing the ODC value under certain conditions. Huang et al. (2017) demonstrate that when managers reduce their current pay levels to exploit unions’ preference for lower executive compensation levels, the firm experiences lower frictions with organized labor. Therefore, to the extent that unions care more about current period cash compensation than about the compensation accrual, ODC plans could be used as a tool to reduce high perceived current executive compensation particularly with potentially controversial components such as the bonus. 6
Second, the choice to defer current income exposes the executive to risks that could be used to manage the optics of compensation around union negotiations. The collective bargaining process can be viewed as a two-player bargaining game. In the Nash (1950) bargaining solution, each party receives its payoff plus a fraction of the joint surplus that is increasing in the party’s bargaining power. We surmise that unionized firms could also use executive deferred compensation to improve their bargaining position. McKenna (2018) points to a number of risks associated with locking up a portion of cash compensation for a future nonguaranteed payment. 7 First, the deferral decision is irrevocable; as a result, ODC plans do not allow for early access flexibility to deferred funds. Furthermore, ODC plans may function as “golden hand-cuffs” by not allowing for distributions or rollovers if the executive voluntarily leaves the company. In a similar vein, the acquisition of the company by another firm could result in the termination of the ODC plan and the release of deferred funds as a lump sum thereby triggering large unanticipated tax liabilities, depending on the nature of the transaction. Most significantly, ODC plans are typically unfunded and unsecured. As a result, bankruptcy could result in the loss of some or all of the deferred compensation even if the executive leaves the company prior to the bankruptcy filing. These rationales point to the potential use of deferred compensation as a means for executives to improve their bargaining position.
Data and Empirical Results
Data and Sample Selection
Our sample period spans FYE 2006 to 2014, where the 2006 starting point is due to changes in SEC disclosure requirements regarding SERP and ODC plans. 8 As the effects of union strength may be different in regulated firms, we exclude utilities and financial firms. Table 1 Panel A provides descriptive statistics for CEO current and debt-like compensation components. For the 11,239 firm-year observations with a complete record of nonmissing CEO pay components and control variables used in the cross-sectional analyses, average salary and bonus is $802,000 and $221,000, respectively. 9 Annual equity compensation is total compensation (Execucomp item TDC1) minus cash compensation and has a mean (median) of $4,631,000 ($2,894,000). The average additional compensation expense accrued in the current period for all ODC plans (item DEFER_CONTRIB_EXEC_TOT) is $169,000, and the increment to the pension liability balance for all pensions (item PENSION_CHG) is $407,000. Following the approach of the inside debt literature, total debt-like compensation is the sum of the aggregate deferred compensation balance and the aggregate actuarial present value of the accumulated pension benefit. For the 11,009 firm-year observations with a complete record of debt-like compensation control variables, the average balance of all ODC plans (pension plans) is $2,224,000 ($2,535,000), respectively. Following the methodology described by Sundaram and Yermack (2007) and Daniel et al. (2013), CEO Inside equity is the sum of stock grants, restricted stock, and the present value of stock option holdings. The Inside debt ratio is the CEO’s personal debt-equity ratio and is based on total debt-like compensation divided by equity compensation. The Relative debt ratio (e.g., Edmans & Liu, 2011) is the CEO Inside debt ratio divided by the firm’s debt-equity ratio. Based on the 8,584 observations used in the cross-sectional analyses, the mean (median) Inside debt ratio is 0.351 (0.048) while the Relative debt ratio has a mean (median) of 5.363 (0.200). 10
Summary Statistics for Variables Used in CEO Compensation Models.

Note.Table 1 provides descriptive statistics based on numbers of observations used in the cross-sectional analyses. Panel A summarizes the CEO compensation components. Panel B presents the control variables employed in the compensation models based on the specification of Huang et al. (2017), and Panel C includes additional control variables used in the debt-like compensation models. We provide additional details about the construction of measures provided in Panels A and C in the Appendix. ODC = other deferred compensation; HHI = Herfindahl–Hirschman Index; ROA = return on assets; R&D = research and development.
Firms voluntarily provide unionization details in their 10-K statement. Therefore, extant accounting and finance research (e.g., Chen et al., 2012, 2011; Hilary, 2006; Klasa et al., 2009) commonly uses Census Industry Code- (CIC-) level unionization data obtained from the Union Membership and Coverage Database (www.unionstats.com) as a proxy for the firm-level rate. The industry rate is the number of unionized workers divided by total workers in a given CIC industry. The use of industry unionization rates to measure union strength at the firm level is founded on the notion of the spillover effect, that is, the threat of union-organizing activity in one firm increasing the threat of unionization in other firms within the same industry. An alternative approach is to adjust the industry unionization rate with firm-level characteristics to better reflect the bargaining strength of the firm’s unionized workers. Hilary (2006, p. 535) argues [i]f labor represents a very small proportion of the factors of production, it will not significantly affect the managers’ decision: if capital represents 99% of the factors, managers will not be seriously concerned if labor doubles its share of the firm’s resources.
Following this view, an additional stream of published research (e.g., Bova, 2013; Chen et al., 2011; Hamm et al., 2018; Hilary, 2006) measures the importance of labor in the firm’s operations by adjusting the industry unionization rate for firm-level labor intensity. Based on this line of work, Labor strength is the industry unionization rate deflated by the firm’s labor intensity (number of employees divided by total assets). Aside from the intuition of capturing the relative intensity of unionized labor, the Labor strength measure offers additional advantages. 11 First, it is available for a large number of firms (i.e., all firms at the intersection of the Execucomp and Compustat databases). Second, incorporating firm-specific information into the industry-level unionization rate results in greater variation and cross-sectional explanatory ability.
We provide descriptive unionization statistics in Table 1 Panel B. The industry-level Unionization rate has a mean (median) of 0.082 (0.050), respectively, while Labor strength has a mean (median) of 0.039 (0.018). As a robustness check, and to maintain comparability with related work, we hand-collect firm-level unionization data when available from SEC filings (approximately 65% of our sample). The firm-level Unionization rate has a mean (median) of 0.128 (0.010), respectively, while Labor strength using the firm-level union rate has a mean (median) of 0.056 (0.003).
The firm- and CEO-level explanatory variables provided in Table 1 Panel B follow the specification used by Huang et al. (2017). Contemporaneous and lagged firm-level control variables include Firm size, Stock return (Lagged stock return), and return on assets (ROA) (Lagged ROA). The remaining financial control variables are lagged 1 year. These include Lagged leverage, Lagged book-market, Lagged cash flow volatility (standard deviation of earnings before interest and taxes plus depreciation and amortization [EBITDA] divided by total assets, calculated over a rolling 5-year period ending the year prior to the fiscal year), Lagged capital expenditure, Lagged tangibility, Lagged sales growth, and Lagged R&D. At the CEO level, we include CEO tenure (in years) and a binary variable for whether the CEO is also the board chair or not (CEO chair) as measures of CEO power and influence.
In Table 1 Panel C, we present additional CEO- and firm-level explanatory variables commonly used in the debt-like compensation literature (e.g., Campbell et al., 2016; Sundaram & Yermack, 2007). We include CEO age to control for age-related effects on debt-like compensation, while Firm age measures the number of years since the listing date using the CRSP Header File. Following Sundaram and Yermack (2007), Tax loss indicator controls for the tax benefits associated with the deferral of income to future years and is a binary variable equal to one if Compustat item Tax Loss Carryforward (TLCF) is non-missing. The Herfindahl–Hirschman Index (HHI) controls for potentially higher rents exerted by unions in more concentrated industries. HHI is calculated as
Empirical Results
Effect of labor strength on CEO inside and relative debt ratios
We begin our empirical analysis by examining the impact of labor strength on measures of CEO inside debt intensity. We follow Sundaram and Yermack (2007) by employing the Inside debt ratio (aggregate CEO debt-like compensation divided by equity incentive compensation) as the dependent variable. Based on extant research, we also use the Relative debt ratio (the Inside debt measure divided by the firm’s debt-equity ratio) to examine whether union strength alters the balance of compensation incentives provided by inside debt. Both measures are truncated at zero; therefore, for comparability to related research, we estimate the regressions using the tobit methodology. Since both Inside- and Relative Debt measures are highly skewed as demonstrated in Table 1 Panel A, we normalize the distributions by logging (1+) each measure. To insure that skewness of the CEO inside debt measures does not bias our tobit-based results, we also estimate median regressions. Intersecting the various databases results in a total of 8,584 firm-year observations used in the cross-sectional models. The regression model is specified as follows:

The coefficient estimates for Equation (1) are presented in Table 2. All explanatory variables are winsorized at the 1% tails, and we cluster the robust standard errors at the firm level. Labor strength is significantly and positively associated with Inside debt ratio (Relative debt ratio) at the 1% (5%) levels using the tobit methodology (Models 1 and 2), and at the 1% level using median regressions (Models 3 and 4). The signs and significance of the control variables are generally consistent with the findings of Sundaram and Yermack (2007) and related research: older CEOs and firms are associated with greater debt-like compensation, while CEOs that are also board chairs have a higher proportion of debt-like compensation. Among the financial control variables, stock price performance is negatively associated with Inside debt. Consistent with related work, Firm size is positively associated with debt-like compensation.
Regressions of CEO Inside and Relative Debt Ratios on Labor Strength and Additional Control Variables.
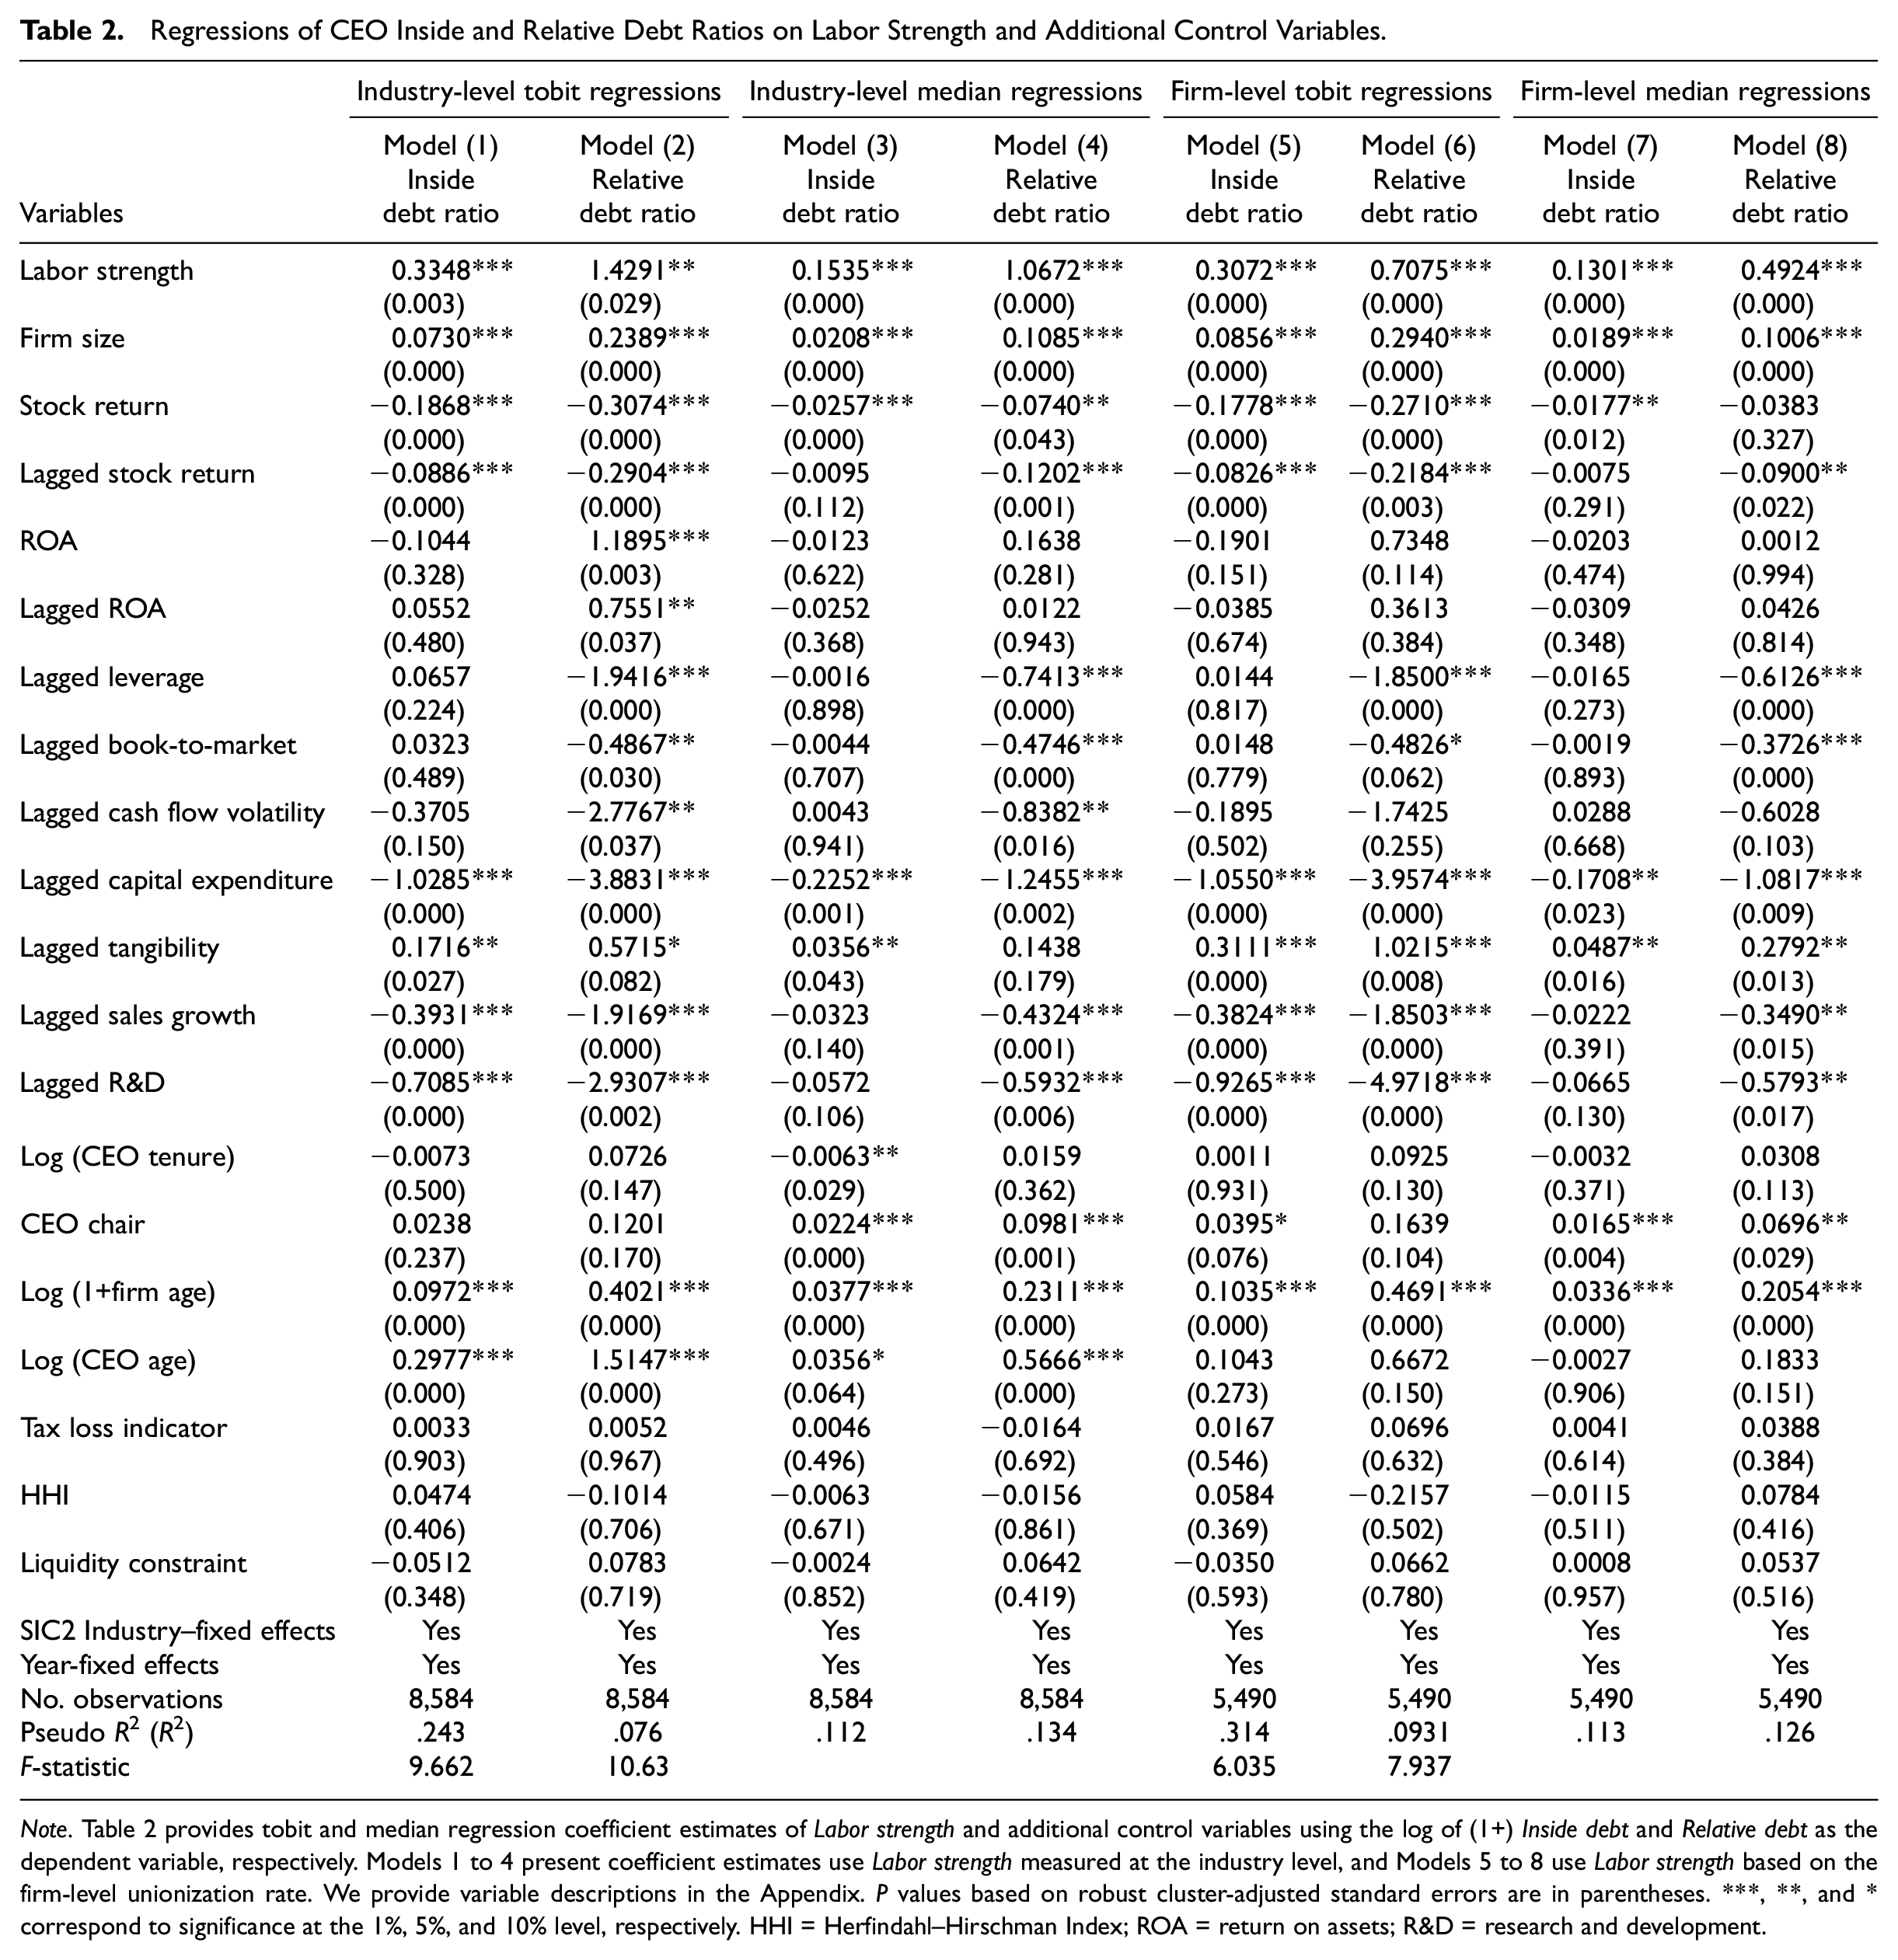
Note.Table 2 provides tobit and median regression coefficient estimates of Labor strength and additional control variables using the log of (1+) Inside debt and Relative debt as the dependent variable, respectively. Models 1 to 4 present coefficient estimates use Labor strength measured at the industry level, and Models 5 to 8 use Labor strength based on the firm-level unionization rate. We provide variable descriptions in the Appendix. P values based on robust cluster-adjusted standard errors are in parentheses. ***, **, and * correspond to significance at the 1%, 5%, and 10% level, respectively. HHI = Herfindahl–Hirschman Index; ROA = return on assets; R&D = research and development.
To provide robustness for these results and to account for firm-level variation in union intensity, we hand-collect firm-level unionization rates from 10-K statements. Because firms are not required to disclose union membership information, our sample size decreases by more than 3,000 observations. Similar to the tobit regression results of Models 1 and 2, Labor strength using firm-level union rates remains positive and significant at the 1% level in Panel A Models 5 and 6 suggesting that industry-level unionization information does not drive our results. These results are robust to the use of median regression methodology (Models 7 and 8), where Labor strength continues to be significantly related to CEO inside and relative debt ratios at the 1% level. The signs and significance of the remaining control variables are broadly similar to the prior industry-level models.
Tests of robustness
Table 2 Models 1 and 8 illustrate that the Labor strength measure is significantly associated with the CEO inside and relative debt ratios. However, it is possible that the cross-sectional Labor strength effect is driven by the firms’ labor intensity and not the unions’ bargaining strength. We directly address this possibility by replacing the Labor strength measure with the percentage of the firm’s unionized workers drawn from the financial statements of the subset of firms that provide unionization information. We re-estimate our core regression results in Table 2 Models 1 and 4 using the unscaled firm-level unionization rate along with the additional control variables described by Equation 1. The results in Table 3 Panel A demonstrate that the firm-level unionization rate estimates closely reflect the industry-level Labor strength results. Using the tobit methodology, the firm-level rate is positive and significant at the 1% (5%) levels using Inside debt ratio (Relative debt ratio) as the dependent variables in Models 1 and 2, respectively. We obtain qualitatively similar results using the median regression methodology in Models 3 and 4. To the extent that the firm-level unionization rate directly represents union-bargaining strength, these results suggest that the Labor strength measure effectively assesses union strength.
Tests of Robustness.

Note.Table 3 Panel A provide tobit and median regression estimates using the percentage of unionized workers obtained from 10-K statements, using the log of (1+) Inside debt and Relative debt as the dependent variables. Panel B Models 1 and 2 provide tobit coefficient estimates controlling for location effects (Strong union state indicators) using the log of (1+) Inside debt and Relative debt as the dependent variable, respectively. Models 3 and 4 provide instrumental variable (IV) tobit estimates. P values based on robust cluster-adjusted standard errors are in parentheses. ***, **, and * correspond to significance at the 1%, 5%, and 10% level, respectively.
It is also possible that an omitted variable not captured by the firm-level regressors and the industry-fixed effects is driving the results presented in Table 2. In particular, geographic regions not only have a significant bearing on the pattern of unionization but may also be correlated with a firm’s major financial characteristics including executive compensation. To address this possibility, we re-estimate Equation (1) to control for the effects of headquarter location.
Union-bargaining power is associated with the supply of replacement workers and the firm’s ability to replace union members with nonunionized workers. To the extent that unions hold more power in the labor markets of strong union states, it follows that managers have less bargaining power and consequently have a greater incentive to improve their negotiating position through their compensation. Calio et al. (2014) identify the 10 states with the strongest union presence using data from the U.S. Bureau of Labor Statistics, the Unionstats.com website, and the U.S. Census Bureau. 12 We use the Compustat data item STATE to identify if the firm is located in one of these 10 states. Due to correlation between Labor strength and the state indicator variables, the impact of location on compensation is confounded because Labor strength already captures its effects. Labor strength residual is the component of Labor strength that is orthogonal to location and is the error term from a regression of Labor strength on the 10 strong union state indicator variables. In Table 3 Panel B, we report the tobit coefficient estimates for Equation (1) using Inside debt (Relative debt) as the dependent variables in Models 1 and 2, respectively. The F-statistic for the joint significance of the 10-state indicator variables is significant at the 1% level in both Models, indicating that location in strong union states affects firm-level compensation policies as predicted. Nonetheless, as Models 1 and 2 illustrate, Labor strength residual is positive and significant at the 5% level or lower, demonstrating that unionization intensity has a significant impact on debt-like compensation independent of the effects related to firm location.
We also address potential endogeneity between Labor strength and debt-like compensation. We re-estimate Equation (1) using an instrumental variable (IV) tobit approach, specifying Labor strength as endogenous. The key requirements for instrument validity are relevance and exogeneity: we identify two instruments for Labor strength based on labor force characteristics and economies of scale related to the costs of organizing that are unlikely to be directly associated with compensation choices. First, Hirsch (1980) argues that labor mobility is likely to be greater, and demand for unionization lower, in areas with more rapid growth in the labor force. Using the Bureau of Labor Statistics’ Geographic Profile of Employment and Unemployment, we calculate 1-year growth in the labor force for each state. Second, Stephens and Wallsterstein (1991) argue there are scale economies to organizing: labor is more costly to organize when industrial concentration is less, leading to lower union density. We collect the number of publicly listed firms in each state using the LexisNexis database as a proxy for concentration. Using these two variables as instruments for Labor strength, we estimate the models using maximum likelihood estimation.
In Table 3 Panel B, we report the IV tobit coefficient estimates in Models 3 and 4 using the Inside debt and Relative debt ratios as the dependent variables, respectively. We report the instruments’ first-stage coefficient estimates. As expected, both instruments are negatively related to Labor strength and statistically significant in both models. In the second stage, the Labor strength IVs are significant at the 10% levels using the Inside debt and Relative debt ratios as the dependent variables, respectively. The p values corresponding to the Kleibergen–Paap LM under-identification test and the Hanson over-identification test collectively suggest the instruments are appropriate and well identified.
Labor strength and CEO pay components: Cross-sectional effects
To better understand the underlying drivers of the associations presented in Tables 2 and 3, we examine the impact of Labor strength on the levels of current and debt-like components of CEO pay. Following the specification of Huang et al. (2017), we specify the determinants of current pay components (equity, base salary, and bonus) as follows:

We present our cross-sectional findings in Table 4 Models 1 to 7. In Models 1 to 3, we estimate the cross-sectional impact of Labor strength on the log of (1+) each component. In Model 1, we find a negative but insignificant relation between Labor strength and equity incentives. In Model 2, consistent with the findings of Singh and Agarwal (2002) who argue that higher executive salaries in unionized firms may simply reflect worker wage gains that have ratcheted up the organizational hierarchy to executive positions, we find that Labor strength is positively associated with CEO base salary. In Model 3, we find a statistically significant negative Labor strength effect on the cash bonus: greater union strength leads to a lower bonus after controlling for firm performance measures such as prior stock return and sales growth. This result is economically significant: increasing Labor strength from the median to the 75th quartile is associated with a 160% decrease in bonus. Huang et al. (2017) point out that unions use high levels of executive compensation as justification for their demands. Based on their findings that managers strategically use compensation to reduce unions’ bargaining advantage, it is possible that managers choose a lower annual bonus, given the potential negative reaction associated with its contribution to the CEO-worker pay gap.
Regressions of CEO Compensation Components on Labor Strength and Additional Control Variables.
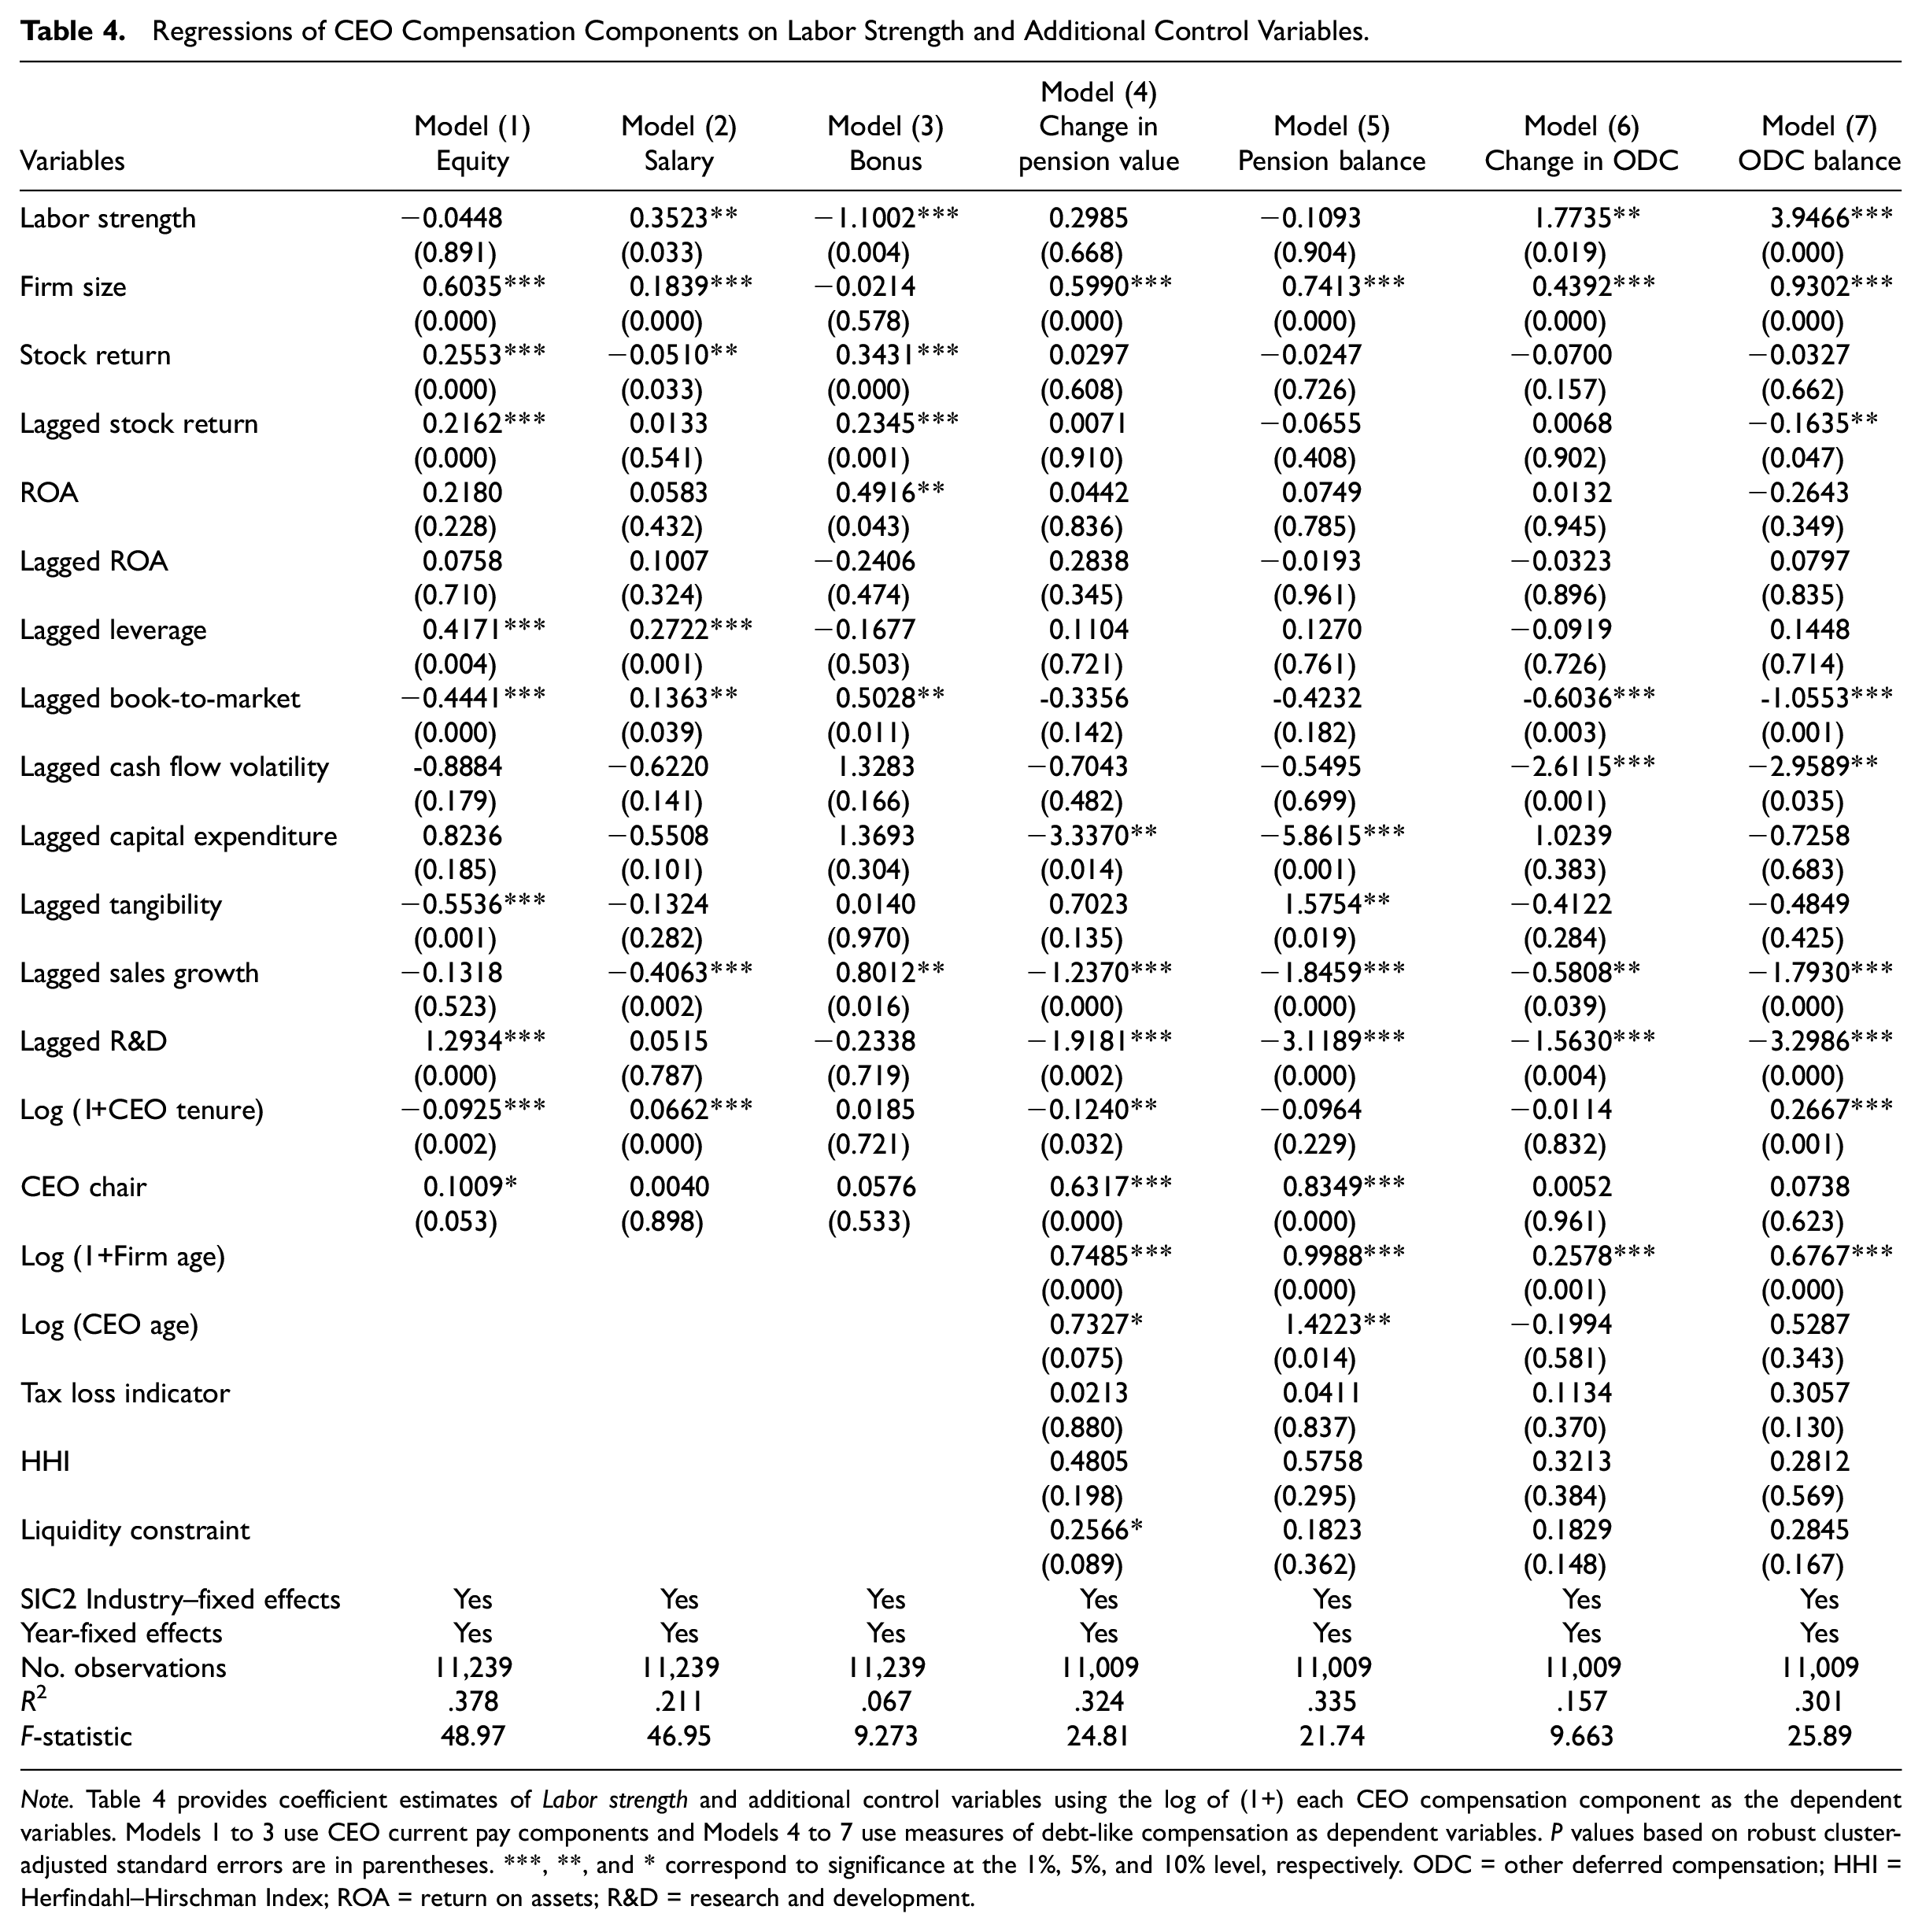
Note.Table 4 provides coefficient estimates of Labor strength and additional control variables using the log of (1+) each CEO compensation component as the dependent variables. Models 1 to 3 use CEO current pay components and Models 4 to 7 use measures of debt-like compensation as dependent variables. P values based on robust cluster-adjusted standard errors are in parentheses. ***, **, and * correspond to significance at the 1%, 5%, and 10% level, respectively. ODC = other deferred compensation; HHI = Herfindahl–Hirschman Index; ROA = return on assets; R&D = research and development.
In Table 4 Models 4 to 7, we examine the association between Labor strength and levels of CEO debt-like compensation components using the specification of Equation (1). In Models 4 and 5, we examine the alternative predictions of H1. In Model 4, we use the logged aggregate annual change to the actuarial present value of the pension liability balance (Execucomp item PENSION_CHG, “Change in pension value”) to measure the additional compensation expense accrued during the period, and in Model 5, we use the logged accumulated pension benefits from all pension plans (item PENSION_VALUE_TOT, “Pension balance”) to measure the value of the pension balance. Consistent with H1, Labor strength is statistically unrelated to neither the incremental nor balance measures of pension compensation. 13 In Model 6, we examine the prediction of H2: we use logged (1+) the increase in the CEO’s unpaid compensation balance during the year (item DEFER_CONTRIB_EXEC_TOT, “Change in ODC”) as the dependent variable, and in Model 7, we use the log of (1+) the aggregate balance in nontax-qualified ODC plans (item DEFER_BALANCE_TOT, “ODC balance”). Consistent with H2’s prediction that managers respond to union pressure by reducing current period cash compensation in exchange for accrued (deferred) compensation, Labor strength is significantly associated with both measures of deferred compensation at the 5% (1%) levels, respectively. In terms of economic significance, an increase in Labor strength from the median to the 75th percentile is associated with a 2.8-times increase in the increase in unpaid compensation balance and a 6.8-times increase in the ODC balance, respectively.
Subset analyses
Consistent with the prediction of H2, our results illustrate that increasing union presence has a positive effect on deferred compensation. To the extent that the Labor strength measure captures employee bargaining strength, we should find a significantly greater Labor strength effect when the firm is located in a business environment that facilitates greater union-bargaining power. In addition to the 10 strongest union states enumerated above, Calio et al. (2014) identify the 10 states with the weakest organized labor environments. 14 We examine if the prediction of H2 is stronger (weaker) in business environments where organized labor has greater (lower) bargaining power over management in Table 5 Panel A. In Models 1 and 3, Labor strength is significantly positively associated with the Change in ODC and ODC balance measures at the 1% levels for firms based in the strongest union states. In contrast, Labor strength is insignificantly related to these measures in the weakest states in Models 2 and 4. These results demonstrate that our base-line cross-sectional findings are strengthened in environments that facilitate union-bargaining strength. This intuition extends to the inside and relative debt ratios: in Models 5 and 7, Labor strength is positively associated with the Deferred inside debt ratio and Deferred relative debt ratio at the 1% levels, respectively, when estimated within the strong union state segment of the sample. Conversely, Labor strength is insignificantly associated with both measures in weak union states (Models 6 and 8). The subset Labor strength estimates are significantly different at the 1% level throughout Panel A.
In Table 5 Panel B, we conjecture that the motivation for managers to strategically defer compensation to counteract union pressure may be associated with her closeness to retirement. While ODC plans may have some withdrawal flexibility prior to retirement as discussed above, the risks associated with deferred income, such as those associated with voluntary departure or unanticipated financial distress, ultimately diminish as the CEO becomes closer to retirement subject to the plan’s rules. For example, the description of the executive nonqualified deferred compensation in General Motors Company’s 2015 proxy statement states the conditions where nonqualified deferred compensation may be distributed include when the executive reaches full career status retirement, specified simply when “an executive reaches the age of 55 with ten or more years of continuous service or age 62 or older and the executive voluntarily separates from the Company.” Therefore, we surmise that CEOs who are closer to retirement may have a greater incentive to defer income to improve their bargaining position.
We split the sample into subsets based on whether the CEO’s age is above or below the sample median age for each year. In Table 5 Panel B, consistent with the notion that the incentive to defer income increases in age, Models 1 and 3 demonstrate that Labor strength is strongly associated with the increase in unpaid compensation balance and the aggregate deferred compensation balance, respectively, for above-median age CEOs. In contrast, Models 2 and 4 illustrate that Labor strength is statistically unassociated for CEOs aged below the median. In Models 5 and 6 (Models 7 and 8) using Deferred inside debt (Deferred relative debt) as the dependent variable, respectively, Labor strength is insignificantly different from zero for CEOs in the below-median group and is positive and significant at the 1% level in the above-median subset. As in Panel A, the Labor strength estimates between subsets are significantly different at the 1% levels. Taken together, the subset analyses of Table 5 provide further support for H2.
Subset Analyses.

Note.Table 5 presents coefficient estimates using the logs of (1+) the change in ODC, ODC balance, Deferred Inside Debt Ratio, and Deferred Relative Debt Ratio as the dependent variables for subsets defined by headquarter locations in strong and weak union states (Panel A) and segmented by CEO age (Panel B). P values are given in parentheses and are based on robust cluster-adjusted standard errors. ***, **, and * correspond to significance at the 1%, 5%, and 10% level, respectively. ODC = other deferred compensation.
CEO pay components and union pressure: Difference-in-differences analyses
Negotiations associated with contract expirations represent an opportune time for unions to capture greater rents. Extant research demonstrates that firms attempt to increase their bargaining power prior to contract negotiations through dividend cuts (DeAngelo & DeAngelo, 1991), debt issuance (Bronars & Deere, 1991), and reduced cash holdings (Klasa et al., 2009). In addition, Huang et al. (2017) find that CEO compensation decreases prior to negotiations primarily through the management of option grants timing. We collect data on contract expirations from the BNA Labor Plus database maintained by the Bureau of National Affairs (BNA). We merge the BNA Labor Plus data set to our sample of firms using the first two words of the firm’s name and individually examine each match to insure correctly merged firms. If there are multiple contract negotiations for a firm in a given year, we aggregate the numbers of represented workers. Similar to Klasa et al. (2009), we include negotiations that involve at least 1,000 workers to insure that the contract(s) covers a meaningful number of employees. Merging this sample with Execucomp and Compustat results in a total of 155 firm-level observations. We identify up to five non-negotiation matched firms based on industry (two-digit SIC) and size (closest total assets within plus/minus 30% of the sample firm’s total assets) in the negotiation year from Execucomp. Using each treated firm and its matched firm counterparts, we construct a 4-year panel for each firm: the two years immediately prior to the contract negotiation year and the following 2 years. Based on our cross-sectional findings, we expect the bonus to increase, and the change in ODC to decrease, when the negotiation process concludes. We test this premise by interacting Treated with Post using the following regression model:

The outcome variables are the log of (1+) each current and debt-like compensation component. The coefficient estimate α3, represents the net difference in the dependent variable for treated firms in the POST period relative to matched firms. If the onset of contract negotiations provides an incentive for managers to improve their bargaining power through their compensation choices, then the α3 estimate should be negative using the logged bonus as the dependent variable and positive using the logged increase to the CEO’s unpaid balance to the unpaid compensation liability (ODC) balance during the year.
Following prior work, we use the percentage of employees involved in the contract negotiations as a direct measure of union-bargaining strength. Negotiation ratio is the number of represented employees obtained from BNA Labor Plus divided by the total number of employees (Compustat item EMP). In Table 6 Panel A1, we provide Negotiation ratio summary statistics for the year of the contract negotiation. For the typical treated firm, the negotiations involve a mean (median) of 23.6% (9.8%) of workers employed by the firm.
Contract Negotiations and CEO Compensation Components: Difference in Differences Estimates.
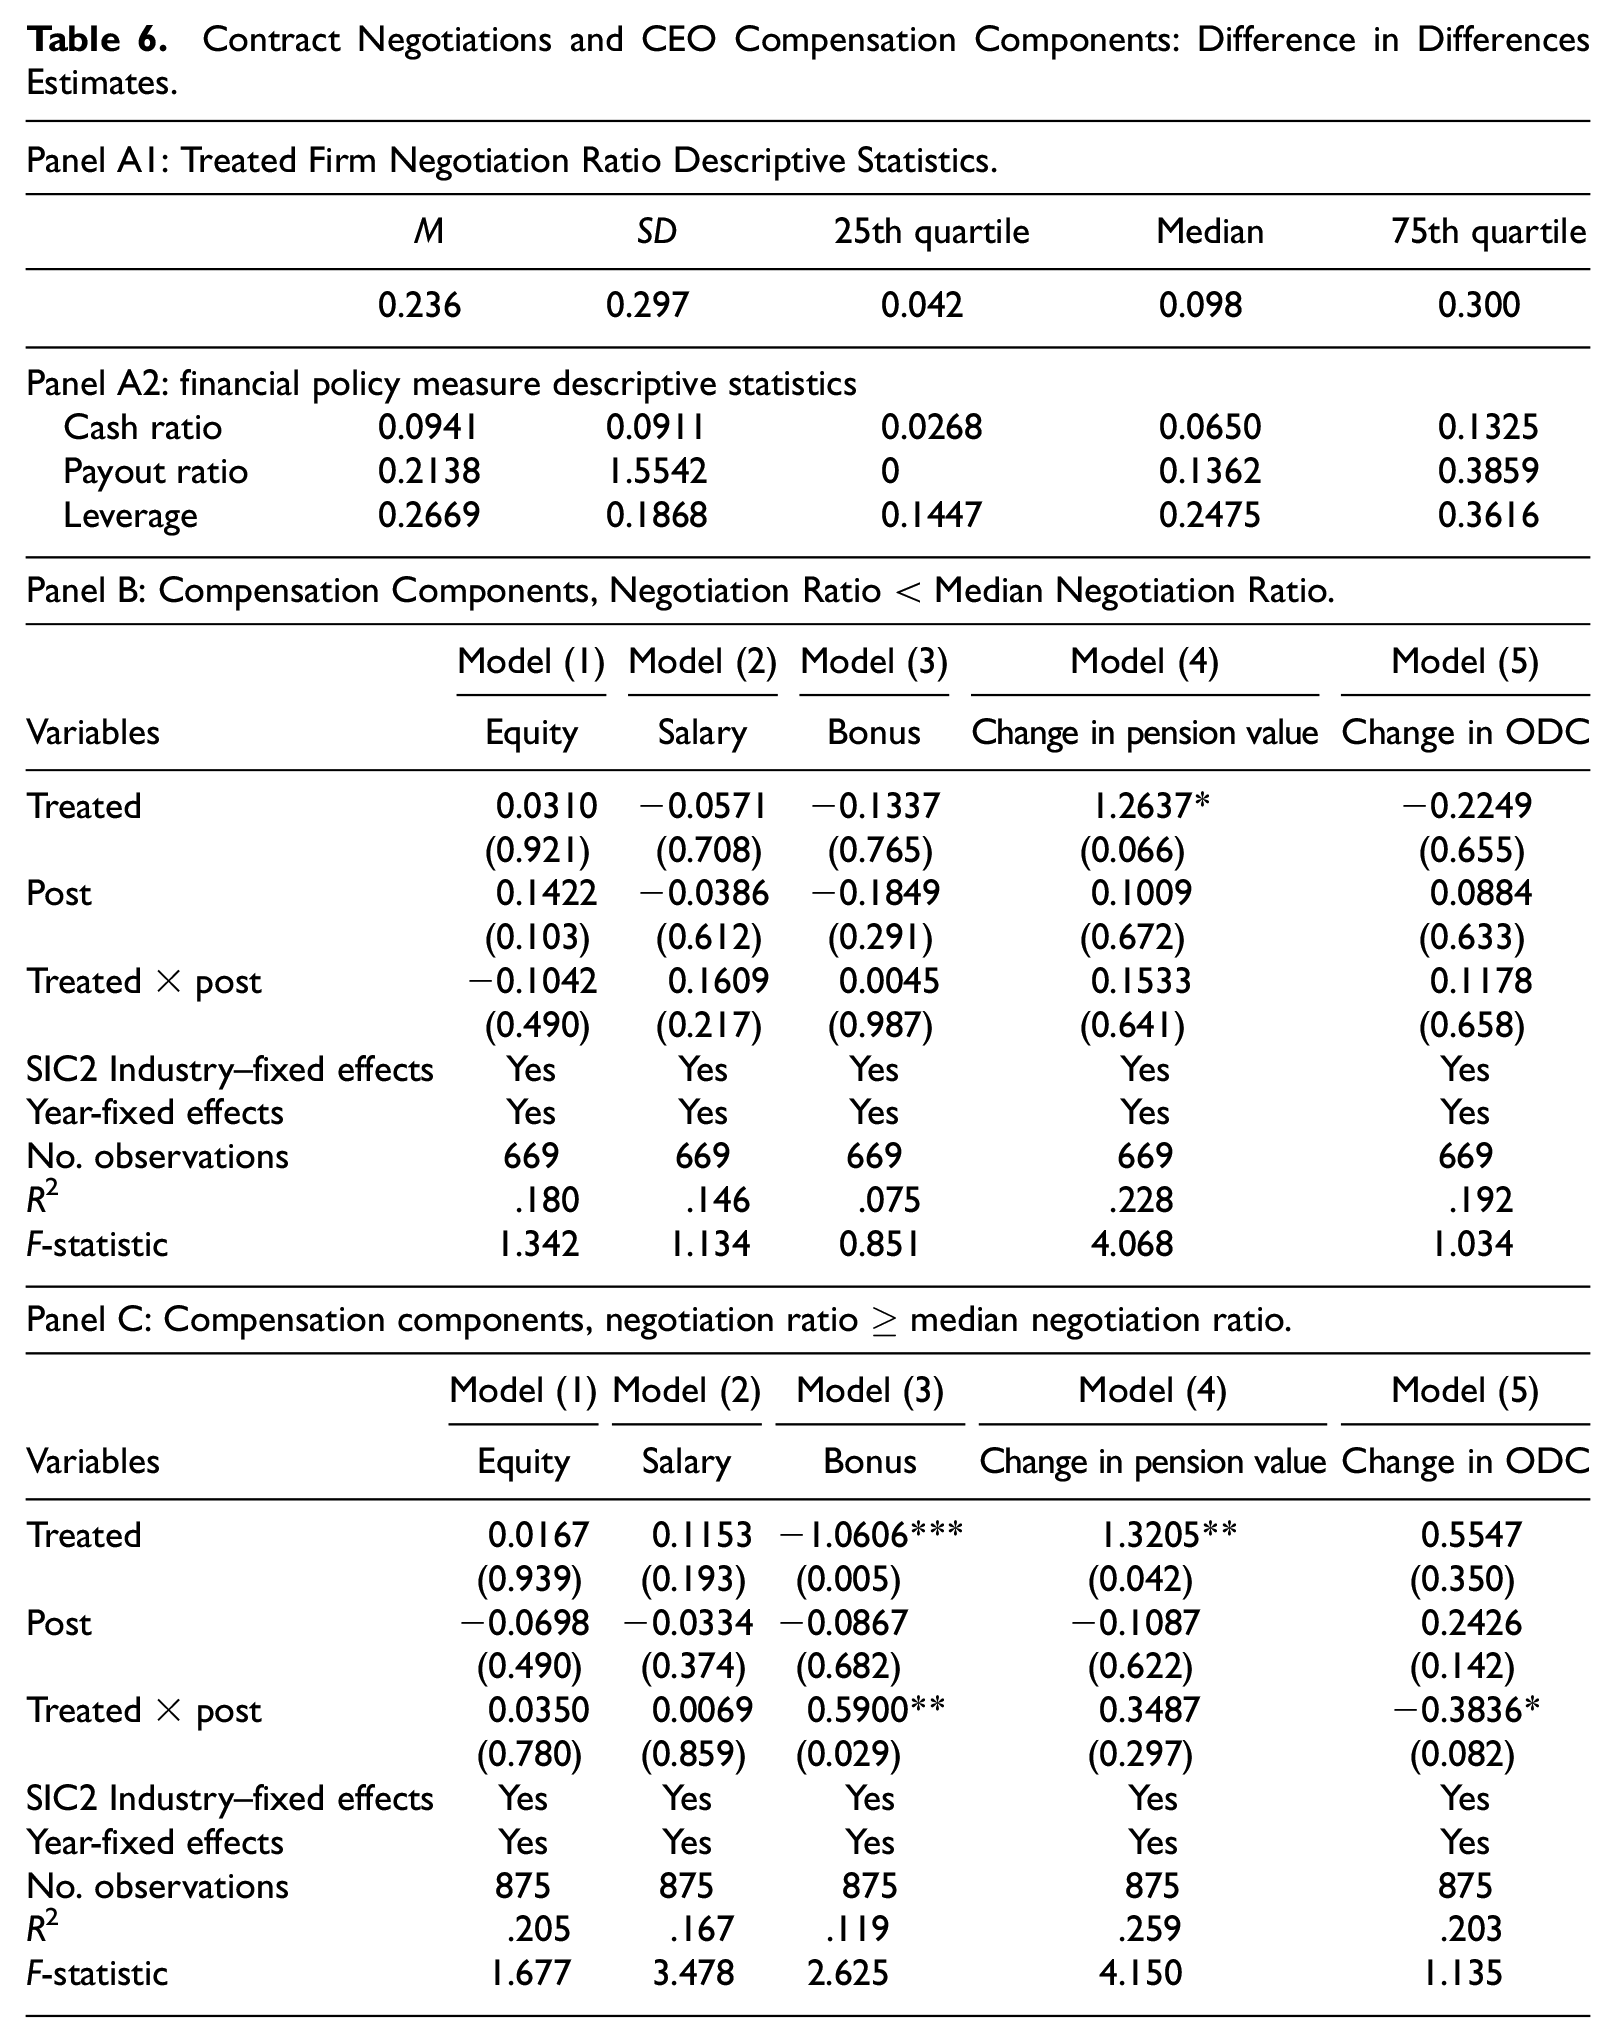
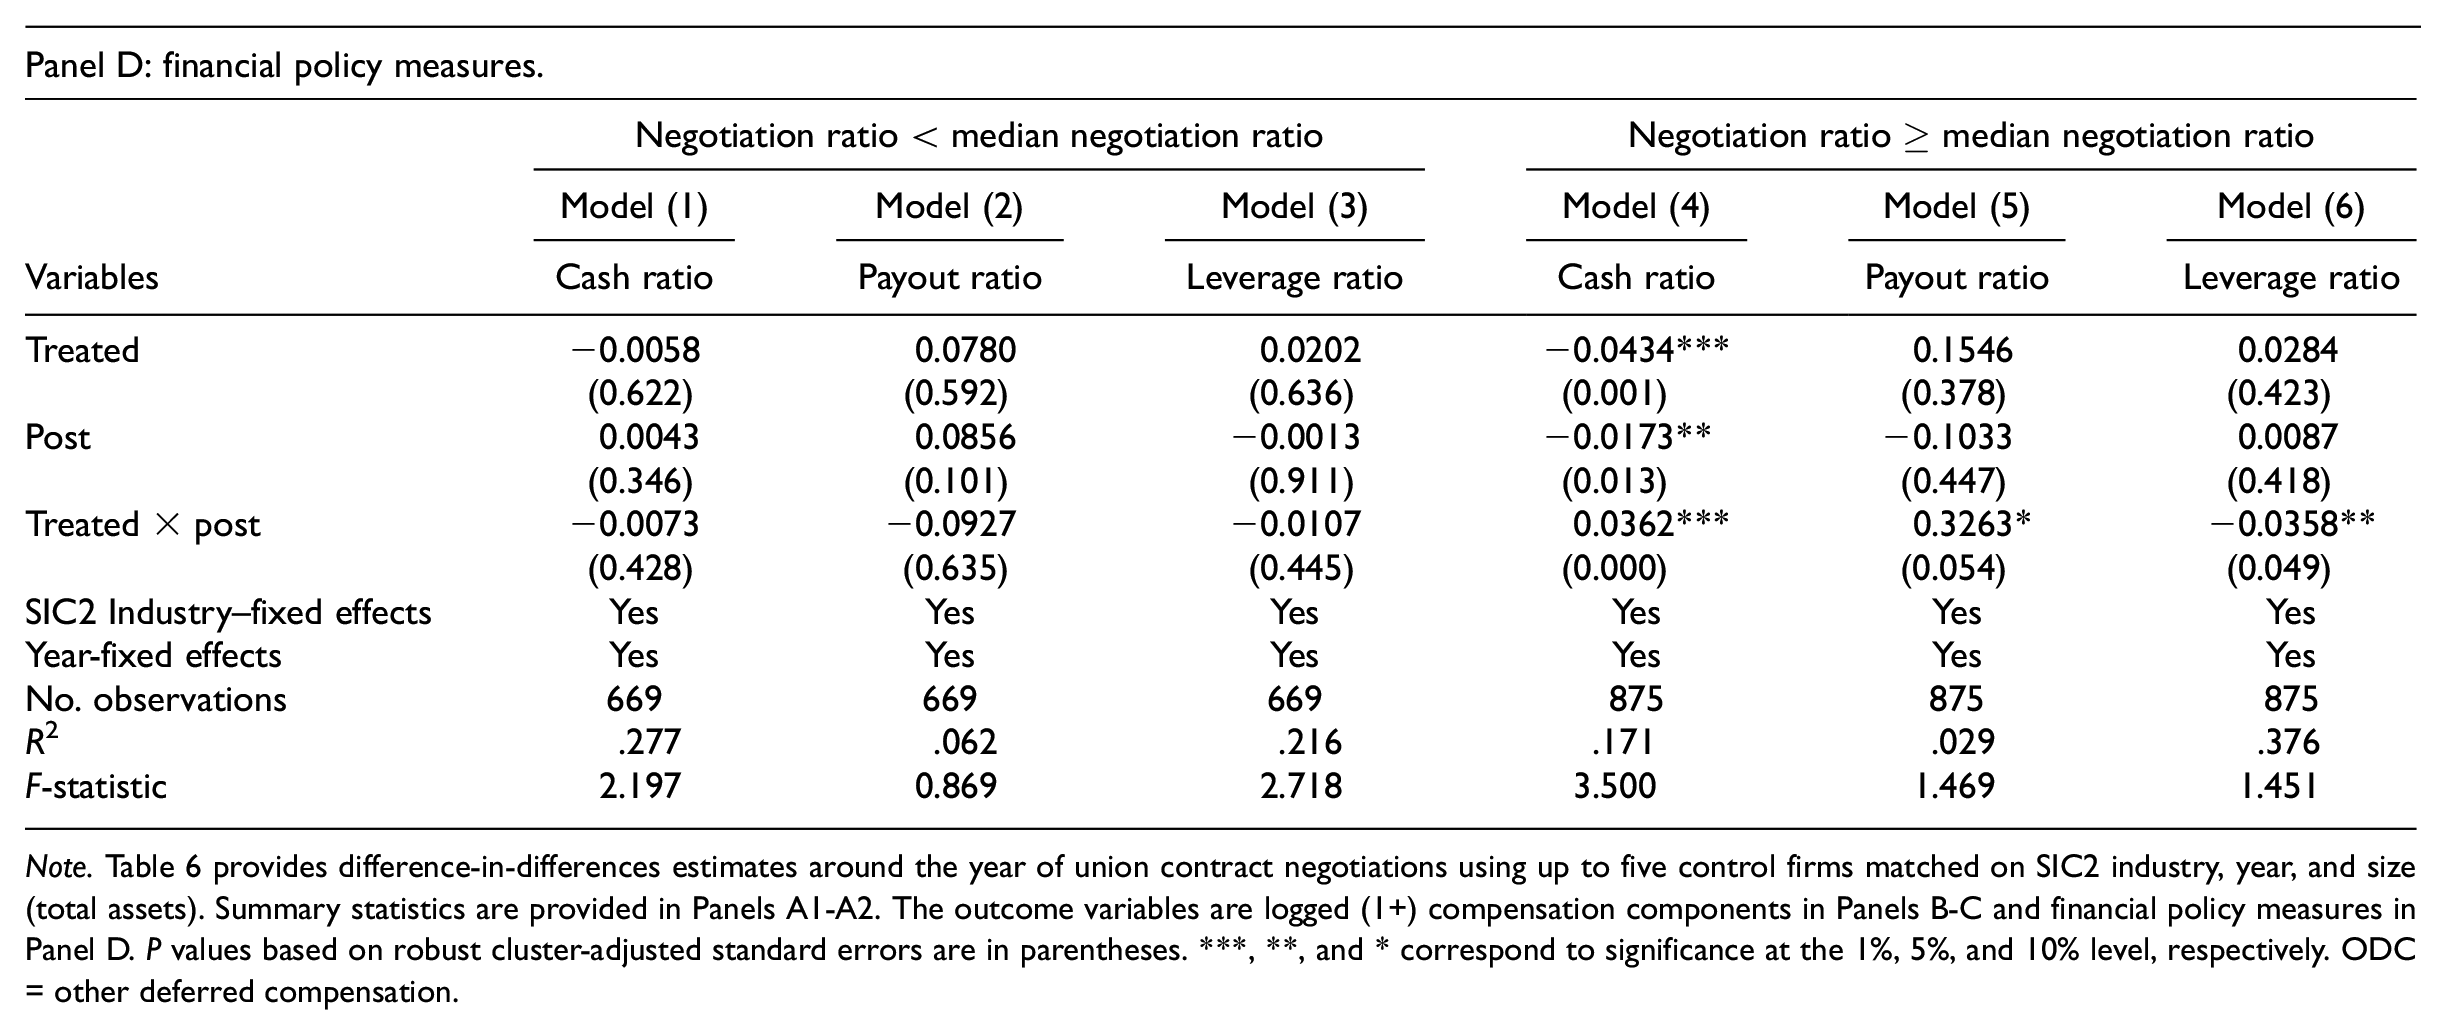
Note.Table 6 provides difference-in-differences estimates around the year of union contract negotiations using up to five control firms matched on SIC2 industry, year, and size (total assets). Summary statistics are provided in Panels A1-A2. The outcome variables are logged (1+) compensation components in Panels B-C and financial policy measures in Panel D. P values based on robust cluster-adjusted standard errors are in parentheses. ***, **, and * correspond to significance at the 1%, 5%, and 10% level, respectively. ODC = other deferred compensation.
Based on a total (treated and matched firm) sample size of 1,544 firm-year observations, we segment the sample of treated firms around the median Negotiation ratio of 0.098. In Panel B, we present estimates using the below-median segment of treated firms and their matched counterparts. The statistically insignificant α3 estimates demonstrate that none of the compensation components are significantly impacted by contract negotiations for below-median Negotiation ratio firms. In contrast, Panel C provides a distinct pattern of results using the above-median segment of the sample. Consistent with the findings of Boodoo (2018) and our results above, highly unionized companies are associated with a higher pension allocation element of CEO pay as evidenced by the significant Treated estimate. While CEO equity and salary compensation remain unchanged following contract negotiations, the bonus increases significantly for treated firms relative to the matched set of firms. While Model 4 illustrates the α3 estimate using the pension change as the outcome variable is insignificant, Model 5 demonstrates the increase to the ODC balance decreases significantly for above-median Negotiation ratio firms as illustrated in Model 5.
As discussed above, prior work reports that managers use other corporate policies including cash holdings, dividend payout, and leverage around contract negotiations to strategically increase their bargaining power around contract renegotiations. To test the robustness of the results in Panels B and C, we examine the impact of contract negotiations on corporate policy measures using the same set of treated and matched firms. Consistent with the findings of prior research and reflective of our results in Panels B and C, Panel D demonstrates cash holdings and dividend payout significantly increase while leverage significantly decreases following negotiations for the above-median negotiation ratio subset.
Additional Tests of Robustness
We conduct several robustness tests that are briefly discussed below. We leave these results untabulated for brevity; however, they are available upon request.
Compensation Consultant Effect
As Murphy and Sandino (2020) document, the percentage of firms using compensation consultants has experienced strong secular growth, reaching 86% of Execucomp firms in 2014. Gohl and Gupta (2010) provide evidence that the use of compensation consultants contributes to higher current CEO pay. Therefore, if external compensation consultants are associated with higher pay, CEOs of unionized firms that also employ consultants may be more likely to use the deferral of (higher) current income as a bargaining tool. To investigate this premise, we obtain available proxy statements from the SEC’s Electronic Data Gathering, Analysis, and Retrieval (EDGAR) database for the firm-years in our 11,009-observation final regression sample using a web crawling algorithm. We create a binary variable Consultant equal to one if the proxy indicates the firm uses a compensation consultant in a given firm-year and zero otherwise. Consistent with the findings of Murphy and Sandino (2020), 82.1% of firm-year observations use a consultant. In line with related research, difference in means analyses demonstrates that current CEO compensation for these firms is significantly higher. We examine if greater union strength is associated with a decreased use of consultants. Although the effect is relatively small, higher (above median) Labor strength firms are 2.3% less likely to use a consultant. To investigate a potential interactive effect, we estimate Equation (1) including Consultant and its interaction with Labor strength. The interaction is significantly associated with the logged change in ODC (p = .046). The interaction remains positive but weakens using the logged ODC balance as the dependent variable, potentially because the balance reflects all prior deferral decisions and a given firm may not have employed a consultant in prior years.
High-Tech Industry Effect
Kwon and Yin (2006) demonstrate that compensation structure differs between high-tech and traditional industries where equity compensation is relatively more (less) important, respectively. As such, there should be a weaker union effect on the deferred income measures in high-tech sector firms because (a) there is relatively less cash pay to be deferred, and (b) high-tech industries feature significantly lower union presence (e.g., Conger & Scheiber, 2019). In difference in means analyses, we find that union presence is significantly lower in high-tech firms. Similar to Kwon and Yin (2006), we define high tech as electronic equipment, computers, pharmaceutical products, and communication using Fama-French 48 industry definitions. We estimate Equation (1) on the data set segmented by high-tech and non-high-tech industries. Consistent with our expectation, the Labor strength estimate is significantly related to the logged ODC change and balance dependent variables at the 10% and 1% levels for non-high-tech firms, respectively, and is insignificant in the high-tech segment.
Legislative Effect
Right-to-work (RTW) laws restrict the ability of unions to require current or future employees to become members or pay dues as a condition for working at a firm where a union represents workers. In addition to reducing the threat of union-organizing attempts at nonunionized companies, RTW laws are likely to decrease union-bargaining power at unionized firms and thereby diminishing the incentive to defer current compensation. Within our sample period, new RTW laws became effective in Indiana (February, 2012) and Michigan (January, 2013). We identify 27 (20) firms that were headquartered in Michigan (Indiana) in 2013 (2012) in our data set, respectively. We define high (low) union strength subsets if the Labor strength measure in the RTW adoption year is greater than (less than) the yearly median of all Execucomp firms outside of Michigan and Indiana, respectively. Following our matching procedure for the contract negotiations analysis, we identify up to five matched firms from non-RTW states. We test the impact of RTW legislation by interacting Treated firms headquartered in these states with Post using the difference-in-differences methodology specified by Equation (3). The α3 estimate in the low Labor strength subset is insignificantly different from zero. However, in the high Labor strength subset, the bonus increases significantly (p = .010) relative to the matched firms while the change in ODC decreases significantly (p = .092).
Conclusions
We explore the role played by labor unions in the determination of debt-like compensation. The inside debt literature typically uses pension compensation and ODC to gauge debt-like compensation. The expected relation between union presence and pension compensation is unclear. Pension compensation may serve to better align CEO and union preferences, and it is also possible that the complexity of pension benefit valuation may allow firms more scope to disguise the amount of executive compensation in the face of union pressure. However, the inflexibility of pension contracts could preclude their use for these purposes. Alternatively, the findings of prior research demonstrating that managers strategically respond to union pressure suggest that union strength may be associated with the deferred compensation component of inside debt. In initial analyses, we find that union presence is an important determinant of the inside and relative debt ratios used in extant research. This association is robust to controls for endogeneity, omitted variables, and alternative measures of union strength.
Unionization intensity does not appear to have a relation with pension compensation. In contrast, unionization is significantly associated with alternate measures of deferred compensation, suggesting managers respond to union pressure by substituting current period cash compensation in exchange for accrued (deferred) compensation. This effect consistently becomes stronger (weaker) when firms are located in environments that strengthen (weaken) union-bargaining strength and when CEOs have greater (lesser) incentives to defer income based on their closeness to retirement, providing further evidence to support the substitution hypothesis. We obtain a similar pattern of results using a matched firm difference-in-differences approach focusing on union contract negotiations.
Our results collectively suggest that unions play an important role in the use of deferred compensation. While these findings do not have implications for the optimality of debt-like compensation in CEO contracting, they do suggest that the optimal compensation contract for shareholders in unionized firms could involve more debt-like compensation to the extent deferred compensation can be used to improve the efficiency of contracting between shareholders and organized labor.
Footnotes
Acknowledgements
We are grateful to Bharat Sarath (JAAF Editor) and an anonymous reviewer for their helpful comments and suggestions. We thank Sarah Fulmer (2014 FMA discussant) and seminar participants at University of North Texas, University of Auckland, Massey University (Palmerston North), and Concordia University. Nishikawa appreciates excellent research assistance from Justin Shapiro. All remaining errors are ours.
Declaration of Conflicting Interests
The author(s) declared no potential conflicts of interest with respect to the research, authorship, and/or publication of this article.
Funding
The author(s) received no financial support for the research, authorship, and/or publication of this article.
