
Abstract
This article regresses the market value of equity on pre-depreciation income and on depreciation expense for capital-intensive firms, referring to the coefficients from our model as valuation weights. The valuation weight on depreciation expense versus the weight on pre-depreciation income are compared, to detect depreciation biases, over time and across sectors. Our model shows that the valuation weights on depreciation expense change over time, if the persistence of the cash flow components of net income varies over time and if the accrual for depreciation is inflexible (e.g., straight-line depreciation). For Real Estate Investment Trusts (REITs), we find the valuation weight on pre-depreciation income increases with industry upturns, while the valuation weight on depreciation expense decreases during upturns. This result is contrasted to the nearly equal valuation weights for the cash flow and depreciation components of earnings for Resource firms (e.g., mines) over time. We conjecture this is because depletion accounting flexibly allows for “depreciation” to exhibit less bias than in other sectors. In summary, actual depreciation practices influence time variation in the valuation of depreciation, a point which has been underappreciated in prior studies.
Keywords
Which costs are relevant in this decision? . . . The original cost of the car is a sunk cost. This cost has already been incurred and therefore can never differ between alternatives . . . The same is true of the accounting depreciation of $2,800 per year, which simply spreads the sunk cost across the useful life of the asset.
Introduction
As the above quote suggests, some view depreciation to be an allocation of sunk costs, irrelevant in valuing a business or investment opportunity. The standard advice is that a decision-maker should instead focus on cash flows. Yet, in practice, financial analysts at times use valuation approaches that rely on multiples of earnings after depreciation expense, while at other times, valuation multiples rely on pre-depreciation performance measures such as earnings before interest, taxes and depreciation and amortization (EBITDA) or funds from operations (FFO). 1 The common practice of valuing a business using multiples, based on various current performance measures, can be viewed as a simplified discounted cash flow (DCF) approach. Current performance and market multiples are viewed as sufficient statistics to capture future cash flows, net of new capital expenditures, and discounting. 2 Given the variety of valuation multiples employed, some before depreciation expense and others after, one wonders: When is depreciation expense relevant for valuing a business and should its valuation weight be the same as for other earnings components?
In this study, we explore these questions, across different types of capital-intensive firms and across different time periods when capital asset values have both increased and decreased in value. We employ a regression of firms’ market values on two key variables—earnings before depreciation (a.k.a. pre-depreciation net income) and depreciation expense. Our hypotheses, additional regression control variables, and interpretation of estimated coefficients are guided by the residual income valuation framework in Feltham and Ohlson (1996; hereafter FO96). This framework provides food for thought and is consistent with our aim to explain why valuation multiples may anchor on net income, before or after depreciation. This introduction provides the intuition behind the hypotheses we test; a more formal presentation of the framework and its insights can be found in the “Valuation of REITs Using Accounting Information” section.
With regard to valuation multiples, one argument against relying exclusively on earnings before depreciation in valuation is that this number does not capture the future cost of replacing the productive capacity of capital assets used in operations. If asset replacement is required to maintain the cash flow stream, then depreciation expense potentially proxies for long-term capital maintenance costs. If depreciation expense is a reasonable proxy for future maintenance costs, earnings after depreciation could be a valid number in valuation. 3 Whether the valuation multiple on depreciation expense is the same as the multiple on other earnings components, at a minimum, on the rate at which capital assets expire with use or time, and whether accounting depreciation, as it is measured, is able to capture this decline in value.
Somewhat at odds with our view that depreciation could be useful in valuation, accountants argue that the accrual for depreciation is not intended to track the actual change in market value of an asset. 4 While depreciation methods can differ across asset types and industries, depreciation is typically designed to allocate the original cost of a capital asset, less its expected residual value, over the asset’s useful life, in a systematic and rational manner. 5
In some settings, such as the Resource industry, depreciation (or depletion in the case of mining reserves) is closely linked to the rate at which the physical asset is consumed in operations, and therefore is a predictor of the need to maintain these assets. Accordingly, for this sector, we conjecture that depreciation will load as a relevant factor in an earnings-based valuation regression, with a weight that is close to that placed on other components of net income. Real Estate Investment Trusts (REITs), at the other extreme, follow a rather rigid depreciation approach when accounting for their developed properties. Land, of course, is not depreciated, but buildings are depreciated on a straight-line basis, over no more than 40 years, to a residual book value of zero. Clearly, buildings can last for more than 40 years and the land to which they are attached will often increase in value, depending on demand. Therefore, REITs are likely to have depreciation expense that is conservative (i.e., that exceeds the rate at which that asset is being consumed in operations). Thus, for REITs, the valuation weight on depreciation, in an earnings-based valuation regression, is likely to be lower than the weight assigned to other earnings components and could possibly be zero. The idea that depreciation expense is less biased for Resource firms than it is for REITs is elaborated on in the “Valuation of REITs Using Accounting Information” section and is our third hypothesis (H3).
With respect to REITs, we expect not only conservatism but also cyclicality in the valuation of depreciation. As demand for capital assets (and the services they provide to the market) increases, future revenues and net income will be higher. However, in the REIT industry, the increase in revenues and income often lag the increase in demand, due to construction delays and multi-year rental contracts. During booms, an efficient market will recognize that current revenues are understated relative to this expectation, and, to compensate, the valuation weight on revenues will temporarily increase and the weight on depreciation (a negative multiple of the capital asset’s original cost) will temporarily decrease. Similarly, during bust periods, the depreciation charge is likely to receive an increased weight in valuation, because asset values are declining and depreciation intends to capture declines in value. In general, we expect the valuation weight on pre-depreciation earnings to be pro-cyclical and that on depreciation expense to be countercyclical for REITs. This is the basic intuition behind our first and second hypotheses (H1 and H2). Our fourth hypothesis (H4), that Resource depreciation valuations exhibit less countercyclical changes than REITs, is based on the same logic as used in H3.
We employ a regression based on the FO96 accounting-based valuation model to test these hypotheses. The “Valuation of REITs Using Accounting Information” section describes the FO96 approach, highlighting why comparing the valuation weights on pre-depreciation income (FFO) and depreciation expense reveals depreciation bias. In view of H4, we also adapt FO96 to build-in valuation weights that possibly change in business cycles. Finally, we analyze a third capital-intensive sector—the Restaurants, Hotels, and Entertainment (RHE) industry. The RHE sector employs business models and depreciation methods similar to REITs, and is a useful valuation benchmark.
Across the 1994 to 2008 sample period, consistent with our prediction, we find, for REITs, that the valuation weight on depreciation expense is less than the weight on other components of net income; in fact, the valuation weight does not differ from zero. 6 This result is consistent with REITs’ accounting for real estate properties causing an overstatement of the consumption of the asset’s productive capacity. In addition, the result supports the use of a pre-depreciation multiples-based valuation approach in this sector. In contrast, for the Resource industry, pre-depreciation earnings and depreciation (plus depletion) expense both receive similar valuation weights and their difference is not significantly different from zero. Thus, results from the Resource sector suggest the depletion of mining assets is a reasonable proxy for capital maintenance, and they support a bottom-line earnings approach to multiples. The results for the RHE sector are in between the results for REITs and Resource firms; the weight on depreciation expense is positive but is less than the weight on other income components. 7 Finally, we find for REITs the weight on FFO is increasing with cycle and the weight on depreciation expense is decreasing with cycle (i.e., countercyclical). In the other two sectors (both for the Resource industry and for the RHE industry), we find no such cyclicality in valuation weights.
This article contributes to prior REIT valuation studies by showing why REIT income and depreciation expense ought to have time-varying valuation weights and why REIT depreciation sometimes appears to add to pre-depreciation income for valuation. While a few prior REIT studies have mentioned the possibility of macroeconomic-based explanations for valuation coefficients, these papers do not use sufficiently longtime periods to estimate a model with time-varying coefficients. 8 Our evidence that the valuation weight on depreciation follows a countercyclical pattern is novel.
Furthermore, we contribute to the literature on how depreciation is weighted in valuation, more generally, by extending the econometric analysis to non-REIT sectors. A major motivation for our examination of Resource and RHE firms stems from Kang and Zhao (2010), Table 5, where depreciation bias for non-REITs is compared with REITs. Their table appears to suggest that non-REIT firms have unbiased accumulated depreciation. In our opinion, this result is hard to explain. We argue (see the first paragraph of the “Introduction” section) that depreciation can combine with other components of retained earnings, if the pattern of depreciation expense captures changes in the pattern of future cash flows (i.e., if it proxies for capital maintenance cash flows). If some non-REIT firms employ the same rigid straight-line depreciation as REITs, it is not obvious that their depreciation will be more meaningful in valuation than it is for REITs.
Kang and Zhao’s explanation of why REITs differ from non-REITs does not address depreciation methods per se. 9 We replicate the Kang and Zhao (2010) sample selection procedure, and this helps to identify that the depreciation methods of some capital-intensive sectors (e.g., Resource firms) use accounting depreciation methods that are more likely to approximate economic depreciation than in other sectors (e.g., RHE). It is not generally true, as one might mistakenly believe based on this prior work, that all non-REIT capital-intensive firms utilize depreciation methods that are unbiased.
Furthermore, from a practical standpoint, our results and the model highlight contexts in which analysts should be expected to include or exclude depreciation expense in valuation. For example, in the “Valuation of REITs Using Accounting Information” section, we point out that if operating cash flows are highly persistent, a pre-depreciation valuation summary suffices. Our study also contributes to the literature on valuation multiples. Liu et al. (2002, 2007) find that on average equity values are more closely related to multiples of historical earnings than to multiples of historical cash flows or EBITDA. Yet, Liu et al. (2007) find that in some industries operating cash flows outperform historical earnings in explaining stock prices. Our study presents results suggesting that for REITs multiples of earnings before depreciation and amortization are likely to outperform multiples of net income in explaining valuations, but in other industries, such as the Resource industry, this result is reversed. Yee (2004) suggests combining a variety of valuation estimates based on multiples of different performance metrics, where the sum of the weights adds up to one, can be superior to relying on a single valuation multiple. We believe this approach is supported by our finding that in some industries (e.g., RHE) the valuation multiple weight placed on depreciation expense differs from the valuation multiple weight placed on other components of earnings.
The remainder of this study is organized as follows. The “Valuation of REITs Using Accounting Information” section presents a brief background on the REIT sector, one of the most studied industries with respect to how the market treats depreciation expense, and presents the theoretical valuation model and hypotheses. The “Research Design Choices, Sample, and Descriptive Statistics” section outlines key research design choices and explains our sample selection. The “Empirical Results” section provides tests of our hypotheses, and the “Conclusion” section concludes the study.
Valuation of REITs Using Accounting Information
Background on REITs
REITs are publicly traded, flow-through entities which avoid corporate taxation by passing earnings to shareholders through dividends. To qualify for this tax shield, a REIT must invest most of its assets in real estate and earn the majority of its income from rentals. Because REITs have large holdings of developed property, depreciation expense is a substantial yet controversial accrual. REIT managers have argued that depreciation expense exceeds the real depreciation of their developed property, resulting in net income understating firm performance. To overcome this shortcoming of net income, in 1991 the National Association of Real Estate Investment Trusts (NAREIT, 1991) developed a non-GAAP (Generally Accepted Accounting Principles) performance measure, FFO, which is based on net income before depreciation expense and before gains and losses on sale of real property. 10 REITs have voluntarily reported FFO in their annual reports since the early 1990s. NAREIT member companies claim that FFO reflects firm performance more accurately than net income (NAREIT, 1996), and analysts largely accept FFO as a standard industry earnings measure, despite some early criticisms (e.g., Martinez, 1998; Smith, 2001).
Debate over the appropriateness of FFO as a valuation measure led to the studies, comparing the valuation multiples applied to FFO versus to net income. For example Vincent (1999) and Fields et al. (1998) compare the two measures, net income versus FFO, based on each measure’s ability to explain levels of, or changes in, publicly traded equity values. Generally, such studies using data from the 1990s find little difference in the explanatory power of FFO versus net income ceteris paribus. Yet, research using data after 2000, roughly coinciding with increased precision in the definition of FFO by regulators, tends to conclude that FFO is more relevant (Baik et al., 2008; Kang & Zhao, 2010). However, the post-2000 research methods are not entirely comparable with those used for earlier samples. In addition, the evidence in prior studies relies on 3- to 6-year sample periods and cannot capture the impact of longer term real estate cycles on the valuation weights on FFO or depreciation. We suggest that the valuation properties of depreciation expense for REITs exhibit countercyclicality, and if so, this can partially explain the differences in results of this prior literature (see Online Table 3).
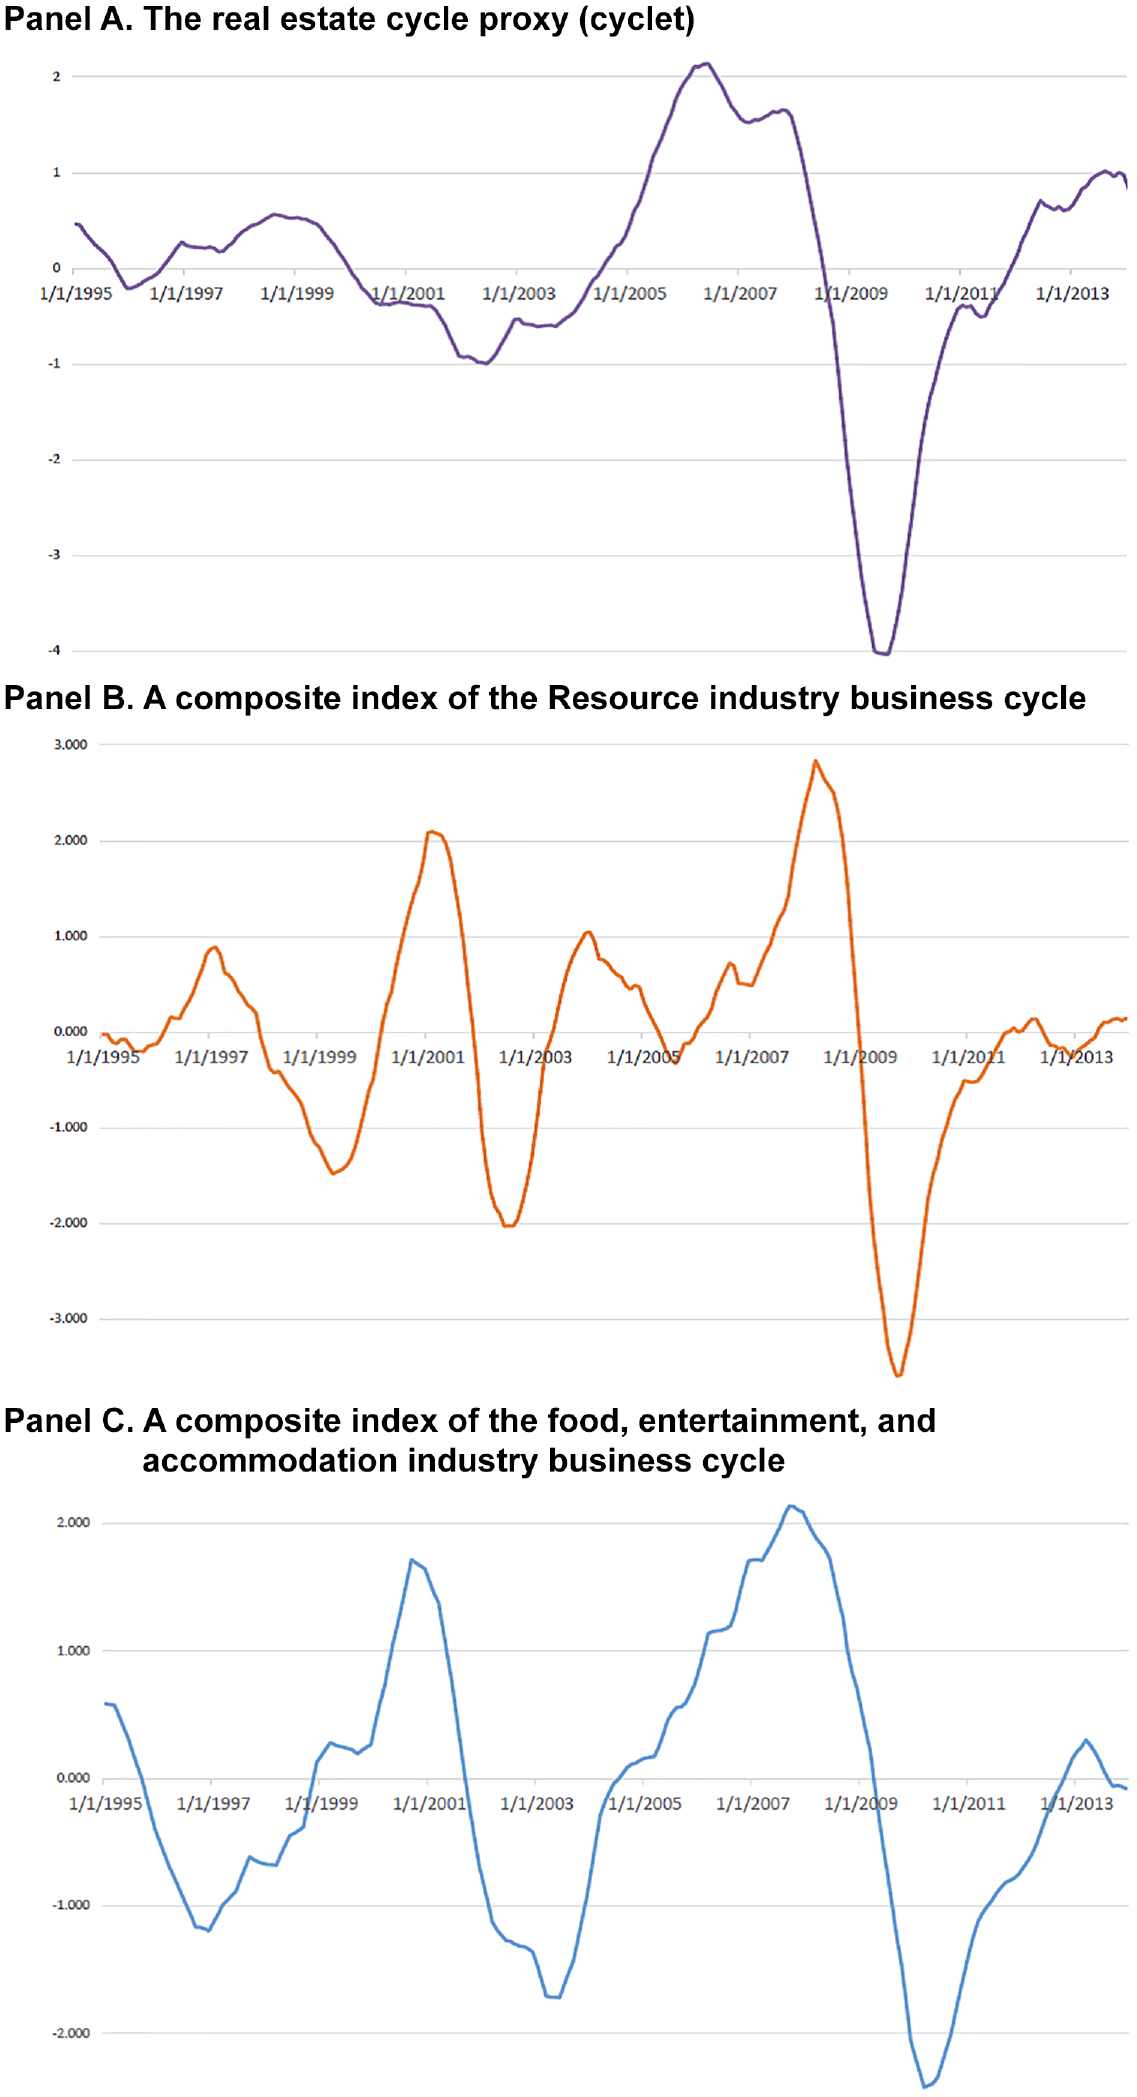
Our empirical tests link measures of real estate supply and demand shocks to changing persistence of cash flows for REITs. The idea that real estate fundamentals exhibit cyclical behavior is well accepted, but economists have puzzled over the reasons for it. To get a sense of what is meant by cyclicality, we plot real estate cycles from 1995 to 2013 (Panel A of Figure 1). It shows three distinct peaks and two troughs—a shallow trough in the early 2000s and a very deep trough which hits its minimum in 2009. Aside from the very sharp drop in 2008 and 2009, the process appears to move relatively smoothly between local maxima and minima. This cyclicality can occur due to the responses of real estate participants (e.g., buyers, sellers, and builders) to cyclical shocks created by underlying, macro-fundamentals such as unemployment or credit availability. Alternatively, cyclicality possibly originates from institutional frictions that lead to delayed responses of real estate prices to single shocks. Wheaton (1999) shows that a single shock can generate cyclicality if frictions in the economy prevent an immediate reaction to shocks, for example, rental contracts that commit renters to a fixed price over several years.
Cyclical patterns in variables related to real estate cycles and non-real estate industry business cycles.
Model Development and Hypotheses
This section provides an economic basis for our econometric model. However, some readers may prefer to skip most of this section and move directly to the “Research Design Choices, Sample, and Descriptive Statistics” section. Such readers can skim the text around two key equations below. The first equation, Equation 1a, implies a regression of firm market values on pre-depreciation net income (FFO), on depreciation expense, and on dividends, book value of equity, and investing cash flows. If the estimated coefficient on FFO is equivalent to the coefficient on depreciation expense, this is consistent with depreciation being an unbiased approximation to the decline in asset values. Relating this to our model, the result obtains if the rate of depreciation (
Equation 2 is based on the conjecture that the persistence of cash flows,
The FO96 framework
Past studies comparing the valuation of FFO to that of net income have often relied on the residual income valuation framework in Ohlson (1995). This unbiased version of the residual income model (i.e., a model in which long-term book and market values are expected to be equal) expresses value simply as book value of equity plus a multiple of residual income (i.e., net income minus a charge for invested capital). We rely on the FO96 valuation model because it explicitly allows for biased accounting, particularly for depreciation expense (and market values can deviate from book values). This seems important in a setting involving capital-intensive firms with potentially biased depreciation methods.
FO96 starts with fundamentals—The value of equity can be determined using expected future cash flows (see Online Appendix B for details). By starting with cash flows, FO96 clarifies the source of expected economic depreciation that accounting depreciation might capture. Specifically, the economic degradation (or “using up”) of operating assets equals the present value of expected changes in current (and future) cash flows. Such changes are easy to measure if an autoregressive process governs cash flows, which is our assumption:

This process specifies that cash flows from operating assets
To accommodate accounting information, FO96 convert future cash flows in CFD1 to current accounting terms by equating dividends to net income minus the change in book value of equity, the so-called “clean surplus” relation. Under clean surplus, equity values are equivalently stated either in terms of discounted free cash flows or discounted expected future residual income, plus book value of equity—accounting numbers. Importantly, FO96 translate cash flows to net income by subtracting depreciation expense and capitalizing investing. Investing adds to balance sheet property, plant, and equipment,
The depreciation parameter,
By substituting the cash flow dynamics, CFD1, and the above accounting identities for discounted expected future residual income in the valuation formula, FO96 are able to express the market value of equity in terms of current accounting numbers. This enables them to express firm value as a linear weighted sum of net income (nit), dividends (dt), book value of net assets (bvt), lagged net property, plant and equipment (pet–1), capital expenditures (cit), and demand information (νct):

with valuation weights on net income (nit) and lagged net property, plant, and equipment (pet–1):

Inspection of these weights reveals that
We alter the variables in Equation 1 to facilitate our econometric models. First, empirically, we estimate a model with actual depreciation expense as an explanatory variable; theoretically, we can do this by replacing

In Equation 1a, coefficients have changed from the letter

The valuation weight on

Hence, in the empirical version of Equation 1a, we test for depreciation bias by comparing
There are a few special cases that provide pertinent insights to depreciation valuation. First, suppose there is no expected degradation in cash flows over time, meaning,
The model also contains investing cash outflows,
These two variables,
FO96 with time variation in valuation weights
As noted in the “Introduction” section, past research contains estimated depreciation valuation weights that vary with sampling periods. Equation 1a does not allow depreciation bias to vary over time; for instance, real estate shocks are incorporated into valuation through a simple multiplier

Here,
Allowing for changes in the persistence of cash flows with respect to cycle leads to time-varying weights in Equation 1a. For example, the valuation weight on FFO is subscripted by time t (i.e.,

Equation 2 differs from Equation 1a in its inclusion of interactions for variables such as ffo, and depr with cycle. Key coefficients are repeated here from Online Appendix C for convenience:
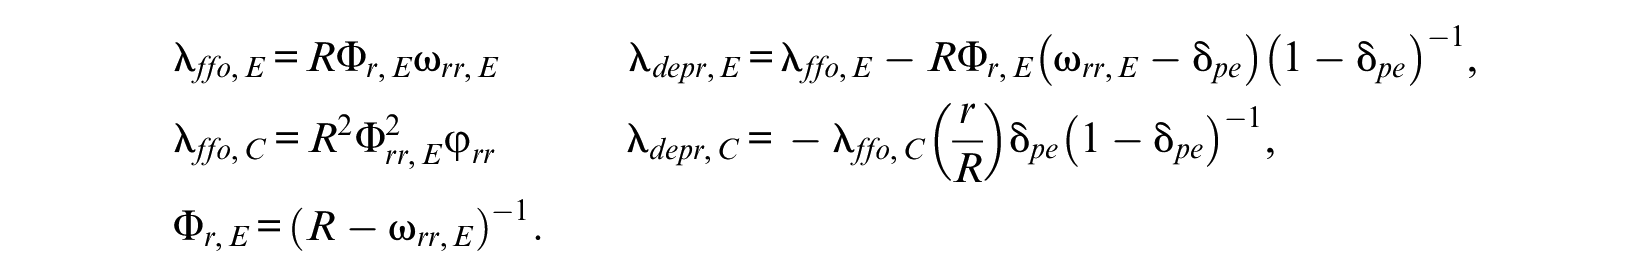
In Equation 2, the subscript E indicates a long-term equilibrium valuation weight, and
The valuation weight on ffo contains an interaction term,
What if depreciation can respond to changes in revenues? H3 and H4
In contrast to REITs, some capital-intensive industries have depreciation patterns and policies that are better able to capture the need to reinvest and which may respond to cycle. For example, if usage drives real degradation in an asset, then usage-based depreciation methods would lead to lower, base-level depreciation biases (i.e., the absolute difference between the coefficient on ffo and on depr would be small). If the accounting policy variable,
Tests of these hypotheses are based on whether our estimate of
Research Design Choices, Sample, and Descriptive Statistics
Adaption of the Models for Empirical Application and Variable Measurement
We test H1 to H4 by analyzing empirical versions of the models in Equations 1, 1a, and 2. Intercepts and error terms are added, and we scale all variables by the number of shares outstanding at the end of a fiscal year. These modifications control for uncorrelated omitted variables and heteroscedasticity, and facilitate comparisons to prior studies.
The variables used in the empirical models are gathered from Compustat, Institutional Brokers’ Estimate System (I/B/E/S), and, if necessary, from REIT 10-K statements. To facilitate comparisons of our valuation results to prior REIT studies, we gather reported FFO from I/B/E/S actuals, labeled FFO. This measure is used in Table 3, where we replicate the results of Fields et al. 16 In the tables that follow Table 3, we use FFOCOMP, an estimate of FFO constructed as Compustat net income adding back depreciation, extraordinary items, and discontinued operations. We use a constructed FFO measure to compare valuation weights for REITs versus non-REITs because non-REITs do not, routinely, report FFO.
Equation 2 is estimated using the following empirical representation (Equation 3):
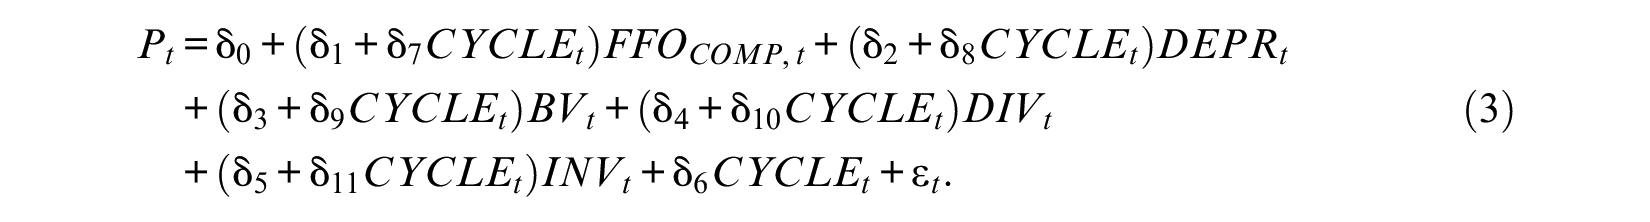
Estimation of Equation 3 requires a proxy for
The proxy for the real estate phase for fiscal year t (CYCLEt) is a weighted sum of filtered measures of three real estate market variables, capturing common real estate cycle information (Online Appendix D). These real estate market variables include the total return index for real estate, the supply–demand gap for commercial real property, and the housing starts index. Using a filtering technique from Hodrick and Prescott (1997), we take the 12-month moving average of the cyclical components of the time series of these three variables. Finally, a composite index is formed using principal components (Panel A of Figure 1).
Sample Selection and Descriptive Statistics
Table 1 describes the primary sample formation which spans the period 1995–2008. This sample allows for a direct comparison of the two main sample periods (pre- and post-2000) studied in prior research on REITs. 17 Accounting data from COMPUSTAT are merged to stock price data from the Center for Research in Security Prices (CRSP) and to FFO data from the I/B/E/S summary file for our sample of REITs (Standard Industrial Classification [SIC] code = 6798–6799). We exclude mortgage REITs and hybrid REITs due to immaterial depreciation expense (Vincent, 1999). Observations with missing regression variables, zero-depreciation expense, and/or firm-years with regression variables ± 3 standard deviations from the mean are deleted. The final sample is 1,064 firm-years for 157 REITs.
Sample Selection Process.
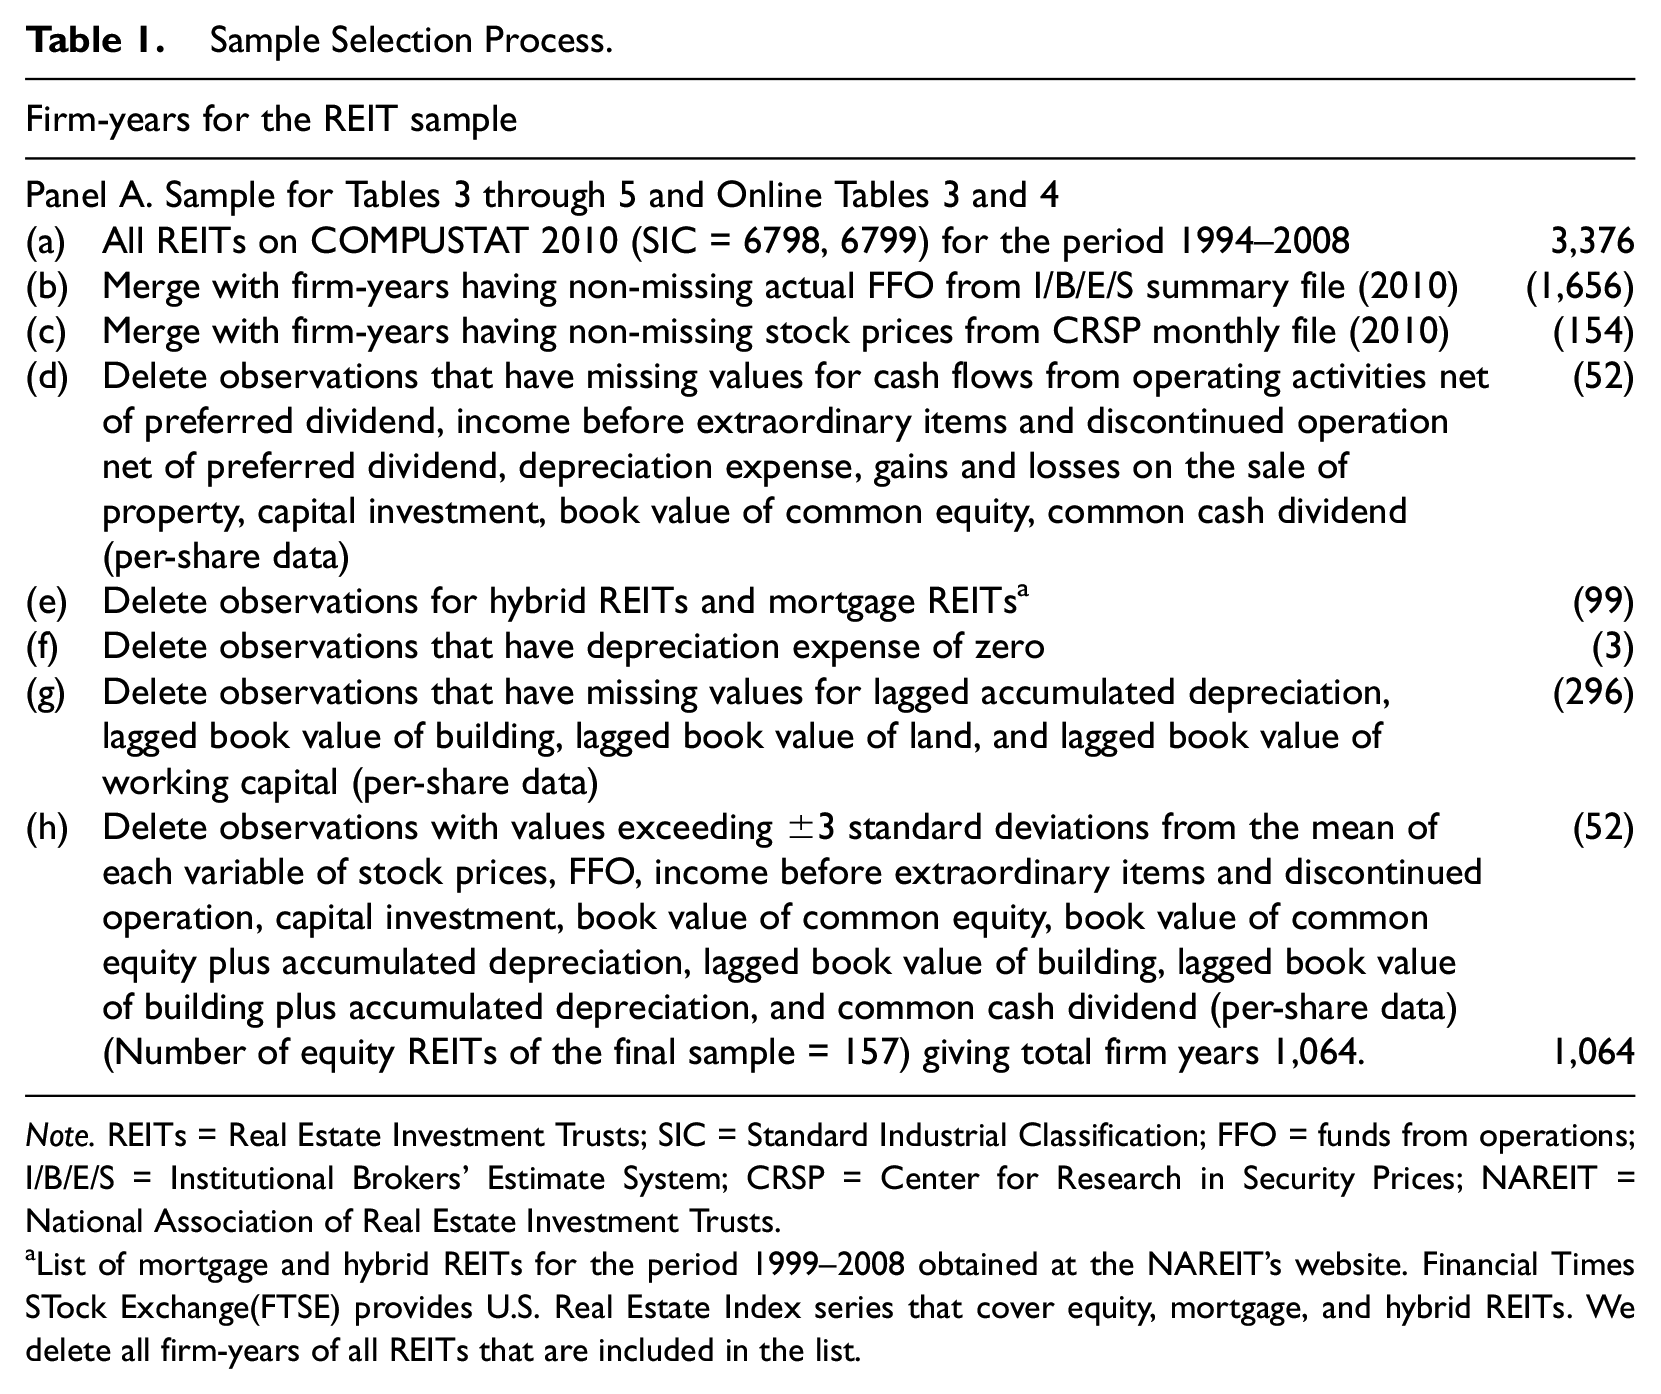
Note. REITs = Real Estate Investment Trusts; SIC = Standard Industrial Classification; FFO = funds from operations; I/B/E/S = Institutional Brokers’ Estimate System; CRSP = Center for Research in Security Prices; NAREIT = National Association of Real Estate Investment Trusts.
List of mortgage and hybrid REITs for the period 1999–2008 obtained at the NAREIT’s website. Financial Times STock Exchange(FTSE) provides U.S. Real Estate Index series that cover equity, mortgage, and hybrid REITs. We delete all firm-years of all REITs that are included in the list.
Summary statistics for the samples used to estimate the valuation models are in Table 2, Panel A. The mean price per share for REITs is $27.22, a little less than double the book value of equity per share, of $14.88. Mean FFO per share from I/B/E/S is $2.27, while mean FFO constructed from COMPUSTAT is $2.43. Average common dividends per share, $1.63, falls between FFO and net income per share of $0.94. Similarity in the distribution of FFO and CFO suggests that changes in working capital, estimated as the difference between FFOCOMP and CFO, are relatively minor. In some tests, we try to isolate the depreciable component of real property by separately including land assets in our regression. The developed (depreciable) component of real property (BUILD) averages $31.19 per share versus $7.22 for land (LAND).
Summary Statistics of a Trimmed Sample.
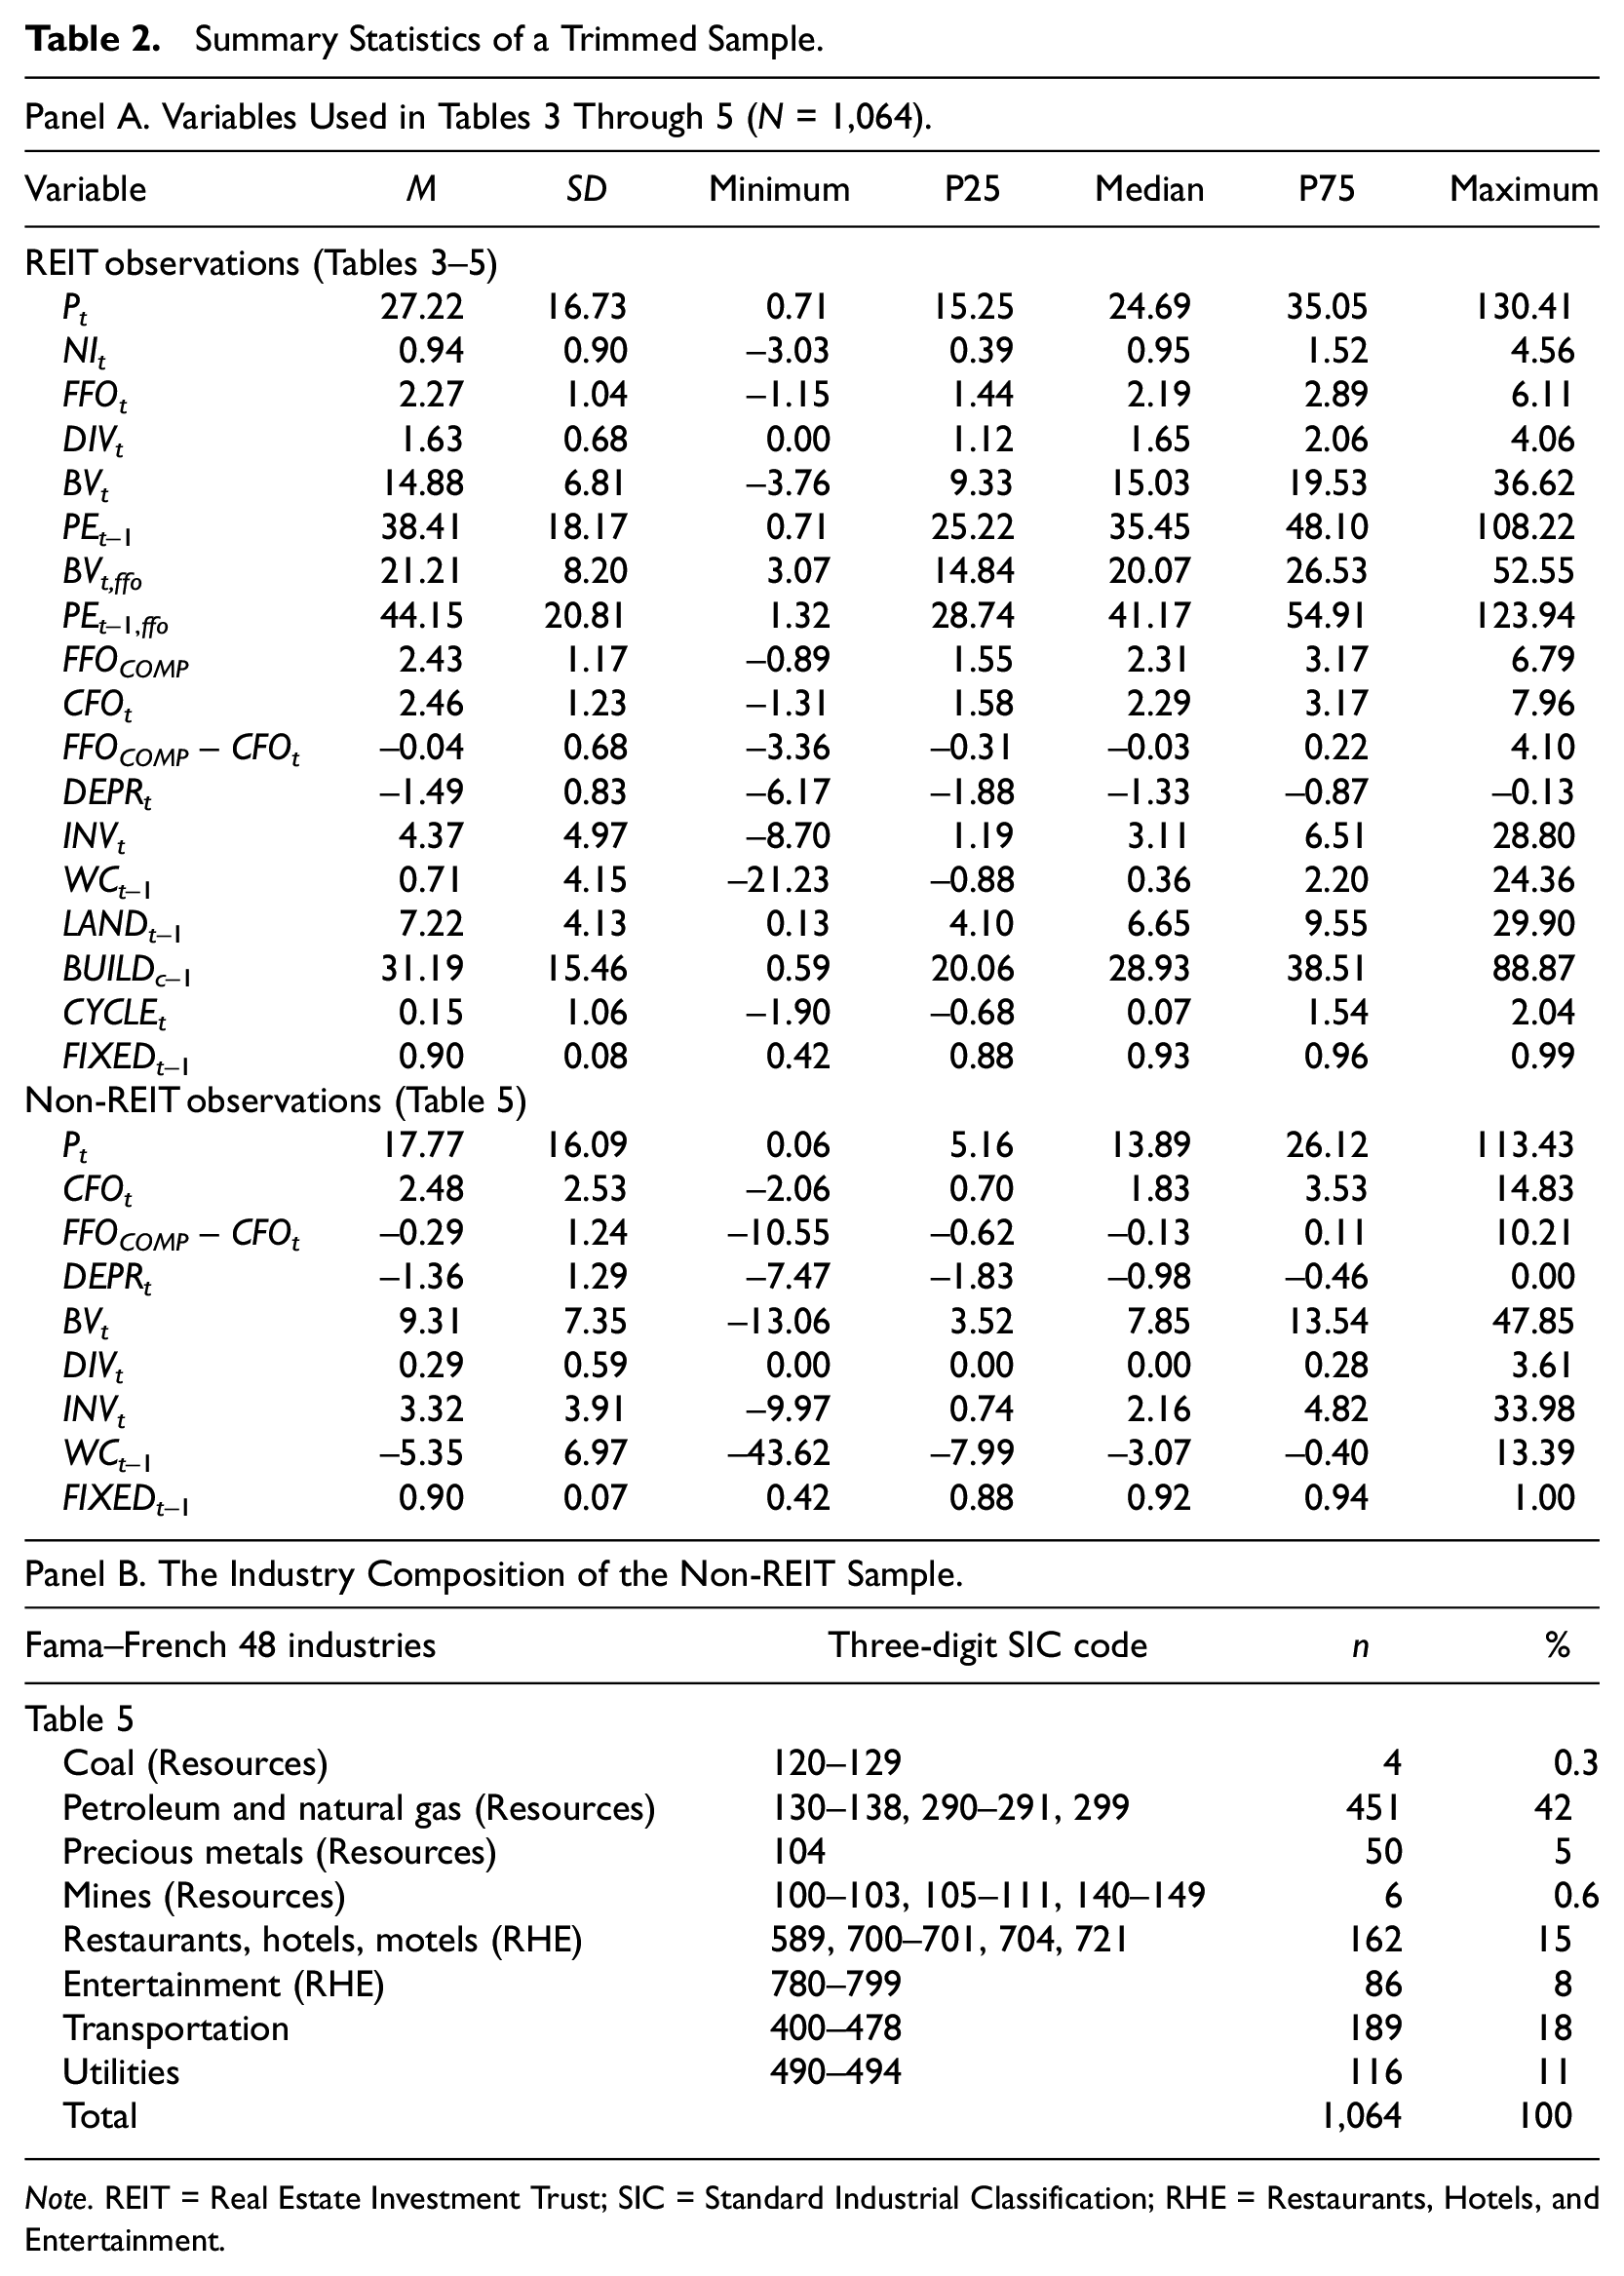
Note. REIT = Real Estate Investment Trust; SIC = Standard Industrial Classification; RHE = Restaurants, Hotels, and Entertainment.
Panel B of Table 1 contains a description of capital-intensive, non-REIT firms, selected following the approach in Kang and Zhao (2010). Kang and Zhao first identify a sample of firms in industries with median net fixed assets to total assets (FIXED) in excess of 50%. Like Kang and Zhao (2010), we match each REIT (with replacement) to the non-REIT firm most similar in terms of FIXED. 18 The resulting non-REIT sample has a distribution of FIXED that is virtually identical to REITs. With respect to other characteristics, there are some differences. Non-REITs are similar in mean operating cash flow per share, but medians deviate (median 1.83 non-REITs vs. 2.29 for REITs). Also, non-REITs have lower book values of equity per share (median 7.85 vs. 15.03). Furthermore, their average dividend per share is only $0.29 compared with $1.63 for REITs, and their average price per share is only 65% of that of the average REIT ($17.77 vs. $27.22 per share for REITs).
Panel B of Table 2 reports the composition of industries in the non-REIT sample. As shown, the non-REITs are concentrated in Resources, restaurants, hotels, transportation firms, and utilities. The fact that these industries employ depreciation methods that differ substantially from the straight-line method used by REITs, a prominent example being the use of depletion for Resource firms, is the impetus for our analysis of three different capital-intensive sectors.
Correlation coefficients for our model variables are reported in Online Table 1, Panel A. The table includes several valuation drivers. Among these, REIT stock prices are more strongly correlated with FFO (ρ = .67) than with dividends (ρ = .59), CFO (ρ = .56), or net income (ρ = .46), and dividends are more strongly correlated with FFO (ρ = .77) than with net income (ρ = .51). There is a negative simple correlation between stock price and depreciation expense (ρ = –.37). As depreciation expense is signed as negative, REITs with more depreciation expense have higher stock prices. Equation 1a replaces lagged net property, plant and equipment (PE t-1) with depreciation expense and the correlation between these two is –.82, suggesting the substitution is justified.
Empirical Results
Replications Using a Model With Non-Time-Varying Coefficients
To demonstrate the comparability of our sample and regression analysis to prior studies, in Table 3 we estimate the REIT FO96 valuation regressions (Equation 1 with the cycle variable suppressed) using two alternative income measures. In Panel A, we use net income, and in Panel B, we replace net income with reported FFO (collected from I/B/E/S). 19 We report regressions based on our full sample (1995–2008) in Column (a) and two subsample periods which roughly align with prior research, 1995–1999 (e.g., Fields et al., 1998; Vincent, 1999), in Column (b) and 2000–2008 (e.g., Baik et al., 2008; Kang & Zhao, 2010) in Column (c). Similar to Vincent (1999) and Fields et al. (1998), we examine the fit of the two FO96 models using a Vuong (1989) test. Our regression differs slightly from prior studies due to our inclusion of bias terms (PEt–1 and INVt) from FO96 and our use of pre-depreciation measures for the FFO specification.
Estimation of the Feltham and Ohlson (1996) Model.
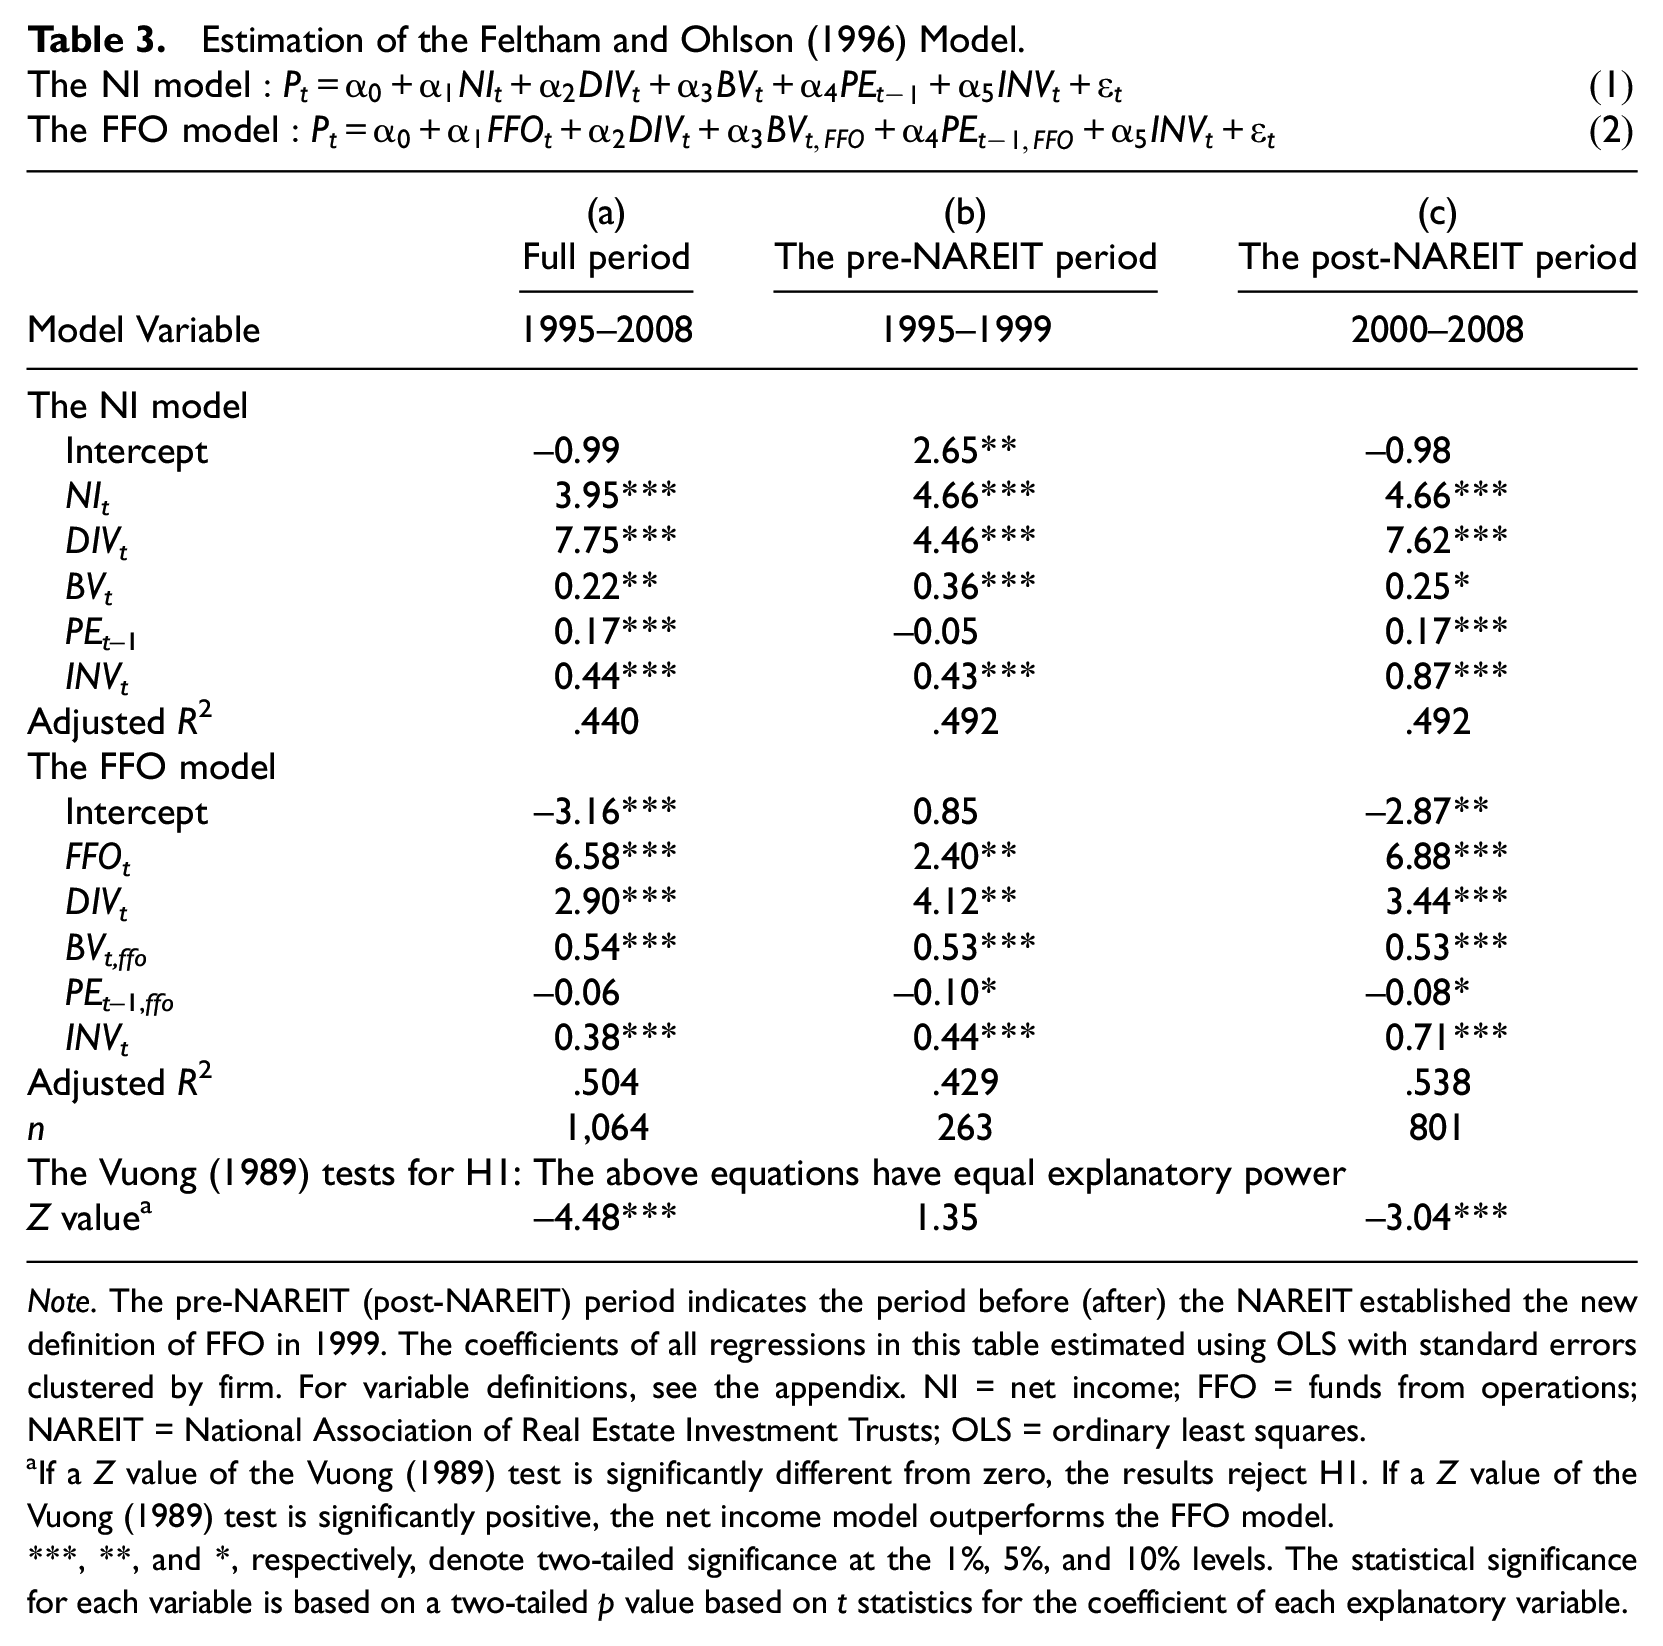
Note. The pre-NAREIT (post-NAREIT) period indicates the period before (after) the NAREIT established the new definition of FFO in 1999. The coefficients of all regressions in this table estimated using OLS with standard errors clustered by firm. For variable definitions, see the appendix. NI = net income; FFO = funds from operations; NAREIT = National Association of Real Estate Investment Trusts; OLS = ordinary least squares.
If a Z value of the Vuong (1989) test is significantly different from zero, the results reject H1. If a Z value of the Vuong (1989) test is significantly positive, the net income model outperforms the FFO model.
, **, and *, respectively, denote two-tailed significance at the 1%, 5%, and 10% levels. The statistical significance for each variable is based on a two-tailed p value based on t statistics for the coefficient of each explanatory variable.
Based on the Vuong z statistic in the bottom row of Table 3, we reject equivalency of the net income and FFO models for the full sample and for the post-2000 period but not for the pre-2000 period. The valuation weight for PEt–1 in the pre-2000 net income model (Panel A) is statistically insignificant, consistent with no bias in depreciation expense (Equation 1). However, in the post-2000 period, this coefficient is reliably positive, suggesting that depreciation expense is conservatively biased after 2000. 20 The stark differences in the valuation weights across the two sub-periods are consistent with prior studies (e.g., the contrast between Fields et al. with Kang and Zhao) and suggest that the bias in depreciation expense changed across the two sub-periods. Subsequent tables test whether such changes are related to CYCLE.
Table 3 also comments on the role of investing; the positive valuation weight on investing cash flows in all regressions suggests this activity is value-creating, on average, for REITs. Finally, the coefficient on dividends is reliably positive, but the FO96 model predicts a small negative coefficient.21,22 The FO96 model offers a rationale for our specification, but it is unrealistic to think all model restrictions will hold. In fact, non-stationarity of valuation weights, proposed under H1 and H2, could drive model violations.
Testing H1 and H2: Is Depreciation Bias Countercyclical?
Table 4 presents our main tests of H1 and H2, exploring whether valuation coefficients in REITs are cyclical. Recall these two hypotheses use Equation 1a, which breaks net income into FFO and depreciation expense. To facilitate subsequent model comparisons between REITs and non-REITs, Table 4 relies on the constructed FFO measure, FFOCOMP, rather than I/B/E/S FFO, but results are very similar if we use I/B/E/S FFO for REITs.
Estimation of the Modified Feltham and Ohlson (1996) Model for REITs (Variations in the Base-Case Model).
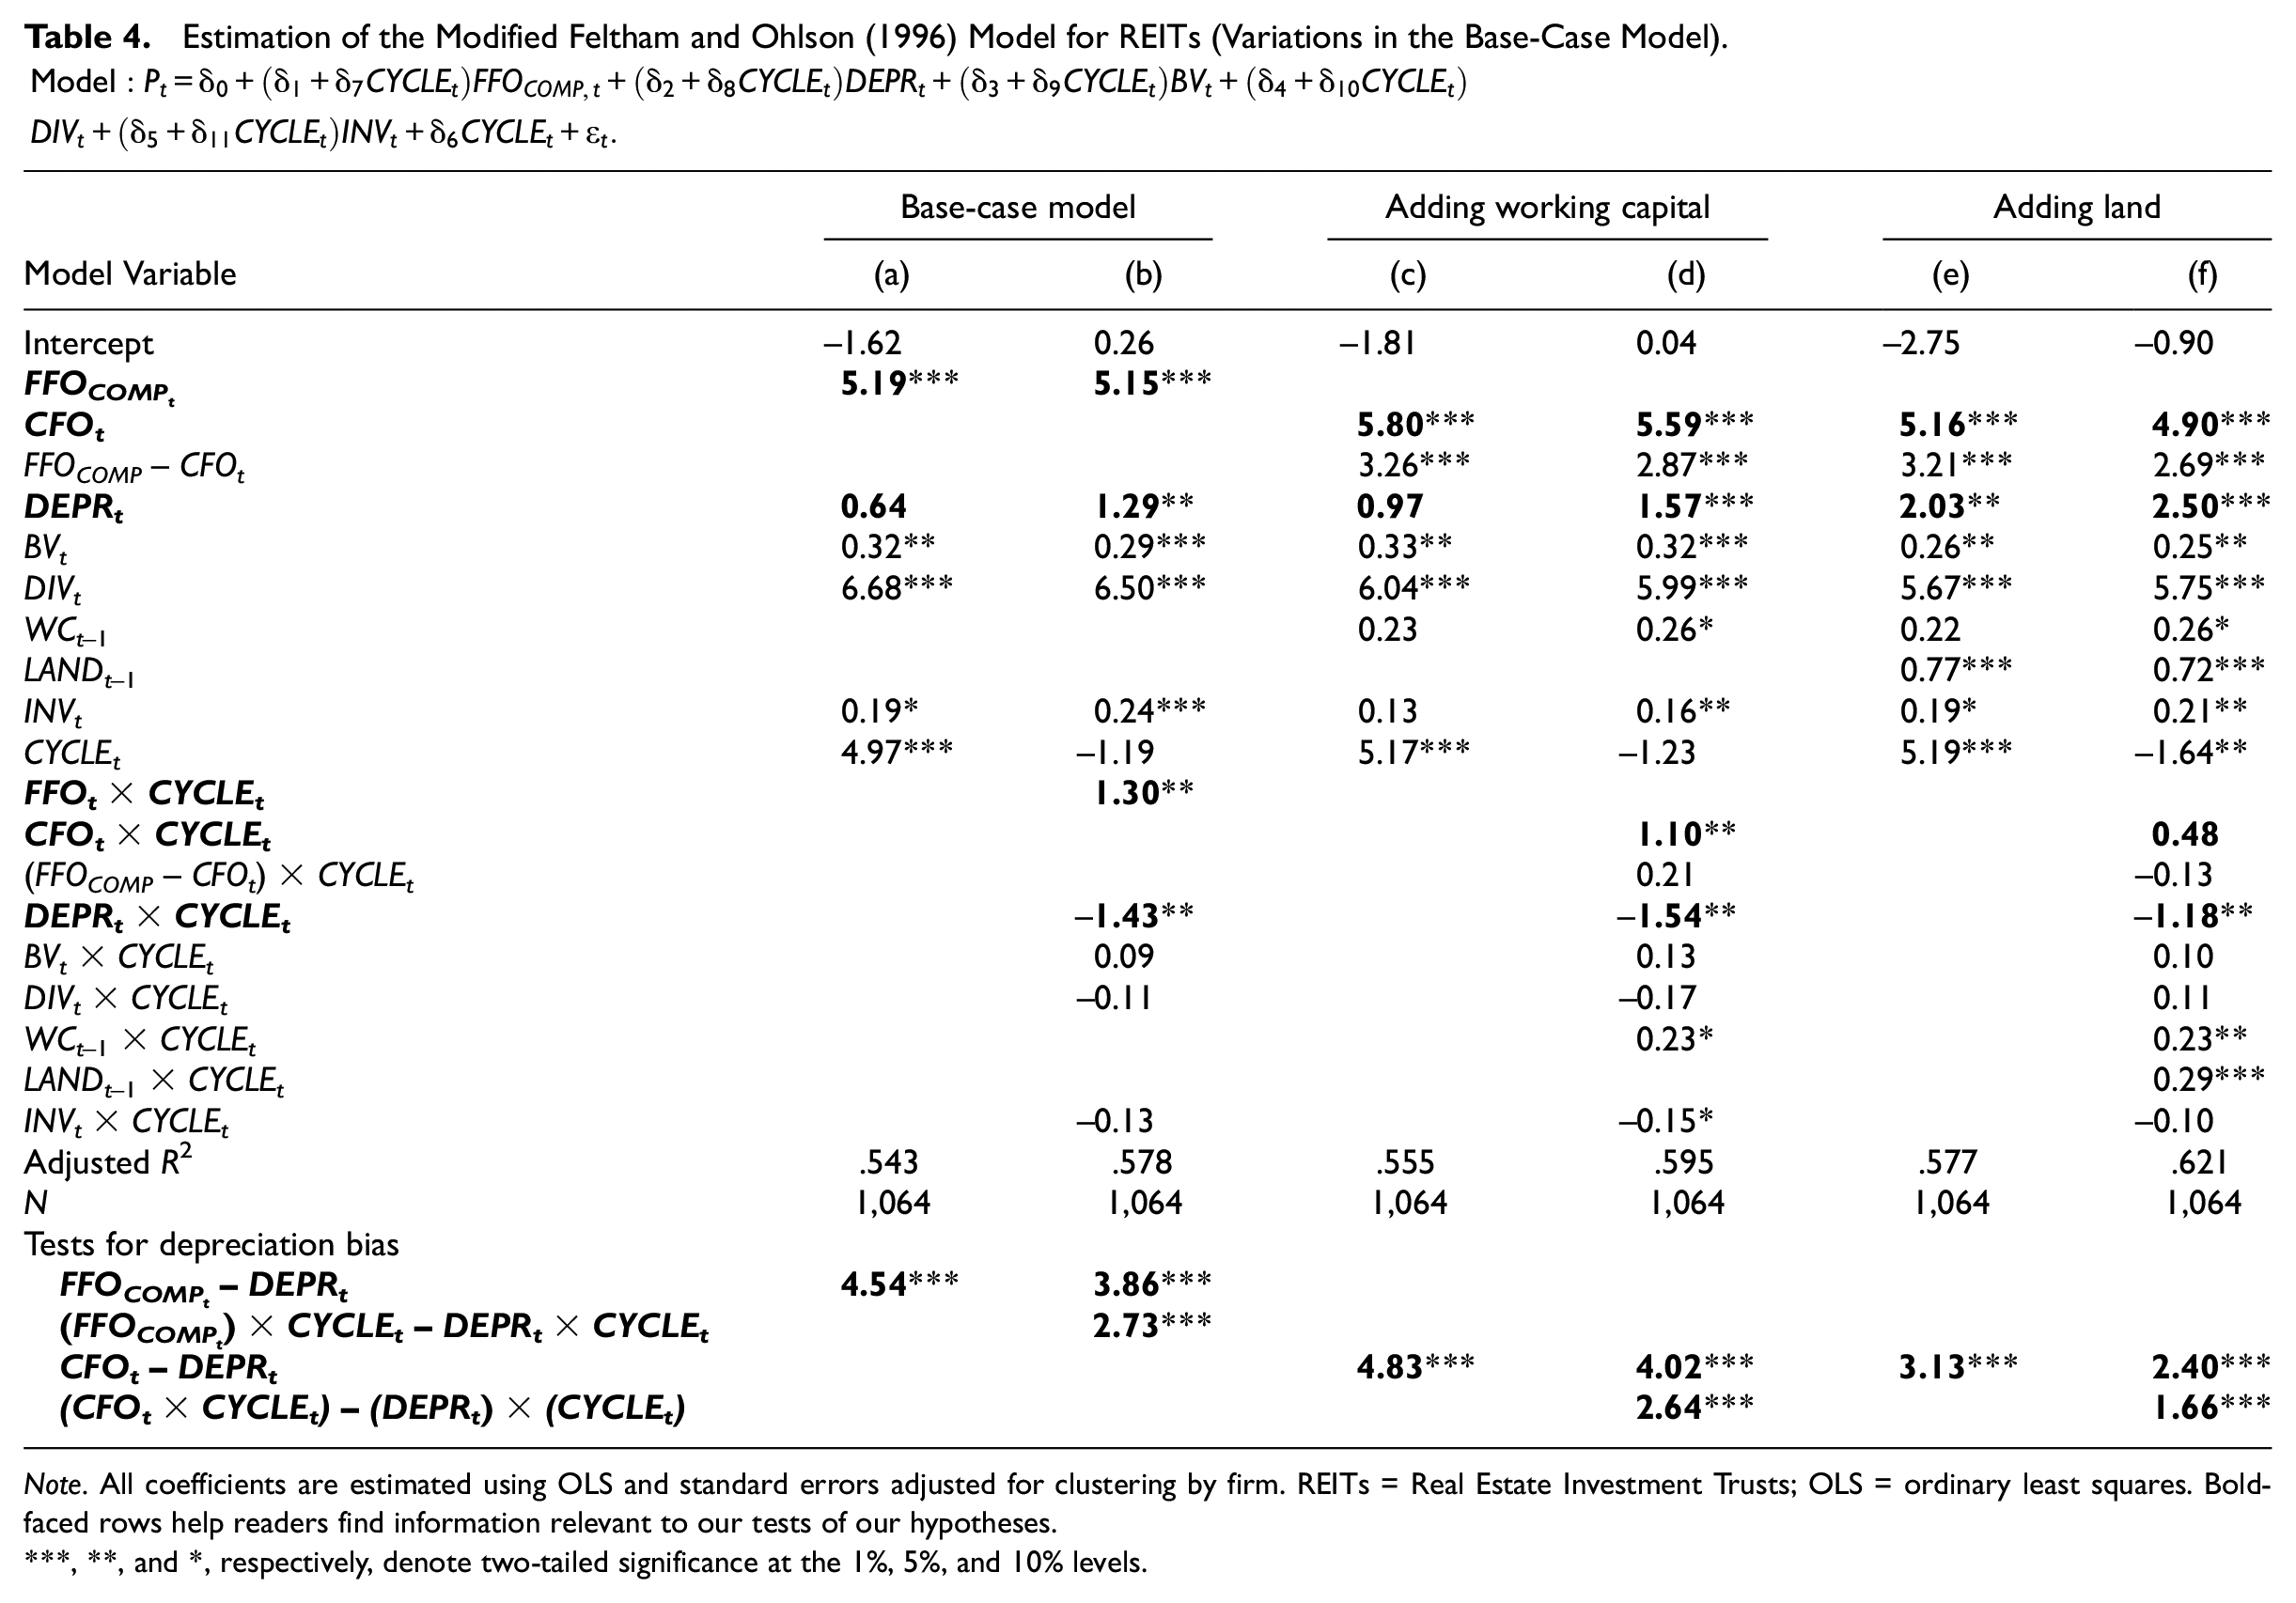
Note. All coefficients are estimated using OLS and standard errors adjusted for clustering by firm. REITs = Real Estate Investment Trusts; OLS = ordinary least squares. Bold-faced rows help readers find information relevant to our tests of our hypotheses.
, **, and *, respectively, denote two-tailed significance at the 1%, 5%, and 10% levels.
Columns (a) and (b) show the empirical results for Equation 1a, including CYCLE as a separate regression variable, and Equation 3, where CYCLE is interacted with each term. In Column (a), the estimated coefficient on CYCLE is positive and statistically significant (4.97). At the mean of CYCLE reported in Table 2 (0.15), this coefficient translates to $0.75 per share. A one standard deviation shift in CYCLE of 1.05 increases the share price by $5.22 or about 19% of REITs’ average price. The estimated weight on FFO is 5.19 (1% significance) and the estimated valuation weight for DEPR is 0.64 (not significant). While the insignificant coefficient on DEPR in Column (a) is consistent with a valuation approach that focuses on an (FFO) multiple since FFO does not include depreciation expense. However, this conclusion does not hold once we allow time variation is the weight on DEPR in Column (b).
Specifically, when interactive terms are included in Column (b), the coefficients on FFOCOMP and DEPR are both positive and statistically significant with point estimates of 5.15 and 1.29. The positive weight on DEPR suggests a role for a small depreciation expense deduction in the presence of FFOCOMP, but the significant Z value reported at the bottom of the table (3.86) indicates the two coefficients are not equal. This confirms that depreciation is biased and it cannot be simply combined with FFO for valuation purposes. In terms of the underlying parameters from Equation 1a, the result suggests that the persistence of cash flows,
Consistent with H1, the weighting on FFOCOMP interacted with CYCLE is reliably positive, 1.30 (Column (b), Table 4). This suggests increasing persistence in cash flows during booms and decreasing persistence during busts (H1).
23
Furthermore, the time-varying coefficient on depreciation expense is reliably negative (–1.43), supporting H2. At the average depreciation expense (–$1.49 per share), a one standard deviation movement in CYCLE (1.06) results in a $2.26 per-share add-back to the baseline average depreciation effect of –$1.92, computed above. Hence, at times, the bias in depreciation expense is so great, that the valuation weight translates a negative number (depreciation expense) to a positive in terms of firm value. Recall from the “Valuation of REITs Using Accounting Information” section, this occurs if the persistence of cash flows indicates growth
Additional insights and sensitivity analyses
Columns (c) to (f) of Table 4 provide additional insight to these basic results. Columns (c) and (d) separate FFO into cash flows (CFO) and a proxy for changes in working capital (FFOCOMP– CFO). 24 In the full interactive model, Column (d), the proxy for the change in working capital accruals has a multiplier of $2.87, which is less than the coefficient on CFO of $5.59. 25 There is no evidence of cyclicality in the valuation weight on changes in working capital accruals, and the other inferences for H1 and H2 are unchanged.
Columns (e) and (f) separate land assets from depreciable real property. (Land values are hand collected from 10-K statements for REITs only.) By allowing for a separate coefficient on land,
Finally, as in Table 3, the estimated weight on investment (INV) is positive and statistically significant in most estimations, Column (c) is the exception, re-affirming our interpretation that investing is positive net present value for REITs. The estimated coefficient on the interaction of INV with CYCLE is negative (e.g., –0.13 in Column (b)), but differs from zero at the 10% level, in just one of the three model specifications. Hence, the marginal return to investing cash flows does not appear to be altered with real estate demand shocks. As in Table 3, dividends exhibit large positive coefficients, and this is unaffected by the real estate cycle. 27
Testing H3 and H4: Depreciation Bias for Non-REIT Firms
Our application of the FO96 framework assumes that the major accrual for REITs is depreciation expense, and that real property is the major asset generating a REIT’s value (i.e., CFD1). Under the FO96 assumptions, we expect non-REIT firms with similarly sized large investments in real property to display similar depreciation bias. Yet, Kang and Zhao document lower depreciation bias for capital-intensive non-REITs, relative to REITs. In this section, we explore the reasons for these results using the FO96 lens.
We begin estimating our model for non-REIT firms, as is done in Kang and Zhao (2010). In Table 5, Panel A, we use the model from Table 4, Columns (c) and (d), where net income is decomposed into cash flow from operations, an estimate of change in working capital accruals, and depreciation expense. 28 The non-REIT sample in Column (d) exhibits a valuation weight on CFO of 3.87 versus REITs’CFO valuation weight of 5.59 in Column (b), suggesting that the persistence of cash flows is lower for the non-REIT sample on average. For the non-REIT sample, the weight on depreciation expense is 2.85 (1% significance) versus 1.57 (5% significance) for REIT firms. These results suggest depreciation expense is conservatively biased for both REITs and non-REITs, but the difference in the weight on CFO versus depreciation is greater for REITs (4.02 vs. 1.02—second to last row, Columns (b), (d)). We conclude, based on these valuation weights, that non-REIT firms exhibit less depreciation bias. 29 There is no evidence of cyclicality in valuation parameters for the non-REIT firms. 30
Estimation of the Modified Feltham and Ohlson (1996) Model for REITs Versus Non-REIT Firms.
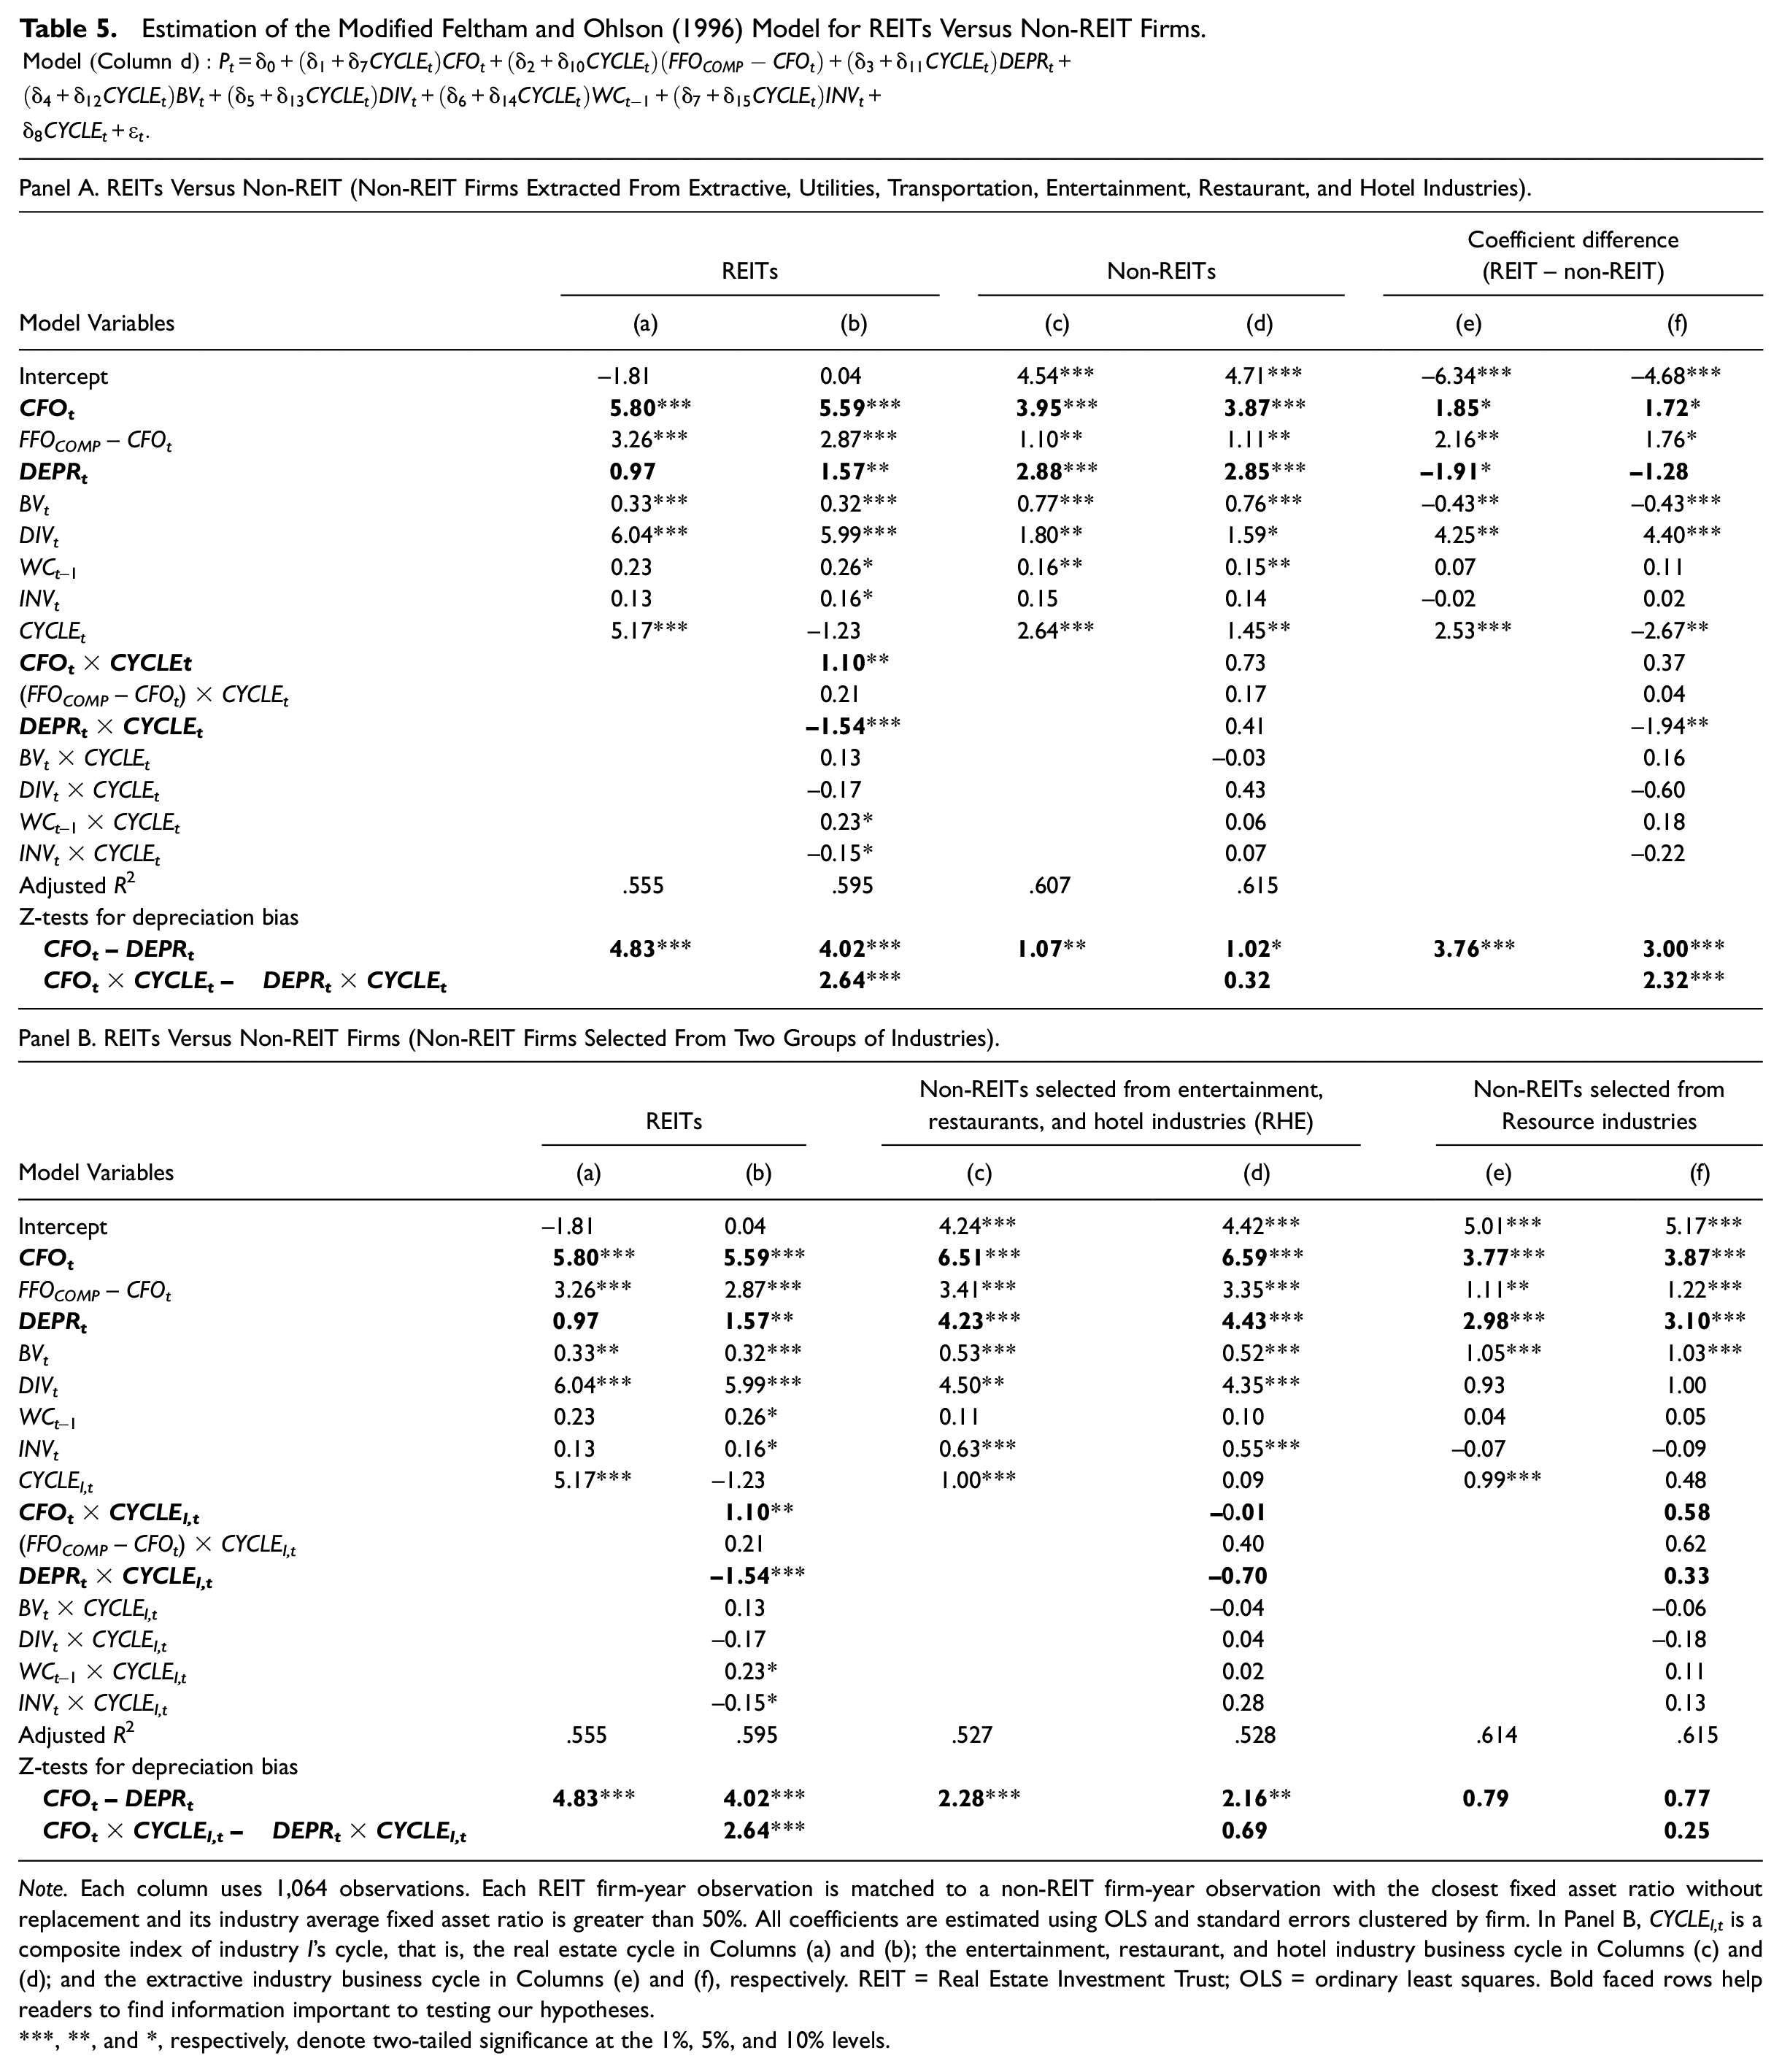
Note. Each column uses 1,064 observations. Each REIT firm-year observation is matched to a non-REIT firm-year observation with the closest fixed asset ratio without replacement and its industry average fixed asset ratio is greater than 50%. All coefficients are estimated using OLS and standard errors clustered by firm. In Panel B, CYCLEI,t is a composite index of industry I’s cycle, that is, the real estate cycle in Columns (a) and (b); the entertainment, restaurant, and hotel industry business cycle in Columns (c) and (d); and the extractive industry business cycle in Columns (e) and (f), respectively. REIT = Real Estate Investment Trust; OLS = ordinary least squares.
, **, and *, respectively, denote two-tailed significance at the 1%, 5%, and 10% levels.
Kang and Zhao (2010) conjecture that valuation weights on depreciation differ for REITs and non-REITs, because REIT properties are liquid financial assets, whereas in non-REITs the properties are “operating” assets (p. 228).
31
However, we think valuation weights might differ for REIT versus non-REITs depending on their respective depreciation policies,
Recall that the sectors included in the non-REIT sample offer reasons to expect that depreciation expense will be less biased in the non-REIT sample. In Table 2, Panel B, Resources (which include oil, gas, and mining firms) comprise 48% of the non-REIT sample. For this subsample, “depreciation” includes depletion of properties like mines. Depletion naturally causes the “depreciation policy” to track the service revenues, as assets are pulled from wells or mines and sold. A small percentage (11%) of the non-REIT sample is regulated utilities. Interestingly, pricing policies for utilities are often set by regulators to “recover” all allocated expenses, including depreciation. This pricing practice could cause
Hypotheses 3 and 4 are stated to formally examine this intuition. Table 5, Panel B, isolates some of the non-REIT firms into two industry subsamples: RHE and Resources. To ensure the CYCLE variable is pertinent to the sectors, for this portion of the analysis, we construct new industry-specific business cycle measures. 32
As shown in Panel B, Column (f), depreciation in the Resource setting yields a valuation weight of 3.10, which is not distinguishably different from the coefficient on cash flows, 3.87—The test statistic is in the second to last row of Column (f). This supports H3, which predicts lower bias in the Resource sector; in fact, our results suggest a zero-depreciation bias for the Resource industry subsample on average. With regard to H4 (that the valuation weight on depreciation for Resources is less countercyclical), we find there is no evidence of cyclicality in the valuation of cash flows or depreciation expense for these firms; we therefore view the evidence on H4 to be inconclusive. However, our results do suggest that for Resources, valuation multiples based on net income are a good starting point for estimating intrinsic value.
The apparent unbiasedness of depreciation (discussed in the prior paragraph), for Resources can also be compared with the RHE subsample, which exhibits similar capital intensity to the other sectors but is more similar to REITs in their depreciation practices and operations. RHE firms exhibit a valuation weight on cash flows (depreciation) of 6.59 (4.43). The difference in these valuation weights, 2.16, is significant, implying it is not appropriate to combine these two components and apply a single weight to net income. Rather, this adjustment for depreciation bias implies that only about two thirds of depreciation expense reported in this industry are reflected in market values (0.67 = 4.43/6.59). Table 5, Panel B, supports our conjecture that the valuation coefficients on depreciation for REITs versus capital-intensive non-REITs in Panel A are partially due to the failure of (ability of) straight-line depreciation (depletion accounting) to reflect expected asset degradation.
Robustness Analysis
In Online Tables 3, 4, and 5, we test whether our time-varying coefficient results are explained by the 2000 change in the NAREIT definition of FFO, by changes in discount rates or by the recession in 2008. After controlling for the shift in coefficients in 2000, following the new definition of FFO, Online Table 3 provides evidence that the difference in REIT valuation weights on CFO and DEPR continues to imply depreciation bias and the weight on CFO is pro-cyclical, while the weight on DEPR is countercyclical. The same is true in Online Table 4 when we control for changes in 10-year Treasury Bond rates.
Our estimations include data for the period 1995–2008. Given the magnitude of the recession in 2008, we investigate its effect on our results. In un-tabulated results, we find that the inferences drawn from Table 5, Panel B, are robust to deleting 2008. Finally, in Online Table 5, we expand our sample period to cover 1995–2013, including the 2008 recession. For this extended period, with large swings in cycle, the weight on CFO is positive and highly significant, while the weight on depreciation expense is negative, but not significant, implying valuation is based on firm performance before depreciation. While the weight on depreciation expense is even lower when cycle is high (i.e., the weight on depreciation expense is countercyclical), there is no significant change in the weight on CFO related to cycle.
Conclusion
We assess the link between depreciation expense and firm value for different types of capital-intensive businesses over time. This analysis should be of interest both to industry analysts choosing a valuation approach and to academics interested in the drivers of firm value. Our econometric model relies on a residual income valuation model with net income split into pre-depreciation income and depreciation expense (with a negative sign). The valuation weights on each component can vary over time in conjunction with industry shocks.
Our conclusions regarding the role for depreciation in valuation differ markedly across the different capital-intensive sectors. In the Resource sector, we find depreciation expense (including depletion of mining reserves) is significant in explaining valuations, with a valuation weight the same as the weight on pre-depreciation net income. This is consistent with a valuation multiple that is based on bottom-line net income and the relation does not vary with industry business cycles. Intuitively, in the Resource sector, depreciation expense works as a proxy for capital maintenance cash flows required to maintain the cash flow stream. We conjecture this is due to the ability of depreciation expense to adjust to changes in demand in the Resource sector.
In the REIT industry, the major depreciable asset is buildings, which is subject to straight-line depreciation over up to 40 years. This is starkly different from the usage-based depletion of mines and our results reflect this difference. Over our entire sample period, if we do not allow REIT valuation weights to vary with industry cycles, the valuation weight on depreciation is essentially zero, supporting valuation approaches based on pre-depreciation earnings such as EBITDA or FFO. However, once we allow valuations to move cyclically, we find a small but significant valuation weight on depreciation expense that is less than the weight on other components of net income. We also find the weight on the cash flow component of earnings increases with stage of the business cycle, and the weight on depreciation decreases with cycle. Overall, these results support placing some, but not full, weight on depreciation expense, consistent with a mixed valuation approach, where firm value estimates place some weight on pre-depreciation income multiples and some on a bottom-line net income multiples.
While we suggest our results can be extrapolated to help understand the use of alternative industry valuation approaches; based on bottom-line net income, on pre-depreciation earnings, or on a combination of the two, our model includes other valuation variables beyond a single performance measure. We hope future researchers will explore industry differences in the performance of simple valuation models, by considering whether depreciation expense is able to adapt to changes in business conditions that imply a longer or shorter life for capital assets.
Supplemental Material
sj-docx-1-jaf-10.1177_1234567891011122 – Supplemental material for When Is Depreciation Meaningful in Valuation? Changing Valuation Weights for U.S. REITs and Non-REITs
Supplemental material, sj-docx-1-jaf-10.1177_1234567891011122 for When Is Depreciation Meaningful in Valuation? Changing Valuation Weights for U.S. REITs and Non-REITs by Joy Begley, Sandra Chamberlain and Jeong Hwan Joo in Journal of Accounting, Auditing & Finance
Footnotes
Appendix
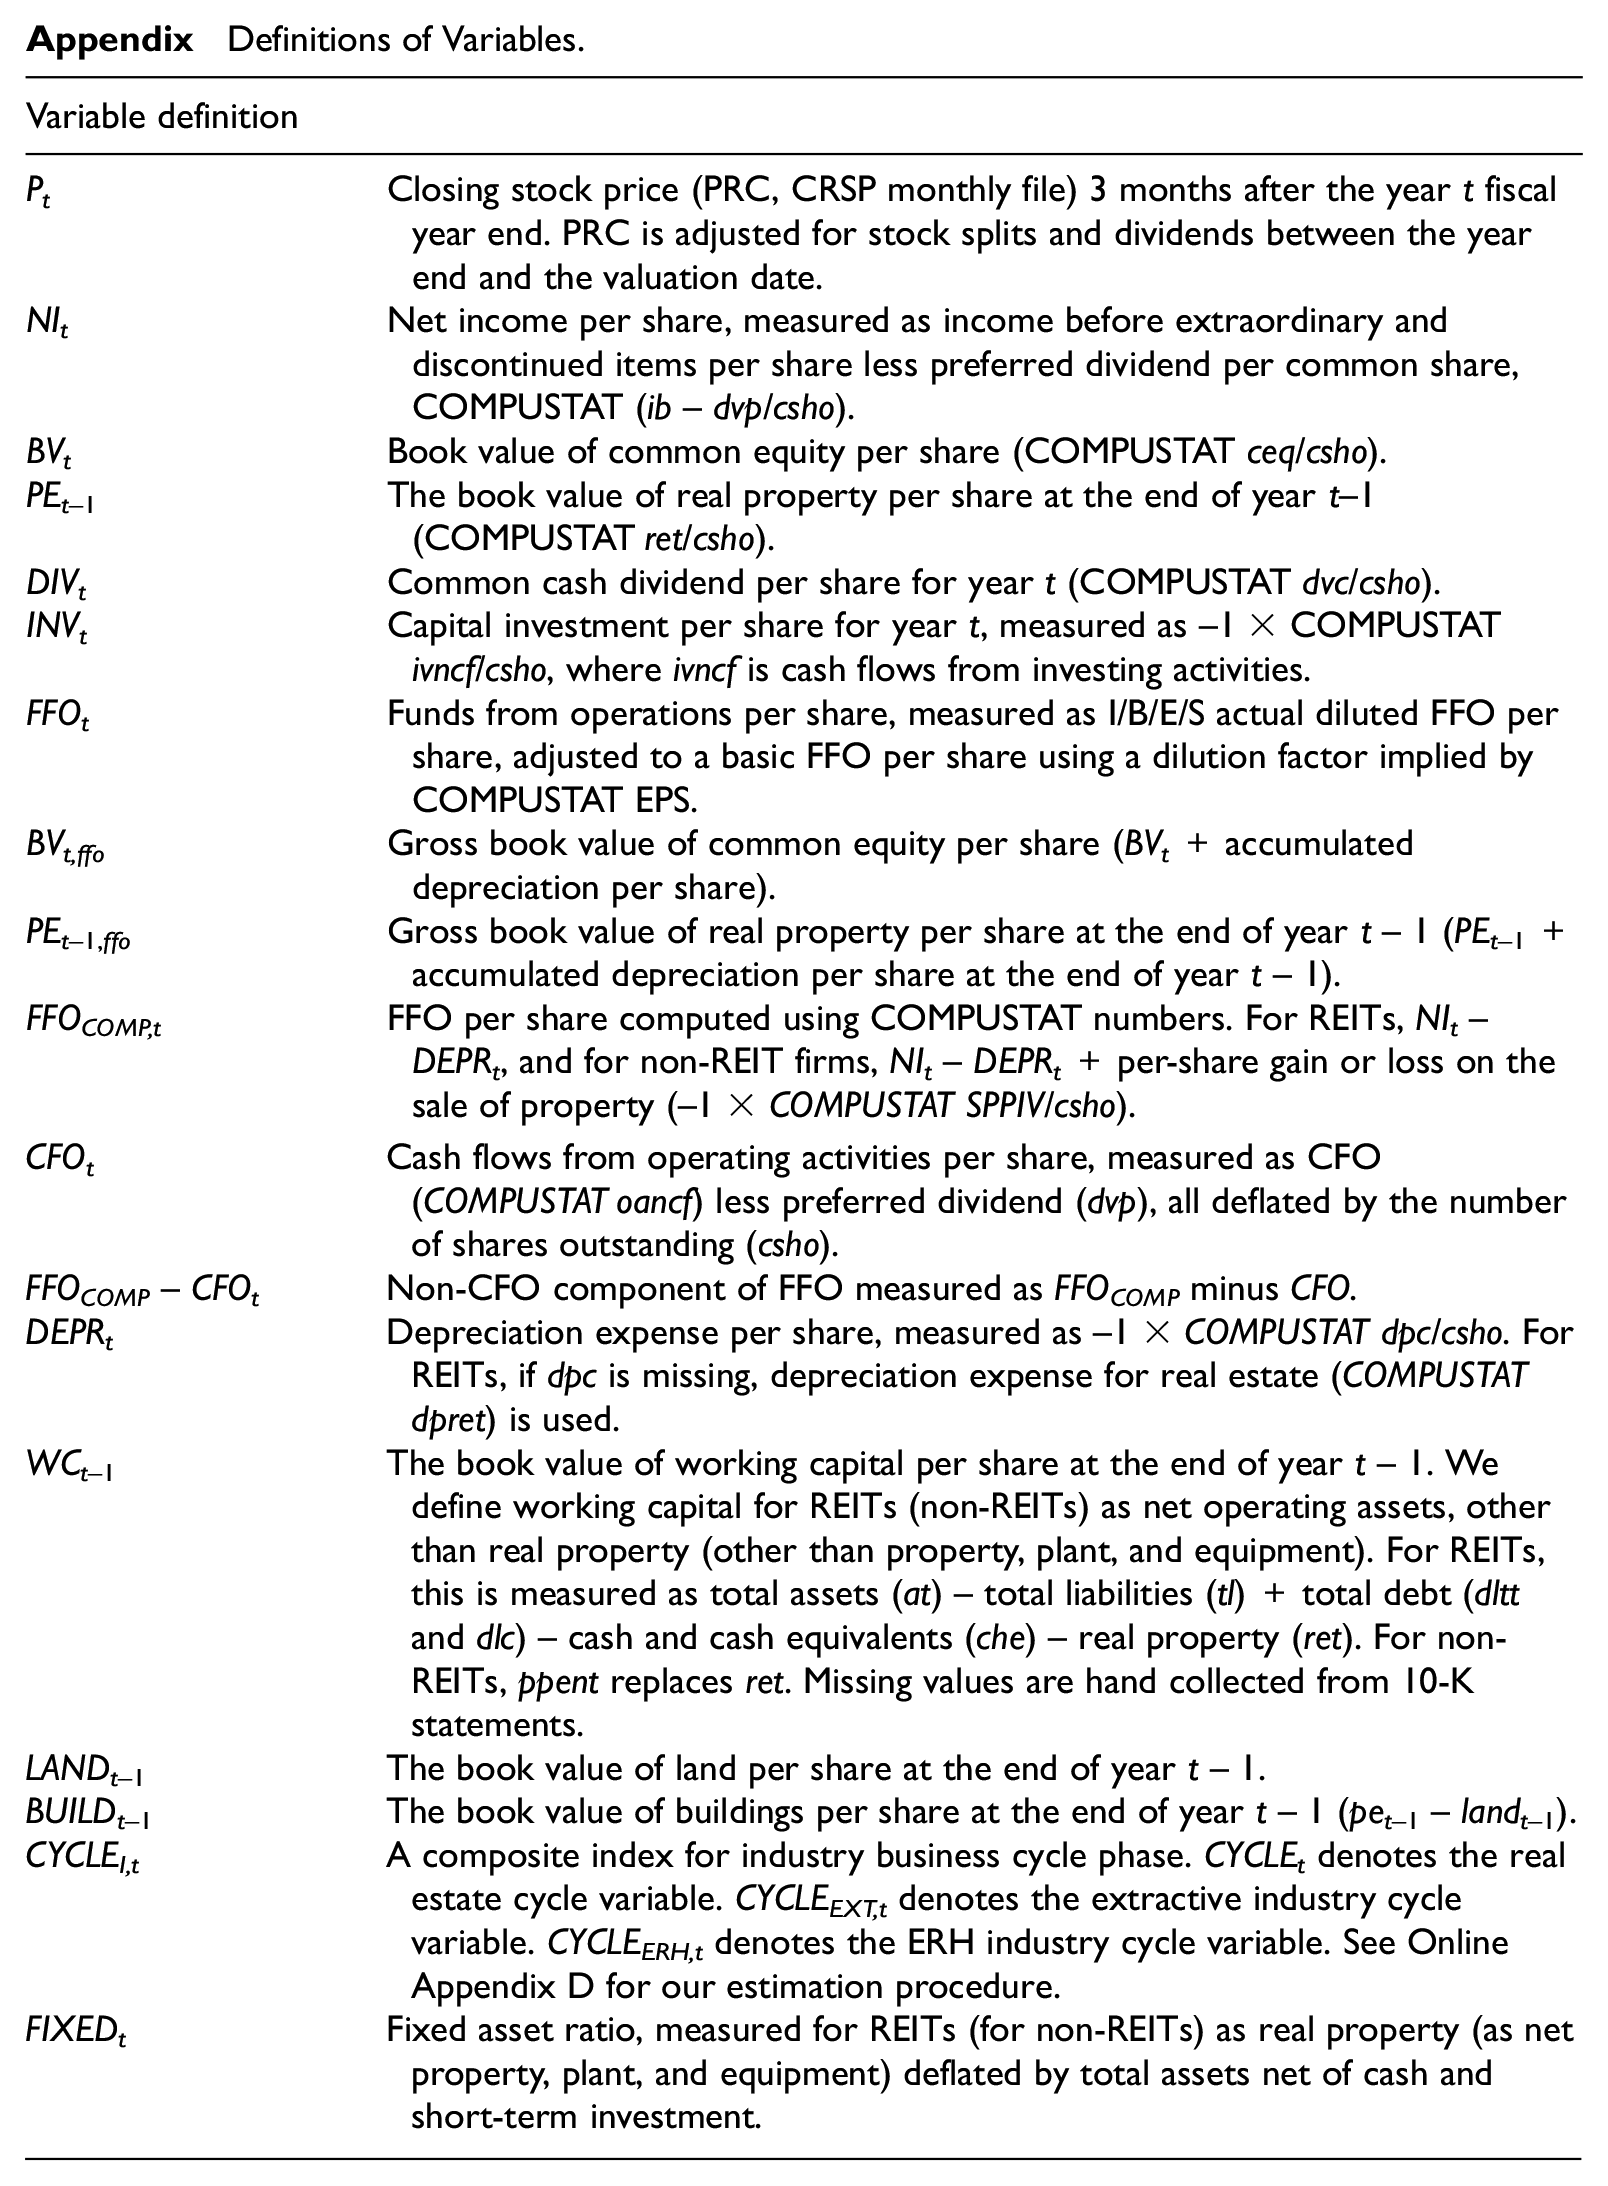
Definitions of Variables.
| Variable definition | |
|---|---|
| Pt | Closing stock price (PRC, CRSP monthly file) 3 months after the year t fiscal year end. PRC is adjusted for stock splits and dividends between the year end and the valuation date. |
| NIt | Net income per share, measured as income before extraordinary and discontinued items per share less preferred dividend per common share, COMPUSTAT (ib – dvp/csho). |
| BVt | Book value of common equity per share (COMPUSTAT ceq/csho). |
| PEt –1 | The book value of real property per share at the end of year t–1 (COMPUSTAT ret/csho). |
| DIVt | Common cash dividend per share for year t (COMPUSTAT dvc/csho). |
| INVt | Capital investment per share for year t, measured as –1 × COMPUSTAT ivncf/csho, where ivncf is cash flows from investing activities. |
| FFOt | Funds from operations per share, measured as I/B/E/S actual diluted FFO per share, adjusted to a basic FFO per share using a dilution factor implied by COMPUSTAT EPS. |
| BVt,ffo | Gross book value of common equity per share (BVt+ accumulated depreciation per share). |
| PEt –1,ffo | Gross book value of real property per share at the end of year t– 1 (PEt–1+ accumulated depreciation per share at the end of year t– 1). |
| FFOCOMP,t | FFO per share computed using COMPUSTAT numbers. For REITs, NIt– DEPRt, and for non-REIT firms, NIt– DEPRt+ per-share gain or loss on the sale of property (–1 ×COMPUSTAT SPPIV/csho). |
| CFOt | Cash flows from operating activities per share, measured as CFO (COMPUSTAT oancf) less preferred dividend (dvp), all deflated by the number of shares outstanding (csho). |
| FFOCOMP– CFOt | Non-CFO component of FFO measured as FFOCOMP minus CFO. |
| DEPRt | Depreciation expense per share, measured as –1 ×COMPUSTAT dpc/csho. For REITs, if dpc is missing, depreciation expense for real estate (COMPUSTAT dpret) is used. |
| WCt –1 | The book value of working capital per share at the end of year t– 1. We define working capital for REITs (non-REITs) as net operating assets, other than real property (other than property, plant, and equipment). For REITs, this is measured as total assets (at) – total liabilities (tl) + total debt (dltt and dlc) – cash and cash equivalents (che) – real property (ret). For non-REITs, ppent replaces ret. Missing values are hand collected from 10-K statements. |
| LANDt –1 | The book value of land per share at the end of year t– 1. |
| BUILDt –1 | The book value of buildings per share at the end of year t– 1 (pet–1–landt–1). |
| CYCLEI,t | A composite index for industry business cycle phase. CYCLEt denotes the real estate cycle variable. CYCLEEXT,t denotes the extractive industry cycle variable. CYCLEERH,t denotes the ERH industry cycle variable. See Online Appendix D for our estimation procedure. |
| FIXEDt | Fixed asset ratio, measured for REITs (for non-REITs) as real property (as net property, plant, and equipment) deflated by total assets net of cash and short-term investment. |
Authors’ Note
This paper is based on Prof. Jeong Hwan Joo’s dissertation completed at the University of British Columbia. The paper has benefited from audience contributions at Wilfrid Laurier University, Concordia University, National University of Singapore, the University of Hong Kong, University of Queensland, University of Oregon, University of Arizona, and University of Waterloo, and from presentations at the Canadian Academic Accounting Association (CAAA) annual meeting, American Accounting Association (AAA) annual meeting, Financial Accounting and Reporting Section (FARS) meeting of the AAA, and Journal of Accounting, Auditing & Finance (JAAF) conference. Individual comments from Rick Morton, Steve Matsunaga, David Guenther, and Nicole Johnson have been especially helpful. Joy Begley and Sandra Chamberlain are the Ronald L. Cliff and CPA Chair Professors in Accounting.
Declaration of Conflicting Interests
The author(s) declared no potential conflicts of interest with respect to the research, authorship, and/or publication of this article.
Funding
The author(s) received no financial support for the research, authorship, and/or publication of this article.
Data Availability
All data used in the study are available from public sources.
Supplemental Material
Supplemental material for this article is available online.
Notes
References
Supplementary Material
Please find the following supplemental material available below.
For Open Access articles published under a Creative Commons License, all supplemental material carries the same license as the article it is associated with.
For non-Open Access articles published, all supplemental material carries a non-exclusive license, and permission requests for re-use of supplemental material or any part of supplemental material shall be sent directly to the copyright owner as specified in the copyright notice associated with the article.