
Abstract
We document a walk-down in gross domestic product (GDP) growth projections that is akin to that in sell-side analysts’ earnings forecasts. While the walk-down in earnings forecasts has been generally attributed to the strategic interplay between corporate managers and sell-side analysts, professional macro forecasters affiliated with the Federal Reserve are less susceptible to outside pressure. Our evidence shows that countercyclical variation in forecasting difficulty, due to asymmetry in the steepness of economic downturns relative to upturns, is relevant in explaining the walk-down in macro forecasts. Without rejecting the expectations game between managers and sell-side analysts, our article offers a more auspicious characterization of forecast walk-downs whereby such patterns can surface even without conditioning on strategic incentives for bias. An overarching implication is that research on the properties of sell-side analysts’ forecasts should consider strategic incentives for bias interacted with information about the state of the economy and heterogeneity in the cyclical exposure of individual firms.
Keywords
Introduction
A long line of capital markets research examines the properties of sell-side analysts’ forecasts of earnings per share (EPS) and provides evidence that analysts’ errors decline as the forecast horizon end approaches (e.g., Elton et al., 1984; Kang et al., 1994). At the beginning of the forecast horizon, sell-side analysts issue optimistic EPS forecasts, which they subsequently revise downward. These downward revisions tend to yield pessimistic EPS forecasts prior to earnings announcements. The pattern of optimism at long horizons followed by pessimism at short horizons is known as the “walk-down” in EPS forecasts. What explains the walk-down in EPS forecasts? This is an important question because sell-side analysts’ EPS forecasts are widely used as a yardstick of corporate performance and the walk-down is associated with significant capital market consequences (e.g., Johnson et al., 2020; Richardson et al., 2004).
A prevalent explanation for forecast walk-downs is strategic incentives for bias among forecasters. On one hand, managers prefer optimistic forecasts at long horizons followed by pessimistic forecasts at short horizons so that they boost market perceptions early on and avoid negative surprises later (e.g., Bartov et al., 2002; Kasznik & McNichols, 2002; Matsumoto, 2002). On the other hand, sell-side analysts have incentives to cater to managers’ preferences so that they gain more access to information, generate investment banking fees and trading commissions for their employers, and advance their own careers (e.g., Hong & Kubik, 2003; Ke & Yu, 2006). However, Malmendier and Shanthikumar (2014) raise concerns about the role of strategic incentives for bias in explaining forecast revisions and highlight the difficulty of empirically separating preexisting strategic incentives from alternative explanations.
The objective of our article is to shed light on the origins of forecast walk-downs in a setting where forecasters have strong incentives to strive for accuracy. With this objective in mind, we identify the group of macroeconomists participating in Philadelphia Fed’s Survey of Professional Forecasters (SPF)—a closely watched survey of gross domestic product (GDP) growth projections in the United States. While sell-side analysts have strategic incentives to curry favor with management, SPF participants are less susceptible to outside pressure.
The SPF forecasts are produced by professional macroeconomists affiliated with a wide array of public and private institutions, including financial institutions, academia, trade associations, and labor unions. The SPF participants are recognized to be among the most informed economic agents (e.g., Coibion & Gorodnichenko, 2012). The Philadelphia Fed anonymizes the identities of individual forecasts, thereby creating an environment that is conducive to the production of unbiased projections of U.S. GDP growth, free of outside pressure on SPF participants to appease their employers, clients, or the government. Because the SPF participants represent a wide spectrum of institutions, individual political preferences are expected to cancel out in the consensus (e.g., Batchelor, 2007). At the same time, SPF participants face strong incentives to strive for accuracy as their professional reputation with the Fed is at stake. Consistent with the fact that SPF panelists care about forecast accuracy, prior research shows that the SPF consensus is a challenging benchmark to surpass using sophisticated statistical models (e.g., Giannone et al., 2008).
Remarkably, we find evidence of a walk-down pattern in the SPF consensus forecast of GDP growth. SPF participants provide their initial forecast for quarterly GDP growth as of the middle of quarter
One explanation for the macro walk-down may be self-selection with respect to forecast timing. This explanation requires that relatively pessimistic SPF participants withhold (or delay) their views at long horizons and choose to provide forecasts only at short horizons. To evaluate the effect of self-selection with respect to forecast timing, we identify the subset of SPF participants who provided forecasts of quarterly GDP growth across all forecast horizons from the middle of quarter
Another potential explanation for the macro walk-down is that forecast revisions in sell-side analysts’ EPS forecasts aggregate up from the firm level to the macro level through the corporate profit component of U.S. output. This explanation relies on the idea that corporate profits in the Bureau of Economic Analysis (BEA)’s National Income and Product Accounts (NIPA) are a component of gross domestic income, which measures U.S. output by summing income generated in the production of that output. This explanation predicts that there should be no evidence of a walk-down in GDP growth forecasts after excluding the corporate profit component of U.S. output. Contrary to this explanation, we find that the macro walk-down remains unchanged when we exclude NIPA corporate profits from GDP.
Our evidence of a macro walk-down extends beyond Philadelphia Fed’s SPF to the Greenbook of the Federal Reserve Board. The Greenbook contains projections of the U.S. economy produced by the Research Staff at the Federal Reserve Board before the Federal Open Market Committee (FOMC) meetings. Because the FOMC explicitly uses the Greenbook when formulating monetary policy, the Fed’s Research Staff devote vast resources to producing accurate forecasts of the U.S. economy (e.g., Sims, 2002). In fact, Romer and Romer (2000) argue that the Fed’s Research Staff have a forecasting advantage over other professional macro forecasters.
Still, we document that the Greenbook projections exhibit a similar walk-down pattern. Given the importance of the Greenbook projections in formulating monetary policy, it would be difficult to attribute the walk-down to strategic incentives for bias among the Fed’s Research Staff. The Federal Reserve is independent within the government, and therefore, it would also be difficult to argue that the Fed’s Research Staff systematically walk-down the Greenbook projections to make it easier for the government to meet or beat economic growth targets. 1 Although we cannot rule out the possibility of political meddling among the Fed’s Research Staff, such scenario would be entirely inconsistent with the stated mission of the Federal Reserve.
Prior research has devoted attention to the role of strategic incentives for bias as a sufficient condition for forecast walk-downs. Different from prior research, we find evidence that asymmetrically high forecasting difficulty in economic downturns relative to upturns can give rise to a forecast walk-down pattern even in the absence of strategic incentives for bias. While recoveries tend to be gradual and, therefore, easier to predict, contractions tend to be steep and, therefore, harder to predict. From the recessions of the early 1990s and 2000s to the Great Recession of 2008 and the ongoing COVID-19 economic contraction, professional macro forecasters have generally failed to anticipate downturns in advance. Consistent with countercyclical variation in forecasting difficulty, Bloom (2014) observes that almost every indicator of macro uncertainty, from disagreement among professional macro forecasters to the frequency of news articles containing the words “uncertain” or “uncertainty,” is higher in downturns relative to upturns.
The idea that contractions tend to be steep, whereas recoveries tend to be gradual has a long tradition in business cycle analyses (e.g., Zarnowitz, 1986). This type of asymmetry, known as steepness asymmetry, dates to the work of prominent economists such as W.C. Mitchell and J. M. Keynes. To illustrate, Mitchell (1927) points out that “. . . business contraction seems to be a briefer and more violent process that business expansion” (p. 333). Keynes (1936) writes that “. . . the substitution of a downward for an upward tendency often takes place suddenly and violently, whereas there is, as a rule, no such sharp turning-point when an upward is substituted for a downward tendency” (p. 311). 2
Consistent with countercyclical variation in forecasting difficulty, we observe that the absolute magnitude of GDP growth forecast errors is nearly twice as large for downturns relative to upturns. The key implication is that at longer horizons, macro forecasters have more difficulty anticipating economic downturns relative to upturns. As the horizon shortens and there is more information about the actual state of the economy, macro forecasters gradually update their growth projections, and therefore, we observe a steep walk-down during downturns. Importantly, the disproportionately large negative forecast revisions during hard-to-predict downturns dominate in short time-series, which explains the overall evidence of a macro walk-down at long forecast horizons.
What are the broader implications of the macro walk-down pattern for understanding the properties of sell-side analysts’ forecasts? We argue that countercyclical variation in forecasting difficulty, due to asymmetry in the steepness of economic downturns relative to upturns, is a relevant source of cross-sectional and time-series variation in the properties of sell-side analysts’ EPS forecasts. Our starting point is that EPS forecasts have a systematic component that is related to GDP. It follows that countercyclical variation in forecasting difficulty will create similar difficulties for sell-side analysts with respect to projecting the systematic component of EPS during downturn quarters relative to upturn quarters. Given that the systematic component of EPS varies across firms depending on their cyclical exposure, we predict that the implications will differ across sectors.
To address this question, we construct bottom-up forecasts of market-level EPS for quarter q across alternative forecast horizons starting from quarter
While consistent with evidence of a common macro component in the cross-section of accounting earnings, our evidence yields new insights into the degree of overlap between the market-level EPS walk-down and the macro walk-down. Specifically, our evidence shows that GDP growth forecast revisions account for nearly half of the time-series variation in aggregate EPS forecast revisions. When we explore variation across sectors, we find that the common component between the EPS walk-down and the macro walk-down is particularly pronounced for firms in cyclical sectors (e.g., consumer discretionary) relative to firms in defensive sectors (e.g., consumer staples). In fact, the EPS walk-down is nearly 2 times as large for firms in cyclical sectors relative to firms in defensive sectors. When we further explore variation with the state of the economy, we find that the EPS walk-down for firms in cyclical sectors is significantly more pronounced in downturns relative to upturns, while there is only limited evidence of such variation in the EPS walk-down for firms in defensive sectors. Collectively, our evidence identifies heterogeneity in the cyclical exposure of individual firms to aggregate fluctuations as a source of cross-sectional and time-series variation in the EPS walk-down.
Overall, our article provides a new perspective on the origins of forecast walk-downs and has broad implications for capital markets research on the properties of sell-side analysts’ forecasts. Prior research has devoted attention to the role of strategic incentives for bias as a sufficient condition for forecast walk-downs. However, the separation of strategic incentives from forecasting difficulty poses a major challenge for researchers who use sell-side analysts’ forecasts (e.g., Malmendier & Shanthikumar, 2014). 3 In part due to this empirical challenge, it has remained unclear what is the relative importance of strategic incentives and forecasting difficulty in explaining forecast walk-downs.
Although we cannot rule out the role of strategic incentives, our evidence shows that countercyclical variation in forecasting difficulty, due to asymmetry in the steepness of economic downturns relative to upturns, is relevant for understanding the macro walk-down. To be clear, our evidence does not reject the expectations game between managers and sell-side analysts. Instead, our evidence merely highlights the role of forecasting difficulty as a nonmutually exclusive explanation for forecast walk-downs. An overarching implication is that research on the properties of sell-side analysts’ forecasts should consider strategic incentives interacted with information about the state of the economy and heterogeneity in the cyclical exposure of individual firms.
Background on Forecast Walk-Downs
What Explains the Walk-Down in Earnings Forecasts?
A prevalent explanation for the walk-down in earnings forecasts is that sell-side analysts have incentives to please corporate executives. At long horizons, managers prefer optimistic bias in analysts’ forecasts because such bias can improve market perceptions about the firm’s prospects (e.g., Richardson et al., 2004). As the earnings announcement date approaches, however, managers have a preference for beatable targets to avoid large negative surprises (e.g., Bartov et al., 2002; Kasznik & McNichols, 2002; Matsumoto, 2002) and manufacture positive earnings surprises (e.g., Johnson et al., 2020).
Prior research proposes that sell-side analysts have strategic incentives to have good relationship with managers to (a) gain better access to valuable information (e.g., Das et al., 1998; Ke & Yu, 2006; Lim, 2001), (b) induce management guidance (e.g., Kasznik & Lev, 1995, (c) generate investment banking fees and trading commissions (e.g., Chen & Jiang, 2005; Dugar & Nathan, 1995; Lin & McNichols, 1998; Michaely & Womack, 1999), and (d) advance their own careers (e.g., Hong & Kubik, 2003; Ke & Yu, 2006). Post-Regulation Fair Disclosure (Reg FD) studies find that favorable access to management remains a consideration for sell-side analysts (e.g., Brown et al., 2015; Green et al., 2014; Mayew, 2008; Soltes, 2014), although the informational advantage of social networks has diminished (e.g., Cohen et al., 2010).
Prior studies point out alternative forces that could interact with preexisting strategic incentives for forecast bias. Zhang (2006) provides evidence that information uncertainty slows down the incorporation of ambiguous information, thereby exacerbating the walk-down in sell-side analysts’ forecasts. Barron et al. (2013), motivated by research on self-selection in analyst coverage (e.g., McNichols & O’Brien, 1997), point out that relatively pessimistic analysts strategically choose to issue their forecasts closer to the earnings announcement date because at that time, managers are more concerned with meeting or beating expectations. Consistent with this argument, Barron et al. (2013) provide evidence that incentive-driven self-selection in analyst coverage influences the steepness of the EPS walk-down. Bradshaw et al. (2016) appeal to research on cognitive psychology to argue that sell-side analysts with preexisting strategic incentives for bias are more likely to rely on evidence that justifies their bias when forecasting difficulty is high.
The Setting of Professional Macro Forecasters
The SPF
The SPF is the oldest quarterly survey of GDP growth forecasts for the U.S. economy. The survey began in 1968:Q4 and was initially conducted by the American Statistical Association and the National Bureau of Economic Research. The Philadelphia Fed took over the survey in 1990:Q2. The set of SPF participants consists of macroeconomists affiliated with a wide spectrum of public and private institutions. One common attribute among the SPF participants is that macro forecasting is part of their full-time jobs (e.g., Croushore, 1993). The Philadelphia Fed anonymizes the identities of individual forecasts, thereby creating an environment that is more conducive to the production of objective projections. The SPF participants face strong incentives to strive for accuracy as their professional reputation with the Fed is at stake. Indeed, prior research shows that the SPF consensus is a challenging benchmark to surpass using sophisticated statistical models (e.g., Giannone et al., 2008).
The Fed’s Greenbook projections
The Fed’s Research Staff prepare the Greenbook before each meeting of the FOMC, which is the monetary policymaking body of the Federal Reserve System. The Greenbook includes projections of how the U.S. economy will fare in the future. These projections are made available to the public after a 5-year blackout window. The FOMC uses the Greenbook when formulating monetary policy, and therefore, the Fed’s Research Staff have strong incentives to strive for accuracy when projecting the prospects of the U.S. economy.
The Greenbook setting has two primary advantages over the Philadelphia Fed’s SPF. First, Romer and Romer (2000) evaluate the accuracy of the Greenbook and conclude that the Fed’s Research Staff have a forecasting advantage over other professional macro forecasters. Romer and Romer (2000) conjecture that the Fed derives its forecasting advantage from the vast resources that it devotes to forecasting. Relatedly, Bernanke and Boivin (2003) note that the Fed’s Research Staff may have access to private information about the state of the macroeconomy, special expertise in terms of processing publicly available information, or both. Second, the Greenbook is less susceptible to the reputation considerations of individual SPF panelists. In the presence of reputational considerations, individual SPF panelists who want to avoid attention may tilt their forecasts toward the consensus, whereas those who want to stand out from the crowd and attract attention may provide unusually bold forecasts (e.g., Lamont, 2002; Ottaviani & Sørensen, 2006). Such reputational concerns do not apply to the Fed’s Research Staff.
Professional macro forecasters versus sell-side analysts
Strategic reasons for why sell-side analysts are presumed to be biased, including gaining favorable access to management and generating trading commissions and investment banking revenue for their employers, are not as applicable to the setting of professional macro forecasters. With respect to the SPF, the survey participants have incentives to generate unbiased projections of U.S. GDP growth because their professional reputation with the Federal Reserve is at stake. In addition, the Fed’s Research Staff have strong incentives to strive for accuracy because their Greenbook projections are key inputs to FOMC’s monetary policymaking. Overall, the setting of professional macro forecasters provides an opportunity to examine the origins of forecast walk-downs in a setting where forecasters have strong incentives to strive for accuracy and are less susceptible to outside pressure to curry favors.
Forecast Walk-Downs at the Macro Level
Timeline
Our research design follows the SPF timeline. As of the middle of each calendar quarter, the Philadelphia Fed collects the individual participants’ forecasts for the current quarter as well as for the subsequent four quarters. SPF participants provide their initial forecast of GDP growth for quarter q as of the middle of quarter
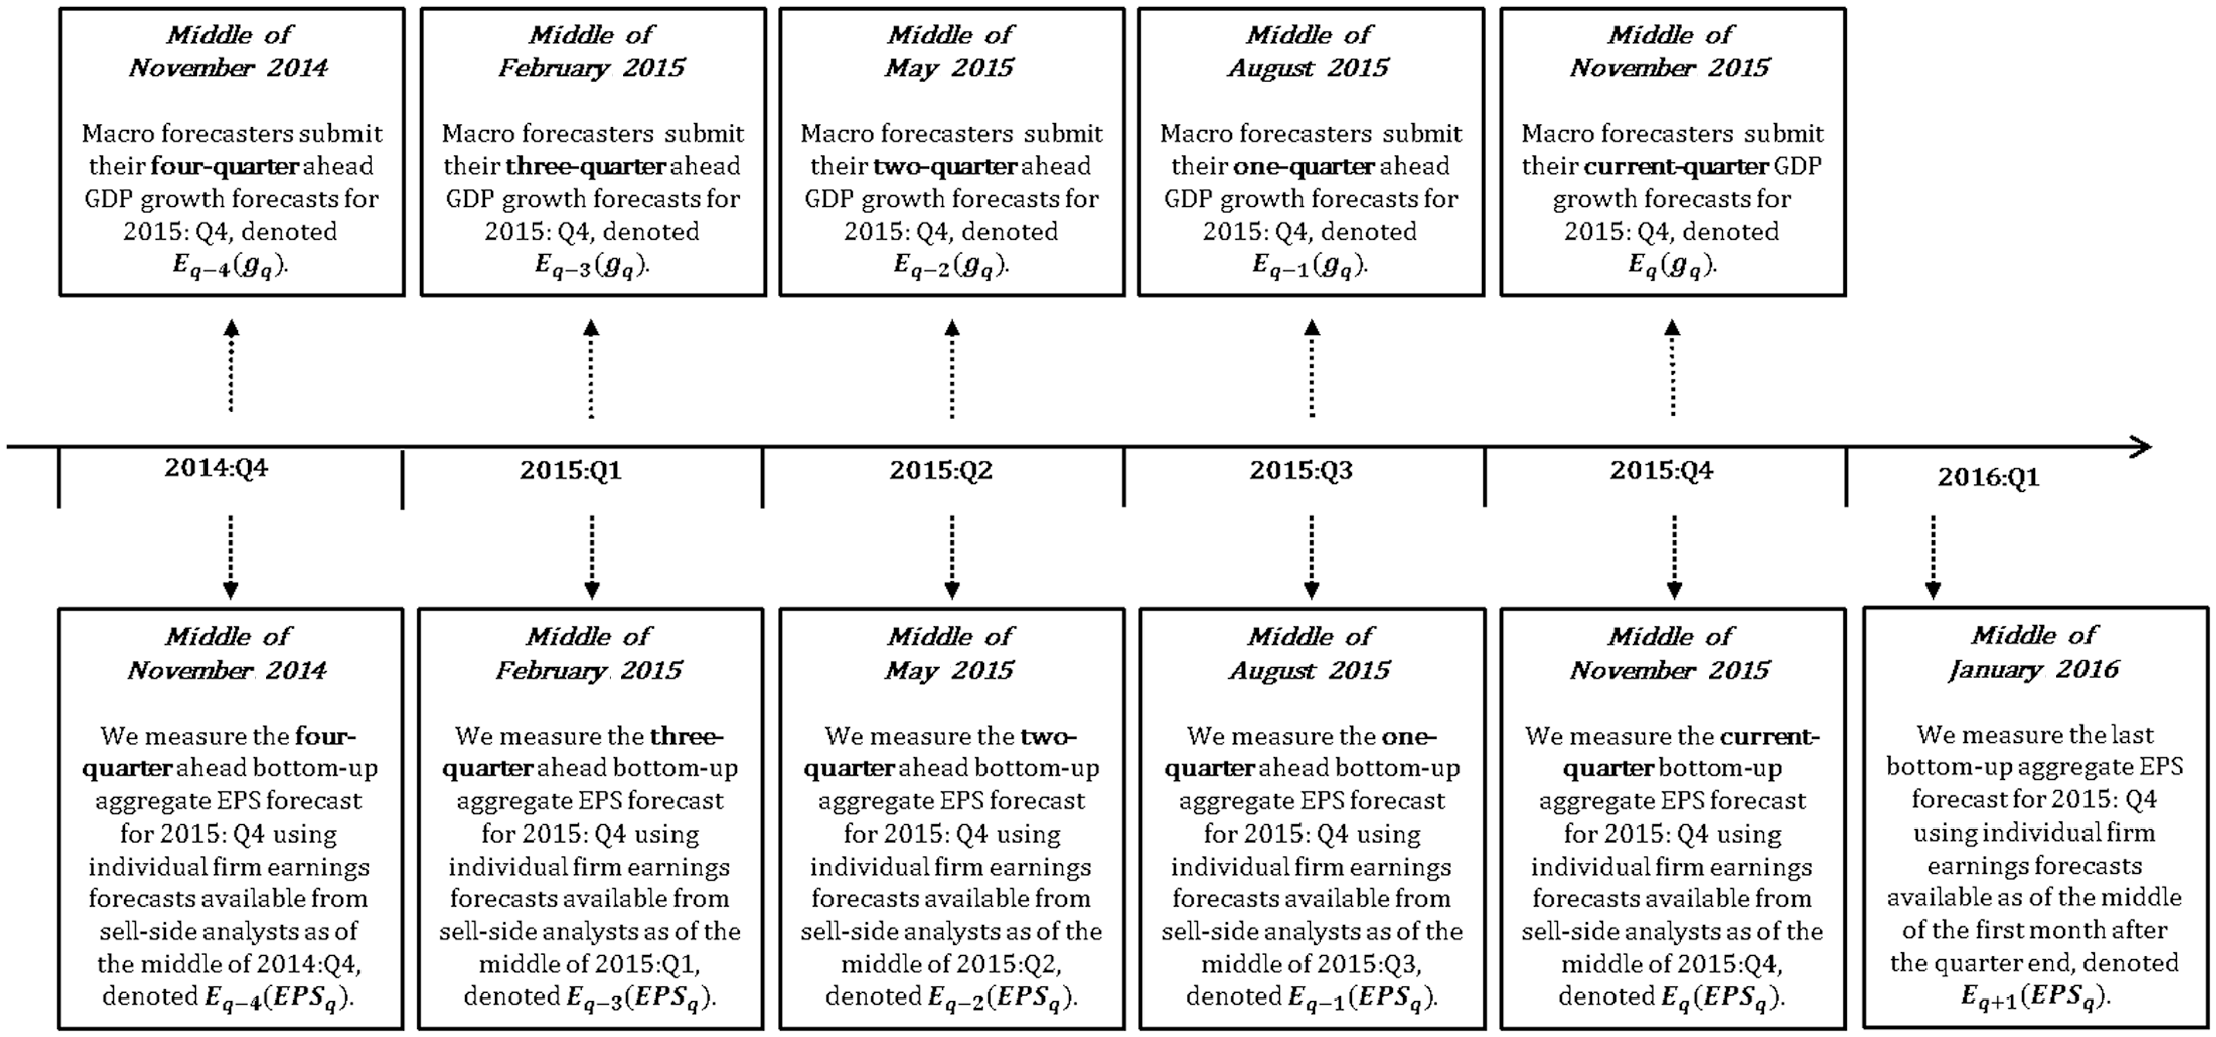
Timeline of research design: An illustrative example.
Data on GDP Growth Forecasts and Realizations
We obtain individual SPF forecasts and the BEA’s most recent NIPA report of realized GDP growth from the Philadelphia Fed. Throughout the article, we focus on nominal GDP growth because financial accounting data as well as NIPA corporate profits are not adjusted for inflation. Our inferences are unchanged using real GDP growth. Our sample period begins in 1985:Q2 because from that point onward, SPF’s timing is well documented and consistent over time (e.g., Stark, 2010). Typically, there are 35 individual forecasters per survey. Using the individual SPF forecasts, we compute the mean consensus forecast of GDP growth for quarter q as of the middle of quarter
Walk-Down in GDP Growth Forecasts
Evidence from Philadelphia Fed’s SPF
Table 1 examines variation in the SPF consensus forecast of GDP growth for quarter q across different forecast horizons. The “unrestricted” SPF consensus is based on the forecasts of all survey participants, regardless of whether each individual participant provided projections of GDP growth across all forecast horizons. Like firm-level findings, our macro-level evidence optimism at long forecast horizons followed by negative forecast revisions as the horizon shortens. The initial SPF consensus forecast of GDP growth for quarter q issued as of the middle of quarter
Macro walk-down: Evidence from the Philadelphia Fed’s SPF.
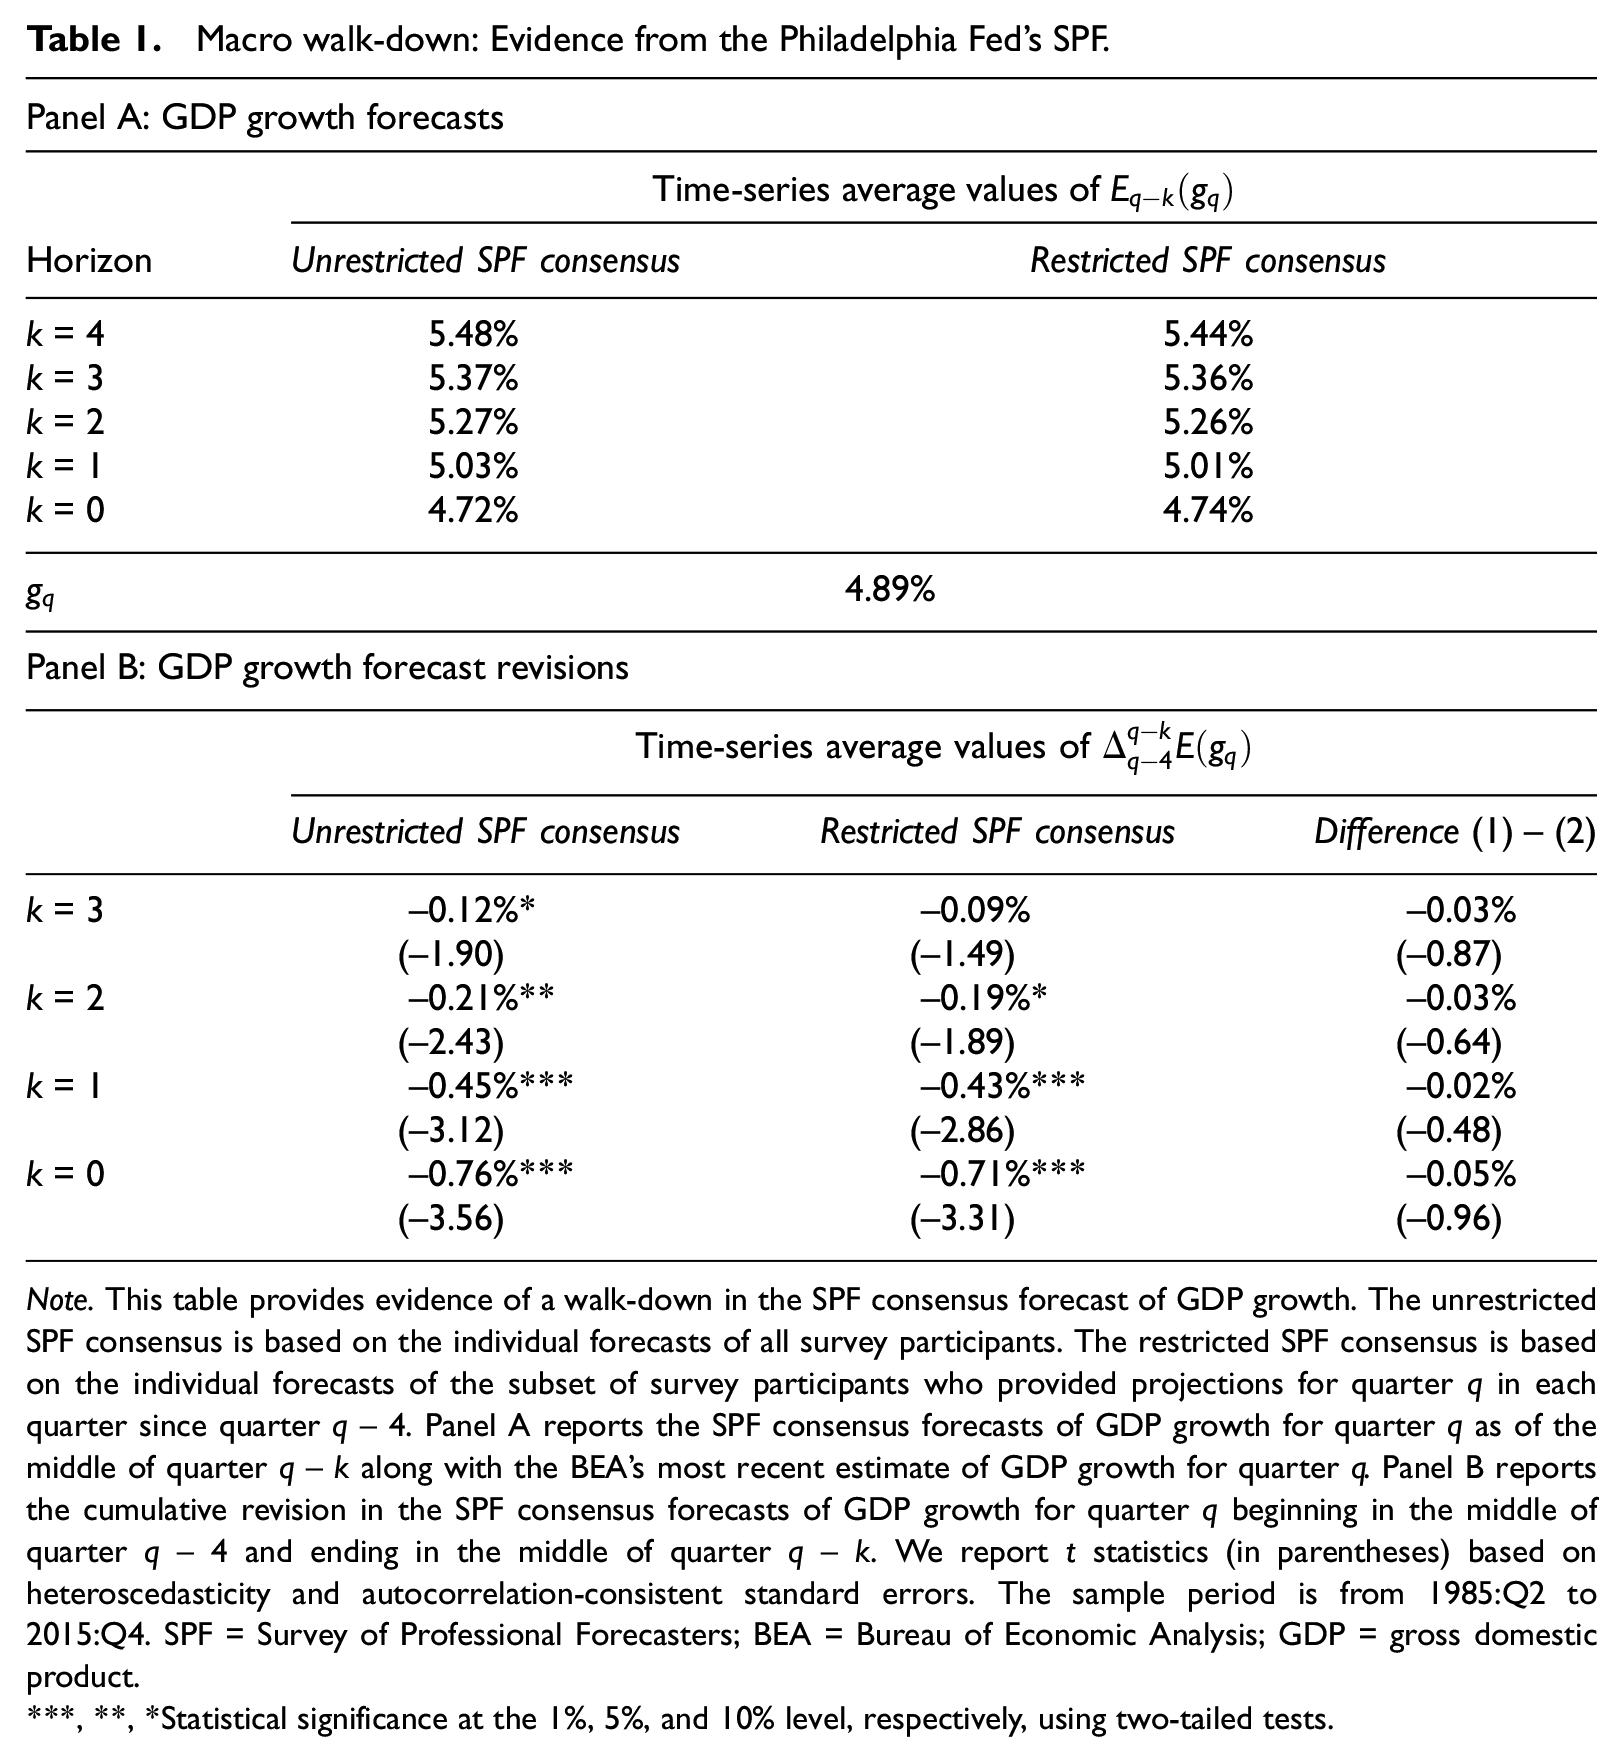
Note. This table provides evidence of a walk-down in the SPF consensus forecast of GDP growth. The unrestricted SPF consensus is based on the individual forecasts of all survey participants. The restricted SPF consensus is based on the individual forecasts of the subset of survey participants who provided projections for quarter q in each quarter since quarter q − 4. Panel A reports the SPF consensus forecasts of GDP growth for quarter q as of the middle of quarter q − k along with the BEA’s most recent estimate of GDP growth for quarter q. Panel B reports the cumulative revision in the SPF consensus forecasts of GDP growth for quarter q beginning in the middle of quarter q − 4 and ending in the middle of quarter q − k. We report t statistics (in parentheses) based on heteroscedasticity and autocorrelation-consistent standard errors. The sample period is from 1985:Q2 to 2015:Q4. SPF = Survey of Professional Forecasters; BEA = Bureau of Economic Analysis; GDP = gross domestic product.
, **, *Statistical significance at the 1%, 5%, and 10% level, respectively, using two-tailed tests.
More specifically, Table 1, Panel A, shows that as of the middle of quarter
Self-selection with respect to forecast timing
One explanation for the macro walk-down might be that relatively pessimistic SPF participants withhold their views at long forecast horizons and choose to provide forecasts only at short forecast horizons. To evaluate the effect of self-selection with respect to forecast timing, we identify the subset of SPF participants who provided forecasts of GDP growth for quarter q across all forecast horizons from the middle of quarter
We find consistent evidence of walk-down in the restricted SPF consensus. Table 1, Panel A, shows that moving from the middle of quarter
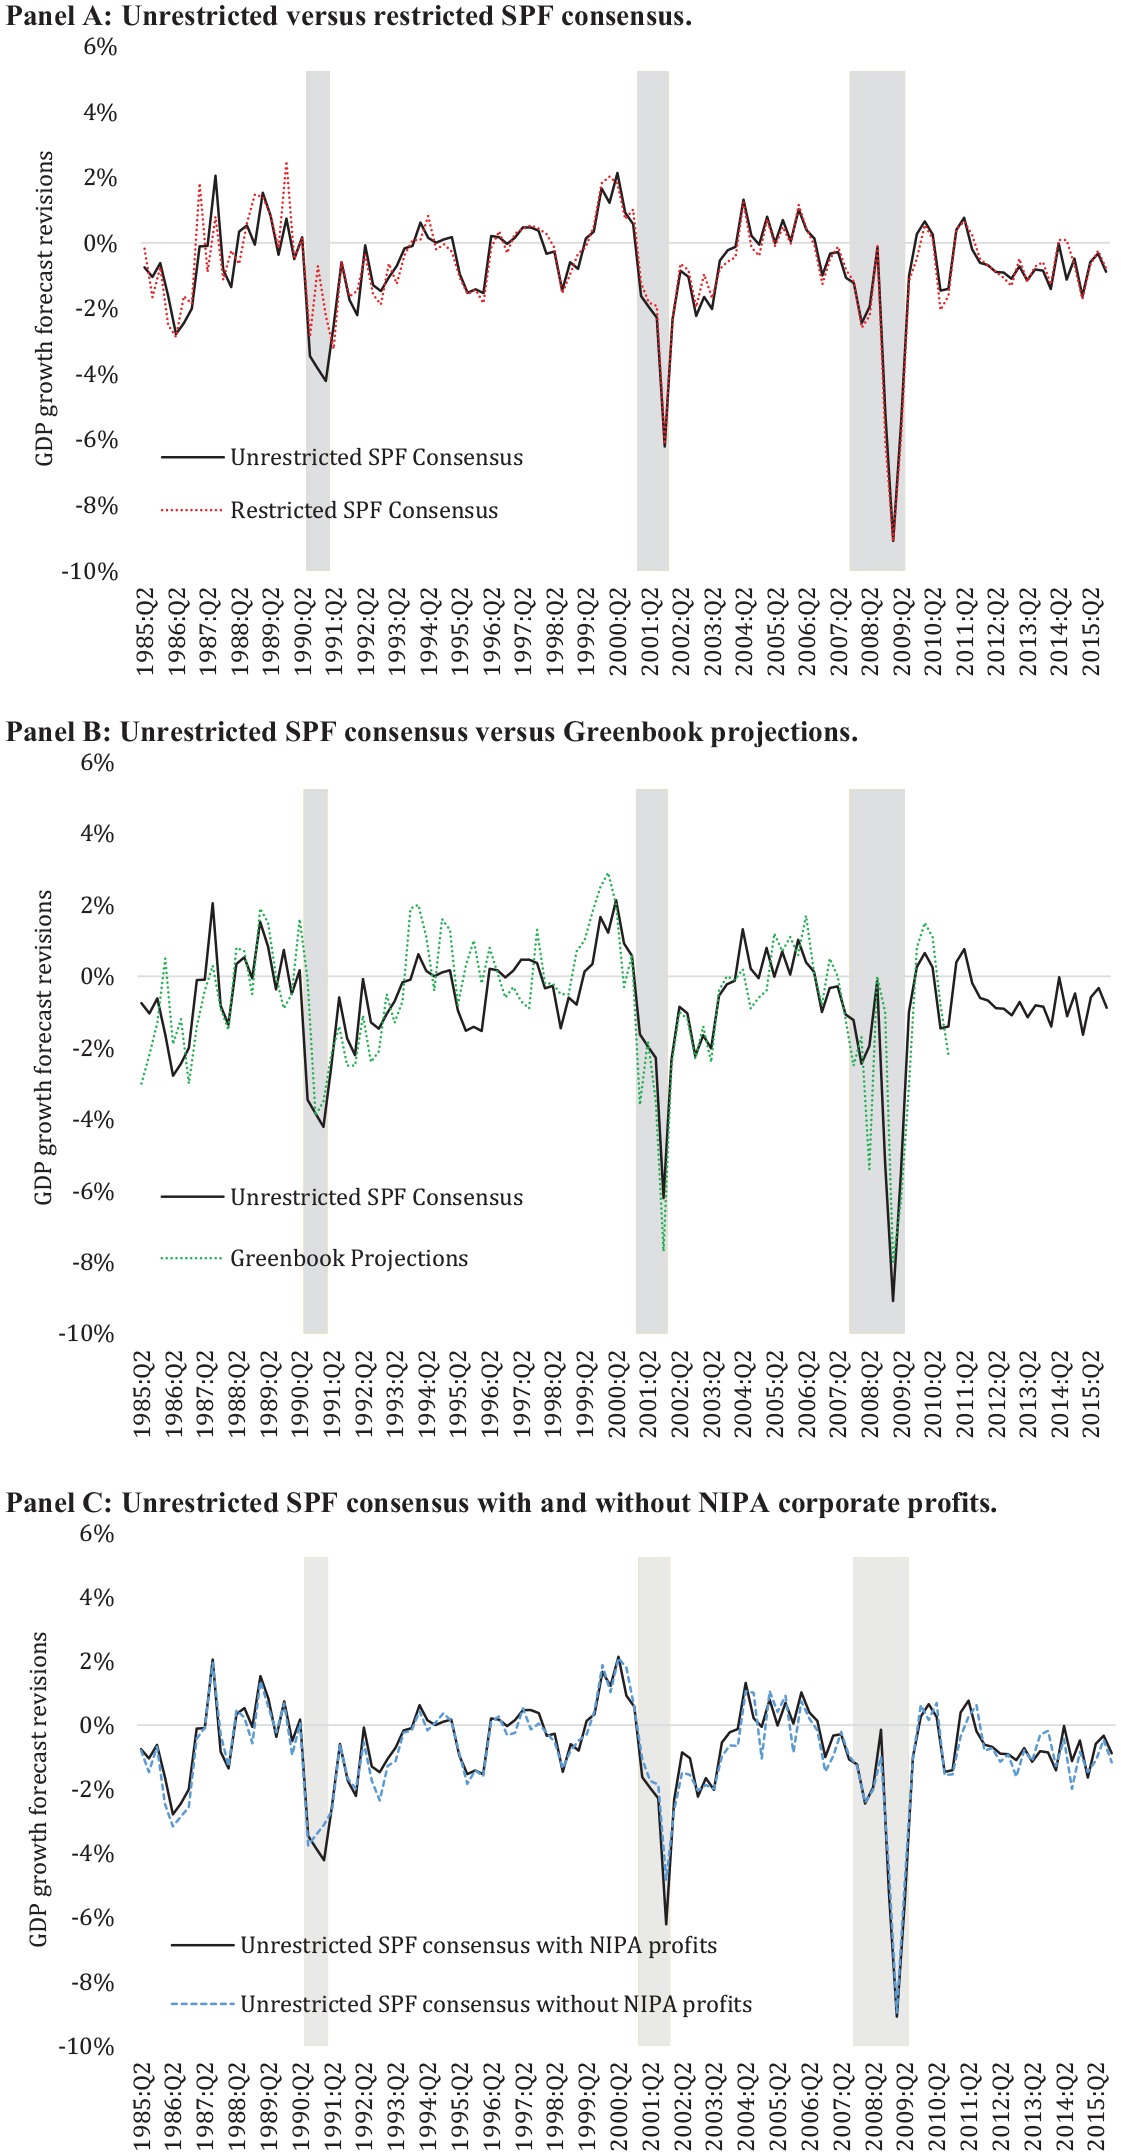
Macro walk-down. Panel A: Unrestricted versus restricted SPF consensus. Panel B: Unrestricted SPF consensus versus Greenbook projections. Panel C: Unrestricted SPF consensus with and without NIPA corporate profits.
Evidence from the Fed’s Greenbook projections
Next, we search for evidence of a walk-down in the Greenbook projections of GDP growth. Our sample for this analysis is restricted to the period ending in 2010:Q4 because the Greenbook is subject to a 5-year disclosure lag. As we explain in section “Background on Forecast Walk-Downs,” the Fed’s Research Staff have strong incentives to strive for accuracy when preparing the Greenbook projections because the FOMC relies on these projections when formulating monetary policy. We note that the Fed’s Research Staff are mandated to prepare projections of GDP growth across all different forecast horizons before each FOMC meeting, and therefore, there is less room for self-selection with respect to forecast timing in the Greenbook projections than the SPF.
Table 2, Panel A, shows that the Greenbook projections exhibit the same walk-down pattern that we find for the SPF consensus forecasts. Moving from the middle of quarter
Macro walk-down: Evidence from the Federal Reserve’s Greenbook.

Note. This table provides evidence of a walk-down in the Greenbook projections and the SPF consensus forecast of GDP growth. Panel A reports the Greenbook projections and the SPF consensus forecast of GDP growth for quarter q as of the middle of quarter
, **, *Statistical significance at the 1%, 5%, and 10% level, respectively, using two-tailed tests.
Political meddling among professional macro forecasters
With respect to the SPF, the participants represent a wide spectrum of institutions. Individual political biases should, therefore, cancel out in the consensus forecast (e.g., Batchelor, 2007). With respect to the Greenbook, it would be difficult to argue that Fed’s Research Staff walk down the Greenbook projections to make it easier for the government to meet or beat economic growth targets. According to the Fed’s Board of Governors, the Federal Reserve is independent within the government. Nevertheless, we cannot rule out the possibility of political meddling among the Fed’s Research Staff. Yet, such scenario of political meddling would be largely inconsistent with the Federal Reserve’s mission. 4
Evidence excluding the corporate profit component of U.S. output
Another explanation for the macro walk-down is that forecast revisions in sell-side analysts’ EPS forecasts aggregate up from the firm level to the macro level through the corporate profit component of U.S. output. This explanation relies on the idea that corporate profits are a component of gross domestic income, which measures U.S. output by summing income generated in the production of that output.
5
This explanation predicts there to be no walk-down in GDP growth forecasts after excluding the corporate profit component of U.S. output. To test this explanation, we obtain individual SPF forecast data of NIPA corporate profits from the Real-Time Data Research Center of the Philadelphia Fed. We then construct quarterly consensus forecasts of GDP growth excluding NIPA corporate profits
The evidence does not support this alternative explanation. The macro walk-down remains unchanged when we remove the NIPA corporate profit component of U.S. output. Focusing on the unrestricted SPF consensus, Table 3, Panel A, shows that moving from the beginning to the end of the forecast horizon, the average value of the consensus forecast of
Macro walk-down: Evidence excluding NIPA corporate profits.
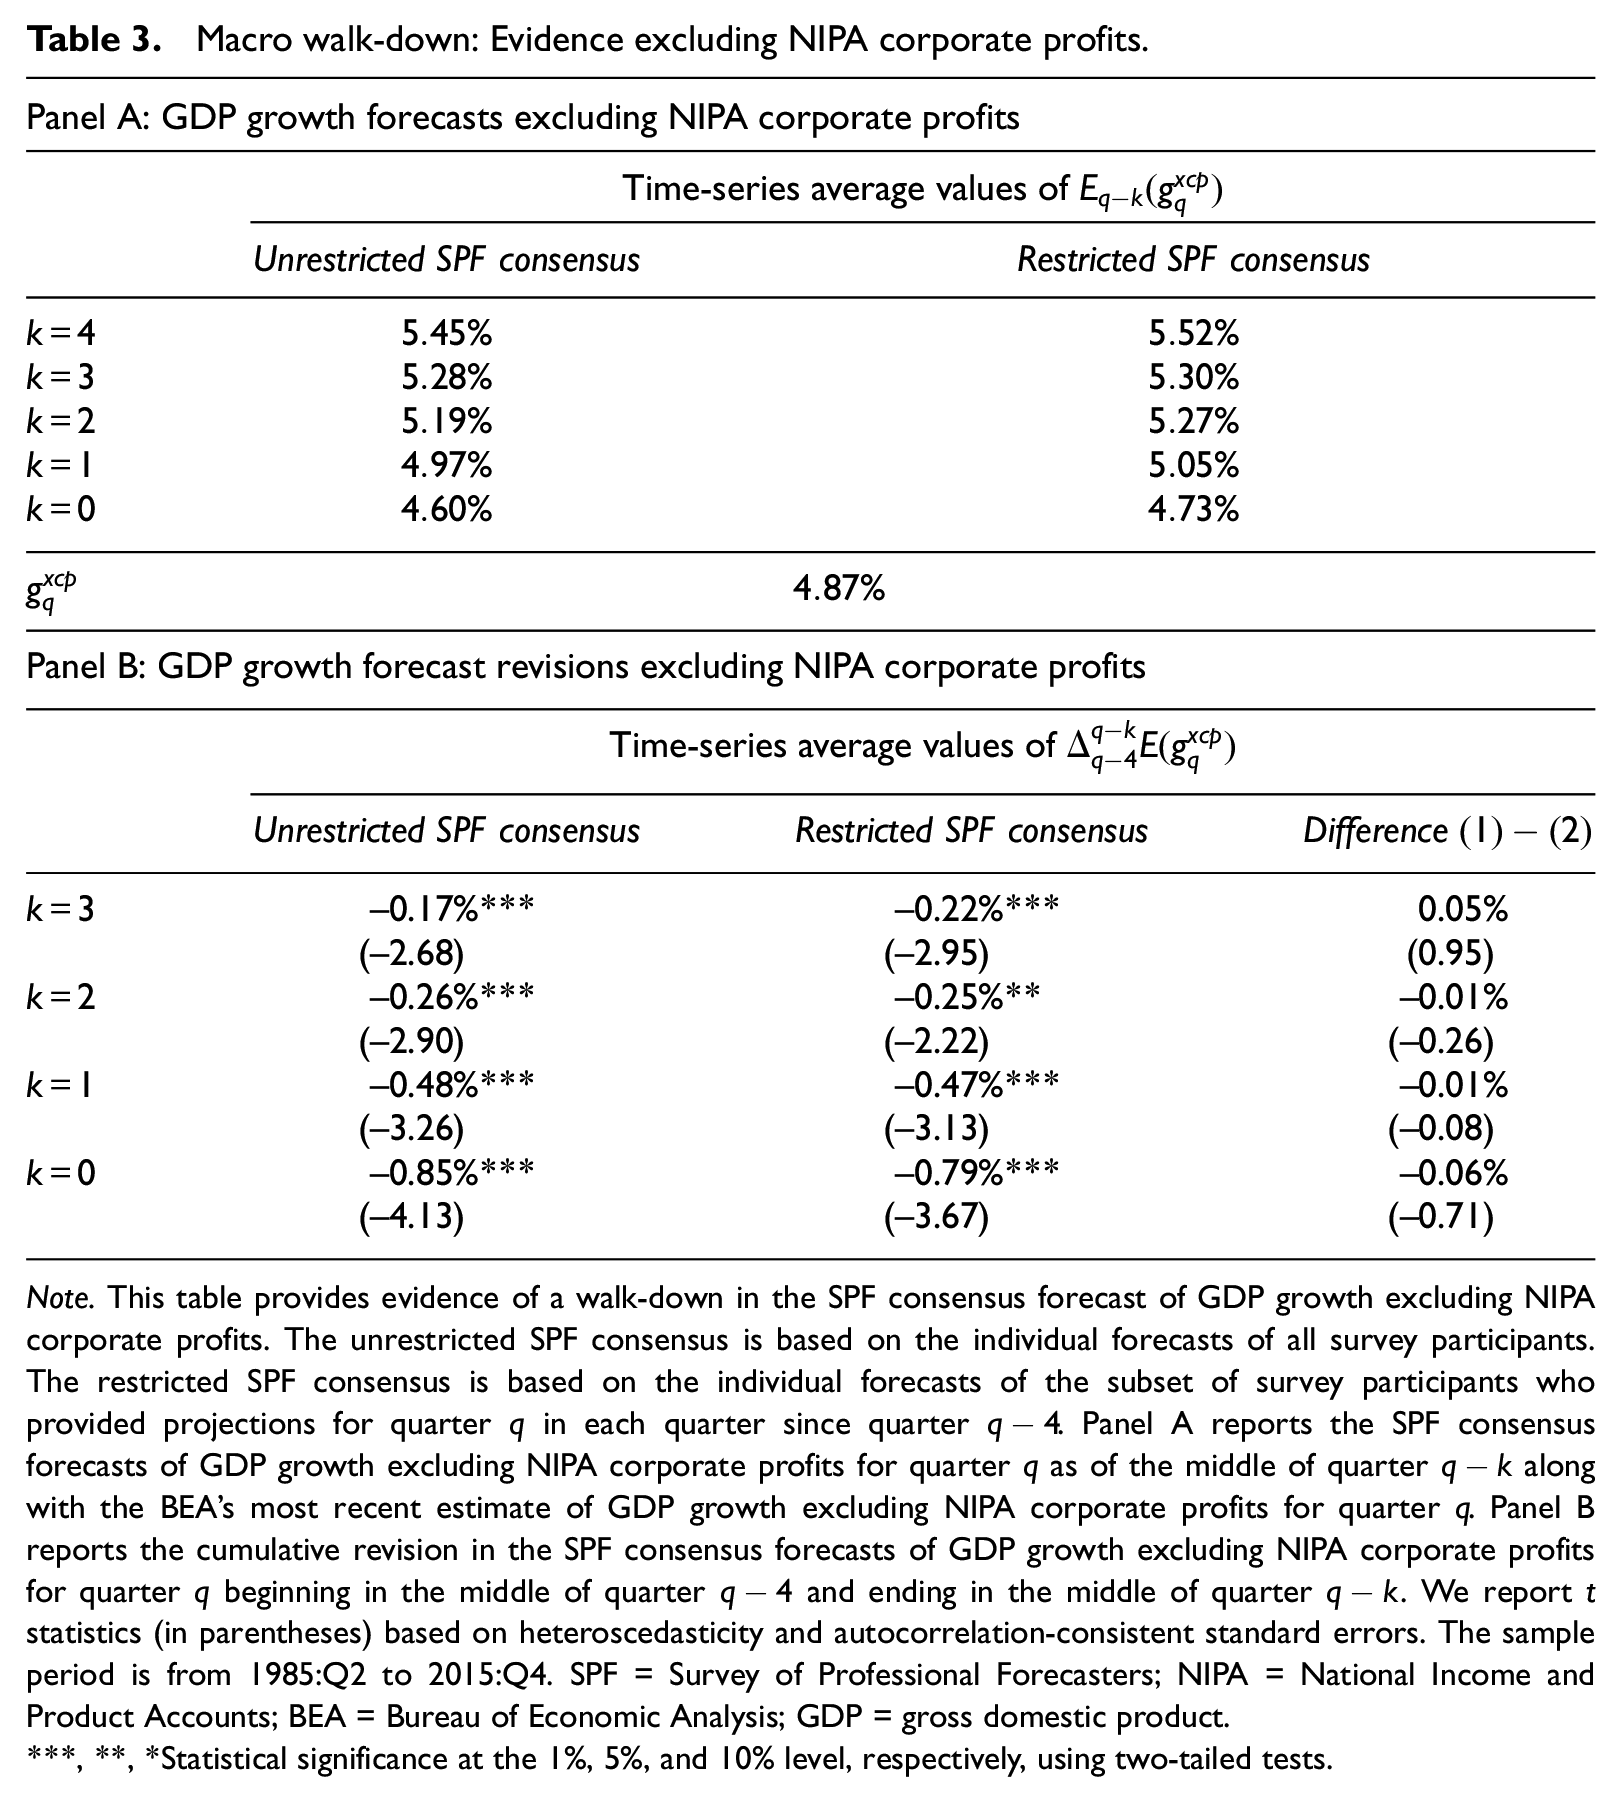
Note. This table provides evidence of a walk-down in the SPF consensus forecast of GDP growth excluding NIPA corporate profits. The unrestricted SPF consensus is based on the individual forecasts of all survey participants. The restricted SPF consensus is based on the individual forecasts of the subset of survey participants who provided projections for quarter q in each quarter since quarter
, **, *Statistical significance at the 1%, 5%, and 10% level, respectively, using two-tailed tests.
Other U.S. business indicators
In additional analyses, we search for evidence of forecast walk-downs in other U.S. business indicators covered in the SPF, including (a) employment rate changes, (b) industrial production growth, and (c) growth in housing starts. Labor force employment rate statistics are based on household surveys conducted by the U.S. Census Bureau for the Bureau of Labor Statistics. The industrial production index is published by the Board of Governors at the Federal Reserve and measures the real output of the manufacturing, mining, and electric and gas utilities industries. Housing starts are based on the Building Permits Survey and the Survey of Construction conducted by the U.S. Census Bureau and the U.S. Department of Housing and Urban Development. One common attribute across these alternative indicators is that they are measured independently from the BEA’s NIPA system. Nevertheless, we continue to find evidence of forecast walk-downs. In addition, the walk-downs are especially pronounced for downturns of the U.S. economy. It follows that macro walk-downs are not limited to statistics produced within the BEA’s NIPA system.
What Explains the Walk-Down in GDP Growth Forecasts?
Our analysis thus far explores a series of potential explanations for the macro walk-down, including (a) self-selection with respect to forecast timing among professional macro forecasters, (b) unidentified incentives for bias among the SPF participants (because we find consistent evidence using the Fed’s Greenbook), and (c) the aggregation of firm-level EPS forecast walk-downs though the NIPA corporate profit component of U.S. output. In what follows, we provide evidence that asymmetrically high forecasting difficulty in economic downturns relative to upturns can give rise to forecast walk-downs even in the absence of strategic incentives for bias among professional macro forecasters.
While recoveries tend to be gradual and, therefore, easier to anticipate in advance, contractions tend to be steep and, therefore, harder to predict partly because they are a result of shocks that are themselves unpredictable (e.g., Loungani and Trehan, 2002; Zarnowitz, 1986). Indeed, there is evidence that forecasting failures are associated with bad times and that downturns have generally not been predicted in advance (e.g., Culbertson and Sinclair, 2014; Dovern and Weisser, 2011; Fintzen and Stekler, 1999). At the onset of downturns, there is also evidence that macroeconomists lack access to reliable real-time data and, therefore, may not have enough information to produce accurate forecasts (e.g., Loungani, 2001). 7 Indeed, as we also point out in section “Introduction,” the idea that contractions tend to be steep, whereas recoveries tend to be gradual has a long tradition in economics (e.g., Keynes, 1936; Mitchell, 1927).
Table 4 provides evidence of asymmetric forecasting difficulty across downturns and upturns of the U.S. economy. We classify quarters with above (below) median GDP growth as upturn (downturn) quarters. 8 We report the time-series average values of GDP growth forecasts for different horizons, along with cumulative GDP growth forecast errors and forecast revisions. Panel A (Panel B) reports results for GDP growth including (excluding) NIPA corporate profits. We report results for the “unrestricted” SPF consensus and find similar results for the “restricted” SPF consensus and the Fed’s Greenbook projections. The evidence is consistent with asymmetrically high forecasting difficulty in bad times relative to good times. Although upturns are characterized by positive forecast errors and downturns are characterized by negative forecast errors, more importantly, the absolute magnitude of GDP growth forecast errors is nearly 2 times as large for downturns relative to upturns. This asymmetry holds regardless of whether we include or exclude the corporate profit component of U.S. output. To illustrate, Table 4, Panel A, shows that the average GDP growth forecast error is 1.16% for upturns and −2.31% for downturns.
Macro walk-down: Variation across upturns and downturns.
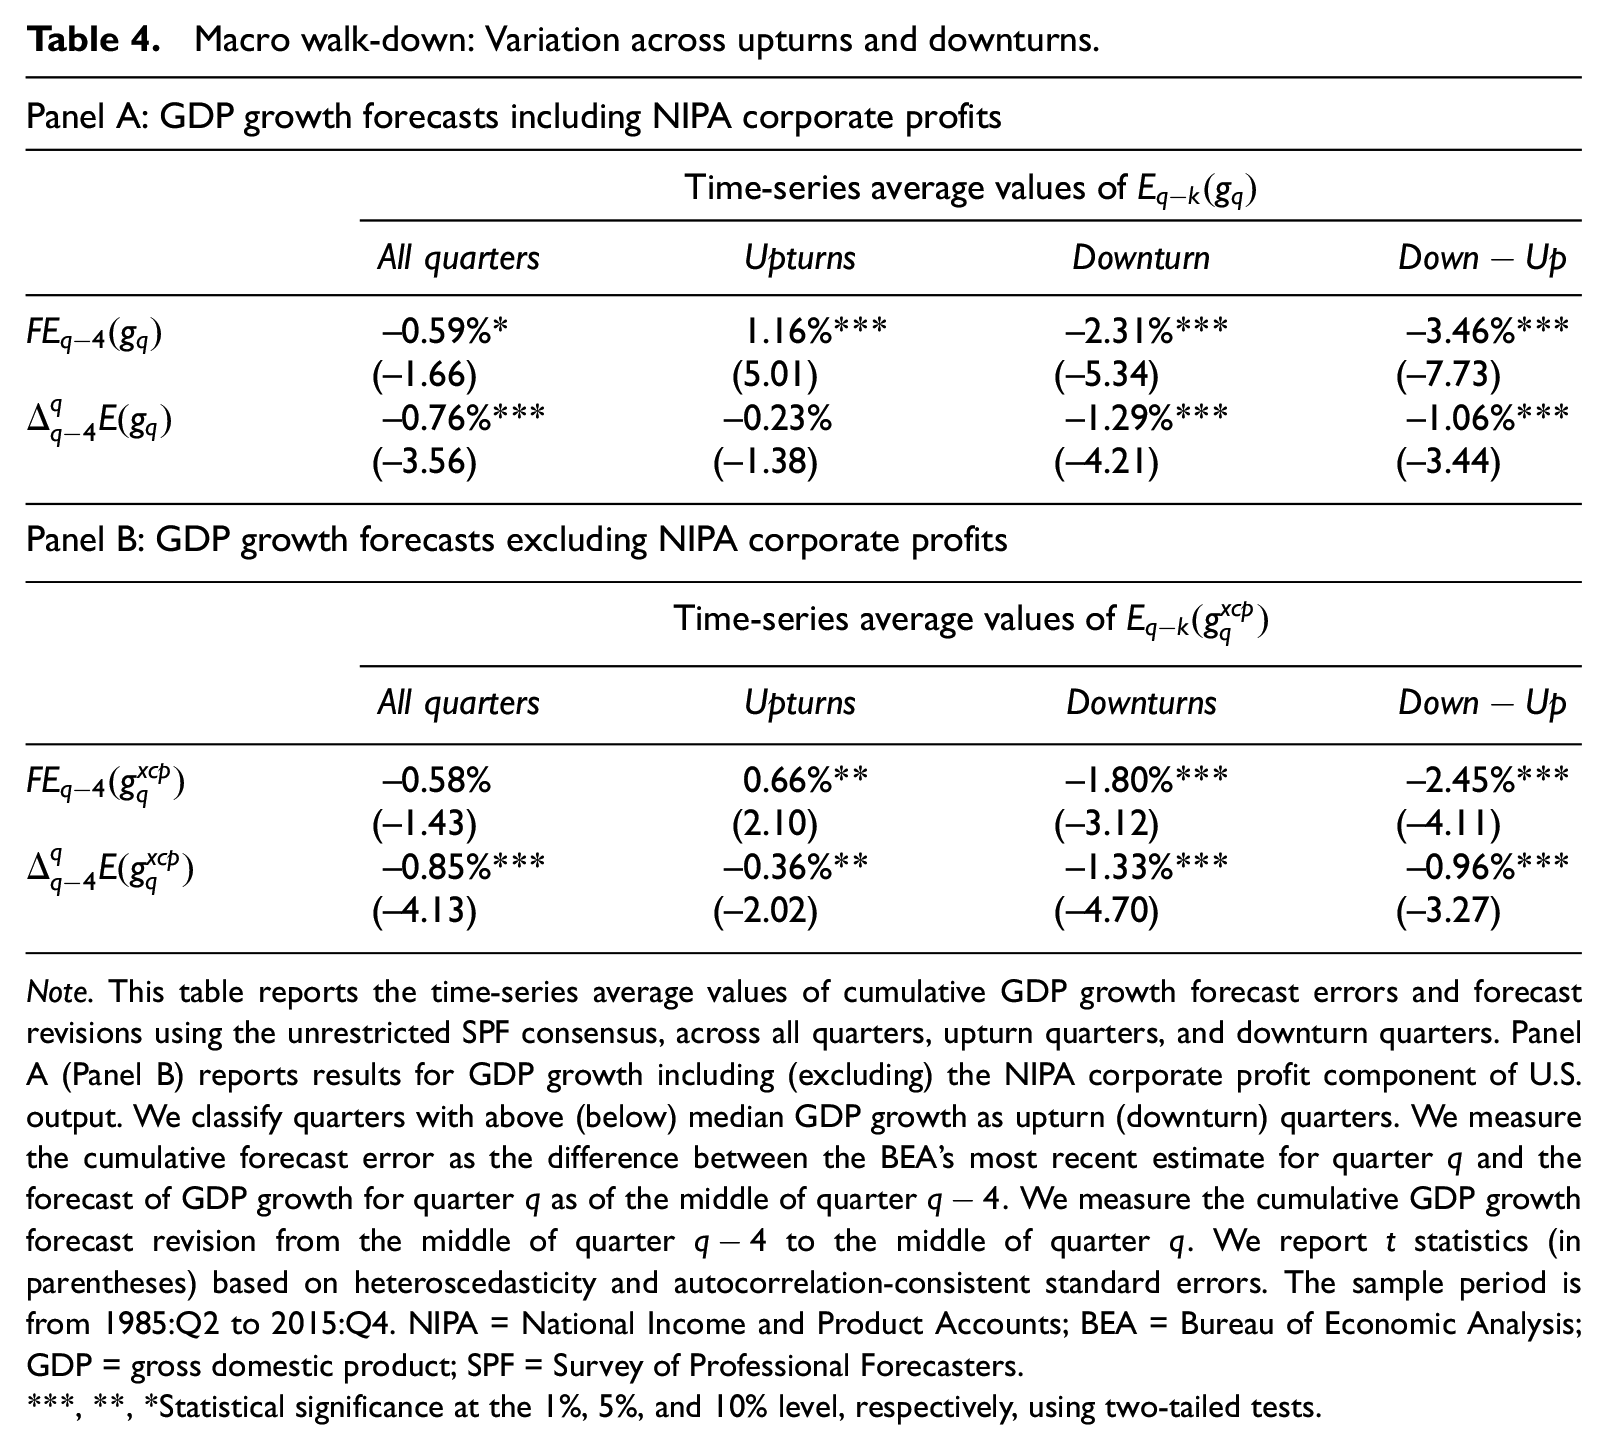
Note. This table reports the time-series average values of cumulative GDP growth forecast errors and forecast revisions using the unrestricted SPF consensus, across all quarters, upturn quarters, and downturn quarters. Panel A (Panel B) reports results for GDP growth including (excluding) the NIPA corporate profit component of U.S. output. We classify quarters with above (below) median GDP growth as upturn (downturn) quarters. We measure the cumulative forecast error as the difference between the BEA’s most recent estimate for quarter q and the forecast of GDP growth for quarter q as of the middle of quarter
, **, *Statistical significance at the 1%, 5%, and 10% level, respectively, using two-tailed tests.
The key implication is that at longer horizons, professional macro forecasters have more difficulty anticipating economic downturns relative to upturns. As the horizon shortens and there is more information about the actual state of the economy, macro forecasters gradually update their growth projections. We, therefore, expect to observe a steep walk-down in downturns. Consistent with this prediction, Table 4, Panel A, shows that the average GDP growth forecast revision is −0.23% for upturns and −1.29% for downturns. The disproportionately large negative forecast revisions during hard-to-predict downturns dominate in short time-series, which explains the overall evidence of a macro walk-down at long forecast horizons. The time-series plots in Figure 2 provide consistent evidence that GDP growth forecast revisions are especially negative during recessionary quarters, which we identify based on the National Bureau of Economic Research (NBER) business cycle reference dates.
Overall, we conclude that asymmetrically high forecasting difficulty in bad times relative to good times results in disproportionately large errors of overprediction in downturns relative to errors of underprediction in upturns. The disproportionately large negative forecast revisions during hard-to-predict downturns dominate in short time-series, which explains the overall evidence of a macro walk-down at long forecast horizons.
Macro Walk-Down and the Properties of Sell-Side Analysts’ Forecasts
Next, we explore the broader implications of our results for capital markets research on the properties of sell-side analysts’ forecasts of accounting earnings. Our starting point is that EPS forecasts have a systematic component that is related to aggregate fluctuations. It follows that countercyclical variation in forecasting difficulty, due to asymmetry in the steepness of economic downturns relative to upturns, can create similar difficulties for sell-side analysts with respect to projecting the systematic component of EPS. Given that the systematic component of EPS varies across firms depending on their cyclical exposure, we predict that the implications will vary across sectors.
Construction of Market-Level EPS Forecasts and Actuals
We obtain sell-side analysts’ forecasts of firm-level EPS from the IBES detail history file and measure expected earnings for firm i in quarter q as the product of the consensus EPS forecast and the number of shares outstanding from the Institutional Brokers’ Estimate System (IBES) summary file:

We measure the bottom-up forecast of aggregate EPS for quarter q as the cross-sectional sum of firm-level earnings forecasts for quarter q as of quarter

We measure the cumulative percentage revision in the bottom-up consensus forecast of aggregate EPS for quarter q as follows:

We note that a forecast walk-down is represented by negative values in the expression above. We also note that while we express the forecast revision as a percentage of the initial forecast, we find similar results when we express the forecast revision as a percentage of either the final forecast or the realized value of EPS. To ensure consistency in the measurement of forecast errors, we measure firm-level realized earnings as the product of realized EPS from the IBES summary file and the most recent number of shares outstanding available from the IBES summary file prior to the quarterly earnings announcement:

We measure the realized aggregate EPS for quarter q as the cross-sectional sum of the individual firm realized earnings for quarter q divided by the cross-sectional sum of the shares outstanding:

Finally, we measure the aggregate EPS forecast error as the percentage difference between realized aggregate EPS for quarter q and the bottom-up consensus forecast of aggregate EPS for quarter q as of quarter

To align the research design with the SPF timeline, we focus on firms with December fiscal year-end and quarterly earnings announcements within 45 days after each quarter-end date. The IBES detail history file provides four-quarter-ahead EPS forecasts starting from 1994:Q3. Our sample consists of 100,623 firm-quarter observations from 1994:Q3 to 2015:Q4. Figure 1 presents the timeline for 2015:Q4 as an illustrative example. Using individual firm earnings forecasts available from sell-side analysts, we measure the bottom-up consensus forecast of aggregate EPS for 2015:Q4 at different forecast horizons from the middle of 2014:Q4, which corresponds to
EPS Walk-Down at the Market Level
Our time-series analysis of aggregate EPS forecasts provides evidence of optimism at long horizons followed by pessimism at short horizons. Table 5, Panel A, shows that the bottom-up EPS forecast at the market level decreases from
EPS walk-down at the market level.

Note. This table provides evidence of a walk-down in bottom-up EPS forecasts at the market level. Panel A reports the time-series average values of the aggregate EPS forecast for quarter q as of quarter
, **, *Statistical significance at the 1%, 5%, and 10% level, respectively, using two-tailed tests.
Comovement of EPS Walk-Down With Macro Walk-Down
How is the market-level EPS walk-down related to the macro walk-down? Table 6, Panel A, reports results from a time-series regression of the cumulative revision in aggregate EPS forecasts on the cumulative revision in GDP growth forecasts. We report results for the unrestricted SPF consensus. We find similar results for the restricted SPF consensus and the Fed’s Greenbook projections. The regression results show that the market-level EPS walk-down and the macro walk-down share a common component. While consistent with prior evidence of a systematic component in the cross-section of accounting earnings data (e.g., Gonedes, 1973; Konchitchki and Patatoukas, 2014a, 2014b; Patatoukas, 2014, 2020), our evidence sheds light on the degree of overlap between the market-level EPS walk-down and the macro walk-down. In fact, the macro walk-down accounts for nearly half of the time-series variation in aggregate EPS forecast revisions, with an adjusted
EPS walk-down at the market level: Comovement with macro walk-down.
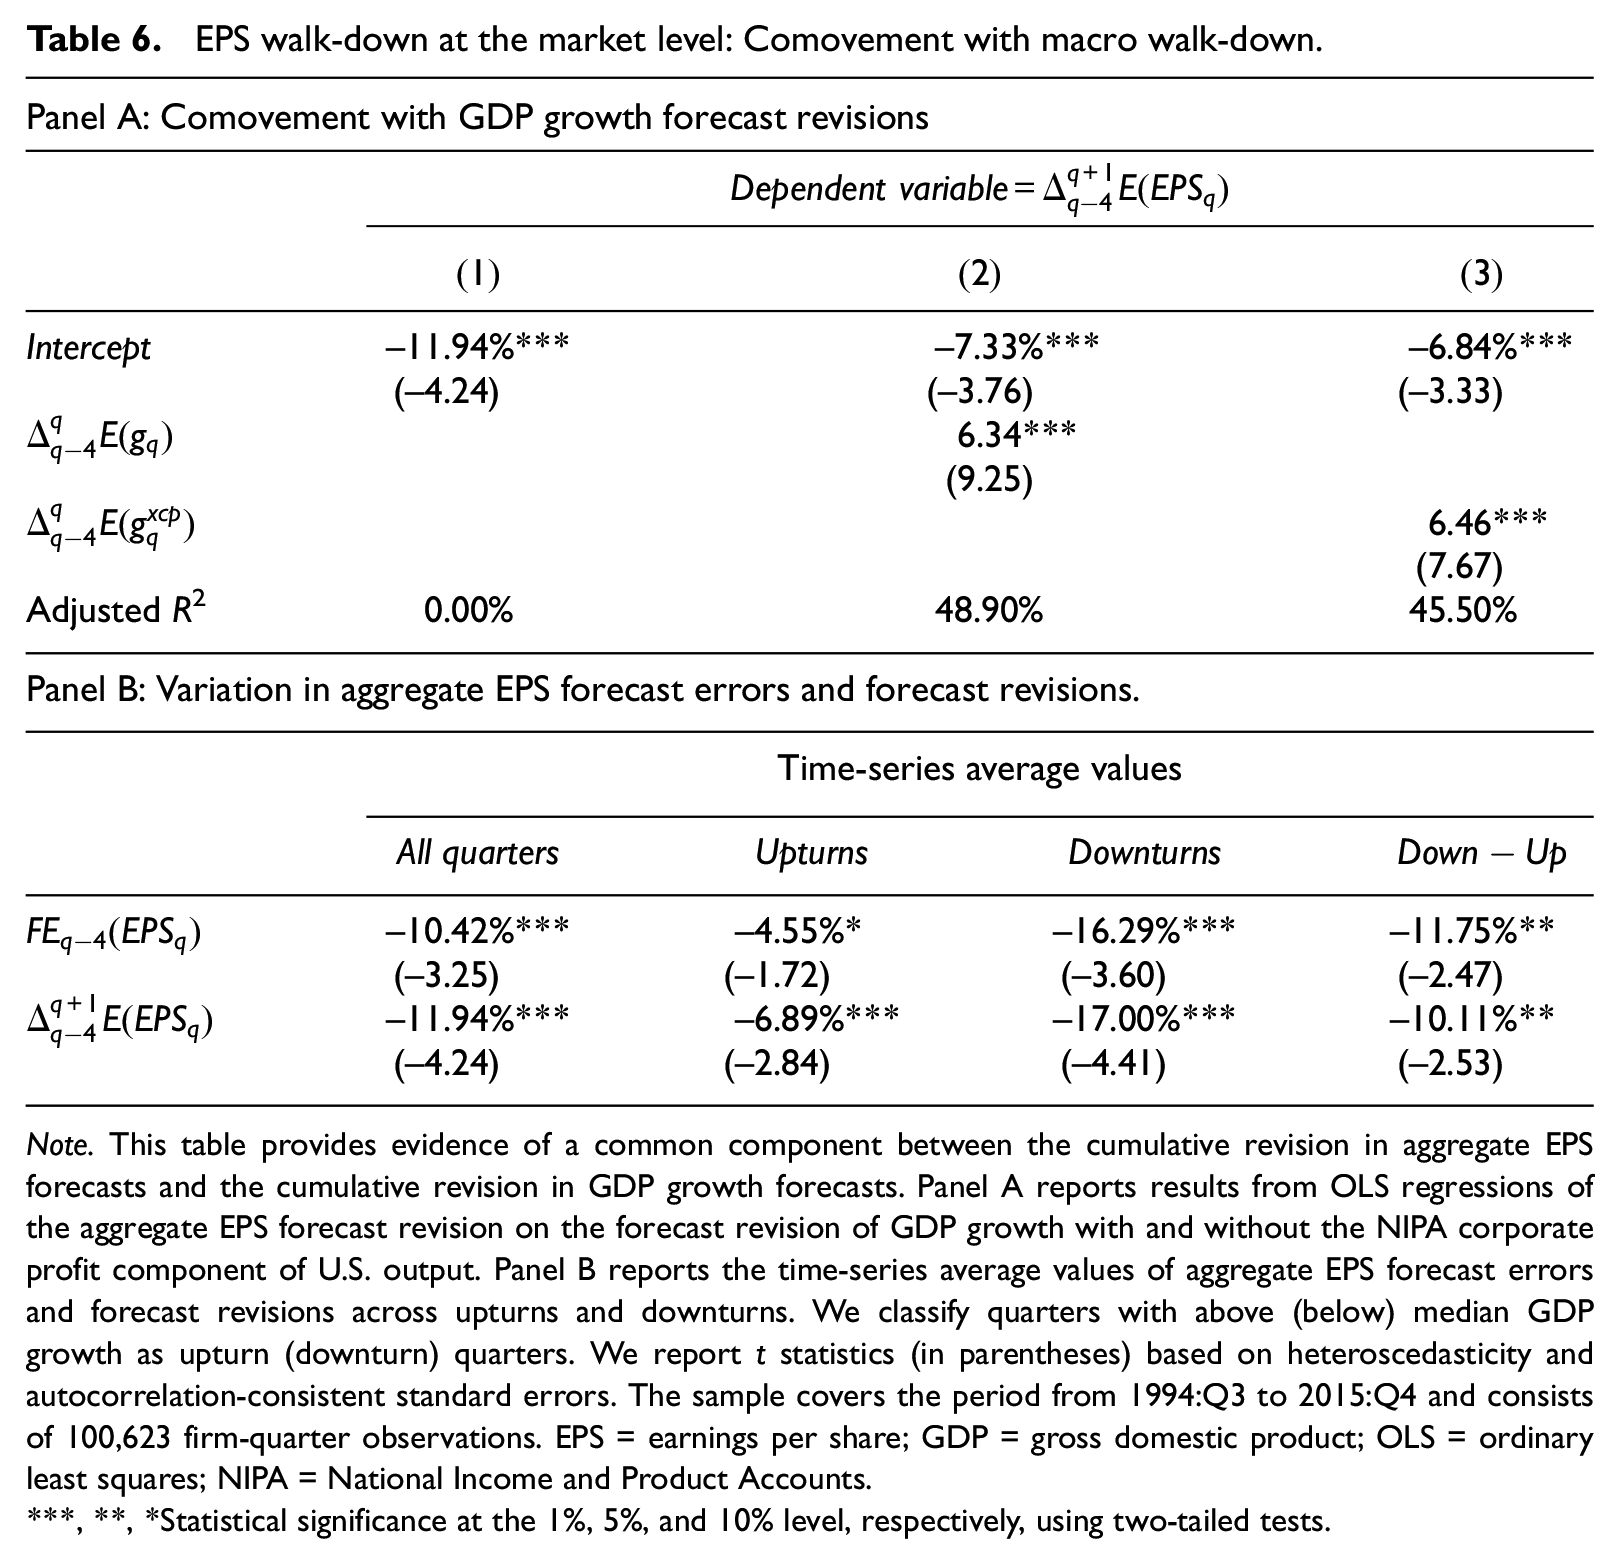
Note. This table provides evidence of a common component between the cumulative revision in aggregate EPS forecasts and the cumulative revision in GDP growth forecasts. Panel A reports results from OLS regressions of the aggregate EPS forecast revision on the forecast revision of GDP growth with and without the NIPA corporate profit component of U.S. output. Panel B reports the time-series average values of aggregate EPS forecast errors and forecast revisions across upturns and downturns. We classify quarters with above (below) median GDP growth as upturn (downturn) quarters. We report t statistics (in parentheses) based on heteroscedasticity and autocorrelation-consistent standard errors. The sample covers the period from 1994:Q3 to 2015:Q4 and consists of 100,623 firm-quarter observations. EPS = earnings per share; GDP = gross domestic product; OLS = ordinary least squares; NIPA = National Income and Product Accounts.
, **, *Statistical significance at the 1%, 5%, and 10% level, respectively, using two-tailed tests.
A relevant question is whether the overlap between aggregate accounting earnings data and the NIPA corporate profit component of U.S. output mechanically explains comovement between the macro walk-down and the aggregate EPS walk-down. To address this question, we estimate the time-series regression of the cumulative revision in the bottom-up forecasts of aggregate EPS on the cumulative revision in GDP growth forecasts excluding the corporate profit component of U.S. output. The regression results in Table 6, Panel A, show that the walk-down in GDP growth excluding NIPA corporate profits accounts for 45.5% of the time-series variation in the aggregate EPS walk-down. Therefore, the forecast revisions in NIPA corporate profits have only limited impact on explanatory power.
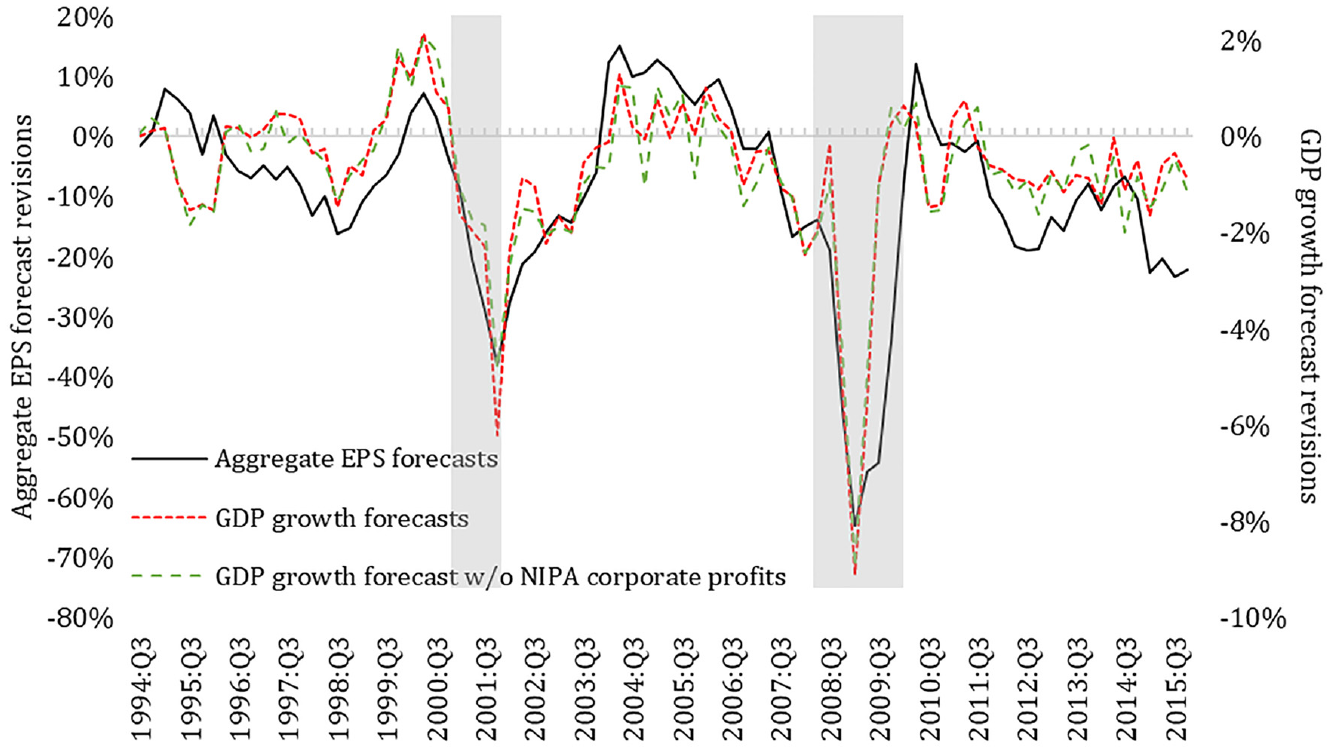
The time-series plot in Figure 3 illustrates that, regardless of whether we include or exclude corporate profits from U.S. output, the aggregate EPS walk-down and the macro walk-down comove. This is especially true in bad times, as indicated by the large negative forecast revisions during recessionary quarters. Table 6, Panel B, shows that the aggregate EPS walk-down is approximately
EPS walk-down at the market level.
Variation Across Defensive and Cyclical Sectors
The evidence thus far shows that the walk-down in EPS forecasts extends to the market level and shares a common component with the walk-down in GDP growth forecasts. Next, we show that this common component varies across firms operating in different sectors. To classify firms in sectors, we use the Global Industry Classification Standard (GICS) taxonomy. The GICS taxonomy consists of defensive sectors (consumer staples, health care, and utilities) and cyclical sectors (consumer discretionary, financials, materials, real estate, energy, industrials, information technology, and telecommunication services).
Table 7, Panel A, reports results from time-series regressions of EPS forecast revisions on GDP growth forecast revisions, separately for firms in defensive and cyclical sectors. The key finding is that the link between the EPS walk-down and the macro walk-down is particularly strong for firms in cyclical sectors relative to firms in defensive sectors. Specifically, GDP growth forecast revisions account for 14.4% and 47.4% of the time-series variation in the EPS forecast revisions of defensive and cyclical sectors, respectively.
Variation across defensive and cyclical sectors.
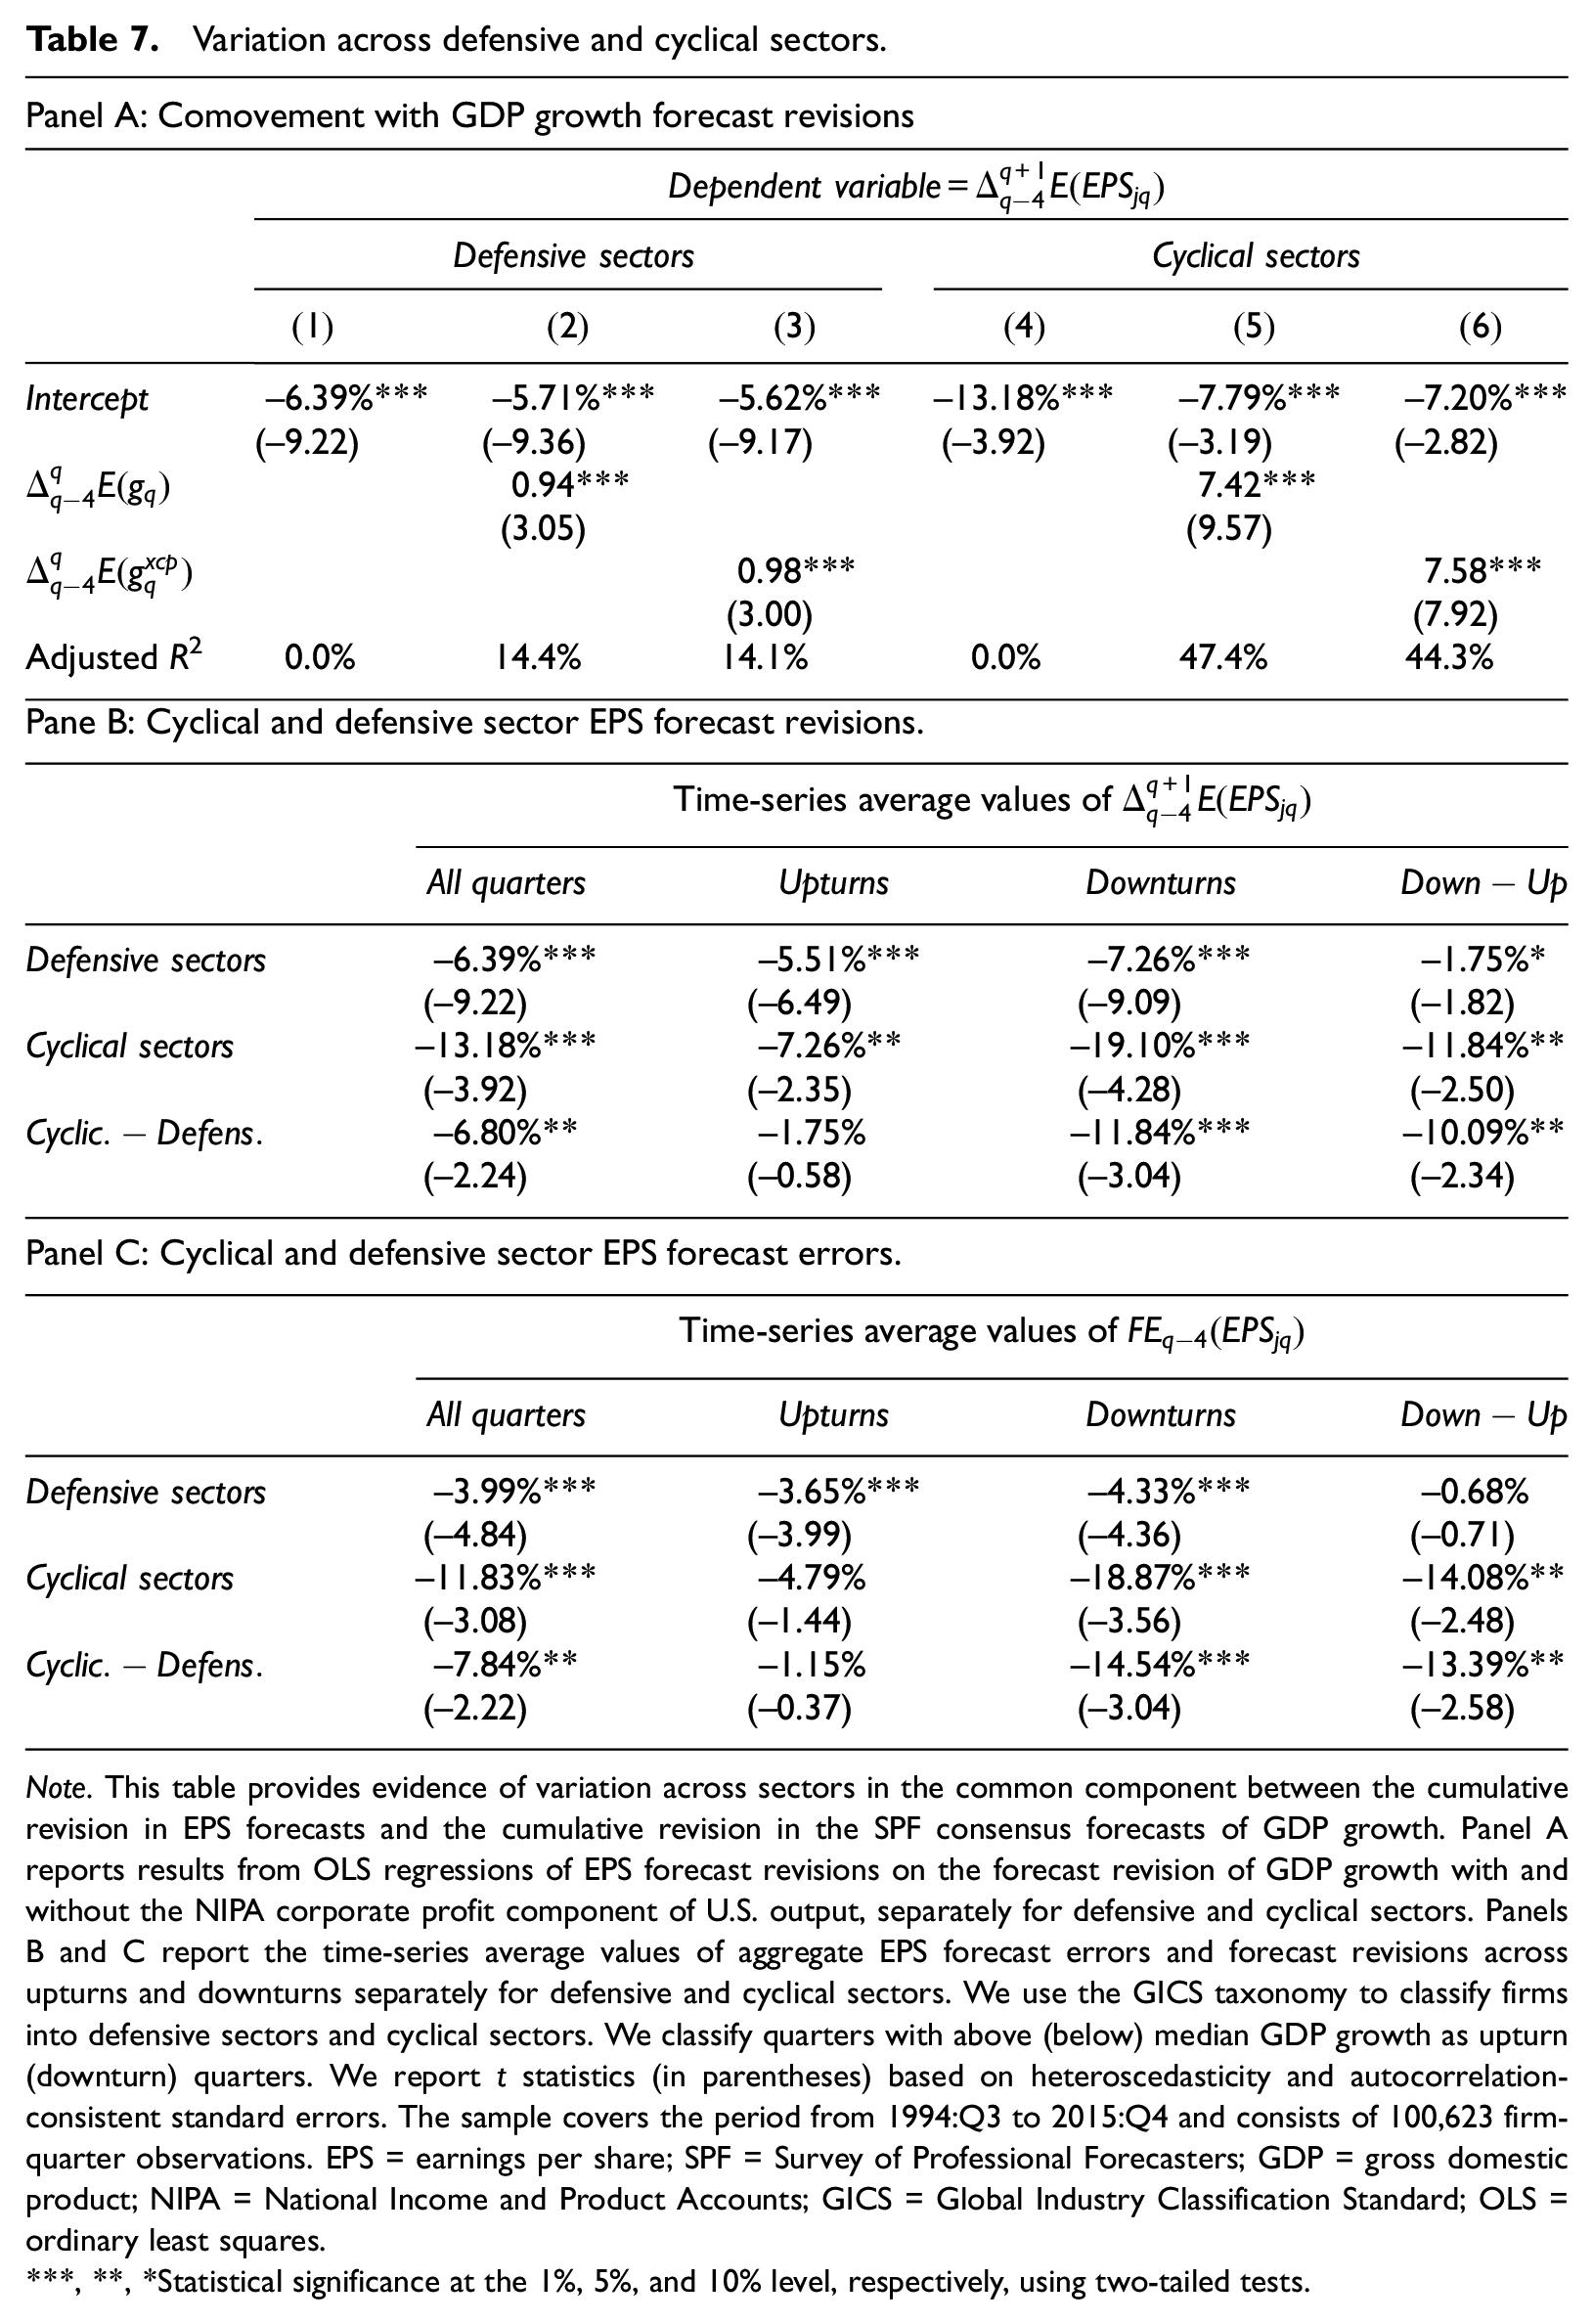
Note. This table provides evidence of variation across sectors in the common component between the cumulative revision in EPS forecasts and the cumulative revision in the SPF consensus forecasts of GDP growth. Panel A reports results from OLS regressions of EPS forecast revisions on the forecast revision of GDP growth with and without the NIPA corporate profit component of U.S. output, separately for defensive and cyclical sectors. Panels B and C report the time-series average values of aggregate EPS forecast errors and forecast revisions across upturns and downturns separately for defensive and cyclical sectors. We use the GICS taxonomy to classify firms into defensive sectors and cyclical sectors. We classify quarters with above (below) median GDP growth as upturn (downturn) quarters. We report t statistics (in parentheses) based on heteroscedasticity and autocorrelation-consistent standard errors. The sample covers the period from 1994:Q3 to 2015:Q4 and consists of 100,623 firm-quarter observations. EPS = earnings per share; SPF = Survey of Professional Forecasters; GDP = gross domestic product; NIPA = National Income and Product Accounts; GICS = Global Industry Classification Standard; OLS = ordinary least squares.
, **, *Statistical significance at the 1%, 5%, and 10% level, respectively, using two-tailed tests.
Table 7, Panel B, provides evidence of variation in the EPS walk-down across defensive and cyclical sectors during downturns and upturns. Comparing across sectors, the EPS walk-down is more than 2 times as large for cyclical sectors (13.18%) relative to defensive sectors (6.39%). Focusing on cyclical sectors, we document that the EPS walk-down is significantly more pronounced during downturns (19.10%) relative to upturns (7.26%). Turning to defensive sectors, we find only limited evidence of variation in the EPS walk-down across downturns (7.26%) and upturns (5.51%). It follows that the overall evidence of variation in the EPS walk-down across defensive and cyclical sectors is concentrated in downturns.
Table 7, Panel C, provides consistent evidence of variation in EPS forecast errors across sectors and over time. While the EPS forecast errors are nearly 3 times as negative for cyclical sectors (11.83%) relative to defensive sectors (3.99%), this difference is concentrated in downturns. Focusing on cyclical sectors, we find significantly more negative EPS forecast errors in downturns (18.87%) relative to upturns (4.79%), which is consistent with asymmetric forecasting difficulty across good and bad times. Turning to defensive sectors, we find only limited evidence of variation in EPS forecast errors across upturns (3.65%) and downturns (4.33%).
Cross-Sectional Frequency of “Walk-Down” and “Switching” Firms
Table 8 sheds light on variation across sectors using alternative specifications. First, for each quarterly cross-section, we measure the frequency of individual firms with negative cumulative revisions from the initial to the final EPS forecast for quarter q (
Cross-sectional frequency of “walk-down” and “switching” firms.

Note. This table provides additional evidence of variation across sectors in the macro component of two alternative cross-sectional frequency measures of EPS forecasts walk-downs. First, we measure the cross-sectional frequency of “walk-down” firms, that is, firms with negative cumulative revisions from the initial to the final EPS forecast for quarter q
, **, *Statistical significance at the 1%, 5%, and 10% level, respectively, using two-tailed tests.
The regression results in Table 8, Panels A and B, provide consistent evidence that the macro walk-down explains more of the time-series variation in the frequency of walk-down and switching firms in cyclical sectors relative to defensive sectors. Focusing on cyclical sectors, GDP growth forecast revisions explain 43.4% and 29.10% of the time-series variation in the frequency of walk-down and switching firms, respectively. Turning to defensive sectors, GDP growth forecast revisions explain 5.6% and 5.4% of the time-series variation in the frequency of walk-down and switching firms, respectively. Taken together, the evidence identifies heterogeneity in the cyclical exposure of individual firms as a source of cross-sectional and time-series variation in the properties of sell-side analysts’ earnings forecasts. The results highlight that research on the properties of accounting earnings forecasts should consider strategic incentives for bias interacted with information about the state of the macroeconomy and heterogeneity in the cyclical exposure of individual firms to aggregate fluctuations.
Variation in EPS Walk-Down Across Share Price Partitions
To further illustrate the implications for research on the properties of earnings forecasts, we explore firm-level variation in the EPS walk-down with share price—one of the most salient firm characteristics. Cheong and Thomas (2017), henceforth CT, explore variation with share price and find that the EPS walk-down is more acute for high-price firms relative to low-price firms.
Figure 4, Panel A, replicates CT’s finding in our sample of 100,623 firm-quarter observations across quartile portfolios formed based on share prices at the beginning of the forecast horizon. Moving from the initial to the last quarterly EPS forecast, the walk-down is
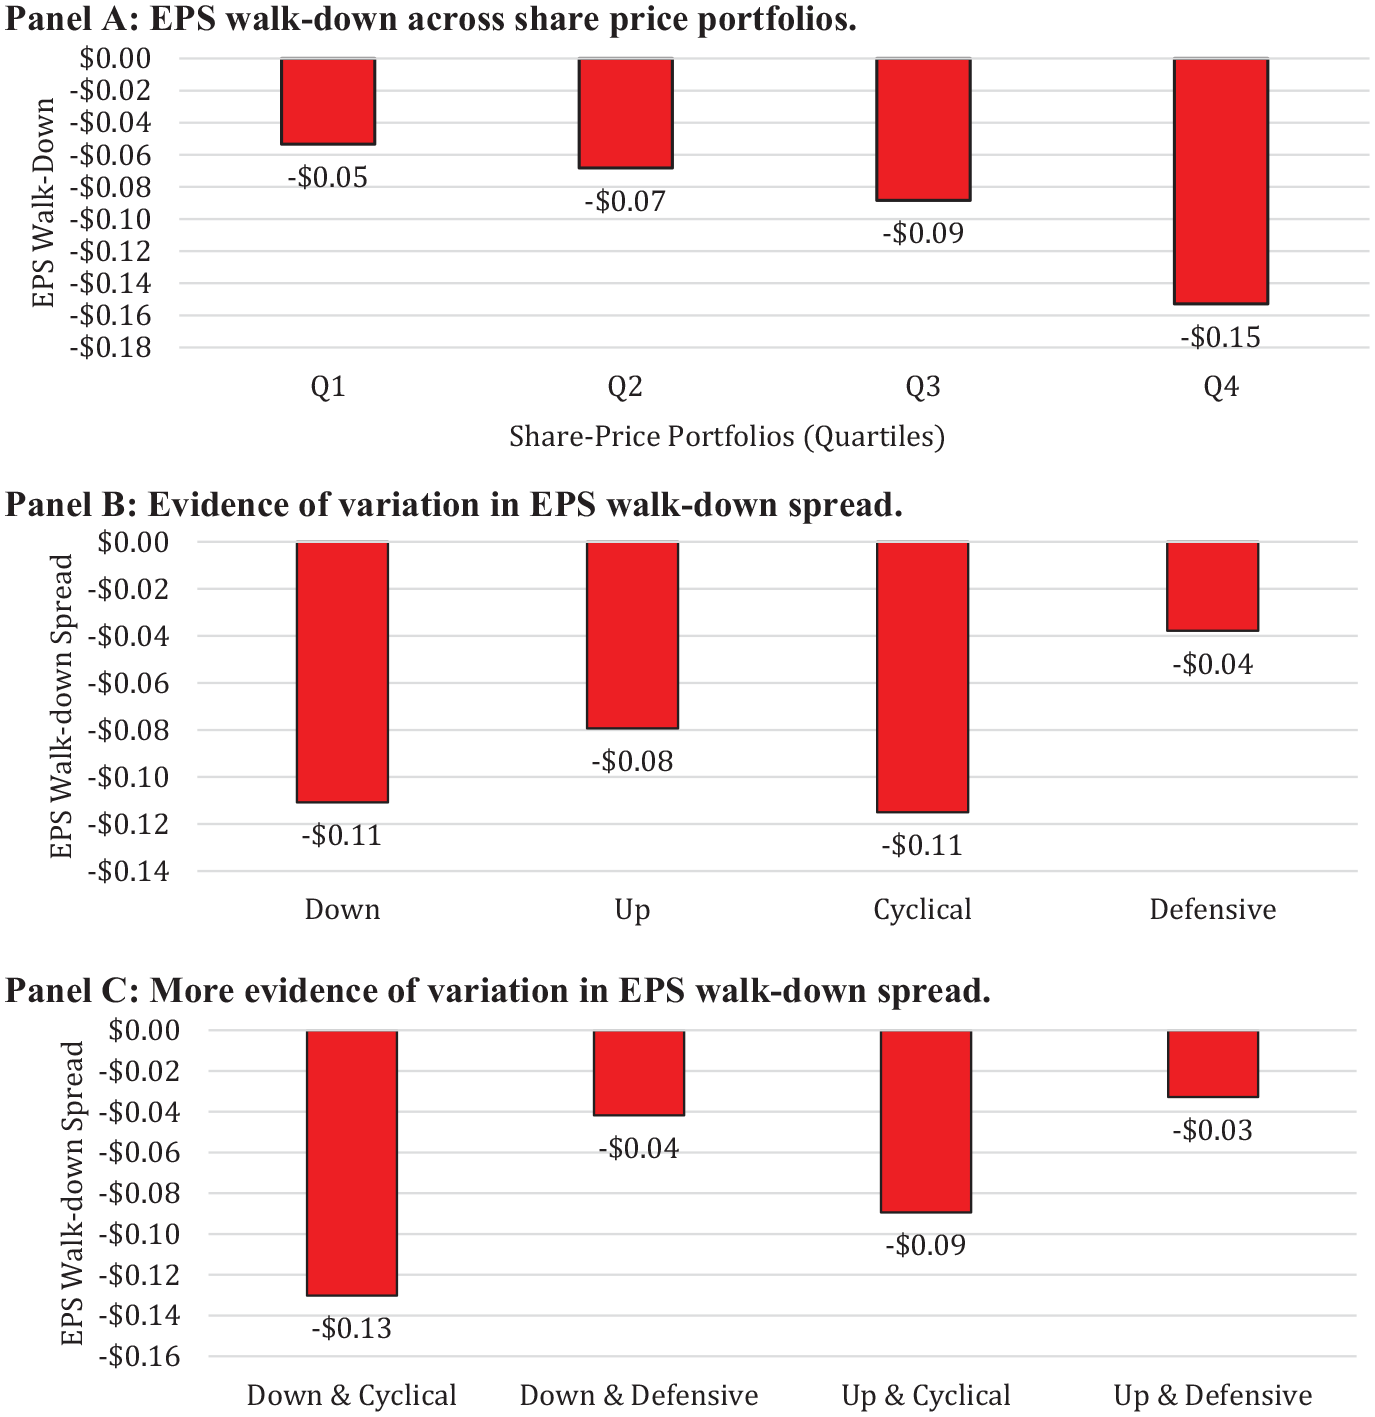
Variation in EPS walk-down across share price partitions. Panel A: EPS walk-down across share price portfolios. Panel B: Evidence of variation in EPS walk-down spread. Panel C: More evidence of variation in EPS walk-down spread.
Figure 4, Panel B, shows that the EPS walk-down spread is more acute for firms in cyclical sectors
Conclusion
Overall, our article sheds light on the origins of forecast walk-downs in a setting where forecasters have strong incentives to strive for accuracy. Different from sell-side analysts, who have incentives to curry favor with management when forecasting accounting earnings, we observe that professional macro forecasters affiliated with the Federal Reserve face strong incentives to generate unbiased projections of the U.S. economy and are less susceptible to outside pressure to curry favors. Remarkably, however, we document a walk-down in their GDP growth forecasts.
Whereas prior research has devoted attention to the role of strategic incentives for bias as a sufficient condition for forecast walk-downs, we find evidence that countercyclical variation in forecasting difficulty, due to asymmetry in the steepness of economic downturns relative to upturns, is relevant in explaining the walk-down in macroeconomic forecasts. Without rejecting the expectations game between managers and sell-side analysts, our article offers a more auspicious characterization of forecast walk-downs whereby such patterns can surface even without conditioning on strategic incentives for bias. A limitation of our study is that we cannot completely rule out the role of strategic incentives for bias in the setting of professional macro forecasters. While it is unlikely that professional macro forecasters face strong incentives to please corporate managers, they may have other incentives that contribute to a forecasting behavior that is similar to that of sell-side analysts. In addition, although we perform a number of analyses to address the possibility of self-selection with respect to forecast timing among professional macro forecasters, we cannot completely rule out the role of self-selection in our setting. In balance, we acknowledge that the results can be due to forecasting difficulty, cognitive biases, other unidentified strategic incentives for bias, or some combination of these alternative explanations. Notwithstanding these limitations, our article highlights the need for more research that analyzes the relative importance of alternative explanations for forecast walk-downs.
Moving forward, research on the properties of accounting earnings forecasts should consider the strategic interplay between managers and sell-side analysts interacted with information about the state of the macroeconomy and the heterogeneity in the cyclical exposure of individual firms to aggregate fluctuations. This “macro-to-micro” approach has the potential to provide new insights into the granular origins of economic phenomena (e.g., Gabaix, 2011).
Footnotes
Acknowledgements
We thank Bok Baik (discussant), Joanne Choi, Clayton Critcher, Omri Even-Tov, Jacquelyn Gillette, Peter Joos, Sarah McCoy, Don Moore, Augusto Nieto-Barthaburu, Jake Thomas, Franco Wong, Frank Zhang, and seminar participants at Berkeley Haas, Bentley University, and the 2019 Hawaii Accounting Research Conference for helpful discussions.
Declaration of Conflicting Interests
The author(s) declared no potential conflicts of interest with respect to the research, authorship, and/or publication of this article.
Funding
The author(s) received no financial support for the research, authorship, and/or publication of this article.