
Abstract
We examine the association between aggressive tax planning and labor investment efficiency among U.S. firms. Labor is an important input to production that is material to many firms, and prior research suggests that inefficient labor investments can negatively affect future profitability and growth. We provide evidence that firms engaging in aggressive tax planning are associated with deviations from expected labor investments, which is indicative of labor investment inefficiency. We find that our results are concentrated in labor underinvestment, consistent with risks and uncertainties from aggressive tax planning making firms more cautious when investing. Our findings are strongest among firms with greater tax risk, higher labor costs, and weaker corporate governance. Our study contributes to the literature examining tax planning consequences by providing evidence that a tradeoff exists between aggressive tax planning and investments in labor. Therefore, our results suggest that managers should carefully consider the cash flow benefits of tax planning in conjunction with the potential effects of lower labor investments to ensure that the overall long-term effect of the tax strategy is value-increasing.
Introduction
Tax planning allows firms to generate cash flows by reducing the portion of earnings paid to the taxing authorities. Scrutiny from corporate watchdogs has recently highlighted that many firms pay extremely low or no corporate income taxes due in part to their tax planning activities (Institute on Taxation and Economic Policy, 2019). Recent literature suggests that the potential for future cash outlays due to firms having to pay back some of the benefits received from tax planning activities leads firms to increase their precautionary cash holdings (Guenther et al., 2020; Hanlon et al., 2017), which may lead to decreased investments (Jacob et al., 2021). However, another line of literature documents that liquidity increases, such as those that typically ensue from tax planning, lead firms to increase investments (Blanchard et al., 1994; Harford, 1999; Richardson, 2006). Thus, the relation between tax planning and investment decisions, ex-ante, is unclear.
We examine the relation between aggressive tax planning and deviations from expected investments in labor. We specifically focus on labor as these expenditures are material for a broad spectrum of firms. For example, for the manufacturing sector in 2016, payroll and employee benefits totaled $840 billion compared to $244 billion in capital expenditures (Census Bureau, 2017). Labor is one of the most important factors of production (Jung et al., 2014). Furthermore, relative to examining all investments, investment in labor is a cleaner setting for us to examine whether and to what extent aggressive tax planning is associated with investments. Specifically, capital expenditures, R&D, and acquisitions yield more substantial tax benefits in their own right. Consequently, these types of investments are more likely to be mechanically related to common proxies for tax planning, such as effective tax rates (ETRs). 1 Meanwhile, for most employees, labor expenditures less commonly generate additional tax benefits other than the ordinary business deductions for these expenditures, which do not affect ETRs. 2
Prior work by Shevlin et al. (2019) finds that tax planning is positively associated with employment levels in countries with high corruption. Similarly, concurrent work by De Simone et al. (2022) finds that income shifting is positively associated with investments in firms’ non-U.S. subsidiaries. These papers suggest that tax planning may be associated with empire building among non-U.S. firms. In contrast with these studies, we study labor investment efficiency (i.e., the extent of deviations from expected levels of labor given the firm’s fundamentals) at the parent level among U.S. firms. Our research follows Leuz and Wysocki (2016), who warn that researchers should cautiously interpret findings of studies that examine investment levels, as opposed to investment efficiency, because a change in levels does not necessarily reflect a change in investment decisions. Accordingly, we examine whether aggressive tax planning is associated with labor investment efficiency. 3
Labor investment efficiency reflects the extent to which a firm’s employment corresponds with its fundamentals. A firm may invest inefficiently through two channels. First, the firm can overinvest in labor if they over hire or retain employees associated with underperforming projects. Second, the firm can underinvest if they fail to retain key employees associated with profitable projects or do not pace employment decisions with firm growth (Jung et al., 2014). Aggressive tax planning can affect each of these channels. While the traditional notion of tax avoidance portrays tax planning as a simple shifting of wealth from the government to corporate shareholders, more recent literature nests aggressive tax planning within an agency framework (e.g., Balakrishnan et al., 2019; C. W. Chen et al., 2018; Desai & Dharmapala, 2006), and suggests that aggressive tax planning can create opacity that can provide opportunities for managers to make suboptimal decisions. Should information uncertainty mask the firm’s true underlying economics, managers may deviate from optimal investment levels (Kumar & Langberg, 2009; Roychowdhury et al., 2019; Shroff, 2017). In terms of overinvestment, aggressive tax planning generates cash flows (Mills et al., 1998). These additional free cash flows, along with the opacity created by aggressive tax planning, can lead to empire building and, thus, overinvestment (Harford, 1999; Jensen, 1986; Richardson, 2006). In terms of underinvestment, the cash flows from aggressive tax planning come with the uncertainty that firms may have to pay back some of these funds to the taxing authority (Finley, 2019). The literature documents that firms respond to these threats by holding additional cash (Guenther et al., 2020; Hanlon et al., 2017; Jacob et al., 2021), which can lead to adverse selection and, thus, underinvestment. Moreover, even outside of agency conflicts, the precautionary holding of tax-related cash flows may directly lead managers to underinvest in labor relative to the firm’s fundamentals. Importantly, Jung et al. (2014) provides evidence that inefficient labor investments, including underhiring, are associated with lower future profitability. We test our research question using a sample of U.S. firms from 1996 to 2018. Following Pinnuck and Lillis (2007) and Jung et al. (2014), we measure labor investment efficiency as the absolute value of the difference between a firm’s net hiring and its expected level. We base the expected labor investment on a model of a firms’ change in hiring policies as a function of sales growth, profitability, liquidity, and leverage. This variable, therefore, captures changes in a firm’s hiring policies that the firm’s underlying fundamentals cannot explain. We proxy for aggressive tax planning following a plethora of prior literature suggesting that long-run effective tax rates (ETRs) decrease as tax aggressiveness level increases (e.g., Donohoe & Knechel, 2014; Dyreng et al., 2019, among many others). We designate firms as “tax avoiders” if the firm-year observation has a long-run cash ETR in the sample distribution’s bottom tercile (Dyreng et al., 2019). We specifically focus on the cash ETR because we are interested in the effects of the cash flows from aggressive tax planning activities. We include industry and year fixed effects in all regressions and control for financial constraints, financial reporting aggressiveness, and several other important factors that are known to affect tax planning or hiring investments.
We find evidence consistent with our expectations that aggressive tax planning is associated with inefficient labor investment. We split our analysis into overinvestment (“over net hiring”) and underinvestment (“under net hiring”), and find that our results are concentrated among the underinvestment decisions. In terms of economic significance, our results suggest that “tax avoiders” experience 1% less hiring than expected based on the firm’s fundamentals, which represents a 10% increase in underhiring relative to the sample mean of underhiring. These results are consistent with tax uncertainty motivating firms to hold cash flows from aggressive tax planning rather than spending these funds, resulting in inefficient investment in labor.
To help triangulate our findings, we investigate three cross-sectional tests: (a) tax rate volatility, (b) skilled labor, and (c) multinational status. Regarding tax rate volatility, we expect that firms that face greater tax uncertainty will retain their tax benefits rather than investing them and will be associated with even greater deviations from expected investments (Hanlon et al., 2017). For skilled labor, we posit that the effects of tax planning on labor investment efficiency are concentrated among firms that operate in industries with highly skilled labor due to the higher labor costs (Ghaly et al., 2017). Finally, for multinational status, we expect that the effects may be stronger among domestic-only firms since these firms cannot access overseas cash holdings, a resource available to their multinational counterparts (Dyreng & Markle, 2016). We find evidence consistent with our expectations for each of these cross-sectional tests. We also investigate the effect of governance on our inferences. We find that the positive association between aggressive tax planning and underhiring is concentrated in firms subject to weaker governance as measured by lower institutional ownership and lower analyst following.
We perform a battery of robustness tests. We find that our primary results are robust to including firm fixed effects. We also find that our results are robust to using unrecognized tax benefit (UTB) increases as an alternative measure of aggressive tax planning, setting the cutoff for a tax avoider at a cash ETR below 19% following Dyreng et al. (2019) and excluding the financial crisis years.
Our findings contribute to the literature examining the real effects of tax planning. While there is extensive literature on tax planning, Wilde and Wilson (2018) highlight an asymmetry between the number of studies that examine the determinants of tax planning versus the consequences of tax planning. As tax planning generates cash flows, our study provides unique evidence that an unintended consequence of aggressive tax planning may be inefficient hiring, which can negatively affect future profitability and growth. Thus, we contribute to Wilde and Wilson’s (2018) call to understand the effects of tax planning activities on other stakeholders by providing evidence on corporate tax planning consequences related to hiring.
We also contribute to the literature examining the association between tax planning and investment decisions. We extend Guenther et al. (2020), who show that firms save the cash from tax planning rather than using it for investments, by showing that their failure to do so may result in inefficient hiring decisions. Our findings contribute to an emerging literature by Shevlin et al. (2019) and concurrent work by De Simone et al. (2022) in examining the role of tax planning in labor investment decisions. While our inferences differ from these two studies across many dimensions, our approach also differs by focusing on the effects of labor investment efficiency at the firm level using a broader measure of tax planning activities (rather than just income shifting). 4 In doing so, we provide evidence that factors like precautionary cash savings and the option value of passing on a positive net present value (NPV) decision may override their desires to empire build, a finding not found in prior and concurrent research.
We also contribute to the literature focusing on the effect of uncertainty on real options. Prior studies suggest that in the presence of uncertainty, firms are less likely to undertake costly investments or disinvestments (Bloom et al., 2007; Dixit & Pindyck, 1995; Ferracuti & Stubben, 2019; Trigeorgis & Reuer, 2017). Other research finds that uncertainty affects labor policies by leading firms to minimize costly adjustments due to hiring and firing (Banker et al., 2013; Dixit, 1997; Ghaly et al., 2017). We add to this line of research by studying aggressive tax planning as a source of uncertainty and by providing evidence that a tradeoff may exist between aggressive tax planning and the efficiency of labor investments.
Background and Hypothesis Development
Corporate Effects of Tax Planning
While traditional notions of tax planning suggest that corporate tax avoidance results in a simple transfer of wealth from the government to shareholders, more recent literature puts aggressive tax planning in an agency framework (e.g., Desai & Dharmapala, 2006). Consistent with this theory, studies find evidence that aggressive tax planning is associated with a higher cost of capital (e.g., Hasan et al., 2014; Lewellen et al., 2021), financial reporting opacity (Balakrishnan et al., 2019), and agency problems (e.g., Armstrong et al., 2015; Desai & Dharmapala, 2006). Thus, this stream of literature provides evidence that aggressive tax planning can create opacity, and it proposes that managers can use this opacity to further their own personal wealth at the cost of shareholder wealth, resulting in suboptimal firm decisions.
In addition, even outside of agency concerns, tax avoidance can also inadvertently create other nontax costs that could erode the tax benefits. For example, Donohoe and Knechel (2014) provide evidence that tax aggressiveness is associated with higher external audit fees. Another example is Chyz and Gaertner (2018), who document that managers of firms that avoid too much or not enough taxes face a higher likelihood of a turnover event. Firms structuring their global tax planning activities under the Scholes–Wolfson framework should consider all parties, all taxes, and all costs (Scholes et al., 2020). In doing so, as firms attempt to weigh the costs against the benefits of choosing tax planning strategies, they must also consider the indirect costs associated with those strategies that could erode or outweigh the tax savings. Despite a plethora of evidence that tax planning may inadvertently have negative impacts on the firm, prior literature has not provided evidence that these costs or potential negative outcomes deter tax planning on average. Importantly, these studies suggest that there may be a tradeoff between the cash flow benefits of aggressive tax planning and nontax costs that may ensue from these tax planning strategies.
These studies highlight the expansive effects of corporate tax planning on numerous aspects of the firm. Despite the work examining this topic, Wilde and Wilson (2018) emphasize the substantial asymmetry in the literature’s understanding of tax planning consequences relative to the determinants of tax planning. Their review of the literature also poses a question of “[in] what context is corporate tax planning good or bad—for managers, for investors, and for other stakeholders?” (Wilde & Wilson, 2018, p. 75). We respond to this call for literature by focusing on the effects of tax planning from the perspective of labor investment efficiency.
Investment Efficiency
Investment theory states that firms should choose all positive NPV projects and pass on all negative NPV projects (Modigliani & Miller, 1958). Following this logic, a firm can invest inefficiently through two channels. First, firms can overinvest by choosing investments that are not positive NPV. This action means that the firm chooses a project that does not increase firm value. Alternatively, firms can underinvest by passing on a positive NPV project, which means that the firm does not choose a project that would have increased firm value. Numerous papers study the determinants and effects of investment efficiency. For example, Fazzari et al. (1988) find that financing constraints limit efficient investment. Many studies document that financial reporting quality affects investment efficiency (Biddle et al., 2009; Biddle & Hilary, 2006; Jung et al., 2014; McNichols & Stubben, 2008).
One hurdle that the literature faces as it pertains to studying the effects of taxation on investment efficiency is that there are numerous ways where these two constructs intersect. For example, investments in capital expenditures yield direct tax benefits through accelerated depreciation. 5 Firms also receive tax benefits for investment-related activities like R&D expenditures (research and experimentation [R&E] tax credits) and acquisitions (acquiring tax benefits like net operating losses [NOLs]). These items affect effective tax rates, which are commonly used to proxy for aggressive tax planning. However, aggressive tax planning may be associated with opacity (Balakrishnan et al., 2019). Should this opacity diminish the firm’s information environment, then prior literature suggests that it will also affect investment efficiency (Biddle et al., 2009; Biddle & Hilary, 2006). Given that investments can lower effective tax rates and lower effective tax rates can affect investment decisions, it is inherently difficult to separate these two constructs.
Recent research examines the association between investments and tax planning. Shevlin et al. (2019) examine in a cross-country study the association between aggregate tax planning in a country and aggregate investment levels (i.e., employment growth and gross domestic product [GDP] growth). They find a positive association between aggregate tax planning and aggregate employment levels, but they find that this positive association is limited to high corruption countries. 6 Their study also does not provide insights into the association between tax planning and investment efficiency. 7
While investments in labor are not the same as capital expenditures, R&D, and acquisitions, many of the same principles hold. For example, employees are necessary expenditures for firms to manufacture goods, provide services, maintain infrastructure, and oversee operations. In addition, all employees have a specific cost and an expected benefit. From this perspective, each employee can be viewed in a similar light as an investment project in that a firm should hire an employee if the NPV of doing so is positive. Conversely, the firm should terminate an employee if the NPV of keeping the employee is negative. Jung et al. (2014) note that firms can overinvest in labor by hiring new employees or retaining old employees that cost more than the benefits they return, and firms can underinvest in labor by not hiring an employee when there is a clear need or by terminating employees when they are still providing value.
A unique benefit of studying labor investments rather than other types of investments when examining the interaction of investment and aggressive tax planning is that labor investments do not have the same corresponding tax benefits as capital investments. For example, if a firm increases labor investments by hiring 20 new factory workers at a salary of $50,000 per year per employee ($1,000,000 total labor investment per year), it will lower pre-tax income by that same amount and pay $210,000 (21 percent less) less in income taxes. Thus, under most circumstances, the firm’s effective tax rate (ETR) remains unchanged. This pattern contrasts with the firm increasing capital expenditures, R&D, or acquisitions by $1,000,000 because these increases reduce taxes more substantially due to accelerated tax deductions and credits, leading to a lower cash ETR. Thus, labor investments provide an opportunity for researchers to examine the relation between tax planning and investment efficiency.
Hypothesis Development
Inefficient labor investment comes in the form of overinvestment or underinvestment (Jung et al., 2014; Pinnuck & Lillis, 2007). Prior research suggests that tax planning activities may be associated with an increase in either or both of these avenues. In terms of overinvestment, tax planning activities increase cash flows (Mills et al., 1998). For example, if a firm invests in R&D activities, the firm may deduct those activities’ costs as it does most other operating expenses, or the firm can choose to apply some of those activities toward the R&E tax credit, which generates more expansive tax benefits but can also increase the uncertainty of tax benefits (Dyreng et al., 2019). Thus, two identical firms with the same R&D activities can have different levels of tax planning uncertainty because one might be more aggressive in their tax positions related to R&E expenses relative to the other.
Moreover, aggressive tax planning activities tend to be associated with a weaker information environment due to the incentives to hide these actions from the Internal Revenue Service (IRS) (Balakrishnan et al., 2019; C. W. Chen et al., 2018; Hope et al., 2013). Thus, firms with more aggressive tax planning activities tend to have higher cash flows and a more opaque information environment than firms with less aggressive tax planning activities. Prior literature provides evidence that these conditions can lead to empire building (Harford, 1999; Jensen, 1986; Richardson, 2006), where firms spend free cash flows on projects that grow the firm’s size without regard to whether those projects have a positive NPV. In applying prior literature to our findings, firms with more aggressive tax planning activities may be more likely to use the excess cash for tax planning to hire employees who are not expected to contribute positively to firm value—or, overinvestment.
In terms of underinvestment, firms may hold onto their tax benefits rather than spend the funds due to the future uncertainty associated with these funds. Tax benefits from tax planning activities received in the current year are rarely guaranteed. Firms must file their tax return and then potentially face an IRS audit up to 3 years afterward (Finley, 2019). During this uncertainty period, prior literature suggests that firms exercise caution and withhold investment (Guenther et al., 2020; Hanlon et al., 2017; Jacob et al., 2021). Withholding investment does not always constitute a value decreasing activity, especially if the firm passes on negative NPV projects. However, Jung et al. (2014) find that underinvestments in labor are associated with lower future profitability. Moreover, as noted above, aggressive tax planning activities tend to be associated with a poorer information environment (Balakrishnan et al., 2019; C. W. Chen et al., 2018; Hope et al., 2013). When firms have incentives to withhold investment, the higher information asymmetry can generate adverse selection concerns, leading firms to pass on positive NPV projects (Cheng et al., 2013; Darrough & Stoughton, 1986; Jensen & Meckling, 1976). Moreover, even outside of adverse selection and agency conflicts, precautionary holding of tax-related cash flows may directly lead managers to withhold investments. Applied to labor, we expect that firms with aggressive tax planning activities are less likely to hire employees who are expected to contribute positively to firm value—or underinvestment. 8
Prior research suggests several driving reasons why aggressive tax planning might be associated with inefficient investment. First, managers may consider the current income-boosting effects of tax planning more than the long-term nontax outcomes. Tax planning results in higher profitability in the current year, and compensating executives and tax departments based on contributions to the bottom line in the current year (e.g., Rego & Wilson, 2012; Robinson et al., 2010) may lead to a myopic focus on current profits versus future profits and earnings growth.
Second, firms may be decentralized, and without board or management oversight, the tax department may be making tax decisions without notifying other managers in the firm. So, while the tax department may be making good tax decisions, these decisions could have adverse effects on the rest of the company. Tax decisions may be handled by the tax department, and hiring decisions are made after the fact and by other managers. For example, Robinson et al. (2010) find that firms are more likely to use the tax department as a profit center when the firm is decentralized. In a decentralized firm, tax decisions may be made without considering the effects of tax-planning decisions on overall firm performance.
Third, managers making tax-planning decisions may not properly consider all the nontax costs of the tax strategy that would help determine if the strategy is overall value-increasing. Beasley et al. (2021) find that strong board-level oversight over the firm’s enterprise-wide risk management is associated with more efficient tax planning and lower tax uncertainty. Therefore, managers may not adequately consider the spillover effects of aggressive tax planning on other business units. While efficient tax planning should consider all taxes, all parties, and all costs (e.g., Scholes et al., 2020) to help the decision maker understand if the tax savings are positive NPV, managers may not consider all the nontax costs when undertaking tax planning strategies.
In sum, prior research suggests that aggressive tax planning could be associated with overinvestment or underinvestment in labor. Combining these two theories, we posit that firms with more aggressive tax planning activities are associated with inefficient investment. We state our hypothesis in the alternative form as follows:
While intuitive, our hypothesis is not without tension. Firms follow a pecking-order theory when addressing cash flow needs to fund investments, and this pecking order typically begins with internally generated cash flows (Myers & Majluf, 1984). Even though aggressive tax planning activities may carry onerous risks that lower their benefits, the literature suggests that financially constrained firms turn to tax planning to address their constraints (Edwards et al., 2016; Law & Mills, 2015) and recapture investment otherwise lost (Campbell et al., 2021). Thus, firms with high levels of tax planning may address cash flow shortfalls to retain their employment at the appropriate levels, leading to greater labor investment efficiency. Furthermore, prior literature provides evidence that high levels of tax planning indicate good board risk oversight (Beasley et al., 2021). These firms also typically have a better internal information environment (Gallemore & Labro, 2015). Tax planning may be associated with firms better understanding their labor investment needs along these lines, which would help offset empire building and adverse selection concerns (Shroff, 2017). 9 Finally, while some research finds that tax planning is associated with risk and precautionary cash holdings (e.g., Dyreng et al., 2019; Guenther et al., 2020; Hanlon et al., 2017), another group of studies shows that tax planning inferred from a firm’s financial statements may not be associated with increased risk or uncertainty (e.g., Gallemore et al., 2014; Goh et al., 2016; Guenther et al., 2017; Hasan et al., 2014). Thus, if tax planning is not associated with significant uncertainty, we may find no association between tax aggressiveness and investment inefficiency.
In addition, while we propose that tax planning is associated with inefficient investments and plausible reasons for this association could stem from managers’ myopic behavior or decentralization, it is also possible that the cash flow benefits of aggressive tax planning outweigh the nontax costs, including inefficient investment. Thus, firms may tradeoff tax planning and investment efficiency. For this reason, managers should carefully consider the nontax costs of aggressive tax planning, including those associated with inefficient hiring, in conjunction with their NPV assessments of each tax planning strategy to ensure that the net benefit of the strategy is value-increasing to the firm in the long run.
Data and Research Design
Data Sources
We collect the data about labor investment and tax planning from Compustat North America. Panel A of Table 1 presents our sample selection procedure. We begin the sample in 1996, starting from the whole population of 134,887 firm-years in the database over the years 1996 to 2018. Following most accounting studies, we remove regulated firm-years from utilities (Standard Industrial Classification [SIC] codes 4900-4999) and financial services (SIC codes 6000-6999) industries, as these firms are subject to different regulations. We then remove firm-years without data to estimate our investment model, resulting in a preliminary sample of 77,574 firm-years to estimate Equation 1.
Sample Selection and Hiring Estimation Model.
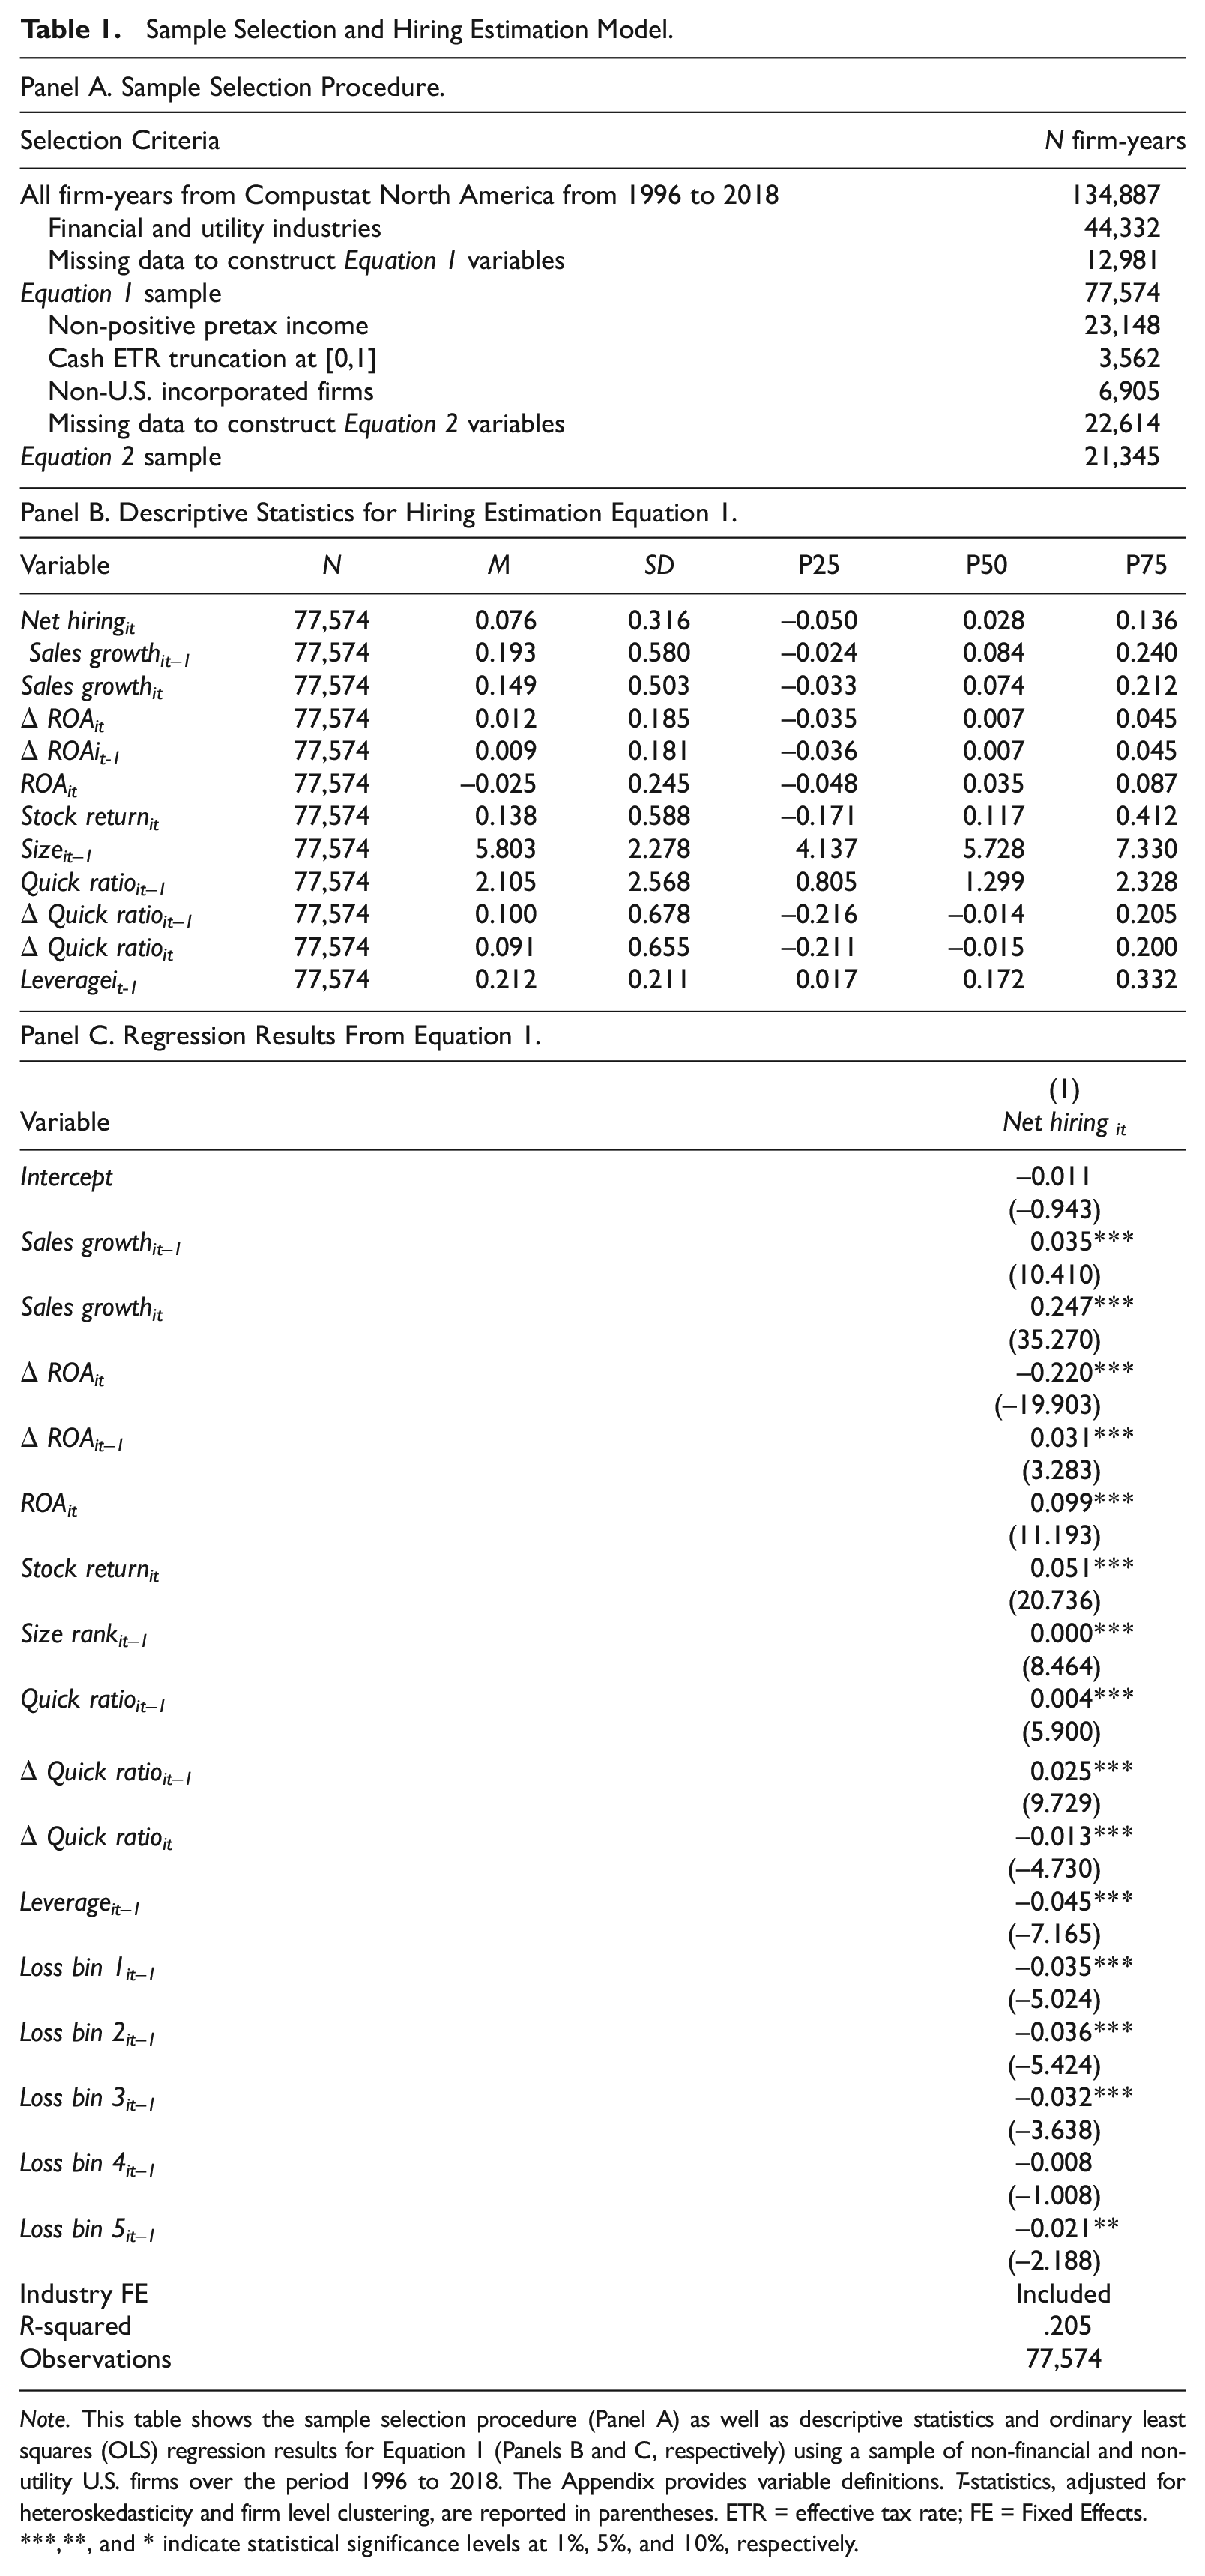
Note. This table shows the sample selection procedure (Panel A) as well as descriptive statistics and ordinary least squares (OLS) regression results for Equation 1 (Panels B and C, respectively) using a sample of non-financial and non-utility U.S. firms over the period 1996 to 2018. The Appendix provides variable definitions. T-statistics, adjusted for heteroskedasticity and firm level clustering, are reported in parentheses. ETR = effective tax rate; FE = Fixed Effects.
,**, and * indicate statistical significance levels at 1%, 5%, and 10%, respectively.
We then further restrict the sample for our primary analyses to allow for the estimation of tax aggressiveness. Because firms with current losses likely have very different needs and objectives for tax planning (e.g., Brown & Drake, 2014), we drop firm-years with negative pretax income (PI). We also truncate our cash ETRs at 0 and 1 to minimize the risk of drawing inferences based on firms with extreme ETRs. We hold the tax regime constant by limiting our sample to U.S. incorporated firms. Finally, we drop firm-years that are missing data in any dependent, explanatory, or control variable, resulting in a final sample of 21,345 firm-year observations. We describe all variables in the Appendix, and we winsorize all continuous variables at the 1st and 99th percentiles to mitigate the influence of extreme values on the analysis.
Hiring Estimation Model
Our focus in this study is on the efficiency of labor investments, which we estimate using deviations from expected levels of investment following prior literature. We base our investment prediction model on the expected investment model from Pinnuck and Lillis (2007). We use the following model to estimate the expected level of net hiring for each firm-year:

Equation 1 regresses the percentage change in a firm’s labor force on several variables capturing the firm’s economic fundamentals (e.g., sales growth, profitability, size, liquidity, and leverage). Net hiring is the percentage change in employees for firm i at the end of year t. This model estimates the expected level of the change in the labor force for each year, given the firm’s fundamentals. Following Jung et al. (2014), we use the absolute value of the difference between the firm’s predicted net hiring from Equation 1 and the firm’s actual net hiring to measure labor investment inefficiency (|Abnormal net hiring|). Conceptually, deviations from expected hiring levels indicate inefficient labor investments undertaken by firms (abnormal net hiring = actual net hiring–expected net hiring). We define all variables in the Appendix.
Panels B and C of Table 1 reports descriptive statistics for the variables used in Equation 1 and the estimation model results, respectively. Coefficient estimates are generally consistent with those reported by Pinnuck and Lillis (2007) and Jung et al. (2014), thus giving additional support to our estimation of labor investment efficiency.
Research Design for Empirical Tests
The focus of our empirical tests is whether tax aggressiveness is associated with deviations from expected investments in human capital. We test our hypothesis using the following model:

|Abnormal net hiring| is as defined previously. We follow related employment research (e.g., Jung et al., 2014; Shevlin et al., 2019) and measure hiring in year t and explanatory variables in year t–1. We use cash ETRs to measure tax aggressiveness for two primary reasons. First, we follow a plethora of research suggesting that lower cash ETRs are associated with aggressive tax planning and significant tax uncertainty (e.g., Balakrishnan et al., 2019; Dyreng et al., 2019). Second, cash ETRs match well to our construct of interest, which is the cash flows obtained from tax planning aggressiveness. Specifically, we define Avoider as an indicator variable equal to 1 if the firm’s cash ETR calculated over the period year t–5 to year t–1 is in the bottom tercile of the cash ETR distribution for the sample. 10 We use Avoider as our primary proxy for tax aggressiveness because Dyreng et al. (2019) provide evidence that firms with a low long-run cash ETR are associated with significant uncertainty, which we expect to affect hiring practices significantly. Moreover, ETRs are easy to compute and are accessible and used by corporate shareholders and other stakeholders, such as employees, trade unions, and media (Chyz et al., 2013). By construction, cash ETR captures all non-conforming tax planning activities and strategies that reduce corporate tax payments. Therefore, most deductions for labor expenses do not affect cash ETR. H1 predicts a positive coefficient on β1. 11
We include control variables that previous studies have found to be associated with tax planning and labor investments. These control variables include firm size (Size), leverage (Leverage), growth opportunities (Market-to-book), liquidity (Quick ratio), dividend payout policies (Dividend payout), property (PP&E), cash flow volatility (CFO volatility), sales volatility (Sales volatility), institutional ownership (Institutional ownership), size of workforce (Labor intensity), hiring volatility (Net hiring volatility), unionized workforce (Union membership), abnormal non-labor investments (Abnormal other investment), PI (Pretax Income), multinational status (Multinational), NOL and change in NOLs (NOL, DNOL), discretionary accruals (Discretionary accruals), and financing constraints (Financial constraints). 12 We derive this model from prior literature, which suggests that these variables are important to include when examining tax planning activities, labor, or both (Asker et al., 2015; Berk et al., 2010; Biddle et al., 2009; Bova, 2013; Campbell et al., 2021; Chyz et al., 2013; Frank et al., 2009; Ghaly et al., 2020; Graham & Tucker, 2006; Jung et al., 2014; McNichols & Stubben, 2008; Mills et al., 1998; Rego, 2003). In our main specifications, we include industry and year fixed effects, and we use heteroskedasticity–robust standard errors clustered at the firm level. We also employ firm fixed effects as an alternative research design to help control for other firm-specific considerations.
To enhance our inferences on whether investment inefficiency associated with tax aggressiveness is driven by over or underinvestment, we estimate the following regression:

|Over net hiring| takes the value of |Abnormal net hiring| when the residual from Equation is positive and |Under net hiring| takes the value of |Abnormal net hiring| when the residual from Equation 1 is negative. The control variables are identical to those in Equation 2. When |Over net hiring| (|Under net hiring|) is the dependent variable, a positive coefficient on β1 suggests tax aggressiveness is associated with overinvestment (underinvestment) in labor.
Results
Descriptive Statistics
We present descriptive statistics in Table 2. Descriptive statistics report an average (median) |Abnormal net hiring| of 0.117 (0.071), which is in line with the average (median) value for this variable found by Jung et al. (2014). We also find that the mean cash ETR in the sample is 25%, which is in line with prior tax research during our sample period (Dyreng et al., 2017).
Descriptive Statistics.
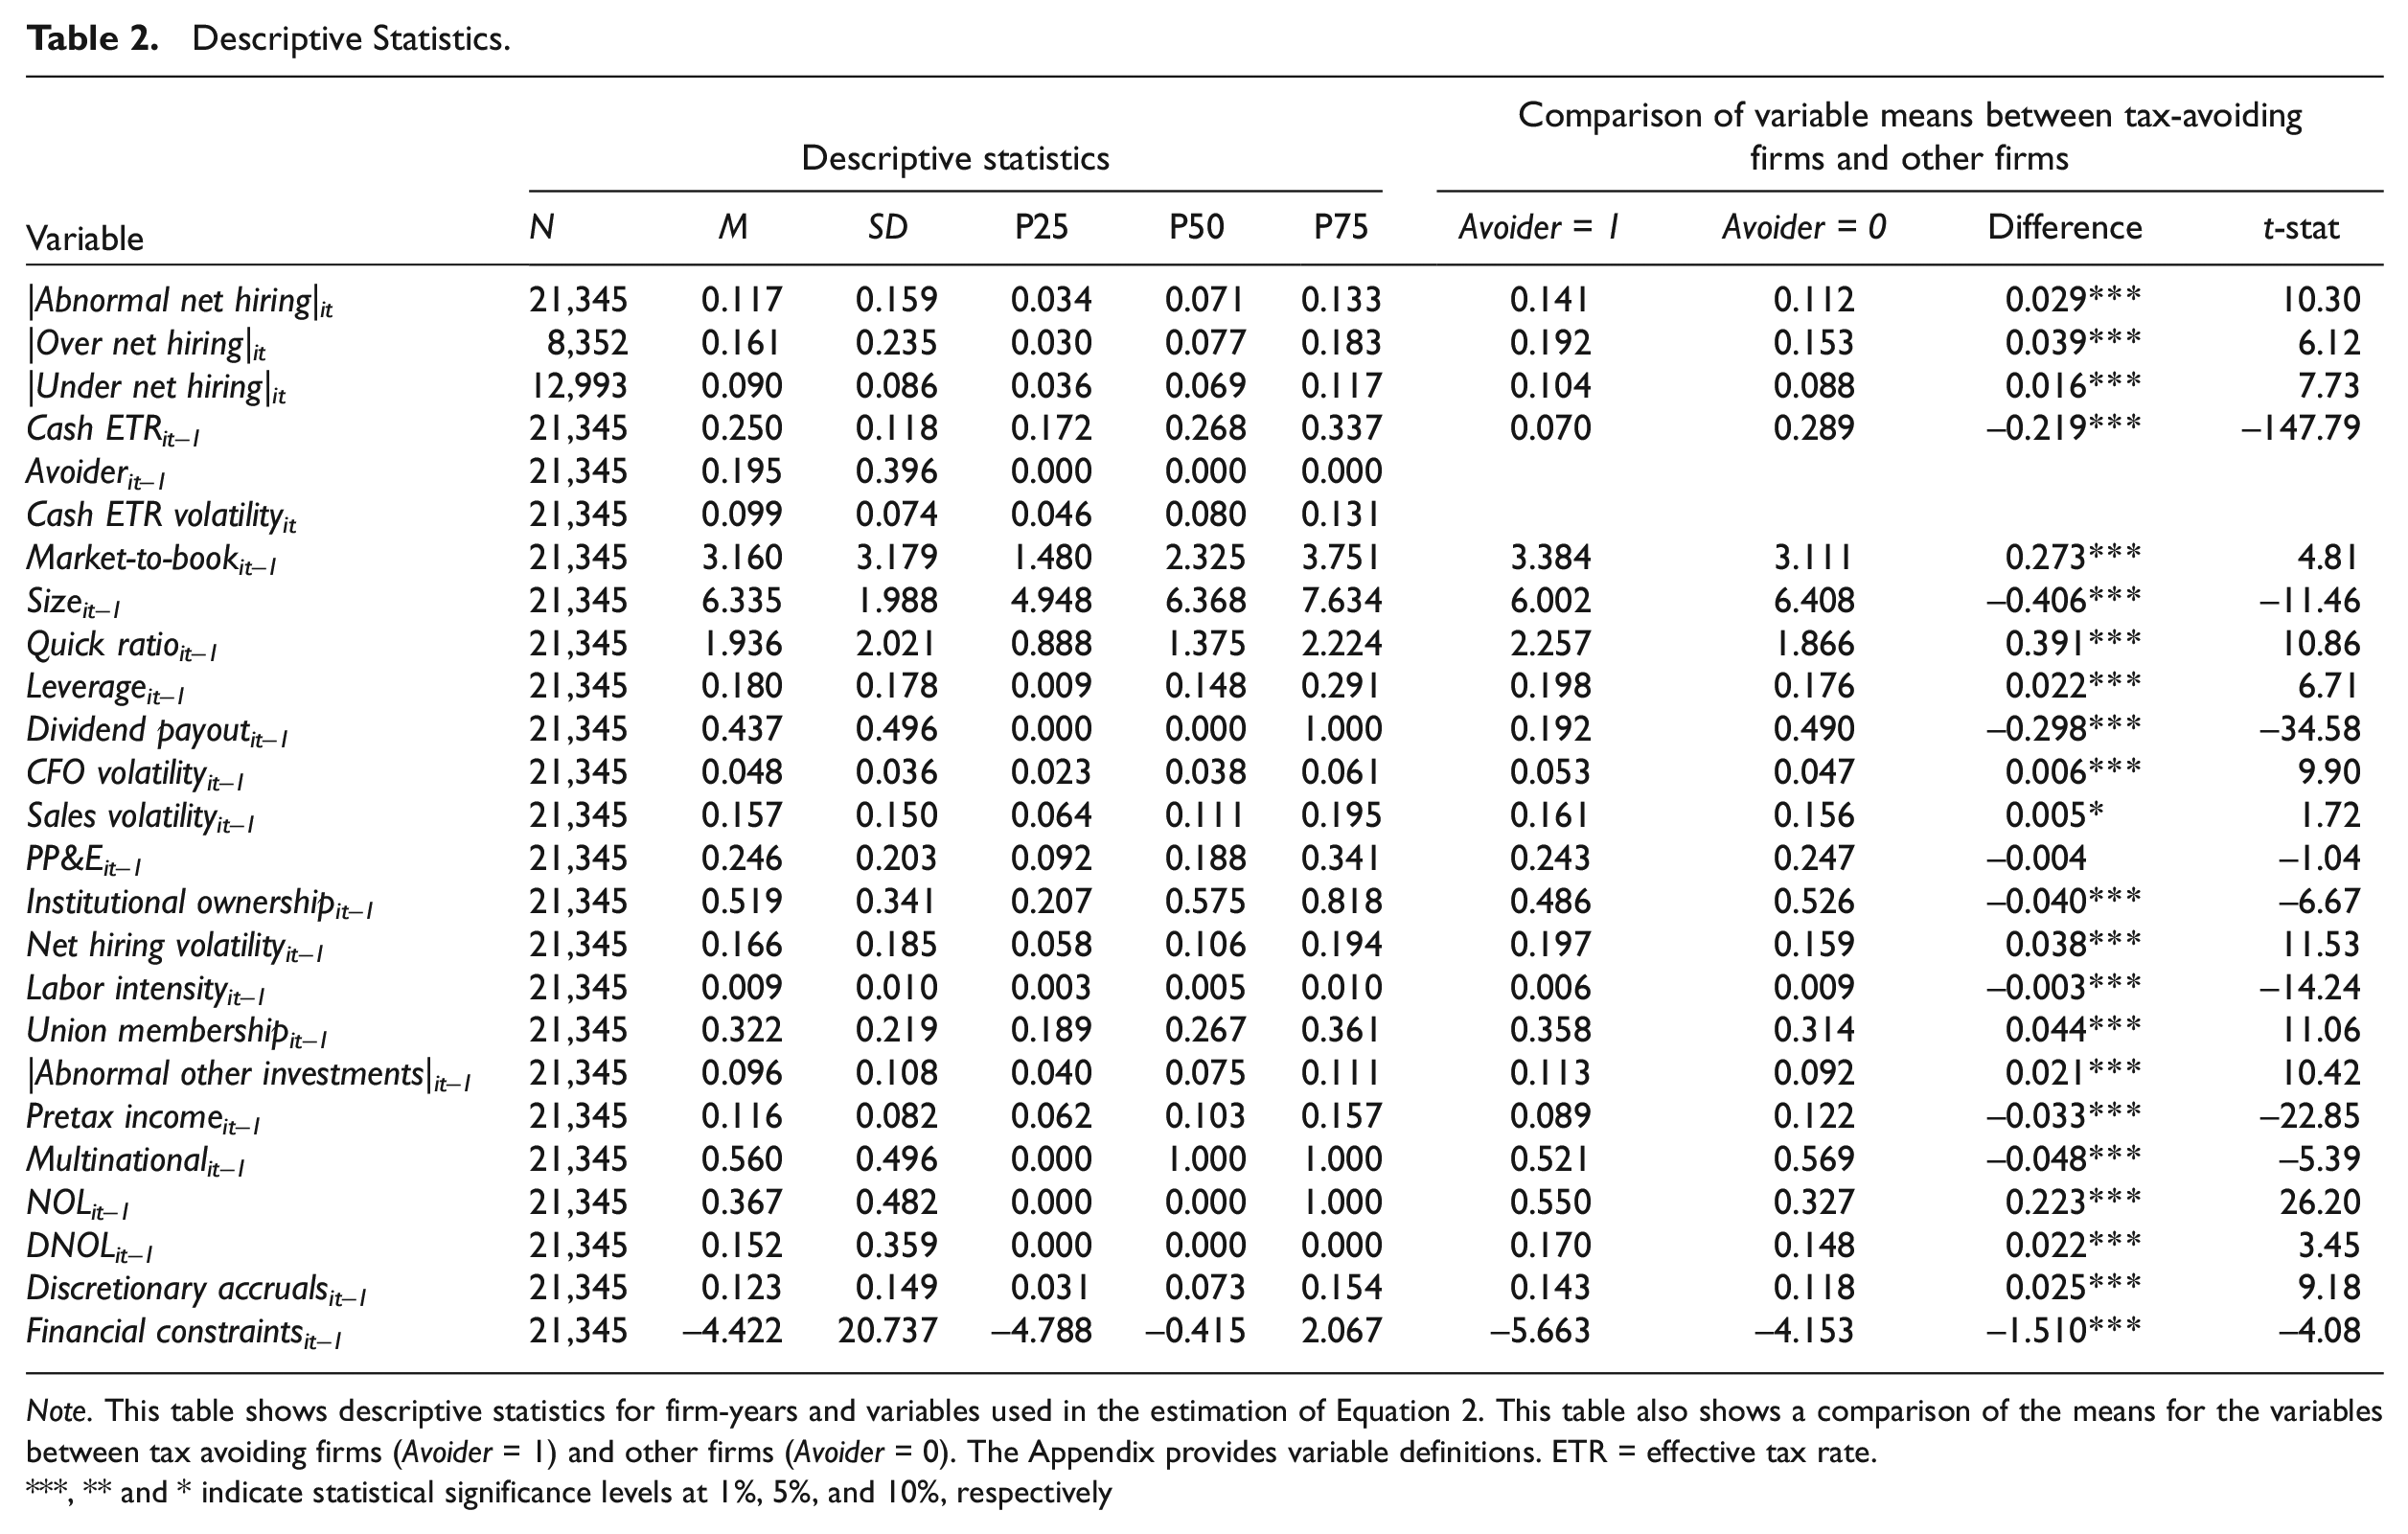
Note. This table shows descriptive statistics for firm-years and variables used in the estimation of Equation 2. This table also shows a comparison of the means for the variables between tax avoiding firms (Avoider = 1) and other firms (Avoider = 0). The Appendix provides variable definitions. ETR = effective tax rate.
***, ** and * indicate statistical significance levels at 1%, 5%, and 10%, respectively
A total of 19.5% of firm-year observations in our sample are designated as “avoiders” (Avoider), representing the bottom tercile of the cash ETR distribution in the Compustat population during our sample period. Table 2 also presents our comparison of means across our Avoiderit– 1 = 1 versus Avoiderit– 1 = 0 groups. In univariate tests, we note that compared to non-Avoider firms, the Avoider firms have higher |Abnormal net hiring| (diff. = 0.029, p < .01) as well as higher over hiring (diff. = 0.039, p < .01) and underhiring (diff. = 0.016, p < .01). While Table 2 highlights significant differences between our two population groups across many variables, we suggest that these differences highlight the need for extensive control variables. 13
Primary Analysis
Table 3 reports the results of Equation 2. Consistent with univariate findings, the coefficient estimate on Avoider in Column 1 is positive and significant (β1 = 0.008, p < 0.05), suggesting that firms engaging in aggressive tax planning are associated with deviations from expected labor investments, which prior literature interprets as inefficient hiring. Column 1 includes year and industry fixed effects. In Column 2, we remove the industry fixed effects and replace them with firm fixed effects. The coefficient on Avoider is larger in magnitude in Column 2 (β1 = 0.011, p < 0.05) than in Column 1. This test suggests that within-firm changes in tax planning (i.e., becoming a “tax avoider”) are associated with labor investment inefficiency. 14 In sum, the results in Columns 1 and 2 suggest that aggressive tax planning is associated with inefficient hiring and provides evidence consistent with Hypothesis 1. 15
Tax Avoidance and Labor Investment.
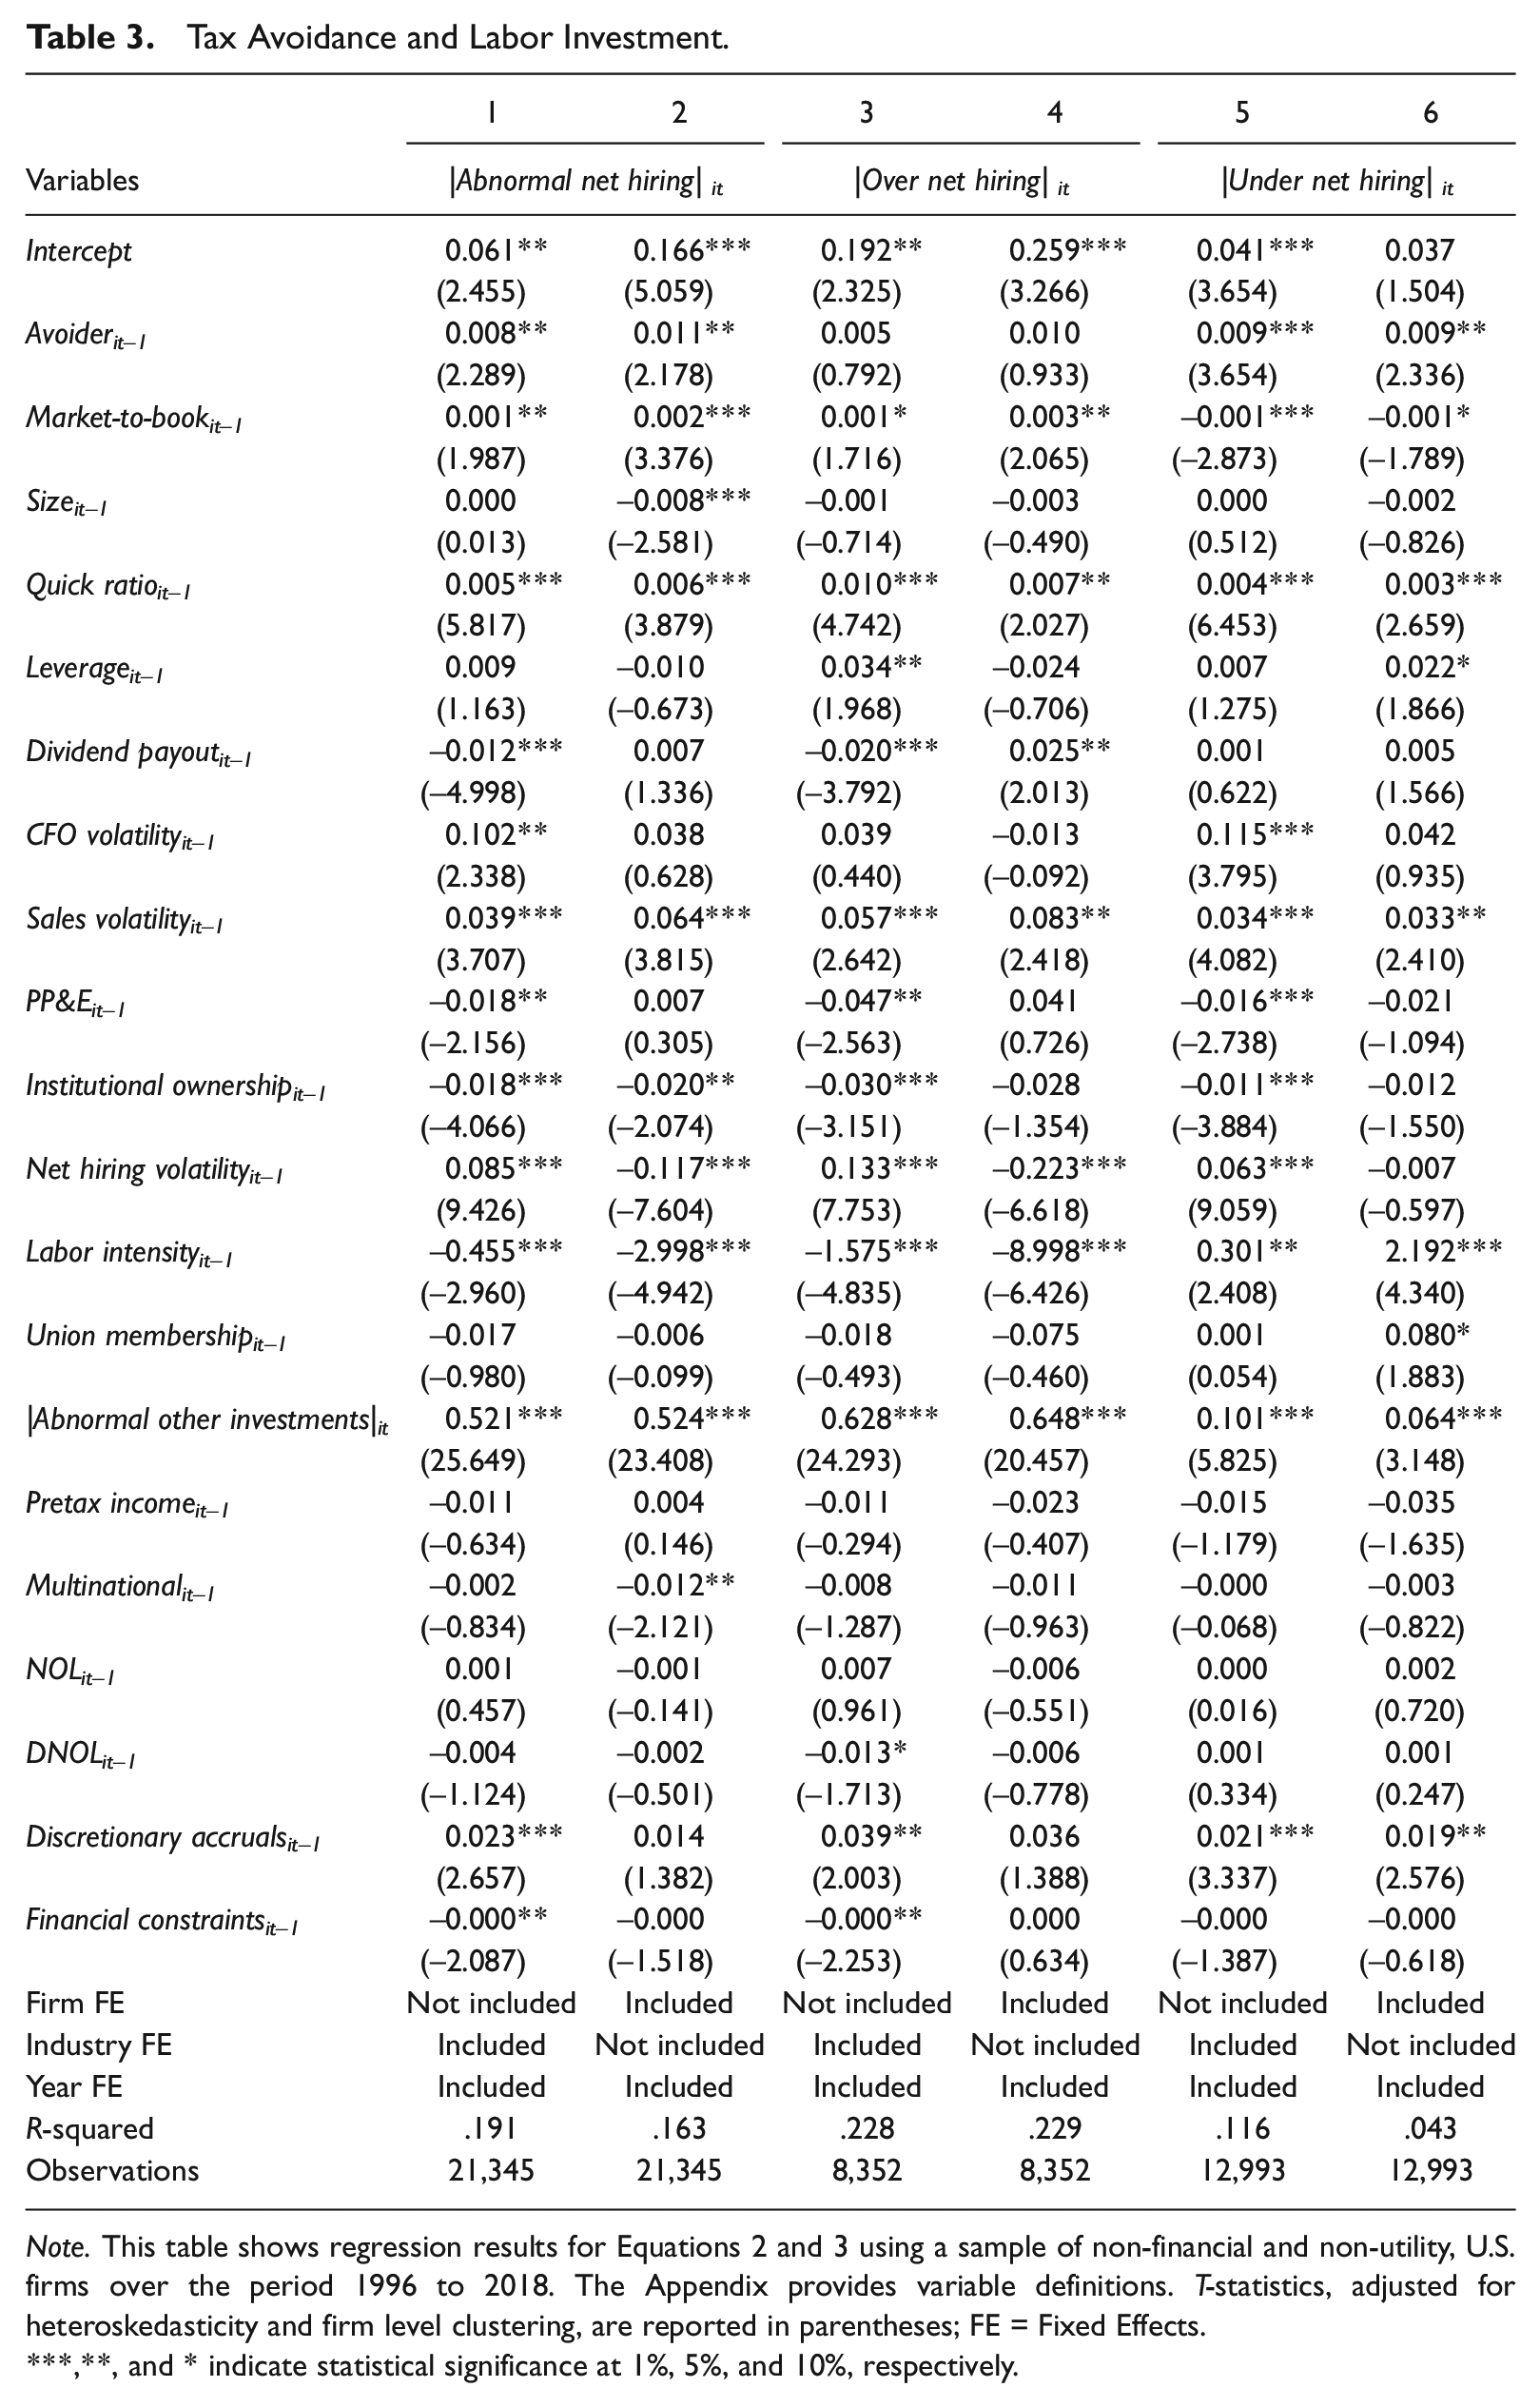
Note. This table shows regression results for Equations 2 and 3 using a sample of non-financial and non-utility, U.S. firms over the period 1996 to 2018. The Appendix provides variable definitions. T-statistics, adjusted for heteroskedasticity and firm level clustering, are reported in parentheses; FE = Fixed Effects.
,**, and * indicate statistical significance at 1%, 5%, and 10%, respectively.
Columns 3 and 4 present the results of Equation 2 on a sub-sample of firms with net hiring above expected levels based on firms’ fundamentals (i.e., overinvestment). Column 3 includes industry and year fixed effects, and Column 4 includes firm fixed effects. In both columns, the Avoider coefficient estimate is insignificant, suggesting that overinvestments in human capital are not significantly associated with aggressive tax planning. In contrast, Columns 5 and 6 present Equation 2 results on a sub-sample of firms with net hiring below expected levels based on firms’ fundamentals (i.e., underinvestment). Column 5 includes industry and year fixed effects, and Column 6 includes firm fixed effects. In both Columns 5 and 6, we find a significantly positive coefficient on Avoider (Column 5: β1 = 0.009, p < .01; Column 6: β1 = 0.009, p < .05). 16 In terms of economic significance, the results in Column 5 suggest that firms designated as “tax avoiders” experience abnormal hiring of 10% higher relative to the sample mean of |Under net hiring| of 9%.
The results in Table 3 suggest that underinvestment drives the deviations from expected hiring found in Columns 1 and 2 associated with aggressive tax planning. Thus, we do not find evidence that the excess cash associated with aggressive tax planning is associated with empire building. This result suggests that the future cash flow uncertainty associated with aggressive tax planning motivates firms to withhold funds that may be used for investment, resulting in inefficient hiring. In comparison, Shevlin et al. (2019) suggest that aggregate tax planning is associated with employment growth in higher corruption countries. Their study focuses on hiring levels, and in contrast, our study focuses on deviations from expected hiring and finds that tax aggressiveness is associated with lower investment in hiring than is expected based on the firm’s fundamentals. 17
Importantly, prior research finds evidence that underinvestment in hiring could have negative effects on the firm’s future profitability and growth (e.g., Jung et al., 2014). In addition, underinvestment may also stem from a lack of coordination and risk management at the firm’s enterprise level, which could allow tax decision-makers to invest aggressively in tax planning without understanding the spillover effects of this practice on other parts of the business. However, for some firms, the net present value of the tax planning strategy in conjunction with the associated lower hiring could still be positive, especially if tax cash flows do not have to be paid back to tax authorities. Whether inefficient hiring in conjunction with aggressive tax planning results in a net positive or negative NPV in the long-run needs to be evaluated on a firm-by-firm basis. Thus, our findings of a tradeoff between labor investment efficiency and tax aggressiveness suggest that managers should consider the effect on hiring practices and their impact on future growth and profitability when evaluating the overall long-run net benefit of a tax planning strategy.
Additional Analyses
Cross-sectional tests
We perform several cross-sectional tests, and we tabulate the results of these tests in Table 4. Since our primary inferences focus on underhiring, we focus on cross-sectional variation in underhiring in these tests. First, we examine how underhiring varies with tax uncertainty. Several studies provide evidence that risks and uncertainties can lead firms to withhold investments (Bloom et al., 2007; Gulen & Ion, 2016). Thus, aggressive tax planning that is more associated with uncertainty stemming from potential additional tax payments, interest, and reputational loss, may further lead firms to underinvest in labor. 18 We follow prior literature and measure tax uncertainty as to the volatility of the cash ETR (e.g., Guenther et al., 2017). We define high cash ETR volatility as equal to 1 if cash ETR volatility is in the top tercile of the Compustat population and zero otherwise. We compare our results between firms with high and low cash ETR volatility. Columns 1 and 2 of Table 4 present results of this test. We find that the coefficient on Avoider is significant among both the high (Column 1) and low (Column 2) tax volatility subsamples. Because both findings are significant, we use an F-test to examine the difference between the coefficient estimates. We find they are statistically different from one another using a one-tailed test (diff. = 0.011, p < .10). This test provides evidence that the association between aggressive tax planning and underinvestment in labor is more pronounced in firms subject to higher tax uncertainty. The economic magnitude of underinvestment is roughly 2.5 times as large for firms with higher ETR volatility than those with lower ETR volatility.
Cross-Sectional Tests.
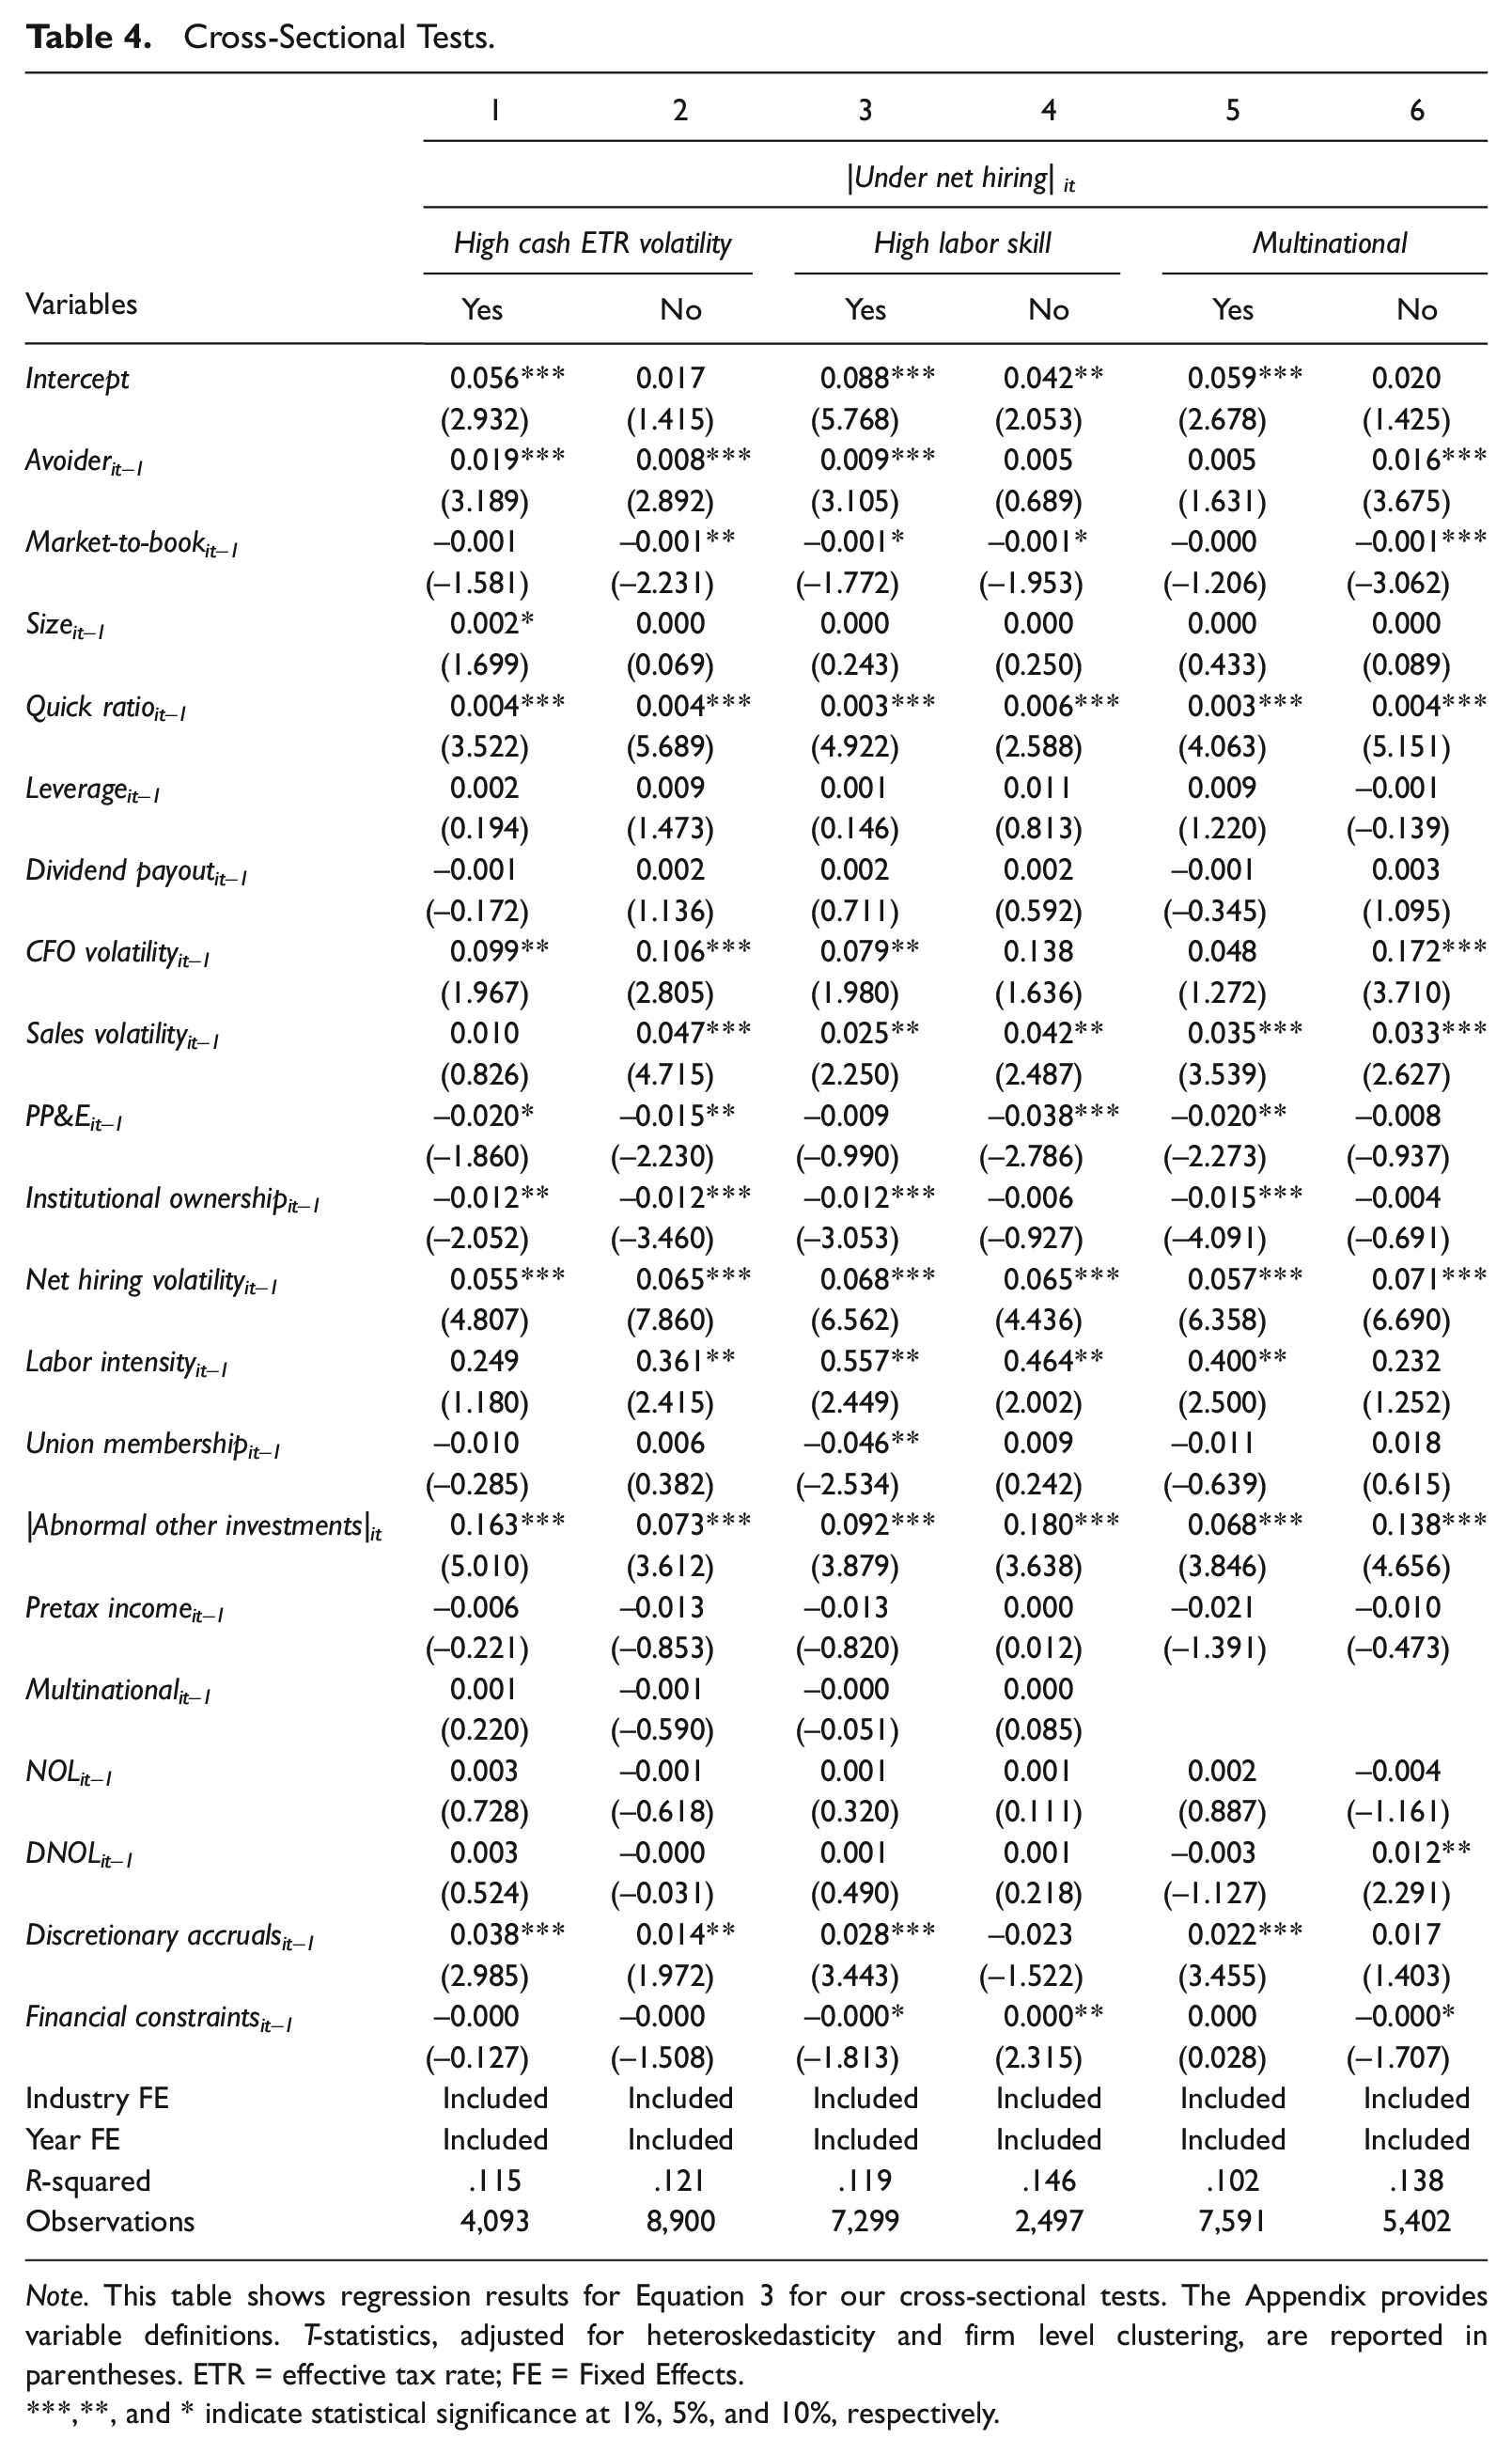
Note. This table shows regression results for Equation 3 for our cross-sectional tests. The Appendix provides variable definitions. T-statistics, adjusted for heteroskedasticity and firm level clustering, are reported in parentheses. ETR = effective tax rate; FE = Fixed Effects.
,**, and * indicate statistical significance at 1%, 5%, and 10%, respectively.
Our second cross-sectional test examines how the association between Avoider and underhiring varies with the degree of skilled labor. Labor investments tend to be extensive, fixed, and less easily reversed if the firm needs to liquidate relative to other investment. Consequently, firms may be more hesitant to invest in labor when labor costs are higher and more fixed compared to when labor costs are lower and more variable. Skilled workers are likely to require higher wages and may be more likely to be paid salaries than unskilled laborers, who may exhibit lower cost and pay by the hour. Therefore, underinvestments in labor may be more pronounced in firms with more skilled labor needs. Columns 3 and 4 of Table 4 present the association between aggressive tax planning and labor investment after splitting the sample between firms requiring skilled human capital. 19 We find that the positive association between Avoider and underinvestment in labor is concentrated in firms with high skilled labor (Column 3). 20 Consistent with our predictions, this result suggests that aggressive tax-avoiding firms are more likely to withhold their hiring policies when adjustment costs of labor are higher.
Our third cross-sectional test examines how the association between Avoider and underhiring varies with multinational status. Multinationals may differ substantially from domestic-only firms in terms of tax planning strategies and hiring needs and practices. In terms of aggressive tax planning, multinational firms may focus on strategies for shifting income abroad. In contrast, domestic-only firms may rely more on other uncertain tax planning, such as R&E credits. Domestic-only firms may be even more susceptible to an association between aggressive tax planning and underinvestment since these firms cannot access overseas cash holdings to address financing constraints, which is a resource available to their multinational counterparts (Dyreng & Markle, 2016). We present the results of this analysis in Columns 5 and 6 of Table 4. Consistent with our prediction, we find that the coefficient on Avoider is significant only in the sample of domestic-only firms in Column 6. 21
The effect of governance
Our finding that aggressive tax planning is associated with labor underinvestment is a complementary but different result than recent research. Specifically, Shevlin et al. (2019) document that planning is associated with empire building due to increased hiring or overinvestments in hiring only among weak-governance countries, which suggests that strong governance may help mitigate investment inefficiency. For this reason, we also examine whether our results vary with firm-level governance strength among our sample of U.S. firms. We split our sample into firms with stronger and weaker governance using two proxies for governance. First, we examine institutional ownership as an internal governance mechanism. Second, prior literature suggests that financial analysts act as an external monitoring mechanism and help mitigate information risk (e.g., Dyck et al., 2010; Hong et al., 2014) and Lewellen et al. (2021) provide evidence that low analyst following exacerbates information risk associated with aggressive tax avoidance. Thus, we also examine how our results vary with high and low analyst following. We split the variables at the median and designate firms as high governance if the respective governance variable is above the sample median.
We present these results in Table 5. Panel A presents the institutional ownership results and Panel B presents the analyst following results. In both Panels A and B, we find in Columns 1 and 2 that the overall positive association between tax planning aggressiveness and |Abnormal net hiring| is concentrated among firms with weaker governance structures (i.e., Column 2). Moreover, in Columns 3 and 4, we continue to find no evidence of an association between tax aggressiveness and overinvestment regardless of the level of governance. This result is consistent with findings from Blaylock (2016), Atwood and Lewellen (2019), and Shevlin et al. (2019) that tax avoidance is not associated with empire building among countries with strong governance, such as the U.S. Finally, we find in Columns 5 and 6 that underinvestment associated with aggressive tax planning is concentrated in firms with weaker governance. 22 In sum, our results suggest that stronger governance at the firm level may help mitigate the association between aggressive tax planning strategies and hiring inefficiency.
The Impact of Internal and External Governance.
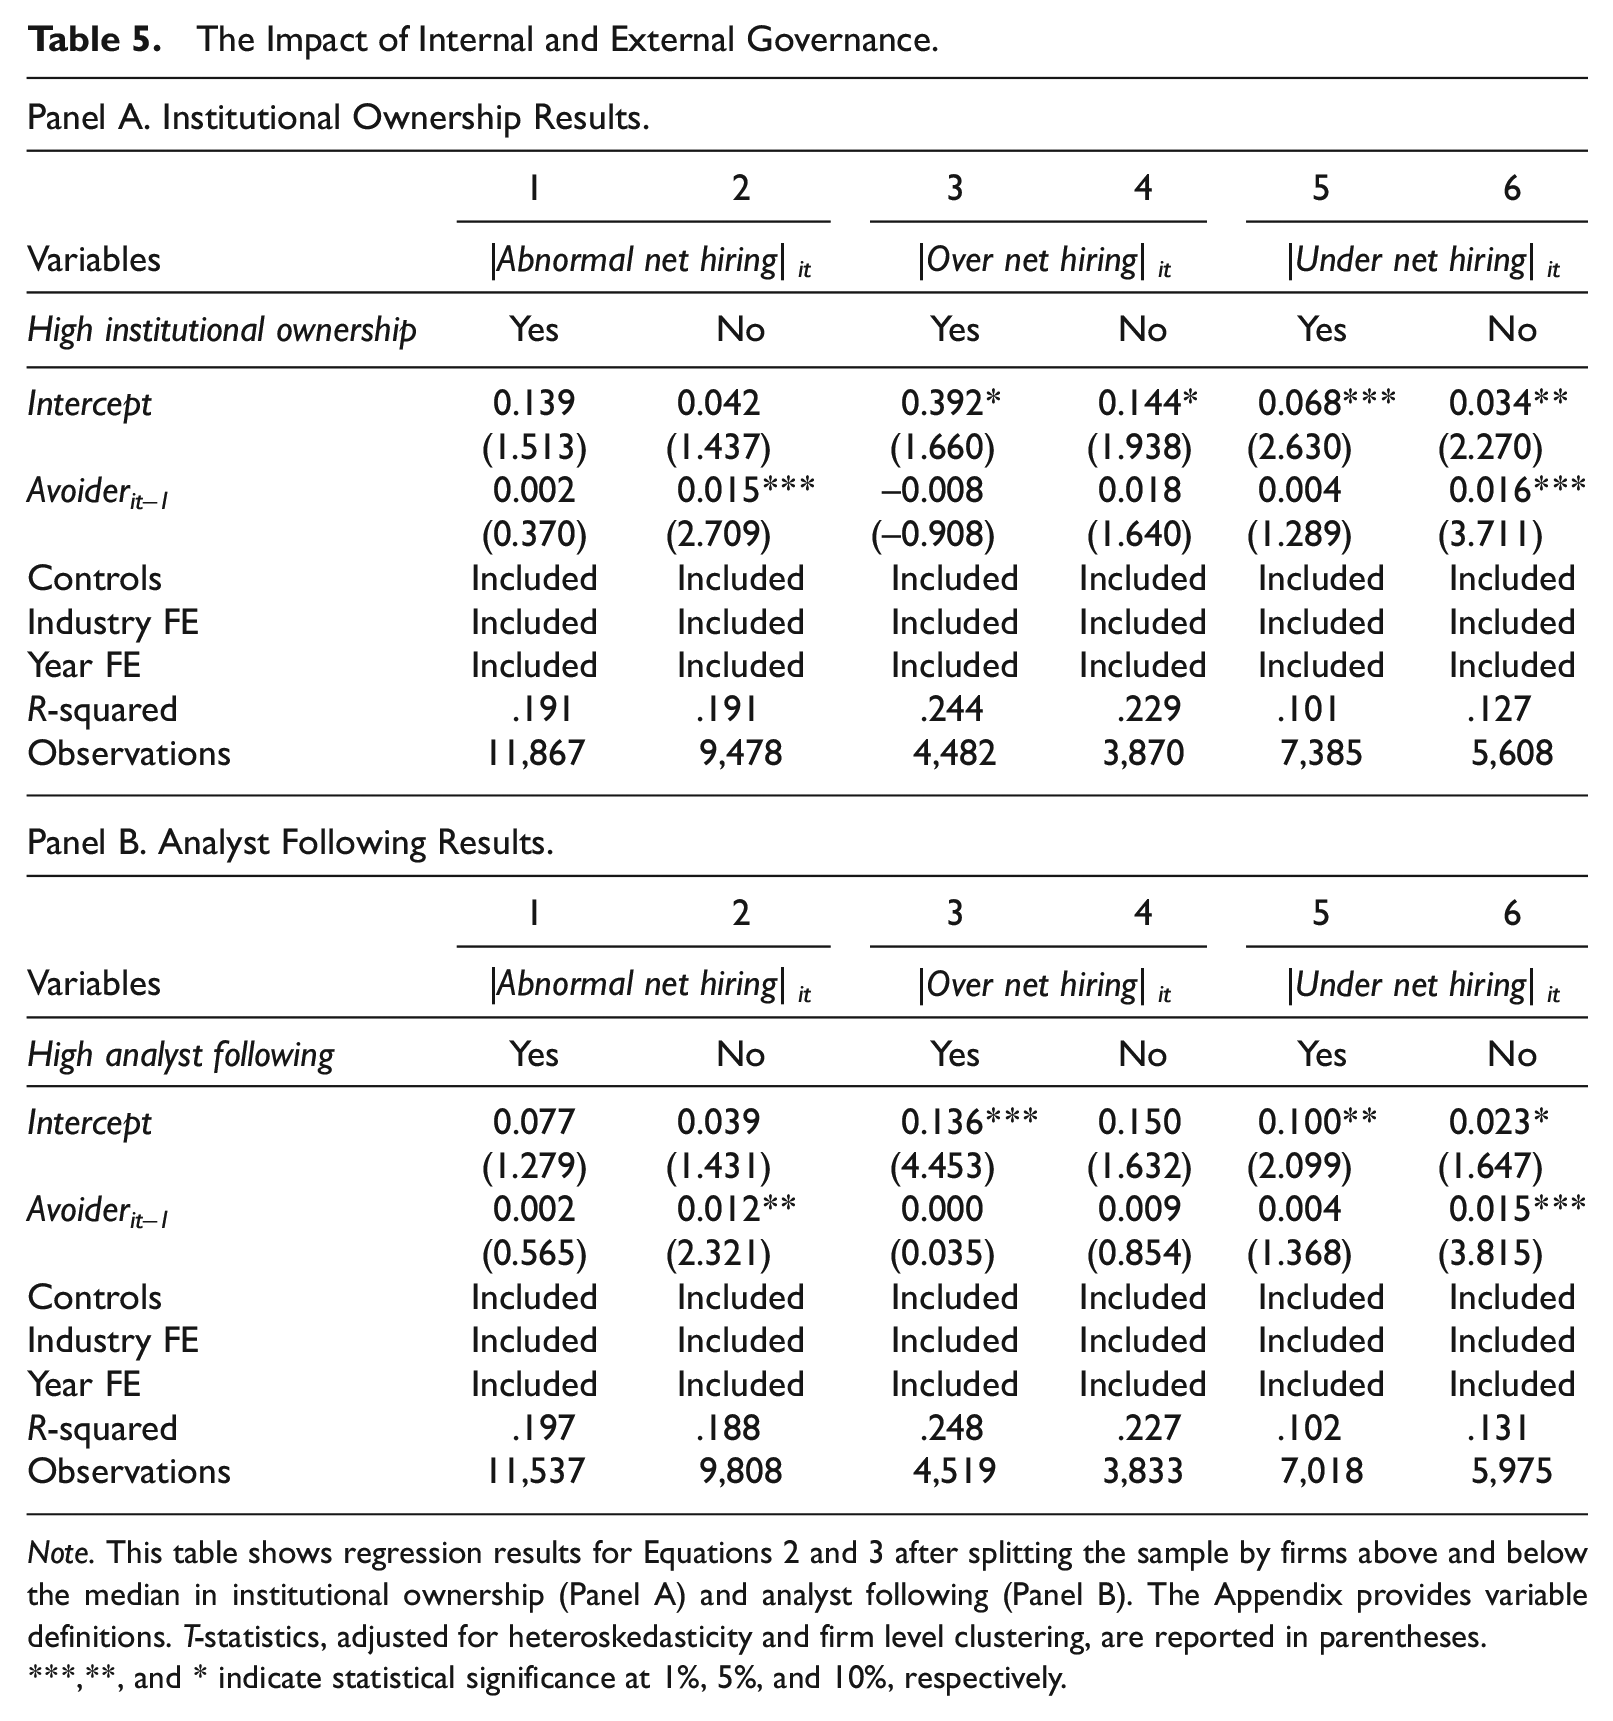
Note. This table shows regression results for Equations 2 and 3 after splitting the sample by firms above and below the median in institutional ownership (Panel A) and analyst following (Panel B). The Appendix provides variable definitions. T-statistics, adjusted for heteroskedasticity and firm level clustering, are reported in parentheses.
,**, and * indicate statistical significance at 1%, 5%, and 10%, respectively.
Robustness tests
We perform two additional untabulated cross-sectional tests. First, to ensure that differences in financial constraints among sample firms do not drive our results, we split firms into financially constrained (top tercile of Financial constraints) versus unconstrained (all other firms) and estimate Equations 2 and 3 separately for these groups. We find results consistent with our primary analysis in both of these groups and find no significant differences between constrained and unconstrained firms in the three hiring investment efficiency outcome variables used in the main analyses. While on the surface, it may seem surprising that we find similar inferences between financially constrained and unconstrained firms, we believe there are plausible reasons why financially unconstrained firms may still be cautious about investing their tax savings in hiring. For example, Guenther et al. (2020) provide mixed evidence on whether firms’ spending of cash tax savings in other types of investments (e.g., capital expenditures, acquisitions, R&D) vary with financial constraints. Moreover, Guenther et al. (2020) find that firms are cautious with investing tax savings in illiquid investments because if the tax position is reversed, they may have to liquidate the asset to repay the tax. Firms may perceive hiring, especially of skilled employees, as even less reversible compared to other types of investments. 23
Second, to ensure that differences in financial reporting aggressiveness among sample firms do not drive our results, we split firms into those exhibiting high financial reporting aggressiveness (top tercile of Discretionary accruals) versus all other firms and estimate Equations 1 and 3 separately for these groups. We find results consistent with our primary analysis in both of these groups and find no significant differences between these two groups in the three hiring investment efficiency outcome variables.
We conduct a variety of untabulated robustness tests. First, we begin by replacing our proxy for tax avoider with a firm’s UTB increase from year t–2 to year t–1 scaled by total assets, based on prior research that suggests that UTB increases are associated with increases in uncertain tax planning (e.g., Dyreng et al., 2019; Guenther et al., 2019). Second, we use Dyreng et al.’s (2019) cutoff for Avoider of 19.7%. We do this because samples can vary, and we would like to provide assurance that our findings are not a function of a different cutoff for determining whether a firm is a tax avoider. Third, we relax the assumption that firms had to know their tax planning activities in advance of making hiring decisions by examining the contemporaneous association between Avoider and labor investment. Fourth, given that our sample overlaps with the financial crisis, we remove fiscal years 2007, 2008, and 2009. Fifth, to ensure that dependent variables derived using a first-stage model do not bias coefficients in the second stage, we follow the guidance of W. Chen et al. (2018) and include all variables from the first-stage regression in the second stage model. We continue to find a significantly positive association between aggressive tax avoidance and underhiring using all of these alternative specifications.
Conclusion
This paper examines the association between aggressive tax planning and labor investment efficiency. Our research question is important because firms should factor in all nontax costs when considering the net long-run benefits of tax planning strategies (e.g., Scholes et al., 2020). Inefficient hiring decisions may have a meaningful impact on future growth and profitability (e.g., Jung et al., 2014), which may reduce or outweigh the benefits from tax planning.
We find that firms using aggressive tax planning strategies, as evidenced by low long-run cash effective tax rates, are associated with hiring inefficiency as evidenced by deviations from labor investments expected based on firms’ underlying economic fundamentals. Moreover, we find that the effect is concentrated in underinvestments in labor. This result is consistent with the risks and uncertainties that go along with aggressive tax planning making firms more cautious about labor investments. Our results are robust to several different specifications, including firm fixed effects. In cross-sectional tests, we find the positive association between aggressive tax planning and underinvestment in hiring is strongest for firms with higher tax uncertainty, firms with higher labor costs, domestic-only firms, and firms subject to weaker firm-level governance.
Our study contributes to the budding literature examining the association between tax planning and investment decisions. We provide unique evidence that, on average, aggressive tax planning is associated with underinvestments in labor. Since prior research finds that underinvestments in labor can have negative consequences, such as lower future profitability (Jung et al., 2014), our results suggest that managers should carefully consider the cash tax savings along with the potential nontax costs of tax planning, including those that may result from underhiring, to ensure that the net long-term effect of the tax strategy increases firm value. These findings can inform policy-makers and other corporate stakeholders (such as labor unions) when designing, implementing, or enforcing policies to generate new jobs and stimulate economic growth. We caveat that we do not determine the overall global benefit or detriment of aggressive tax planning in terms of efficient resource allocation in this study and we leave this for future research. In addition, we acknowledge that our study is an association study, and therefore it is difficult to establish a causal relation between aggressive tax planning and hiring. For this reason, we cannot rule out the possibility that some unmeasured factor drives our results.
Footnotes
Appendix
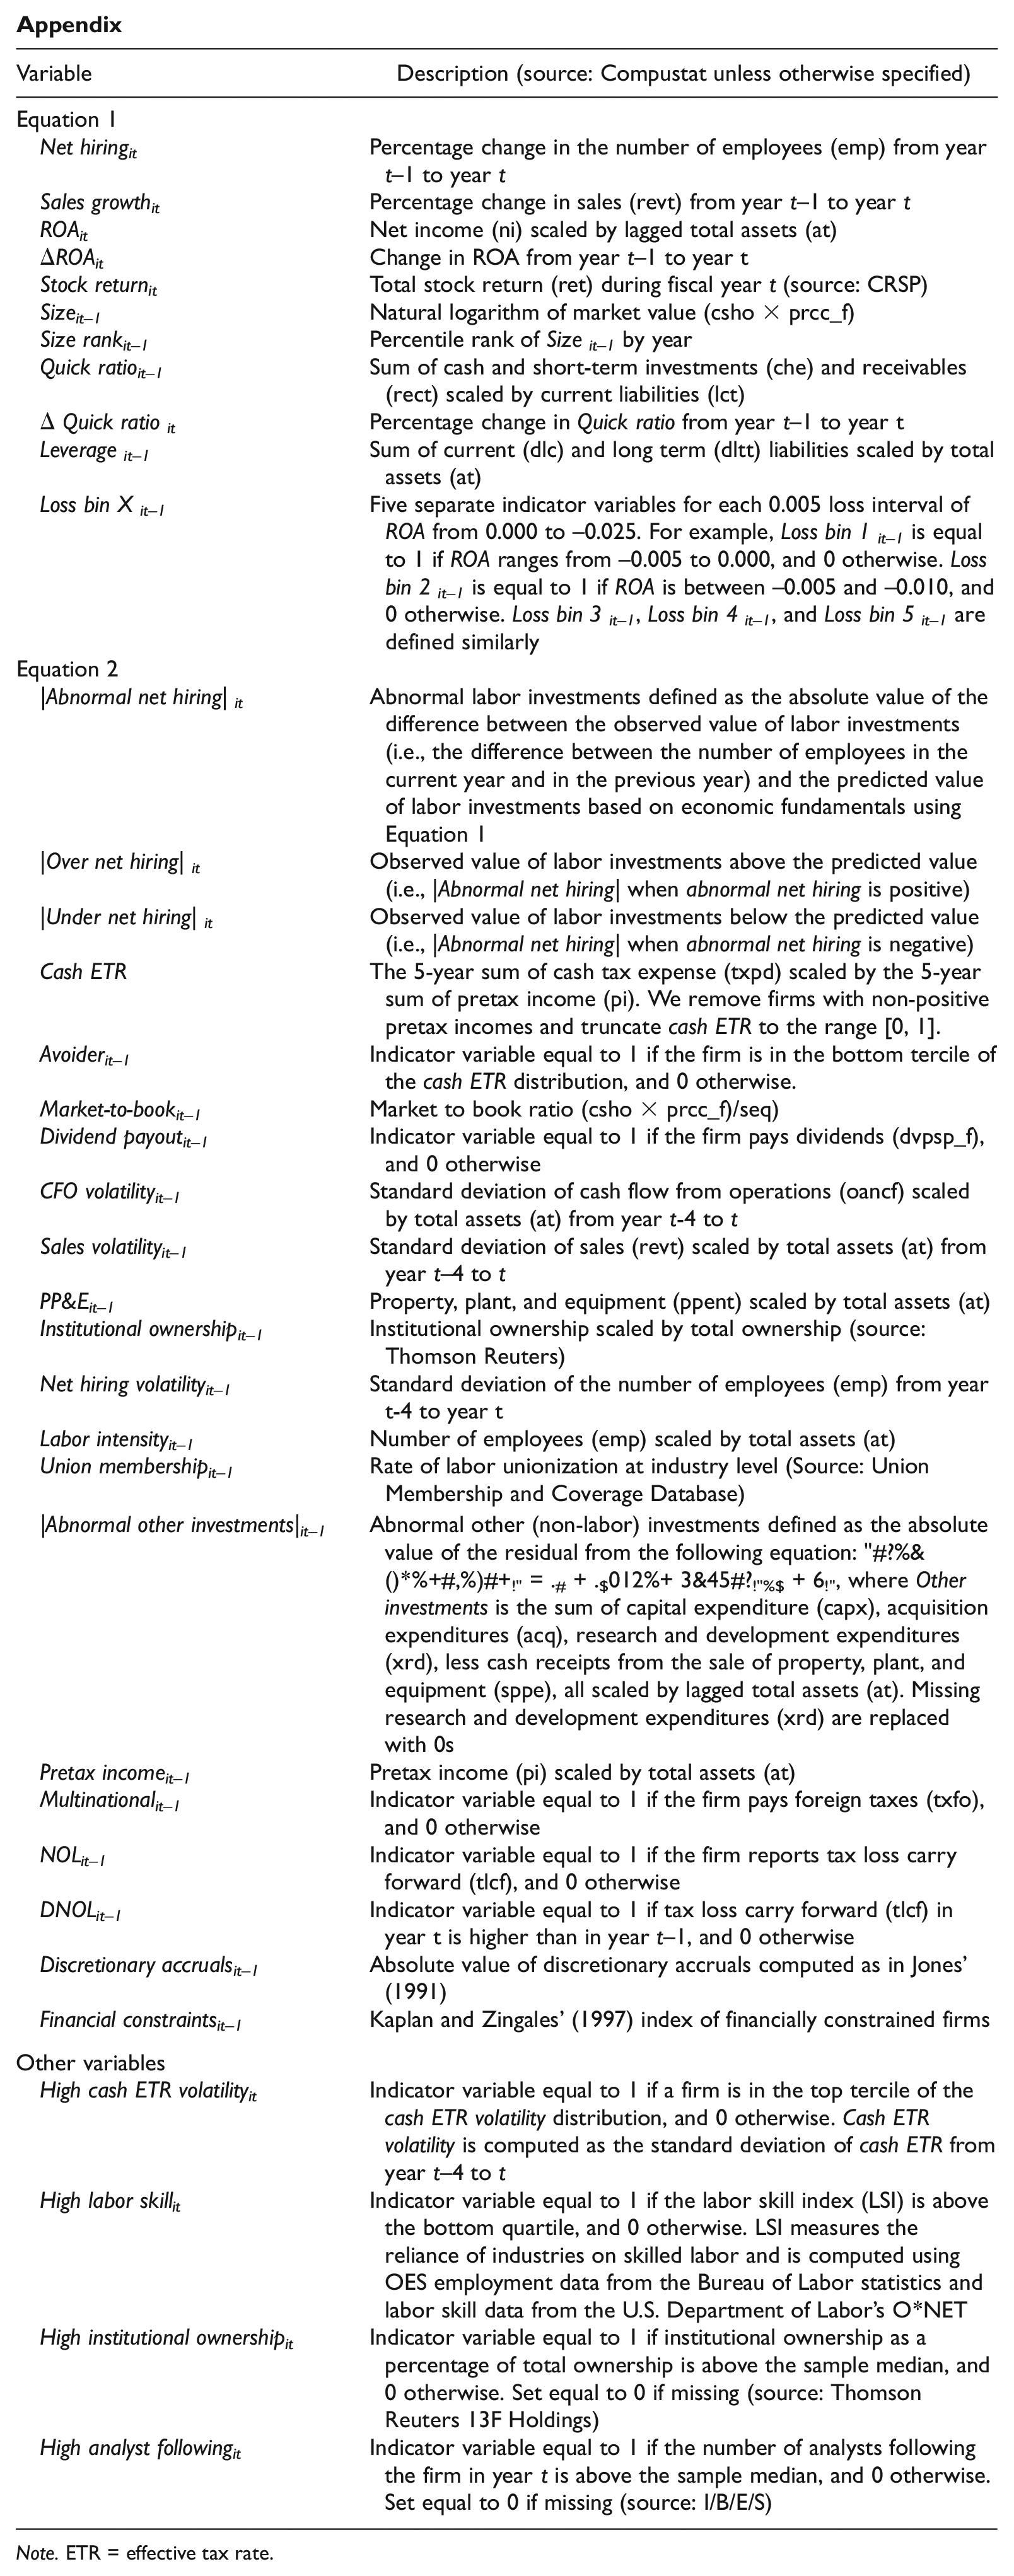
| Variable | Description (source: Compustat unless otherwise specified) |
|---|---|
| Equation 1 | |
| Net hiringit | Percentage change in the number of employees (emp) from year t–1 to year t |
| Sales growthit | Percentage change in sales (revt) from year t–1 to year t |
| ROAit | Net income (ni) scaled by lagged total assets (at) |
| ΔROAit | Change in ROA from year t–1 to year t |
| Stock returnit | Total stock return (ret) during fiscal year t (source: CRSP) |
| Sizeit– 1 | Natural logarithm of market value (csho × prcc_f) |
| Size rankit– 1 | Percentile rank of Size it– 1 by year |
| Quick ratioit– 1 | Sum of cash and short-term investments (che) and receivables (rect) scaled by current liabilities (lct) |
| ΔQuick ratio it | Percentage change in Quick ratio from year t–1 to year t |
| Leverage it– 1 | Sum of current (dlc) and long term (dltt) liabilities scaled by total assets (at) |
| Loss bin X it– 1 | Five separate indicator variables for each 0.005 loss interval of ROA from 0.000 to −0.025. For example, Loss bin 1 it– 1 is equal to 1 if ROA ranges from −0.005 to 0.000, and 0 otherwise. Loss bin 2 it– 1 is equal to 1 if ROA is between −0.005 and −0.010, and 0 otherwise. Loss bin 3 it– 1 , Loss bin 4 it– 1 , and Loss bin 5 it– 1 are defined similarly |
| Equation 2 | |
| |Abnormal net hiring| it | Abnormal labor investments defined as the absolute value of the difference between the observed value of labor investments (i.e., the difference between the number of employees in the current year and in the previous year) and the predicted value of labor investments based on economic fundamentals using Equation 1 |
| |Over net hiring| it | Observed value of labor investments above the predicted value (i.e., |Abnormal net hiring| when abnormal net hiring is positive) |
| |Under net hiring| it | Observed value of labor investments below the predicted value (i.e., |Abnormal net hiring| when abnormal net hiring is negative) |
| Cash ETR | The 5-year sum of cash tax expense (txpd) scaled by the 5-year sum of pretax income (pi). We remove firms with non-positive pretax incomes and truncate cash ETR to the range [0, 1]. |
| Avoiderit– 1 | Indicator variable equal to 1 if the firm is in the bottom tercile of the cash ETR distribution, and 0 otherwise. |
| Market-to-bookit– 1 | Market to book ratio (csho × prcc_f)/seq) |
| Dividend payoutit– 1 | Indicator variable equal to 1 if the firm pays dividends (dvpsp_f), and 0 otherwise |
| CFO volatilityit– 1 | Standard deviation of cash flow from operations (oancf) scaled by total assets (at) from year t-4 to t |
| Sales volatilityit– 1 | Standard deviation of sales (revt) scaled by total assets (at) from year t–4 to t |
| PP&Eit– 1 | Property, plant, and equipment (ppent) scaled by total assets (at) |
| Institutional ownershipit– 1 | Institutional ownership scaled by total ownership (source: Thomson Reuters) |
| Net hiring volatilityit– 1 | Standard deviation of the number of employees (emp) from year t-4 to year t |
| Labor intensityit– 1 | Number of employees (emp) scaled by total assets (at) |
| Union membershipit– 1 | Rate of labor unionization at industry level (Source: Union Membership and Coverage Database) |
| |Abnormal other investments|it– 1 | Abnormal other (non-labor) investments defined as the absolute value of the residual from the following equation: "#?%& ()*%+#,%)#+!" = .#+ .$012%+ 3&45#?!"%$+ 6!", where Other investments is the sum of capital expenditure (capx), acquisition expenditures (acq), research and development expenditures (xrd), less cash receipts from the sale of property, plant, and equipment (sppe), all scaled by lagged total assets (at). Missing research and development expenditures (xrd) are replaced with 0s |
| Pretax incomeit– 1 | Pretax income (pi) scaled by total assets (at) |
| Multinationalit– 1 | Indicator variable equal to 1 if the firm pays foreign taxes (txfo), and 0 otherwise |
| NOLit– 1 | Indicator variable equal to 1 if the firm reports tax loss carry forward (tlcf), and 0 otherwise |
| DNOLit– 1 | Indicator variable equal to 1 if tax loss carry forward (tlcf) in year t is higher than in year t–1, and 0 otherwise |
| Discretionary accrualsit– 1 | Absolute value of discretionary accruals computed as in Jones’ (1991) |
| Financial constraintsit– 1 | Kaplan and Zingales’ (1997) index of financially constrained firms |
| Other variables | |
| High cash ETR volatilityit | Indicator variable equal to 1 if a firm is in the top tercile of the cash ETR volatility distribution, and 0 otherwise. Cash ETR volatility is computed as the standard deviation of cash ETR from year t–4 to t |
| High labor skillit | Indicator variable equal to 1 if the labor skill index (LSI) is above the bottom quartile, and 0 otherwise. LSI measures the reliance of industries on skilled labor and is computed using OES employment data from the Bureau of Labor statistics and labor skill data from the U.S. Department of Labor’s O*NET |
| High institutional ownershipit | Indicator variable equal to 1 if institutional ownership as a percentage of total ownership is above the sample median, and 0 otherwise. Set equal to 0 if missing (source: Thomson Reuters 13F Holdings) |
| High analyst followingit | Indicator variable equal to 1 if the number of analysts following the firm in year t is above the sample median, and 0 otherwise. Set equal to 0 if missing (source: I/B/E/S) |
Note. ETR = effective tax rate.
Acknowledgements
This manuscript originated as Simone Traini’s dissertation, which was completed at University of Warwick. Simone thanks his committee for their help and guidance: Rong Ding, Chris Florakis, and Georgios Voulgaris (chair). The authors also thank Martin Jacob, Konstantinos Stathopoulos, Anthony Welsch (discussant), and Ryan Wilson, as well as workshop participants at Bayes Business School, Norwegian School of Economics, University of Manchester, University of Warwick, and the 2019 European Accounting Association Meeting and the 2021 National Tax Association Annual Conference for helpful comments on their manuscript. They thank Marissa Martin (NC State) for her research assistance. A prior version of the manuscript was circulated under the title “Tax Avoidance and Labor Investments.”
Declaration of Conflicting Interests
The author(s) declared no potential conflicts of interest with respect to the research, authorship, and/or publication of this article.
Funding
The author(s) received no financial support for the research, authorship, and/or publication of this article.