



Abstract
Management earnings forecasts (MEFs) may reduce information risk by corroborating the inferences that lenders draw from their private communication with borrowers. Consistent with this idea, we find that among firms with a general policy of issuing MEFs, those providing MEFs in the 6 months before loan origination with a forecast horizon beyond the origination date enjoy lower loan spreads. The frequency and precision of MEFs are also negatively associated with loan spreads. The associations are stronger when lenders’ need for corroboration of their private information is expected to be greater. The associations are not driven by a firm’s general information environment, signaling of managerial ability, opportunistic disclosure, or competition between public and private debt markets. Moreover, the issuance, frequency, and precision of MEFs are associated with loan amounts more spread out among participating lenders, suggesting that MEFs also reduce information asymmetry within a loan syndicate. Our study provides insight into the corroboration role of publicly disseminated MEFs in private loan markets.
Introduction
This study examines whether and how the management earnings forecasts (MEFs) that a firm provides publicly in the loan negotiation stage affect loan pricing. Loans are the principal source of external funds to U.S. firms. Over 90% of the funds raised in the U.S. capital markets are in the form of debt (Armstrong et al., 2010, p. 212). Among funds raised in debt markets, private loans nearly double the dollar amount of corporate bonds (Bharath et al., 2008). For example, $2.7 trillion of syndicated loans (i.e., loans provided by various groups of lenders) were originated in the United States in 2017, whereas only $1.6 trillion of corporate bonds were issued that year. 1 Approximately 80% of all U.S. publicly listed firms have loans, but only 15% to 20% have bonds (Nini et al., 2009). Thus, it is important to examine the effects of corporate disclosure on loan pricing.
A few studies have examined MEFs in relation to private loan markets, but with conflicting conclusions. Dhaliwal et al. (2011) and Lo (2014) suggest that private lenders have less need for MEFs than public investors. Hsieh et al. (2019) find the issuance of MEFs in the 9 months before the beginning of the fiscal quarter of loan origination is associated with lower loan spreads and attribute this result to managers’ opportunistic disclosure. Demerjian et al. (2020) report that the accuracy of realized MEFs issued in the 3 years before loan origination is negatively associated with loan spreads and argue that forecast accuracy signals managerial ability. It is important to know whether MEFs affect loan spreads and even more important to understand the channels through which the effect occurs. Our study advances the fledgling literature on the role of MEFs in loan markets both conceptually and empirically.
At the conceptual level, we draw on the concept of redundant information (Nakano, 1972) and the model of Sarath and Natarajan (1996) to argue that MEFs, albeit not expanding lenders’ information about borrowers’ future cash flows, can work in conjunction with lenders’ private information to reduce information risk. A unique feature of private loan markets is that borrowers privately communicate information about their strategies, budgets, financial projections, and investment plans to lenders in the negotiation stage (Armstrong et al., 2010, p. 214). Therefore, MEFs are probably redundant information to lenders regarding borrowers’ future cash flows. 2 MEFs, however, may reduce lenders’ information risk by corroborating the inferences they draw from their private communication with borrowers. Moreover, MEFs may be more credible than private communication and therefore provide a reasonable frame of reference for lenders to corroborate their private communication. Furthermore, MEFs may reduce information asymmetry within a loan syndicate. The lead arranger of a syndicate is charged with collecting information from a borrower and assessing its true credit quality, but contributes only a portion of the loan amount. MEFs can corroborate the private information that the lead arranger has collected from the borrower and shared with other syndicate participants. As information risk decreases, lenders are expected to require lower loan spreads. Thus, we expect MEF activity in the loan negotiation stage to be associated with lower loan spreads.
By contrast, Hsieh et al. (2019) propose two different arguments for the relation between MEFs and loan spreads. First, MEFs contain cash flow news, which will affect lenders’ default risk assessments, and managers tend to provide good-news forecasts before loan origination. Second, the issuance of MEFs indicates a borrower’s willingness to convey timely information to outsiders and thus signals a transparent information environment. Their first argument appears to ignore the fact that lenders in private loan markets have substantial private access to borrowers. Their second argument is plausible and should apply to both MEFs that are still outstanding and MEFs that have been realized at the time of loan origination.
Empirically, we distinguish our study from Hsieh et al. (2019) in two ways. First, we examine exclusively outstanding MEFs. Once the earnings for the forecasted period are reported, MEFs lose their value in reducing lenders’ information risk or possibly conveying timely cash flow information. By contrast, Hsieh et al. (2019) do not distinguish between realized and outstanding MEFs. Second, we use changes analysis and examine cross-sectional variation in the relation between MEFs and loan spreads to address omitted correlated variable problems. The changes analysis controls for time-invariant factors that affect both MEFs and loan spreads. The cross-sectional analyses can further alleviate the endogeneity concern because any omitted correlated variables would have to not only induce the relation between MEFs and loan spreads but also vary in predictable ways in our cross-sectional analyses. By contrast, these analyses are absent from Hsieh et al. (2019).
We collect data on loans originated by U.S. firms between 1998 and the first quarter of 2017. For each firm-loan observation, we require the firm to have issued at least one MEF in the 24 months before loan origination and obtain the issuance, frequency, and precision of MEFs (collectively referred to as “MEF properties”) provided by the sample firm in the negotiation stage. In other words, all our sample firms have a general policy of providing MEFs but vary in MEF activity in the loan negotiation stage. We find that MEF properties in the loan negotiation stage are significantly negatively associated with loan spreads and the economic effect is material. For example, firms that provide an outstanding MEF in the negotiation stage pay loan spreads 11.0 basis points (bps) lower, on average, than firms that do not. This difference in loan spreads translates into $0.475 million of savings in annual interest payments for the average sample firm. Our findings are robust to entropy balancing, which further addresses the concern of selection on observables, and to changes analyses, which address the concern of omitted time-invariant variables including selection on unobservables.
We conduct three cross-sectional analyses to better understand the channels through which MEFs affect loan spreads. If MEFs truly reduce information risk in loan pricing by corroborating lenders’ private information, we expect this effect to be more pronounced when lenders have a greater need to substantiate their private information. We identify three such situations: (a) borrowers are at high financial distress risk, (b) lenders have no prior lending relationship with the borrower, and (c) borrowers are undergoing restructuring. We find substantial evidence of stronger associations for firms at high distress risk or firms undergoing restructuring and some evidence of stronger associations for non-relationship lending than for relationship lending among small firms.
We address four alternative explanations. First, firms with better information environments enjoy lower loan spreads because of lower information asymmetry and these firms are more likely to issue MEFs and provide more precise MEFs in the negotiation stage. This explanation is unlikely to drive our primary results because the negative associations between MEFs and loan spreads remain largely unchanged after we control for the richness of a firm’s information environment. Furthermore, both outstanding and realized MEFs can manifest a firm’s information transparency, but we find that outstanding MEFs affect loan spreads and realized MEFs do not. Second, managers may provide accurate MEFs to signal their ability to execute future operation and investment plans (Demerjian et al., 2020) and these capable managers are more likely to provide MEFs and more precise MEFs in the negotiation stage. We calculate the accuracy of MEFs that are realized in the 24 months before loan origination and find that a borrower’s outstanding MEFs provide incremental explanatory power for loan spreads above and beyond that of the accuracy of its realized MEFs. Third, firms may be more likely to provide good-news MEFs than bad-news MEFs to induce lower loan spreads. However, we observe that (a) MEF news is not associated with loan spreads and (b) the effect of MEFs on loan spreads does not depend on good-news versus bad-news MEFs. Last, MEFs may attract public sources of capital and the competition from public capital markets may drive down the interest rates for private loans. We find that the effect of MEFs on loan spreads remains for firms without access to public debt.
In our final analysis, we examine the relation of MEFs with the information asymmetry between the lead arranger and other lenders in a syndicate. Sufi (2007) argues that this information asymmetry hinders other lenders from participating and holding larger proportions of the loan. We find that MEF properties in the loan negotiation stage are associated with a smaller proportion of loan amount held by the lead arranger and with the loan amount more spread out among syndicate participants. The evidence suggests that MEFs reduce information asymmetry within a syndicate.
We make two contributions to the literature. First, our study provides new insights into the role of financial information in debt contracting. Most prior research focuses on realized financial information. We control for the quality of a firm’s financial reporting and our results are consistent with the idea that outstanding MEFs can mitigate lenders’ information risk by corroborating their private information and therefore reducing information asymmetries both between borrowers and lenders and among lenders in a syndicate. This explanation differs from the cash flow news and information transparency explanations provided by Hsieh et al. (2019). 3
Second, our study contributes to the research on the confirmation effects of financial information. 4 Nakano (1972) and Sarath and Natarajan (1996) demonstrate that a signal that appears redundant because it provides no additional information beyond the existing signals regarding a construct may enhance the probability of correct decoding as long as uncertainty exists in the communication. Subsequent studies argue that realized financials play a confirmation role because, although not very timely, realized financials can confirm the information that investors have collected from other, more timely sources (Ball & Shivakumar, 2008; Ball et al., 2012; Gigler & Hemmer, 1998). Corporate governance research probes the confirmation role of corporate disclosure and suggests that disclosure improves board monitoring by corroborating outside directors’ private information obtained from board meetings and managers (Armstrong et al., 2014; Duchin et al., 2010). We extend this stream of research by exploring the corroboration role of MEFs in private loan markets.
Our study has two caveats. The first applies to most, if not all, prior research on the confirmation role of financial information: we cannot provide direct evidence because private information is unobservable to researchers. Although we use several empirical strategies to address endogeneity concerns, we cannot completely rule out the possibility that our findings result from endogenous selection and omitted correlated variables. Second, we document a benefit of MEFs but do not examine the costs of providing MEFs. Disclosure costs can be one reason why not every firm provides MEFs to secure lower loan spreads. 5
Background and Hypothesis Development
The credit risk that debt holders face has two components: default risk and information risk. Default risk is inherent in a borrower’s operations and investments. Information risk stems from lenders having imperfect information about the borrowing firm and having an information disadvantage relative to the firm. When lenders perceive information risk to be high, they price-protect themselves by charging higher effective interest rates. Our study focuses on how forward-looking public voluntary disclosure facilitates loan contracting by reducing information risk.
In the loan negotiation stage, loan officers collect both historical and forward-looking information during office visits and especially use forward-looking information to assess a borrower’s plan of utilizing and repaying the proposed loan (Carrizosa & Ryan, 2017; Danos et al., 1989). However, forward-looking information is unverifiable, private communication can be ambiguous, and borrowers may communicate opportunistically to obtain favorable contracting terms because their interests often do not align with those of lenders. Given this uncertainty in lender–borrower private communication, there are three reasons why the public disclosure of MEFs can play the corroboration role, even though the cash flow information contained in MEFs may have already been privately communicated to lenders.
The first reason derives from the information theory. Although MEFs appear redundant (e.g., not expanding lenders’ information set about borrowers’ future cash flows), they may improve lenders’ payoffs when MEFs are used in conjunction with the private information that lenders have already collected. Nakano (1972) defines “semantic noise” as factors that disturb the meaning or message to be transmitted and argues that the existence of such noise requires “semantic redundancy” (i.e., an excess of messages for a given communication) for the receiver to determine the originally intended message. He shows that redundancy is necessary when there is a great degree of uncertainty surrounding the communication. He suggests that one type of redundant signal is additional information about the business and its environment so that the receiver can grasp the full meaning of the original message. Sarath and Natarajan (1996) demonstrate that even though a public disclosure such as an audit report is completely independent of managerial risk type, when used together with another signal the public disclosure contributes to investors’ assessment of managerial risk type. Both studies suggest that when used together with another signal, a seemingly redundant or unrelated piece of information may enhance communication as long as uncertainty exists about the message of interest. Uncertainty abounds in loan negotiation; MEFs can help lenders decode their private communication with borrowers.
The second reason relates to the greater credibility of MEFs. As a type of public disclosure, MEFs may be more credible than private communication and therefore provide a reasonable frame of reference for lenders to corroborate the inferences they draw from private communication. Because of conflict of interests, borrowers may communicate opportunistically and, therefore, the credibility of their private information to lenders is a valid concern. From our conversations with loan officers, we learned that lenders do not blindly trust what they receive from borrowers, but instead use public information to verify privately collected information. In addition, loan officers often need to justify their judgment and defend their lending decisions to their team members or before a committee (Danos et al., 1989). One feature of public disclosure is that it is received by a multitude of audiences. 6 The diverse audiences discipline the sender into providing signals that more truthfully reveal her private information (Farrell & Gibbons, 1989; Gigler, 1994). In addition, public disclosures are subject to media scrutiny, private enforcement (e.g., litigation), and public enforcement (e.g., U.S. Securities and Exchange Commission [SEC] actions). Thus, public disclosure is considered more credible than private communication (Bushman et al., 2004). The greater credibility allows MEFs to serve as a frame of reference for lenders’ private information.
Indeed, managers may make other types of forward-looking public disclosure in the loan negotiation stage that lenders could also use for corroboration purposes. We use MEFs as a proxy for a borrower’s forward-looking public disclosure in the negotiation stage because of their two advantages. First, projected earnings are the most common type of information requested by lenders in private communication (Rajan & Winton, 1995). Second, MEFs are reliably available in commercial databases, whereas other types of forward-looking public disclosure (e.g., sales forecasts) are not. We acknowledge that the forward-looking information presented in MEFs may not be exactly the same as the private information communicated to lenders. While MEFs are projections of an aggregated performance number, private communication may include disaggregated earnings, budgets, strategies, and investment plans. Lenders nevertheless can use MEFs to corroborate their private communication with borrowers and assess its reasonableness and consistency.
The third reason why MEFs may play the corroboration role relates to the information asymmetry within a loan syndicate. The vast majority of corporate loans are syndicated loans (Standard & Poor’s 2011; Sufi, 2007). Syndicate participants depend on the lead arranger to assess the true credit quality of the borrower even though the lead arranger contributes only a portion of the loan amount. The lead arranger receives upfront fees for managing a syndication process, including collecting the borrower’s private information, setting a range for the interest rate, and negotiating contract terms. This practice gives rise to adverse selection and moral hazard problems between the lead arranger and other participants, hindering the latter from holding large proportions of the loan amount. When information asymmetry within a syndicate is higher, the final interest rate is likely at the higher end of the range or even outside the range if the loan is undersubscribed. 7 MEFs may reduce this information asymmetry by corroborating private information that the lead arranger collects from borrowers and shares with other participating lenders.
As information risk decreases, lenders are expected to require a lower rate of return and therefore charge a lower loan spread. We hence predict the following:
Sample and Key Measurements
Sample Selection
We collect loan data from the DealScan database assembled by Thomson Reuters Loan Pricing Corporation. We begin our sample with 107,239 loan facilities originated by U.S. firms from January 1, 1998, to March 31, 2017. 8 Each loan deal (also referred to as a “package”) may comprise multiple facilities that are negotiated together. To avoid dependence among facilities in the same package, we follow Houston et al. (2014) and keep the largest facility in the package. This procedure reduces the number of loan facilities to 76,307. We exclude loan facilities that belong to financial firms, utility firms, and firms not in Compustat (e.g., private firms and a few public firms with total assets missing). This procedure reduces our sample to 23,059 loan facilities. We require a firm-loan observation to have non-missing firm characteristic variables used in our primary analyses and 14,386 observations satisfy these data requirements. Finally, we require loan features (spread, size, maturity, type, and purpose) to be available in DealScan. This requirement reduces our firm-loans to 12,493.
We obtain MEF data from the union of First Call’s Company Issued Guidelines (CIG) and Thomson Reuters’ IBES Guidance. CIG coverage begins in 1991 but is incomplete before 1998. Thomson Reuters acquired First Call, discontinued CIG in early 2011, and replaced it with IBES Guidance. In untabulated analyses, we observe that CIG has more coverage than IBES before 2001 and IBES has more coverage than CIG after 2003. We use the union of the two data sets to identify MEFs.
One serious concern in our study is selection bias. That is, firms that choose to provide MEFs as a corporate disclosure policy might differ substantially from firms that choose not to. Some differences might be related to both MEF disclosure policies and credit risk, inducing a relation between MEFs and loan spreads. To address this concern, we exclude firms that do not provide any MEFs in the 24 months preceding loan origination. In other words, we examine firms that appear to have a corporate policy of providing MEFs but differ in MEF activity in the loan negotiation stage. Our final sample comprises 5,991 firm-loan originations. Table 1 summarizes the sample selection process.
Sample Selection.
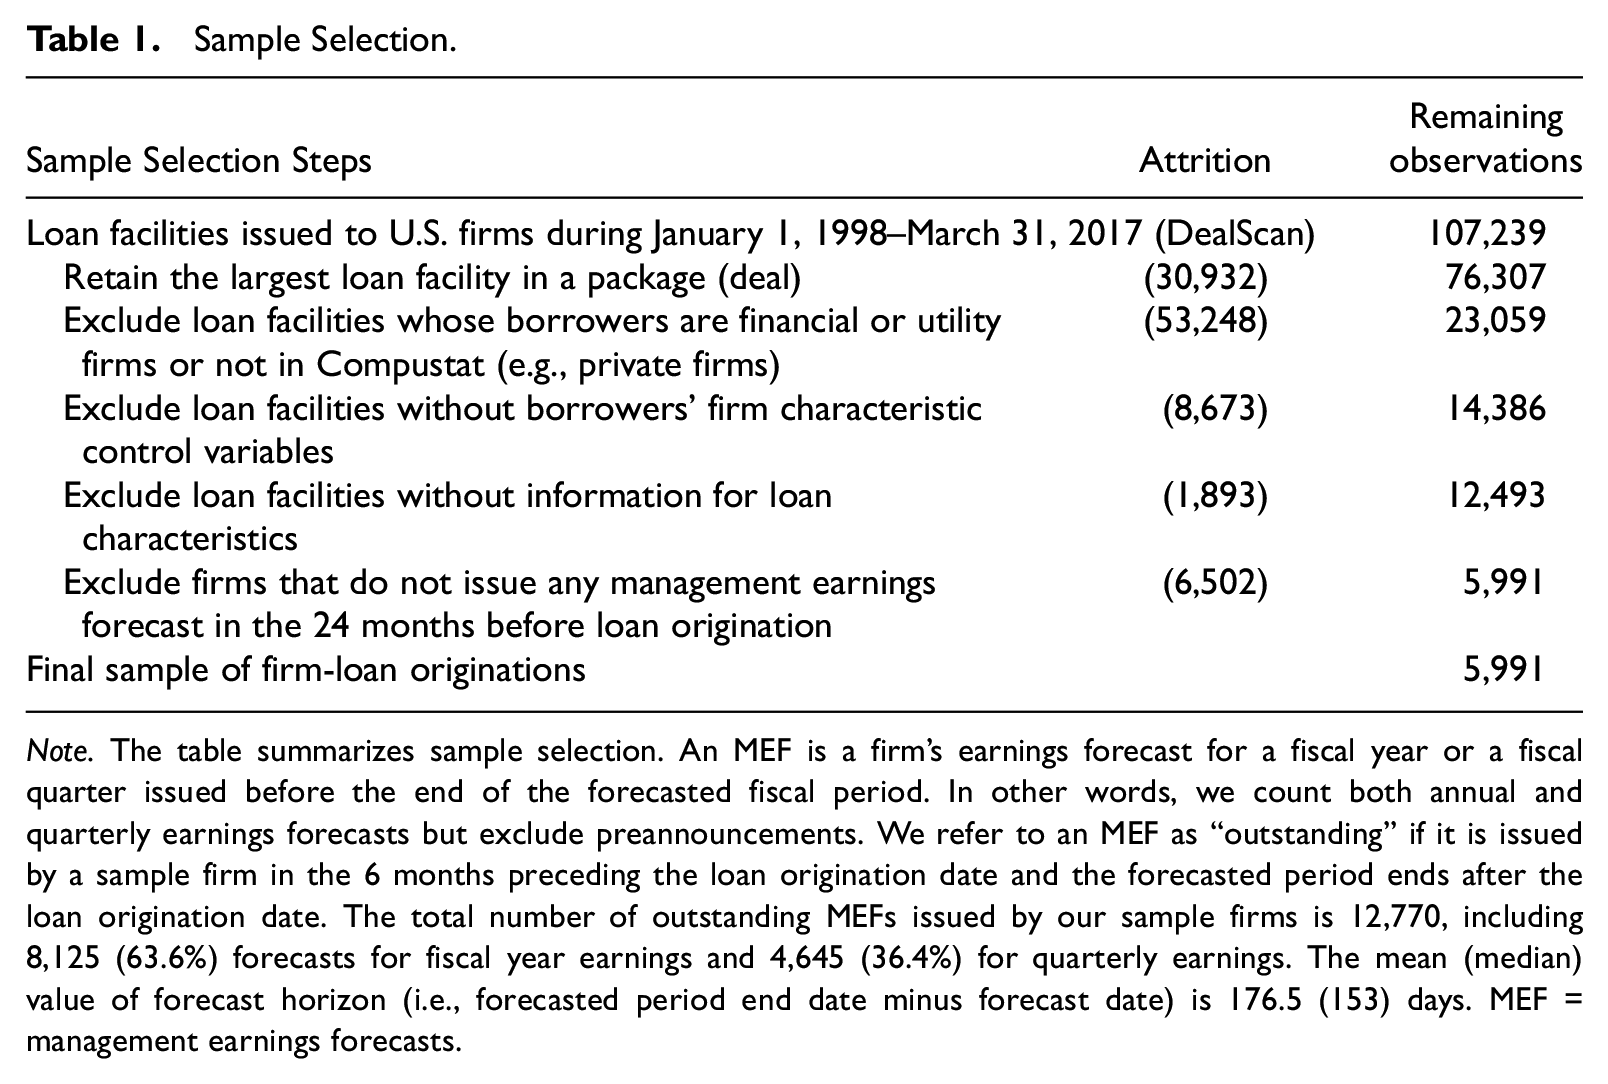
Note. The table summarizes sample selection. An MEF is a firm’s earnings forecast for a fiscal year or a fiscal quarter issued before the end of the forecasted fiscal period. In other words, we count both annual and quarterly earnings forecasts but exclude preannouncements. We refer to an MEF as “outstanding” if it is issued by a sample firm in the 6 months preceding the loan origination date and the forecasted period ends after the loan origination date. The total number of outstanding MEFs issued by our sample firms is 12,770, including 8,125 (63.6%) forecasts for fiscal year earnings and 4,645 (36.4%) for quarterly earnings. The mean (median) value of forecast horizon (i.e., forecasted period end date minus forecast date) is 176.5 (153) days. MEF = management earnings forecasts.
Key Measurements and Descriptive Statistics
Our sample firm-loans have a mean (median) value of $432 ($250) million for loan amount (LoanSize). A typical loan accounts for 16.2% of a firm’s total assets (untabulated). The mean (median) loan maturity (Maturity) is 47 (60) months. On average, a loan has roughly 1.6 financial covenants (FinCovenant). In our sample, 73.9% of the loans are revolvers (Revolver) typically issued by banks and 17.0% are term loans issued by institutions such as structured investment vehicles, hedge funds, mutual funds, and insurance companies (InstLoan). 9 Using DealScan codes for the purposes of loans, we observe that 65.5% of the loans in our sample are for general corporate purposes and working capital purposes, followed by the purposes of takeover and acquisition (13.3%), debt repayment (8.8%), commercial paper backup (7.0%), and other (5.4%).
We follow the standard practice in the loan literature and use the “all-in-spread drawn” (AISD) in DealScan to measure loan pricing at origination. AISD, measured in bps, is the effective interest rate at which a borrower pays over LIBOR, including the coupon spread and annual fee. For this reason, loan pricing is also referred to as “loan spread.” The mean (median) loan spread (LoanSpread) of our sample loans is 183 (150) bps. Due to the skewness of the variable, we follow Graham et al. (2008) and use the natural logarithm of loan spreads in regression analyses.
In constructing our MEF variables, we consider all MEFs regardless of periodicity (i.e., forecasts for either fiscal year or fiscal quarter earnings) and specificity (i.e., point, range, open-interval, or qualitative forecasts). We exclude MEFs that are issued after the forecasted fiscal period end because those MEFs are generally preannouncements of earnings. We measure the MEF variables in the negotiation stage and require the forecasted fiscal period to end after the loan origination date. We refer to such MEFs as “outstanding” at loan origination. 10
Following Dhaliwal et al. (2011) and Lo (2014), we examine the issuance, frequency, and precision of MEFs. The indicator variable, MEFdum, is 1 if a firm issues an outstanding MEF in the loan negotiation stage and 0 otherwise. Table 2 reports that the mean of MEFdum is 0.621, indicating that 62.1% of our firm-loan observations have an outstanding MEF in the negotiation stage. We measure forecast frequency, MEFfreq, as the number of outstanding MEFs issued in the negotiation stage and set MEFfreq to 0 if no outstanding MEF is issued. The mean (median) value of MEFfreq for our sample is 1.533 (1). 11
Summary Statistics.
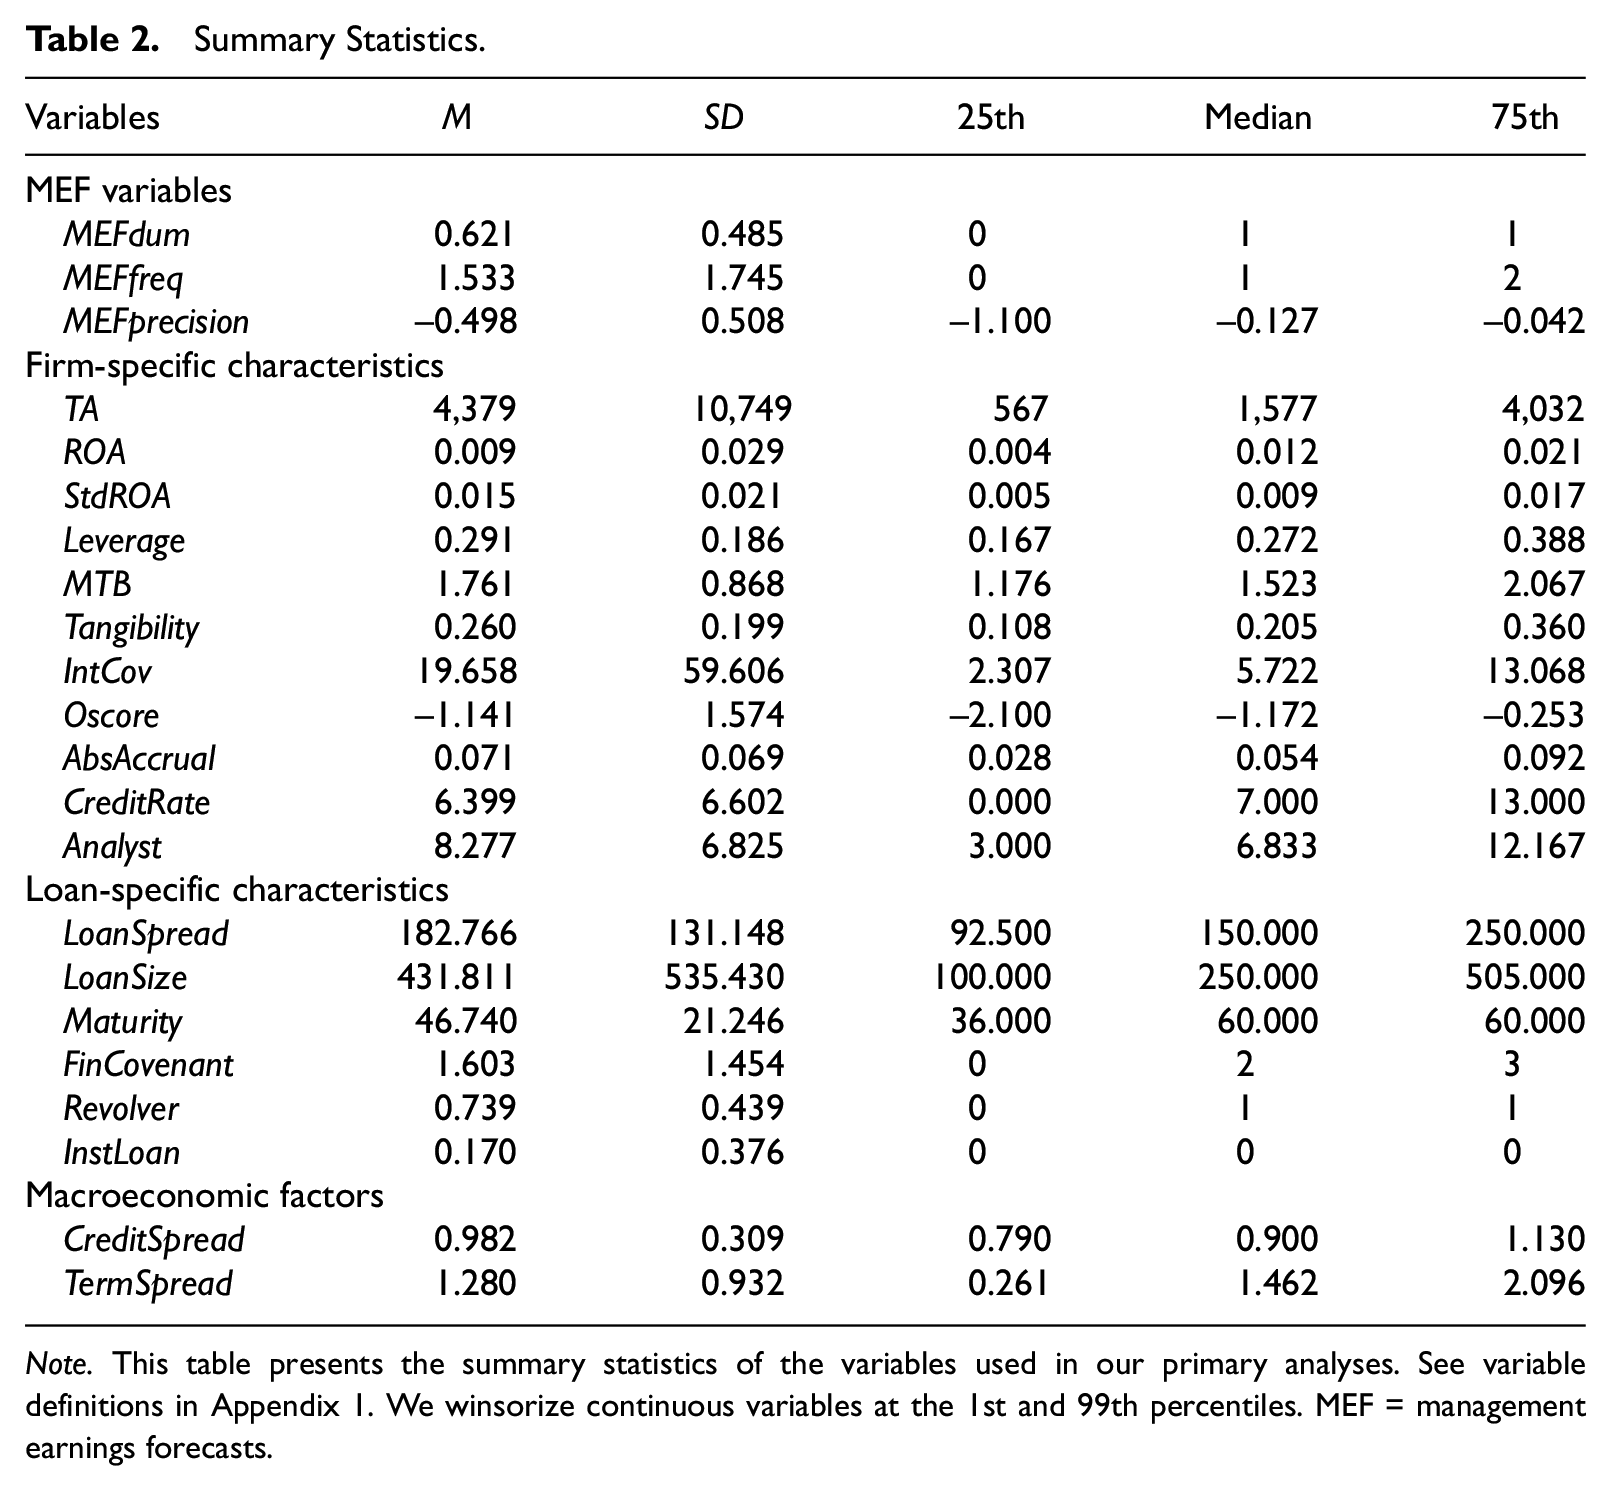
Note. This table presents the summary statistics of the variables used in our primary analyses. See variable definitions in Appendix 1. We winsorize continuous variables at the 1st and 99th percentiles. MEF = management earnings forecasts.
Dhaliwal et al. (2011) use a categorical variable to measure forecast precision and set the variable to 3 for point estimates, 2 for range estimates, 1 for other estimates, and 0 for firms without an MEF. During our sample period, approximately 81% of MEFs are range estimates, so using one value for all range forecasts appears crude. We refine Dhaliwal et al.’s measure by using forecast width. We set forecast width to 0 for point estimates and compute the width of range estimates as the difference between the upper- and lower-bound estimates scaled by the absolute value of their midpoint. For ease of interpretation, we define precision as forecast width multiplied by −1 so that a higher value indicates greater precision. For a firm-loan observation, forecast precision, MEFprecision, is the mean precision value of all outstanding MEFs in point or range format issued in the negotiation stage. Untabulated results show that our sample mean (median) of MEFprecision for firm-loans with at least one point or range outstanding MEF in the negotiation stage is −0.091 (−0.050) and the maximum (minimum) value is 0 (−1.0).
We cannot calculate MEFprecision for 2,419 firm-loan observations (40.4% of the sample). In this group, 2,271 observations do not have an outstanding MEF in the negotiation stage and the remaining 148 observations have at least one outstanding MEF but not in point or range format. To avoid losing these observations, we set the value of MEFprecision for these observations to −1.1, just below the minimum value of MEFprecision for firm-loans that have a point or range forecast. This assignment is similar to the research design choices in Dhaliwal et al. (2011), who set the value of their categorical precision measure to 0 for observations without any MEF. After this assignment, the mean (median) value of MEFprecision is −0.498 (−0.127).
MEF Properties and Loan Pricing
Research Design
We use Equation 1 to test the relation between MEF properties in the loan negotiation stage and loan spreads. The dependent variable is the natural logarithm of loan spread. The explanatory variables are the MEF variables: MEFdum, MEFfreq, and MEFprecision.

Following Bharath et al. (2008) and Graham et al. (2008), we include three sets of control variables: firm characteristics, loan features, and macroeconomic factors (see Appendix 1 for variable definitions). We control for firm characteristics that are associated with default risk or expected loss recovery given default. The variables include firm size (Size), profitability (ROA), earnings volatility (StdROA), financial structure (Leverage), market-to-book ratio (MTB), asset tangibility (Tangibility), interest coverage (IntCov), financial distress (Oscore), and S&P credit rating for the issuer (CreditRate). 12 All the variables except Oscore are measured at the end of the most recent fiscal quarter before loan origination. We measure financial distress (Oscore) using the accounting information for the most recent fiscal year preceding loan origination and the formula provided by Ohlson (1980). A higher Oscore indicates greater financial distress risk and a lower ability to honor financial obligations.
The firm characteristics also include accruals quality (AbsAccrual) measured at the end of the most recent fiscal year preceding loan origination. AbsAccrual is the absolute value of the residual from the accruals model estimated in an industry panel data set with firm fixed effects and year fixed effects (Kothari et al., 2016). The firm fixed effects allow a firm’s accruals to deviate from the industry norm because of its unique operations without being flagged. A higher value of AbsAccrual indicates lower accounting reporting quality. In addition, we control for analyst coverage because analysts can turn private information into public information, helping reduce loan spreads, and may demand MEFs for their own earnings forecasting.
The loan-features variables include loan size (Log[LoanSize]), maturity (Log[Maturity]), number of financial covenants (FinCovenant), loan type (Revolver and InstLoan), and loan purpose. 13 Revolver loans (Revolver) are often priced at lower interest rates, whereas institutional term loans (InstLoan) are riskier, have more severe agency problems, and are priced at higher interest rates (Costello & Wittenberg-Moerman, 2011). Loan purpose may be a signal of loan risk. We follow Sufi (2007) and aggregate loan purposes into five categories: (1) general corporate purpose and working capital, (2) takeover and acquisition, (3) debt repayment, (4) commercial paper backup, and (5) all others. We control for loan purposes by including their fixed effects.
Macroeconomic conditions, especially market-wide default risk, may affect individual loan pricing (Graham et al., 2008) and firms’ decisions to issue MEFs (Kim et al., 2016). We include credit spread (CreditSpread) and term spread (TermSpread). Credit spread is the difference between the yields of BAA- and AAA-rated corporate bonds. Because lenders require a higher premium for increased default risk in bad economic times, credit spreads tend to widen in recessions and shrink in expansions. Term spread is the difference between the 10-year and 2-year U.S. Treasury yields and reflects investors’ expectations of future interest rates. We collect data from the Federal Reserve Board of Governors and construct the variables in the most recent month preceding loan origination.
Finally, we include industry fixed effects to account for industry factors in raising capital and include year fixed effects to account for credit supply variation. We use the Fama and French 48-industry classifications and cluster standard errors by firm in regression estimations.
Primary Results
Table 2 presents descriptive statistics of the variables used in Equation 1. The average sample firm owns $4,379 million in total assets; reports a return on assets of 0.009; funds 29.1% of total assets using debt; and has a market-to-book ratio of 1.761, PPE intensity of 26.0%, interest coverage ratio of 19.658, Ohlson’s (1980) O-score of −1.141, and absolute abnormal accrual of 0.071. The mean value of credit rating is 6.399, which falls between CCC+ and B−. If we exclude firms without S&P credit ratings, the mean value of credit rating is 12.47, a rating between BBB− and BB+ (untabulated). The average sample firm is followed by approximately eight analysts. 14 Compared with the average Compustat firm, our sample firms are much larger (4,379 vs. 1,050 million in TA) and less levered (0.291 vs. 0.452 in Leverage), and they perform better (0.009 vs. −0.152 in ROA). We provide pairwise correlations in Online Appendix. The three MEF variables are highly correlated with one another. All three MEF variables are negatively correlated with loan spreads.
Figure 1 illustrates univariate comparisons. In Panel A, we separate firm-loan observations with a value of 0 for MEFdum from those with a value of 1. The mean (median) loan spread is 207.251 (175.000) bps for firms without any outstanding MEF in the negotiation stage, but 167.817 (150.000) bps for firms with an outstanding MEF. The former group bears significantly higher costs of debt than the latter group. In Panel B, we partition the sample into three subsamples based on MEFfreq. We classify firms with a value of 0 for MEFfreq as “low” and sort the remaining observations into “medium” (below or equal to the median) and “high” (above the median) groups based on these observations’ median value of MEFfreq each year. The mean (median) loan spread is 207.251 (175.000) bps, 176.986 (150.000) bps, 154.428 (125.000) bps for the three subsamples, respectively, and the differences between consecutive subsamples are statistically significant. In Panel C, we partition the sample into three subsamples based on MEFprecision. We classify firms without any point or range outstanding MEF in the negotiation stage as “low” and the remaining observations as “medium” (below or equal to the median) or “high” (above the median) based on these observations’ median value of MEFprecision each year. The mean (median) loan spreads is 205.358 (175.000) bps, 183.897 (150.000) bps, 150.886 (125.000) bps for the three subsamples and the differences between consecutive subsamples are statistically significant.

MEFs and loan pricing—subsample comparisons: Panel A, Loan spreads of firms with versus without MEFs; Panel B, Loan spreads of firms with low, medium, and high MEF frequency; Panel C, Loan spread of firms with low, medium, and high MEF precision.
The first three columns of Table 3 report the ordinary least squares (OLS) estimations of Equation 1. 15 In Column 1, the coefficient on MEFdum is significantly negative (coef. = −0.054; t = −3.40). Because the dependent variable is log transformed, this coefficient means that the average loan interest rate paid by firms with an outstanding MEF in the negotiation stage is 94.7% (exp[−0.054] = 0.947) of the average loan interest rate paid by firms without an outstanding MEF. The difference means that the former firms pay interest rates 11.0 bps lower than the rates paid by the latter firms, translating into $0.475 million of annual savings in interest payments. 16 This benefit is economically significant and comparable to the magnitude of interest saving in prior research. For example, Saunders and Steffen (2011) find that public firms incur $0.64 million lower annual loan interest charges than private firms.
MEFs and Loan Pricing—Levels Analyses.
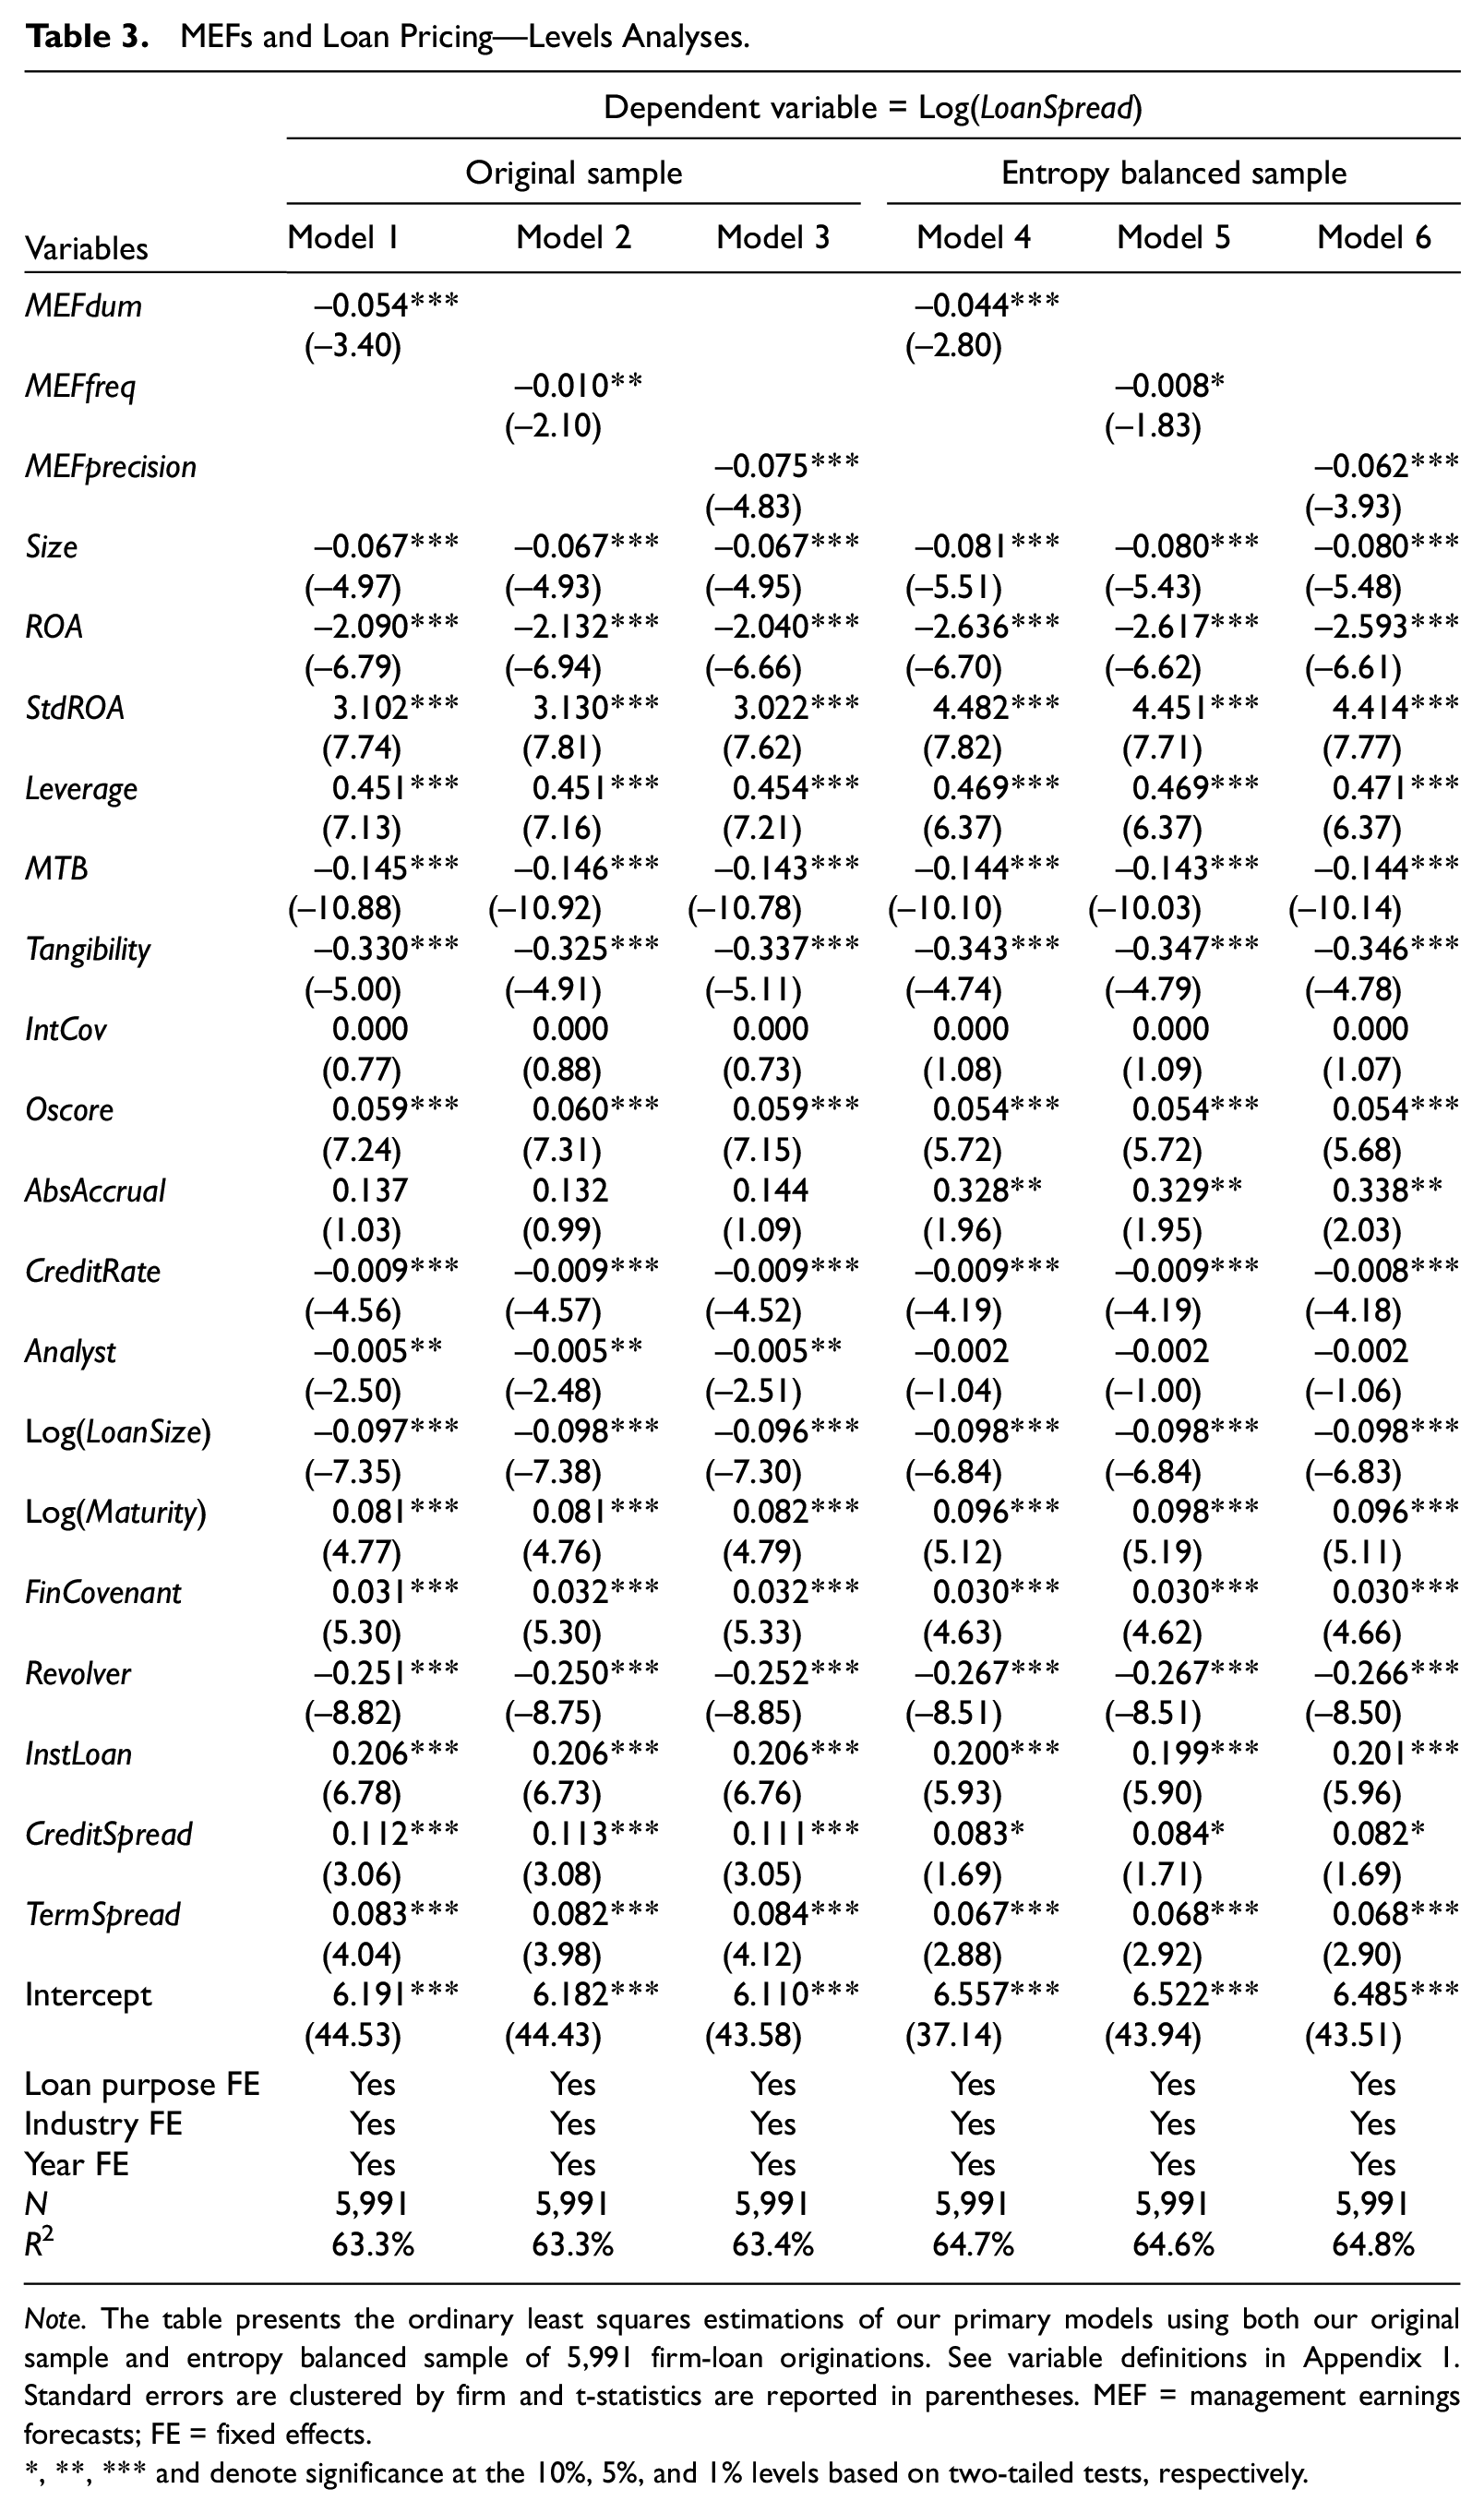
Note. The table presents the ordinary least squares estimations of our primary models using both our original sample and entropy balanced sample of 5,991 firm-loan originations. See variable definitions in Appendix 1. Standard errors are clustered by firm and t-statistics are reported in parentheses. MEF = management earnings forecasts; FE = fixed effects.
, **, *** and denote significance at the 10%, 5%, and 1% levels based on two-tailed tests, respectively.
In Column 2, the coefficient on MEFfreq is −0.010 (t = −2.10). This coefficient means that if a firm provides one more MEF in the negotiation stage, on average its loan interest rate becomes 99.0% (exp[−0.010] = 0.990) of the rate level before issuing the additional MEF. The difference means an interest rate 1.8 bps (full-sample mean 182.766 × [1 − 0.990] = 1.8) lower, equivalent to $0.078 million ($432 × 0.00018 = $0.078) of annual interest savings.
In Column 3, the coefficient on MEFprecision is significantly negative at −0.075 (t = −4.83). Recall that MEFprecision is 0 for firms with outstanding MEFs in point estimates and −1.1 for firms without any point or range outstanding MEF in the negotiation stage. This coefficient means that, on average, the loan spread of the former firms is 92.1% (exp[−0.075 × 1.1] = 0.921) of that of the latter firms. The difference—16.2 bps (205.358 × (1 − 0.921) = 16.2) lower interest rate—translates into $0.700 million ($432 × 0.00162 = $0.700) of annual interest savings. 17
The estimation results for the control variables are consistent with our expectations. We find that larger firms, firms with higher growth options, and less-levered firms have smaller loan spreads. Firms with more tangible assets that could serve as collateral enjoy lower spreads. Firms that generate more operating income and are therefore better able to service their debt obligations enjoy lower spreads. Firms with higher earnings volatility and therefore greater uncertainty incur higher loan costs. Higher financial distress risk is associated with higher loan spreads; firms with higher credit ratings enjoy lower spreads. Regarding loan features, loan size is negatively associated with loan spread. The coefficient on loan maturity is significantly positive, indicating that lenders demand a risk premium for loans with longer maturities. The positive coefficient on the number of financial covenants is consistent with the idea that lenders tend to include such covenants for riskier loans. These results suggest that several loan features go hand in hand: riskier loans bear higher interest rates, have smaller loan amounts, and have more financial covenants. 18
Despite our effort in addressing selection bias, our sample firms with outstanding MEFs in the negotiation stage (treatment firms) still differ from those without any outstanding MEF (control firms) in most of our covariates. The imbalanced covariates may result in a biased estimate of the treatment effect. To further address selection bias, we use entropy balancing to achieve covariate balance (Hainmueller, 2012). As suggested by Hainmueller and Xu (2013), we impose the constraint that after reweighting, the control firms’ covariates have the same first moments as the treatment firms’ covariates. The technique produces a weight for each control observation; 77.6% of the weights are in the interval of [0.5, 1.5], 7.2% are less than 0.5, 7.7% are in the interval of [1.5, 2.5], and 7.5% are greater than 2.5. Then we estimate weighted least squares regressions and report the results in the last three columns of Table 3. The coefficients on MEFdum and MEFprecision remain significantly negative and the coefficient on MEFfreq is now weakly significantly negative. From now on, we report results based on the original sample; our results using the entropy balanced sample are similar.
In sum, we find that the issuance, frequency, and precision of MEFs provided in the loan negotiation stage that are still outstanding at the time of loan origination are significantly negatively associated with loan spreads. The effect of MEFs on loan pricing is economically meaningful.
Changes Analyses
To mitigate the concern that our inferences from estimating Equation 1 might be affected by omitted correlated variables, we now estimate the changes version of Equation 1 to purge the effects of time-invariant variables, including those observable and those unobservable. For the changes version of each variable, we subtract from the value of the current firm-loan observation the value of the most recent loan origination observation for the same firm in the [−36, −6] month window. We require the previous loan to be at least 6 months before the current loan because we measure MEF variables in a 6-month window. We limit the previous loan to be within 36 months of the current loan to reduce the chance that omitted correlated variables have undergone substantial changes by the time of the current loan origination. 19
We report the estimations of the changes regression in Table 4. The coefficients of −0.052 on ΔMEFdum (t = −2.74), −0.013 on ΔMEFfreq (t = −2.49), and −0.068 on ΔMEFprecision (t = −3.80) are all significantly negative, suggesting that lenders react favorably to a firm’s improved MEF activity.
MEFs and Loan Pricing—Changes Analyses.
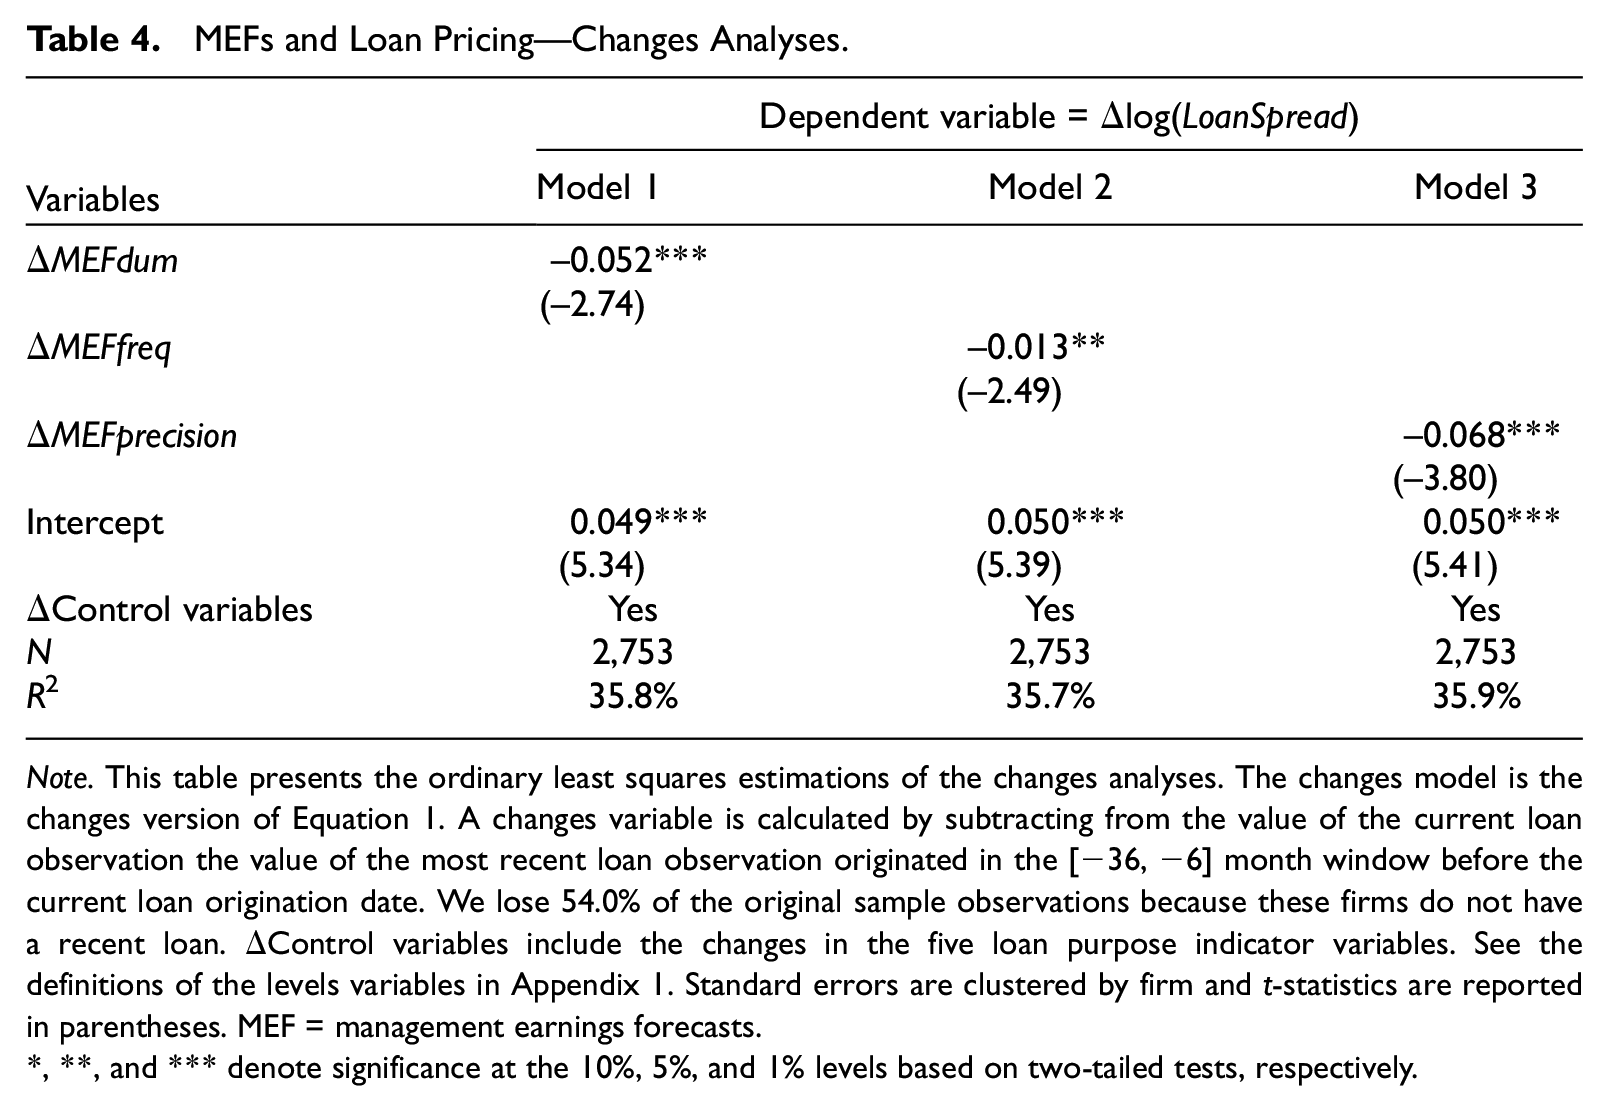
Note. This table presents the ordinary least squares estimations of the changes analyses. The changes model is the changes version of Equation 1. A changes variable is calculated by subtracting from the value of the current loan observation the value of the most recent loan observation originated in the [−36, −6] month window before the current loan origination date. We lose 54.0% of the original sample observations because these firms do not have a recent loan. ΔControl variables include the changes in the five loan purpose indicator variables. See the definitions of the levels variables in Appendix 1. Standard errors are clustered by firm and t-statistics are reported in parentheses. MEF = management earnings forecasts.
, **, and *** denote significance at the 10%, 5%, and 1% levels based on two-tailed tests, respectively.
Cross-Sectional Variation Analyses
We explore three scenarios in which lenders’ need for corroborating private information is greater and thus the effects of MEFs on loan spreads are expected to be more pronounced. The first scenario relates to borrowers’ financial distress risk. When firms have high distress risk based on reported financial information, they face more uncertainty and may resort to private channels with current and future lenders to communicate this uncertainty. Lenders’ need for corroboration is arguably higher in this situation, so MEFs are expected to play a greater role.
To facilitate interpreting the interaction terms, we create a dummy, DistressRisk, from Oscore. DistressRisk is 1 for a firm-loan observation if the firm’s Oscore is above the median value of all sample observations in the same fiscal year and 0 otherwise. We estimate four variants of Equation 1: the first one has DistressRisk as the variable of interest without the MEF variables and the other three include DistressRisk and its interaction term with the three MEF variables one at a time. Panel A of Table 5 reports the estimation results.
MEFs and Loan Pricing—Cross-Sectional Analyses.
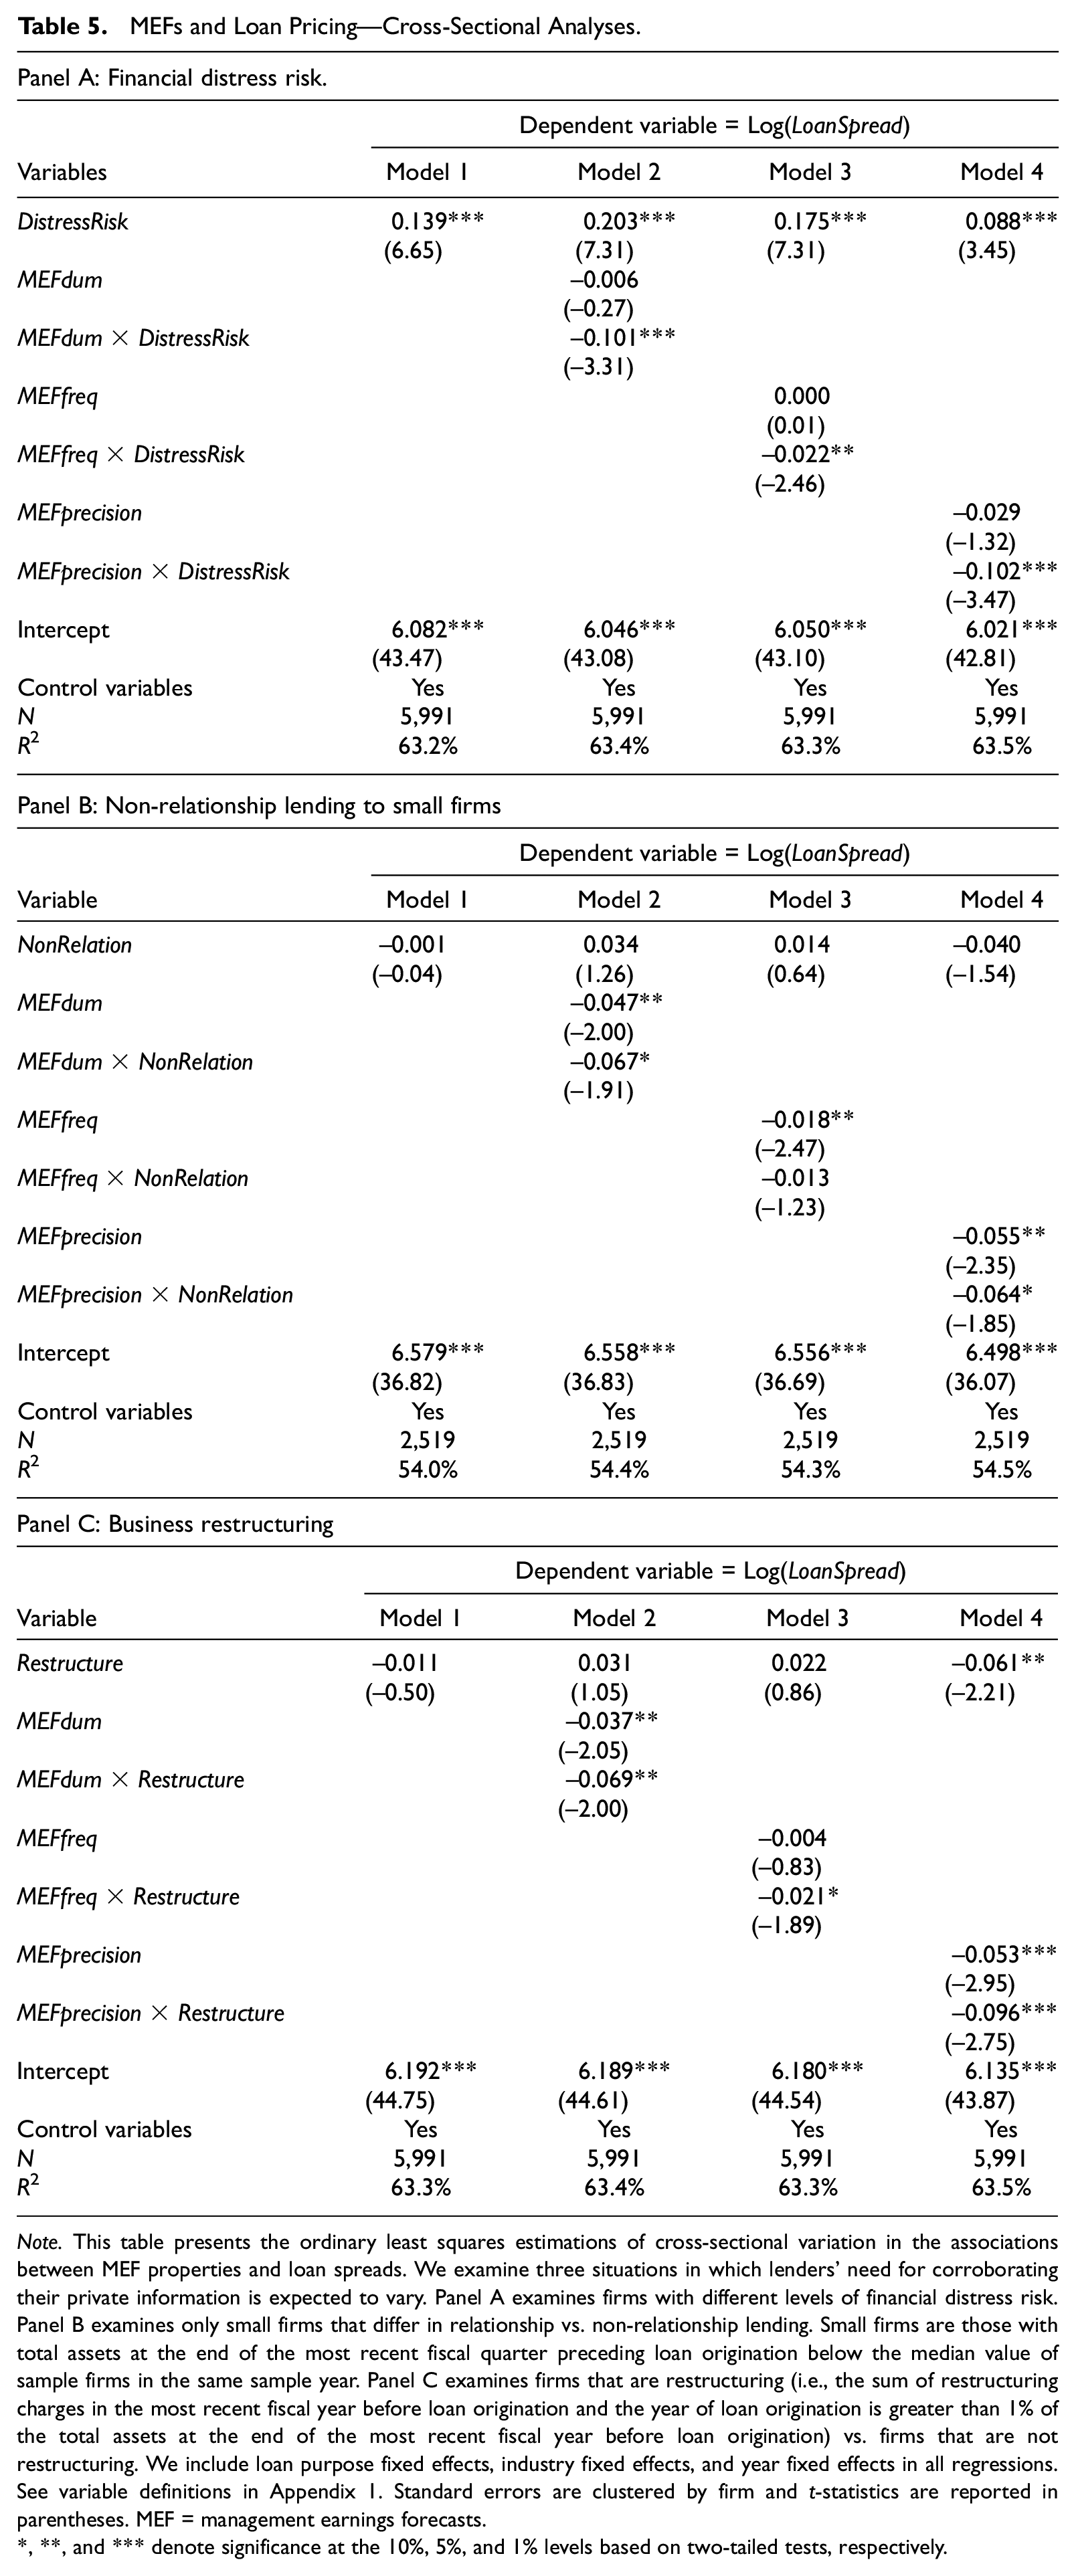
Note. This table presents the ordinary least squares estimations of cross-sectional variation in the associations between MEF properties and loan spreads. We examine three situations in which lenders’ need for corroborating their private information is expected to vary. Panel A examines firms with different levels of financial distress risk. Panel B examines only small firms that differ in relationship vs. non-relationship lending. Small firms are those with total assets at the end of the most recent fiscal quarter preceding loan origination below the median value of sample firms in the same sample year. Panel C examines firms that are restructuring (i.e., the sum of restructuring charges in the most recent fiscal year before loan origination and the year of loan origination is greater than 1% of the total assets at the end of the most recent fiscal year before loan origination) vs. firms that are not restructuring. We include loan purpose fixed effects, industry fixed effects, and year fixed effects in all regressions. See variable definitions in Appendix 1. Standard errors are clustered by firm and t-statistics are reported in parentheses. MEF = management earnings forecasts.
, **, and *** denote significance at the 10%, 5%, and 1% levels based on two-tailed tests, respectively.
In Column 1, DistressRisk alone has a positive coefficient, suggesting that loan spreads are higher for firms at high distress risk than for firms at low distress risk. In the remaining columns, the main effects of the MEF variables are not significantly different from zero, suggesting that MEFs do not affect the loan spreads of firms at low financial distress risk. In contrast, the sum of coefficients of the main effect and interaction effect is significantly negative across the three MEF variables (untabulated), suggesting that MEFs affect the loan spreads of firms at high financial distress risk. In other words, the negative associations between MEFs and loan spreads exist only for borrowers at high financial distress risk. Moreover, the interaction terms between DistressRisk and the MEF variables are all significantly negative, suggesting that the effects of MEFs on loan spreads are significantly stronger for borrowers at high financial distress risk than for other firms.
Second, we examine whether the associations between MEFs and loan spreads are stronger for non-relationship lending than for relationship lending. Although all lead arrangers bidding for a loan have access to a borrower’s private information upon signing the confidentiality agreement, those who already have a lending relationship with the borrower have extensive, customer-specific soft information (Bharath et al., 2009). As a result, there is less uncertainty in the private communication between borrowers and relationship lenders and, therefore, the latter may have a lesser need to corroborate their private information. Prior research finds that the benefits of relationship lending are greater for small firms than for large firms (Bharath et al., 2009; Chen & Martin, 2011). To sharpen our tests, we focus on the 2,519 loans issued to small firms, defined as those with total assets below the median value each year, that have available data. We define a loan as a non-relationship loan (NonRelation is 1) if the lead arranger did not serve as lead arranger of any loan to the firm in the 5 years preceding current loan origination and as a relationship loan (NonRelation is 0) otherwise Bharath et al. (2009). In this sample, 1,142 are non-relationship loans.
Panel B of Table 5 reports that the MEF variables are negatively associated with loan spreads for both relationship loans and non-relationship loans (sum-of-coefficient tests untabulated). The negative associations between MEFdum and loan spreads and between MEFprecision and loan spreads are marginally stronger for non-relationship loans than for relationship loans; the negative association between MEFfreq and loan spreads is not significantly different between relationship and non-relationship loans. Thus, we find some evidence that MEFs have a stronger effect on non-relationship loans than relationship loans among small firms.
The last scenario relates to business restructuring. Restructuring often involves reorganizing corporate structure and downsizing various divisions. The changing corporate structure and business arrangements make it difficult for lenders to assess a firm’s prospects. Moreover, financial reporting for restructuring uses many estimates, such as the costs of laying off employees and goodwill impairment. Thus, restructuring generates increased uncertainty in the private communication between borrowers and lenders and we expect a greater need for lenders to corroborate their private information.
Restructure is 1 if the sum of restructuring charges in the most recent fiscal year before loan origination and in the year of loan origination is more than 1% of the total assets at the end of the most recent year before loan origination and 0 otherwise (Doyle et al., 2007). In our sample, 1,453 (24.3%) have a value of 1 for Restructure. We conduct four tests and report them in Panel C. MEFdum and MEFprecision are significantly negatively associated with loan spreads for firms without restructuring. All three MEF variables are significantly negatively associated with loan spreads for restructuring firms (sum-of-coefficient tests untabulated). More importantly, the effects of MEFdum and MEFprecision on loan spreads are significantly stronger and the effect of MEFfreq is weakly significantly stronger for restructuring firms than for other firms.
The consistent evidence in the three scenarios indicates that MEF activity in the negotiation stage has a stronger effect on loan spreads when lenders have a greater need to corroborate their private communication. The results better our understanding of the channel through which MEFs affect loan spreads and also help address the omitted variables concern because those variables are unlikely to induce predicted variation in the association across different subsamples.
Alternative Explanations
We address four alternative explanations and provide the test results in Online Appendix.
A Firm’s General Information Environment
An alternative explanation for the negative association between MEFs and loan spreads is that firms with richer information environments enjoy lower loan spreads because of lower information asymmetry and these firms are more likely to issue MEFs and provide more precise MEFs in the negotiation stage. We directly control for information environment. Following Carrizosa and Ryan (2017), we use InfAsymmetry to proxy for the overall information asymmetry between a firm’s insiders and outsiders. The variable is the common factor from the principal component analysis of inverse firm age, bid-ask spread, and stock return volatility. As expected, higher information asymmetry is associated with higher loan spreads. After controlling for InfAsymmetry, the coefficients on MEFdum and MEFprecision remain significantly negative and the coefficient on MEFfreq is weakly significantly negative, suggesting that our primary findings are not driven by a borrower’s general information environment.
Moreover, if the issuance of MEFs signals a firm’s transparent information environment, the MEF effect on loan spreads should be independent of whether MEFs are outstanding or realized at the time of loan origination. We use Hsieh et al.’s (2019) measurement window and create a dummy variable that equals 1 if a firm issues MEFs in the 9-month window before the beginning of the fiscal quarter of loan origination but none of the MEFs are outstanding at loan origination. We add this variable to Equation 1 and this variable does not load at all, whereas MEFdum remains significantly negative (untabulated).
Managerial Ability Signaling
Demerjian et al. (2020) find that the accuracy of realized MEFs issued in the 3 years before loan origination is negatively associated with loan spreads and argue that forecast accuracy signals managerial ability. We measure the accuracy of MEFs (in point or range format) that are realized in the 24 months preceding loan origination. The accuracy of each individual forecast is calculated as −1 times the absolute difference between the actual EPS and forecasted EPS, scaled by the absolute value of actual Earnings per Share (EPS). 20 For a firm-loan observation with multiple realized MEFs in this window, we use the mean value of accuracy of all MEFs and call the variable MEFaccuracy. This variable is available for 5,237 firm-loan observations. We add MEFaccuracy to Equation 1 and the coefficient on MEFaccuracy is significantly negative in Column 1, consistent with Demerjian et al. (2020). After controlling for MEFaccuracy, the coefficients on MEFdum and MEFprecision are still significantly negative and the coefficient on MEFfreq is weakly significantly negative, suggesting that outstanding MEFs have distinct effects from realized MEFs.
Borrowers’ Disclosure Opportunism
We conduct two tests to examine whether the association between MEFs and loan spreads is due to borrowers’ opportunistic disclosure of good news. First, we additionally control for the news in MEFs issued in the negotiation stage in Equation 1. Forecast news for each MEF is calculated as the difference between the point estimate or the upper bound of range estimate and the most recent analyst consensus before MEF issuance, scaled by the absolute value of the consensus. For 246 firm-loans without analyst coverage, we use realized EPS for the previous year as the benchmark for annual MEFs and use realized EPS in the same fiscal quarter in the previous year as the benchmark for quarterly MEFs. If a firm provides more than one outstanding MEF in the negotiation stage, we aggregate forecast news. In an untabulated analysis, we find that MEF news does not have any explanatory power for loan spreads, suggesting that MEFs do not provide cash flow news to lenders.
Next, we condition the association between MEFs and loan spreads on forecast news. If cash flow news of MEFs—good news in particular—drives the negative relation between MEFs and loan spreads, we should observe a more salient effect of MEFs for firms issuing good-news MEFs. On the other hand, if reduced information risk explains our results, then the effect of MEFs should not depend on MEF news. We segregate firm-loans with non-missing values of MEF news into a good-news subgroup and a bad-news subgroup and estimate Equation 1 on two subsamples: (a) good-news subgroup pooled with observations lacking MEFs and (b) bad-news subgroup pooled with observations lacking MEFs. The coefficients on MEFdum, MEFfreq, and MEFprecision are significantly negative for all models except for being insignificant for MEFfreq in the first subsample. These results suggest that the effects of MEFs generally do not depend on news type. We conclude that the disclosure opportunism explanation is not supported by our data.
Competition Between Public and Private Debt Markets
MEFs may help firms attract public sources of capital (Lo, 2014). Elevated competition between public debt and private debt markets may drive down the interest rates for private debt. To examine whether this channel explains our primary findings, we separate our sample into firms with access to public debt markets and firms without this access. A firm is viewed as having access to public debt if it has a credit rating from S&P (Cantillo & Wright, 2000; Ljungqvist et al., 2006). We estimate Equation 1 on the subsample of 2,916 firms that do not have access to public debt and find significantly negative coefficients on all three MEF variables. Thus, our primary findings are not driven by the competition between public and private debt markets.
MEF Properties and Information Asymmetry Within a Loan Syndicate
We proxy for information asymmetry within a loan syndicate by the lead arranger’s share of the loan amount (LeadShare) and the concentration ratio of the loan amounts allocated to all participating lenders (SynConcentration) (Sufi, 2007). We have 1,770 syndicated loans with available data to calculate LeadShare and SynConcentration. 21 More than half of these loans (53.3%) have one lead arranger, 28.3% have two lead arrangers, and the remaining 18.4% have more than two lead arrangers. For loans with more than one lead arranger, we sum the loan shares retained by all lead arrangers to calculate LeadShare. The mean values of LeadShare and SynConcentration are 0.363 and 0.201, respectively.
We estimate a variant of Equation 1 with LeadShare and SynConcentration as the dependent variables. When LeadShare is the dependent variable, the coefficients on MEFdum and MEFfreq are significantly negative and the coefficient on MEFprecision is weakly significantly negative (see Panel A of Table 6). When SynConcentration is the dependent variable, the coefficients on MEFdum and MEFfreq are significantly negative and the coefficient on MEFprecision is not significantly different from zero (see Panel B). These findings suggest that MEF activity in the loan negotiation stage reduces information asymmetry within a syndicate.
MEFs and Information Asymmetry Within a Loan Syndicate.
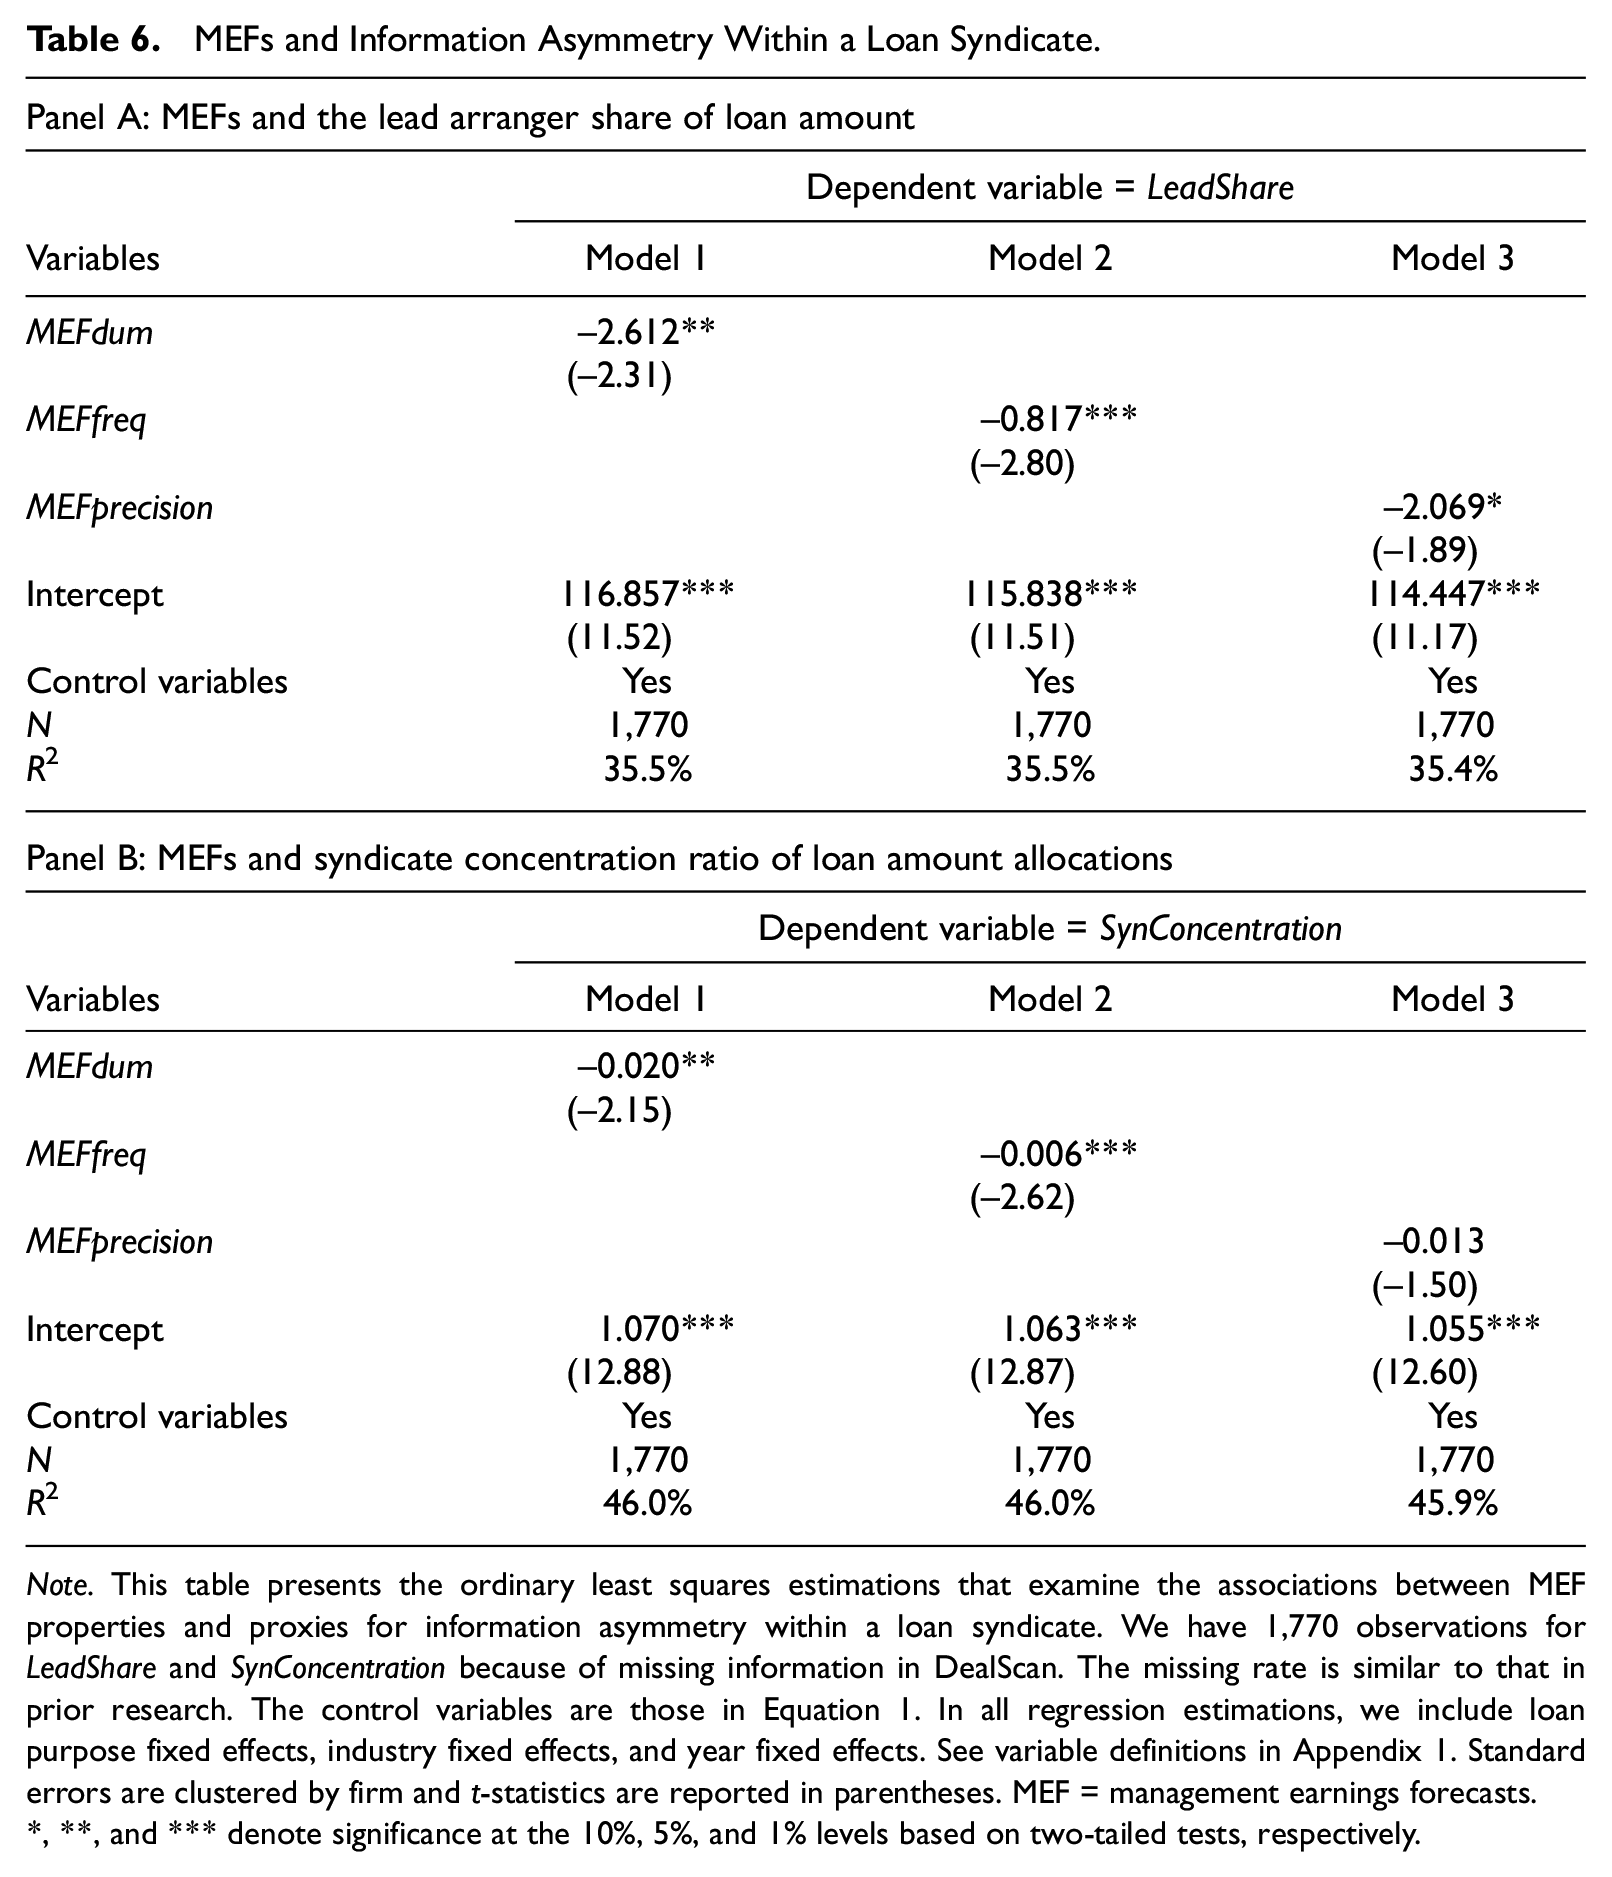
Note. This table presents the ordinary least squares estimations that examine the associations between MEF properties and proxies for information asymmetry within a loan syndicate. We have 1,770 observations for LeadShare and SynConcentration because of missing information in DealScan. The missing rate is similar to that in prior research. The control variables are those in Equation 1. In all regression estimations, we include loan purpose fixed effects, industry fixed effects, and year fixed effects. See variable definitions in Appendix 1. Standard errors are clustered by firm and t-statistics are reported in parentheses. MEF = management earnings forecasts.
, **, and *** denote significance at the 10%, 5%, and 1% levels based on two-tailed tests, respectively.
Conclusion
Although loans are the principal source of external funds to U.S. firms, it is unclear whether MEFs—the most common type of corporate voluntary disclosure—matter in loan markets and how. The paucity of evidence is probably due to the long-held view that private lenders have substantial access to borrowers’ private information and therefore have no need for MEFs. We argue that MEFs may reduce information risk by corroborating the inferences that lenders draw from their private communication with borrowers. We find that MEFs issued in the loan negotiation period and still outstanding at the time of loan origination are associated with lower loan spreads and that this association is stronger when lenders’ need for corroboration of their private information is expected to be greater. We also find these MEFs are associated with loan amounts more spread out among participating lenders. Our study provides insight into the corroboration role of publicly disseminated MEFs in private loan markets.
Supplemental Material
sj-docx-1-jaf-10.1177_0148558X221102218 – Supplemental material for The Corroboration Role of Management Earnings Forecasts in Private Loan Markets
Supplemental material, sj-docx-1-jaf-10.1177_0148558X221102218 for The Corroboration Role of Management Earnings Forecasts in Private Loan Markets by Xinghua Gao, Yonghong Jia, Nicholas R. Krupa and Jennifer Wu Tucker in Journal of Accounting, Auditing & Finance
Footnotes
Appendix
Variable Definitions.

|
|
||
| MEFdum | = | 1 if the sample firm issues an MEF in the 6 months preceding the loan origination date and the forecasted period ends after the loan origination date (referred to as an “outstanding MEF”) and 0 otherwise. The 6 months preceding the loan origination date is referred to as the “loan negotiation stage.” |
| MEFfreq | = | the number of outstanding MEFs. |
| MEFprecision | = | the average precision score of outstanding MEFs. A precision score is forecast width multiplied by −1. Forecast width is set to 0 for point forecasts. For range forecasts, forecast width is the difference between the upper- and lower-bound estimates scaled by the absolute value of the midpoint. The minimum value of MEFprecision for our firm-loan observations that have an outstanding MEF in a point or range format is −1. For the firm-loan observations that do not have an outstanding MEF in a point or range format, we set the value of MEFprecision at −1.1 to preserve these observations. |
|
|
||
| TA | = | total assets (ATQ) in millions of dollars. |
| Size | = | the natural logarithm of TA. |
| ROA | = | operating income after depreciation (OIADPQ) divided by TA. |
| StdROA | = | the mean of the absolute seasonal difference in ROA (i.e., ROA in a quarter minus ROA in the same quarter in the previous year) for the most recent 12 quarters before loan origination. We require a minimum of four seasonal differences to construct StdROA. |
| Leverage | = | long-term debt (DLTTQ) plus short-term debt (DLCQ) divided by TA. |
| MTB | = | TA minus book value of equity (CEQQ) plus market value of equity (PRCCQ × CSHOQ) divided by TA (see Graham et al., 2008). |
| Tangibility | = | property, plant, and equipment (PPENTQ), scaled by TA. |
| IntCov | = | operating income after depreciation (OIADPQ) divided by interest expense (XINTQ). |
| Oscore | = | Ohlson’s (1980) O-score, calculated using the following formula: Oscore = −1.32 − 0.407 × log(AT / PPI) + 6.03 × (LT/AT) − 1.43 × ((ACT − LCT) / AT) + 0.0757 × (LCT / ACT) −1.72 × X − 2.37 × (NI / AT) − 1.83 × (OANCF / LT) + 0.285 × Y − 0.0521 × ((NIt− NIt − 1) / (abs(NIt) + abs(NIt − 1)), where all variables are from the most recent fiscal year (t) preceding loan origination; PPI is price index; X = 1 if LT > AT and 0 otherwise; and Y = 1 if the total of NI for years t and t− 1 is negative and 0 otherwise. A higher value of Oscore indicates greater financial distress risk. |
| CreditRate | = | an ordinal coding of Standard & Poor’s issuer-level credit ratings that ranges from 0 to 22. We set CreditRate to 0 for firms without a rating, 1 for firms with the lowest rating, and 22 for firms with the highest rating. The ratings data are from Capital IQ S&P Credit Ratings. |
| AbsAccrual | = | absolute value of the residual of the following regression estimated using the industry (2-digit SIC) panel data set for all Compustat firms over the period of 1995 to 2016: TotAccrualst = d0+ d1(1/ATt − 1) + d2(△REVt−△ARt) + d3PPEt+ d4Earnt − 1+ firm fixed effects + year fixed effects +ϵt, where TotAccruals is the difference between earnings and operating cash flow (IBC − (OANCF − XIDOC)) scaled by lagged total assets; △REVt−△ARt is the change in revenue (SALE) minus the change in accounts receivable (RECCH) scaled by lagged total assets; PPE is property, plant, and equipment (PPNET) scaled by lagged total assets; and Earn is earnings before extraordinary items (IB) divided by lagged total assets. We use three more years before the beginning of our sample period to have a longer panel for estimation. AbsAccrual is measured for the most recent fiscal year preceding loan origination. |
| Analyst | = | the monthly mean number of analysts who provide annual earnings forecasts for the firm in the loan negotiation period according to IBES’s summary data file. |
|
|
||
| LoanSpread | = | the interest rate that a borrower pays over LIBOR in basis points (bps). |
| LoanSize | = | loan amount in millions of dollars. |
| Maturity | = | loan maturity measured in months. |
| FinCovenant | = | the number of financial covenants. We follow Costello and Wittenberg-Moerman (2011) and set the variable to 0 when a loan is not subject to any financial covenants. |
| Revolver | = | 1 if the loan’s type is a revolver loan (line of credit) and 0 otherwise. |
| InstLoan | = | 1 for institutional loans if the loan’s type is Term Loan B or below (C, D, E, and F) and 0 otherwise. |
|
|
||
| CreditSpread | = | the difference between the yields of BAA- and AAA-rated corporate bonds. |
| TermSpread | = | the difference between the yields of 10- and 2-year U.S. treasury bills. |
|
|
||
| DistressRisk | = | 1 if a firm’s Oscore for the most recent fiscal year preceding loan origination is above the median value of all sample observations in that fiscal year and 0 otherwise. |
| NonRelation | = | 1 if the lead arranger did not serve as lead arranger of any loan to the firm in the 5-year period preceding loan origination and 0 otherwise. Source: DealScan. |
| Restructure | = | 1 if the sum of restructure charges (RCP) in the most recent fiscal year before loan origination and the year of loan origination divided by total assets at the end of the most recent year before loan origination is greater than 1% and 0 otherwise. Source: Compustat. |
| LeadShare | = | the percentage of loan amount held by the lead arranger. The lead arranger’s share is identified if the LeadArrangerCredit variable in DealScan is coded as “Yes” or the LenderRole variable is coded as “lead bank,”“lead manager,”“lead arranger,”“agent,”“bookrunner,”“arranger,” or “mandated lead arranger.” These two variables are from the LenderShares data file in DealScan. If a loan has more than one lead arranger, we sum the loan shares retained by all lead arrangers. |
| SynConcentration | = | the sum of the squared loan share of each lender in a syndicated loan. We use the variable BankAllocation in the LenderShares data file in DealScan to identify the share of the loan allocated to each participating bank. |
Note. MEF = management earnings forecasts; CIG = Company Issued Guidelines.
Acknowledgements
We thank Lin Cheng, Aloke Ghosh, Jeffrey Gramlich, Iftekhar Hasan, Chris James, Justin Kim, Joel Houston, Edward Li, Zhiming Ma, Carol Marquardt, Bharat Sarath (editor), Lakshmanan Shivakumar, Guner Velioglu, Philip Wang, Wentao Yao, Mark Zakota, Jigao Zhu, an anonymous reviewer, workshop participants at Beijing Institute of Technology, Peking University, University of Iowa, Baruch College, University of Hong Kong, and Fordham University, and conference participants of the Journal of Accounting, Auditing & Finance Conference in Jeju, South Korea (general submission for conference presentation) and 2020 American Accounting Association Annual Meeting. Jenny Tucker thanks the J. Michael Cook / Deloitte Professorship for financial support.
Declaration of Conflicting Interests
The author(s) declared no potential conflicts of interest with respect to the research, authorship, and/or publication of this article.
Funding
The author(s) received no financial support for the research, authorship, and/or publication of this article.

Supplemental Material
Supplemental material for this article is available online.
Notes
Author Biographies
References
Supplementary Material
Please find the following supplemental material available below.
For Open Access articles published under a Creative Commons License, all supplemental material carries the same license as the article it is associated with.
For non-Open Access articles published, all supplemental material carries a non-exclusive license, and permission requests for re-use of supplemental material or any part of supplemental material shall be sent directly to the copyright owner as specified in the copyright notice associated with the article.
