
Abstract
Although there is previous research on textual analysis in accounting, little is understood about the effects of the tone and sentiments of the text disclosed in annual report filings (10-K) on the investor assessment of the future performance of the firm. This study inks the tone and sentiments of the text disclosed in the corporate annual reports and expectations regarding the future performance of the firm. We focus on two specific sections of 10-K filings the risk factor disclosures (Item 1A) and the management’s discussion (Item 7) filling a gap in the accounting literature. There are two competing predictions regarding how the tone and sentiments of the text could impact the investor assessment about the future performance of the firm. First, the tone and sentiments of the text in Items 1A and 7 may have an effect on the investor assessment of the future performance of the firm. Second, only the tone and sentiments of Item 7 may have an effect on the investor assessment, given the fact that Item 1A only discusses the general risk factors that are present and not necessarily any specific risk factors to the firm. We find that only the tone and sentiments of the text in Item 7 has an effect on the investor assessment of the firm. This result helps explain the channels through which the tone and sentiments of the text impacts the future performance.
Introduction
Despite previous studies on textual analysis and performance, little is known about how the tone or sentiments of the text in Item 1A (Risk Factors) and Item 7 (Management’s Discussion and Analysis of Financial Condition and Results of Operations—MD&A) affect investor assessments of the future performance of the firm, and if so, which of the sections has more impact on the assessment. In studying the effects of these financial disclosures, this study does not just use a simple count of positive or negative words taken from a dictionary but goes beyond that to identify the positive, negative, uncertain, or litigious tone or sentiments of the text.
Shareholders want to ensure that their forward-looking assessment of the firm is accurate. Considering that annual reports over the years have become more textually complex and have longer text descriptions in addition to numerical disclosures (Rutherford, 2003; Yang et al., 2018), there is a shortage of empirical evidence documenting the effects of textual disclosures on investor assessments. This study analyzes the link between the tone and sentiments of the text and expectations regarding the future performance of a firm, filling a gap in the literature.
This study also contributes theoretically to the accounting literature by synthesizing theory from two streams into one model. One stream is the literature on textual analysis, and the other stream is the literature on beliefs regarding the future performance of a firm. With regard to the literature on textual analysis, previous studies in accounting and business, in general, have mostly used counts of negative and positive words taken from dictionaries of words to analyze press releases, opinion articles and analysts’ reports. A dictionary is a list of words created in one substantive area. In this study, we use Python scripts to extract and identify the tone and sentiments of two specific sections of corporate annual reports by analyzing four different dimensions using financial dictionaries: positive, negative, litigious, and uncertain. With regard to the literature on the future performance of firms, it is common practice in the accounting field that investors, managers, and shareholders use past and current accounting and financial variables and ratios to make decisions about future performance. Also, in general, financial statements provide incomplete information about the firm (Yang et al., 2018), and models enhanced with disclosures are more accurate than models based only on financial variables (Bochkay & Levine, 2019). Being able to provide another way to interpret annual reports and where to look in the annual report will help managers, investors, creditors, and shareholders when they look for specific future performance information. Moreover, can expectations regarding the future performance of a firm also be influenced by the tone and sentiments of the text of the annual report? Should firms be more careful wording their annual reports, given that investors may go beyond the typical financial and accounting ratios and dig deeper into the annual reports’ textual description and make decisions based on that? To answer these questions, we look specifically into Items 1A and 7 of the annual report.
We focus on Items 1A and 7 of the annual report because identifying risk factors satisfies the financial concerns of stockholders, suppliers, and clients. Also, identifying risk factors can convey important information regarding future operations of firms as well as the likely outcomes of these operations. Item 1A captures general risks, while Item 7 captures firm-specific situations of the firm. Item 7 usually contains a detailed discussion of the firms’ performance, market risk, results of operations, and estimates (Brown & Tucker, 2011). We compare and contrast the effects of the textual tone and sentiments from each section on the likely future performance of the firm. For instance, other studies have looked at general disclosures and have concluded that the tone of the disclosure can play a role in the future capital market environment of the firm (Kothari et al., 2009). In addition, a negative or positive tone or sentiment in Item 1A or Item 7 may have a corresponding negative or positive effect on expectations regarding the firms’ future performance.
Equally important, the presence of a negative, litigious, or uncertain tone or sentiment in either Item 1A or Item 7 of the annual report may motivate sophisticated investors to take advantage of the access to private information and profit from it. Also, the presence of a negative, litigious, or uncertain tone or sentiment may not necessarily mean bad news for the forward-looking performance of the firm. On the contrary, the firm may be just looking for a cheap form of insurance to protect itself from shareholders’ claims about potential future losses (Robins & Rothenberg, 2005). Considering this, Item 1A does not discuss how a firm will specifically deal with these risk factors. The risk factors discussed in Item 1A are not specifically the risk factors that the firm is facing. Therefore, we further look at which of the two sections of the annual report has an actual impact on the investor assessment of the future performance of the firm. In the case of Item 7, some previous studies did not find a positive link between this item and future performance. For instance, Pava and Epstein (1993) find that firms disclose general historical information but not informative and accurate forecasts in the Management’s Discussion and Analysis of Financial Condition and Results of Operations section (MD&A). Also, Schroeder and Gibson (1990) find that the information reported in the MD&A section is difficult to understand and usually not written in a clear way that is easy to follow for the average reader. However, in a later study, Li (2010) finds a positive relationship between MD&A disclosures and certain firm characteristics such as firm performance. Therefore, we still do not fully understand the link between the tone and sentiments of the text in Items 1A and 7 and the investor assessment of the future performance of the firm.
Previous studies on related topics have only used subsamples of textual analysis, general lists of words, or were based on short-run studies. In contrast, this study includes all publicly traded firms from 2009 to 2014. Furthermore, we focus on extracting qualitative information from Items 1A and 7 of annual reports and identifying the differences between both sections and using principal component analysis grouping the tone and sentiments into meaningful groups. Briefly, this study has two crucial findings. First, we find that only the tone of the text in Item 7 has an effect on the investor assessment of the future performance of the firm and that a positive tone or sentiment has a positive effect on the investor assessment of the future performance and that a negative, litigious, or uncertain tone or sentiment has a negative effect on the investor assessment of the future performance. Second, we did not find any positive or negative effect from the tone or sentiment of text in Item 1A.
Our study makes a timely contribution to two distinct streams of literature. The paper advances the existing literature on the link between the tone and sentiments of the text and the investor assessment of the future performance of the firm. We extract the tone and sentiments from Items 1A and 7 of annual reports and see if the tone and sentiments of those sections of the annual report actually affect the investor assessment of the future performance of the firm and which one plays a more significant role. We also contribute to the broader literature that focuses on understanding the risk content of Items 1A and 7 and compares the two. In terms of practice, this study offers a method of conceptualizing the tone and sentiments of the annual reports as well as the investor assessment of the future performance implications.
This study is organized as follows. Section “Motivation and Hypotheses Development” describes the motivation and hypotheses development. Section “Data and Methodology” presents the data collection and methodology. Section “Empirical results” presents the empirical results, and Section “Conclusion” presents the conclusions of the analysis.
Motivation and Hypotheses Development
Publicly traded firms in the United States are required to submit an annual report, known as the 10-K report, to the Securities and Exchange Commission (SEC). The 10-K report is publicly available through the SEC’s Electronic Data Gathering, Analysis, and Retrieval system (EDGAR), and it should disclose a comprehensive discussion of the financial performance of the firm. Annual reports of firms usually consist of multiple sections that provide a description of their operations, financial conditions, and audited financial statements. In this study, we focus on the tone of the text in Item 1A from Part 1 and Item 7 from Part 2 of 10-Ks.
In 2005, the SEC adopted rule 33-8591 (SEC, 2005), where the SEC started requiring firms to report risk factors in Item 1A of the annual report. Rule 33-8591 specifies that Item 1A is “intended to provide investors with a clear and concise summary of the material risks.” At the time of the adoption of rule 33-8591, there was some opposition about having a separate risk factors section (Beatty et al., 2019) because of the potential overlap with Item 7, which is the Management Discussion and Analysis Section that also includes risk factors. With regard to Item 7, in 1989, the SEC released its interpretive guidance of the management’s discussion and analysis of financial condition and results of operations (SEC, 1989). In this interpretive guidance, the SEC required the disclosure of forward-looking information and known uncertainties that will have a material impact on sales, revenues, or income. Therefore, do firms overlap some information on both sections? Or do they prioritize one over the other? Moreover, given the fact that firms are not required to quantify the impact of their disclosed information on future financial statements (Campbell et al., 2014) and that disclosures in Item 1A have been criticized for being generic (Hope et al., 2016) and that current regulatory requirements mandate extensive disclosures in Item 7 (Smith, 2019), do firms disclose more important issues in Item 7 and more generic issues in Item 1A? In the case of the forward-looking information, which one plays a major role, Item 7 or Item 1A? Furthermore, over the years, the relationship between both sections has not been completely understood, and we still do not have much evidence that risk disclosures in Item 1A are informative (Campbell et al., 2014). In 2013, the Division of Corporation Finance looked into a way to improve the information that is disclosed by firms (SEC, 2013). For instance, Bao and Datta (2014) found that two-thirds of risk types were neither informative nor significant. Moreover, in an SEC Disclosure speech in 2014 (SEC, 2014), the Division of Corporation Finance hoped that firms would not include immaterial information in their Management Discussion and Analysis section.
Research on corporate risk disclosures has been analyzed in accounting literature for the last few decades. For instance, Back et al. (2001) employed a text-mining technique using text clustering to analyze annual reports from a qualitative and quantitative point of view. Furthermore, Gerdes (2003) developed a software to analyze corporate data from the SEC’s EDGAR database automatically. Likewise, Davis et al. (2012) counted optimistic and pessimistic words using the Diction software from earnings press releases to predict the future performance of firms. Furthermore, Sun et al. (2016) used a deep-learning-based textual analysis technique to try to extract sentiments from the MD&A section, and they focused on financial misreporting predictions. Specifically, in this study, we go beyond just a count of positive and negative words, and we focus on the tone and sentiments linking the tone and sentiments to the investor assessment of the future performance of firms by analyzing four different dimensions: positive, negative, litigious, and uncertain.
Looking at the general theory on risk disclosures, there are two competing theories related to the effect of risk disclosures and their informativeness. The first one is that risk disclosures are not informative because firms just disclose all possible risks without considering the fact that the text may affect the firm in the future (Schrand & Elliot, 1998). The second argument is that the disclosure of risks makes investors aware of current issues that may be affecting the firm (Bao & Datta, 2014). This increase in awareness could work both ways because it could negatively affect the firm in case some stockholders were not aware of some negative outlook on the firm, or it could help mitigate some previous concerns that were not clear for stockholders. Moreover, the presence of risk disclosures may improve the firm’s investment effectiveness (Smith, 2019) and may improve liquidity and capital allocation (e.g., Goldstein & Yang, 2017). By contrast, the absence of disclosure information may represent a higher risk to the firm and may generate uncertainty, given the fact that investors will fear that the lack of risk disclosures is because the firm is withholding bad news (Jung & Kwon, 1988). Furthermore, in our specific case of looking at the text in Items 1A and 7, the lack of a positive, negative, uncertain, or litigious tone or sentiment in the text may have a negative impact on the investor assessment of the future performance of the firm, because investors may fear that the firm is in fact withholding bad news.
Accordingly, Item 1A of the annual report is the risk factors section and discusses the general risk factors that are present. Those risk factors could be the risk factors that affect the whole economy, the whole industry, the market where the firm operates, the geographical region where the firm operates, or the firm itself. Item 1A does not discuss how a firm will deal with these risk factors, and the risk factors discussed in this section are not necessarily firm-specific risks. Therefore, a positive tone or sentiment does not necessarily mean that the future performance of the firm is going to improve. It may just mean that things are going as expected, and there are no concerns. Regarding negative, uncertain, or litigious tone or sentiment in Item 1A, it could be that there are negative, uncertain, or litigious reports in general about the economy, but that does not mean that the future performance of the firm will be affected negatively.
For instance, in the case of Target Corp., Item 1A of the firm’s 2016 annual report is organized into the following subsections: a subsection on competitive and reputational risks where it discusses in general terms that they want to preserve the good reputation of the brand name; a subsection on data security and privacy risk where they mention the data breach that they faced in 2013, and they mention in general terms their continuous effort to protect the security of the information of their clients. A subsection on supply chain and third-party risks is included where they mention in general terms that their operations can be affected if the relationship with their vendors is affected, changes in tax policies are present, or if there are interruptions in the supply chain. In addition, there is a subsection on legal, regulatory, global, and other external risks where they mention in general terms that their earnings are susceptible to macroeconomic conditions, weather conditions, and changes in federal, state, local, and international laws. Finally, there is also a subsection on financial risks where, in general terms, they mention that firm’s business can be affected by tax rates and access to capital markets. In summary, Target Corp. in Item 1A does not get into specific details that can signal investors in a positive or negative way about the specific future performance of the firm. All the statements made are nonspecific and can be expected on any general discussion about the economy and how an average firm will need to operate to be healthy. Therefore, our first two hypotheses are as follows:
By contrast, Item 7 of the annual report discusses the specific situation of the firm during the previous year from the point of view of the management. In this section, firms usually get into the details of their specific operations, their financial situation, future plans and perspectives, and reservations that can affect the firm. This section also discusses the risks the firm is facing, how the management is handling the risks, and what is being done to mitigate the risk factors.
There are previous studies that have looked specifically at Item 7. For instance, D’Augusta and DeAngelis (2020) looked at the connection between disclosure tone and earnings performance. They looked specifically at the MD&A section of the 10-K and measured the tone of the MD&A section by counting the number of positive and negative words in that section. They found that the effect of earnings performance on disclosure tone is complicated and is linked to managers’ incentives. Likewise, Rich et al. (2018) used a sample of 362 MD&A disclosures for the fiscal year 2011 and looked at the fraction of positive or negative words in municipal MD&A sections and the association with fewer or more subsequent-year internal control weaknesses after controlling for other governance, demographic, and performance factors. They found that a positive tone is associated with a smaller probability of future general fund deficits. Furthermore, Yang et al. (2018) extracted high-frequency words, related concept links, and topics from the MD&A section to compare the financial position and ongoing status of bankrupt and nonbankrupt firms. They focused on the top-30 words that are frequently present in both groups, and they did not find much difference between either group.
For instance, again, in the case of Target Corp., Item 7 of its 2016 annual report discussed in detail the decrease of its 2016 level of sales and provided a reasonable explanation for that. In addition, it compared its 2016 level of sales with the increase in sales in the year 2015. Target Corp. provided a detailed explanation of why its period-end cash and cash equivalents balance decreased in the year 2016; Target also provided a detailed explanation of the timing of its investments and its investment policy that preserved its principal and its short-term investments. Target also provided a detailed explanation of its increase in capital expenditures and mentioned that these capital expenditures were mostly due to the remodeling of existing stores and improvement of the experience of clients. At the same time, these capital expenditures were partially offset by efficiency gains in technology. In summary, Target Corp., in Item 7, provided specific details and reasonable explanations about the financial performance of the firm. It also provided important information to investors and stockholders, so they could adjust their future expectations.
Accordingly, Item 7 discusses a firm’s financial performance, operating results, and forward-looking features, giving investors the opportunity to see how the management analyses the situation of the firm (Yang et al., 2018). Therefore, with regard to Item 7 and given the fact that the risk factors discussed in this section are specific to the firm, we hypothesize the following:
Moreover, not only the positive tone or sentiment is important to take into consideration in the analysis of future performance, but also the negative, litigious, or uncertain tone or sentiment is important. According to the conformity theory, the presence of negative statements may alter the initial attitude of an individual and may increase his perceived risk and switch his opinion from positive to negative (Lascu & Zinkhan, 1999). For instance, in the consumer behavior literature, there is ample evidence that negative statements exert more influence on readers than positive statements (Pee, 2016; Sen & Lerman, 2007) that the appearance of negative information attracts more attention (Sen & Lerman, 2007), and in some cases, even one negative statement can be very harmful (Zhu & Zhang, 2010).
Similarly, in the presence of negative performance information, managers have discretion over the use of qualitative information to mask it by diminishing readability (Li, 2008). Also, according to the incomplete revelation hypothesis (Bloomfield, 2002), managers can make bad news harder to analyze to reduce the market response. Moreover, Skinner (1994) finds that managers usually disclose lousy news in a more qualitative way rather than good news, and managers that are concerned by a deteriorating firm performance try to downplay and conceal negative news (Garcıa Lara et al., 2009). For instance, in the case of the report of earnings by firms, the “Pollyanna Principle” (Merkl-Davies & Brennan, 2007) states that managers emphasize positive earnings performance and downplay negative earnings performance (Hildebrandt & Snyder, 1981). Also, a common argument in corporate lawsuits by plaintiffs is that sued firms failed to disclose negative information about the firm or downplayed it (Francis et al., 1994).
Furthermore, the presence of negative online communications can have a bigger influence on the image of firms than it would in traditional communications (Chiou & Chen, 2003). In addition, negative statements may attract more attention from readers and, therefore, may have a more significant impact on the decision-making process that depends on those statements (Fiske, 1980). Also, some readers may consider negative statements as unusual, and because of this, they may find them more informative (Park & Lee, 2009; Sen & Lerman, 2007). Therefore, we hypothesize the following:
Data and Methodology
Data
Our data set consists of all available annual 10-K forms from 2009 to 2014 to parse Items 1A and 7 sections. On February 4, 2008, the SEC changed how smaller companies report on Item 1A. To have a homogeneous sample, our study starts in the year 2009. Following Loughran and McDonald (2011), we use three Python scripts to extract four different dimensions of textual tone and sentiments: positive, negative, litigious, and uncertain. The process consists of three steps of downloading the annual reports, extracting Items 1A and 7, and analyzing and quantifying the text in each section. First, by developing a Python script, we download all 10-K reports from 2009 to 2014 from EDGAR database. We obtain 36,855 firm-year observations. As discussed by Campbell et al. (2014), most EDGAR fillings contain visual clues for human readers, such as subsection title and boldface and italic fonts, among others, to recognize section boundaries. Therefore, our second Python script uses a combination of clues in the HTML files to extract the desired sections from the 10-K filings. Using this script, we extracted from each 10-K report Items 1A and 7 separately, and after cleaning the data, we obtained 23,555 firm-year observations that had both Items 1A and 7 sections. The last Python script drills down into each section and analyzes the extracted text in Items 1A and 7. Using the Loughran and McDonald Financial Sentiment Dictionaries that contains 3,532 unique words (Loughran & McDonald, 2011), we identify the number of negative, positive, uncertain, and litigious words in each section. We also identify the total number of words in Items 1A and 7 and use them as the corresponding scaling variable. Next, we generate four different indexes for each section corresponding to positive, negative, litigious, and uncertain words. A total of eight indexes: Fin_Pos 1A, Fin_Neg 1A, Fin_Unc 1A, Fin_Lit 1A, Fin_Pos 7, Fin_Neg 7, Fin_Unc 7, and Fin_Lit 7.
Finally, annual financial data for all the firms from 2009 to 2014 is obtained from the Standard and Poors’ COMPUSTAT database. After matching the data obtained and cleaned from the EDGAR database with the Standard and Poors’ COMPUSTAT database, our final data set consists of 18,169 firm-year observations for the period from 2009 to 2014. Details of the sample creation are presented in Table 1. We winsorize the data for all continuous variables at the 1st and 99th percentiles. We also standardize the variables, so our principal component analysis is not affected by variables with high variances. Table 2 describes the composition of the sample by industry. The sample is distributed across all industries, with 49.80% for firms in the manufacturing sector.
Sample Creation.
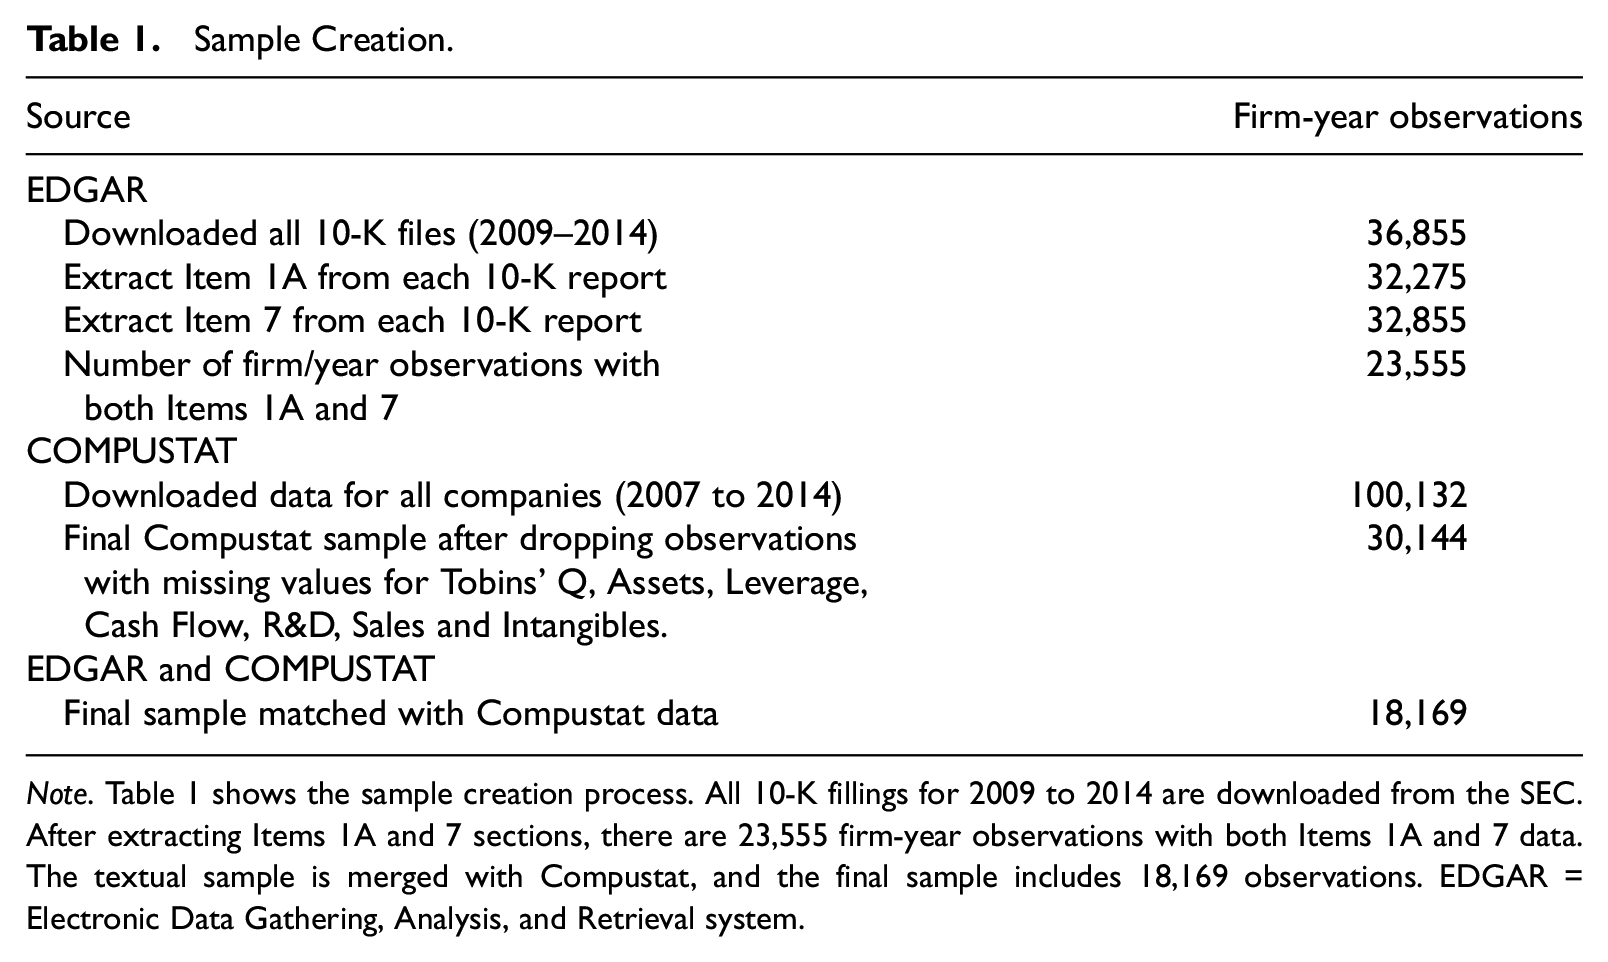
Note. Table 1 shows the sample creation process. All 10-K fillings for 2009 to 2014 are downloaded from the SEC. After extracting Items 1A and 7 sections, there are 23,555 firm-year observations with both Items 1A and 7 data. The textual sample is merged with Compustat, and the final sample includes 18,169 observations. EDGAR = Electronic Data Gathering, Analysis, and Retrieval system.
Sample Partitioned by Industry.
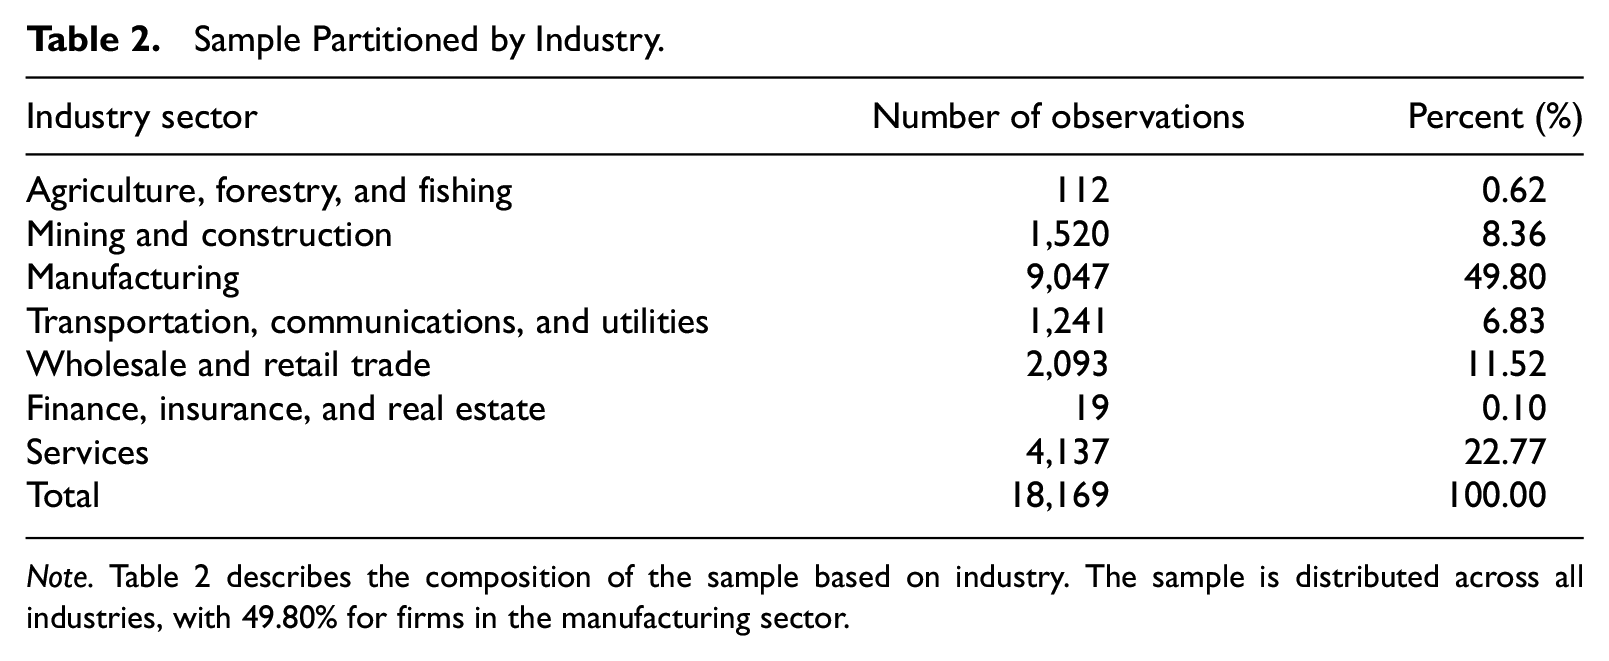
Note. Table 2 describes the composition of the sample based on industry. The sample is distributed across all industries, with 49.80% for firms in the manufacturing sector.
Research Method
Loughran and McDonald (2011) develop a few lists of words that specifically reflect the tone and sentiment of a text in accounting and finance disciplines. Other previous studies have used general lists of words which may lead to misclassification and misinterpretation of the meaning of the word because some words may have different meanings in areas other than business and accounting. Following Loughran and McDonald (2011), we use the following specific lists of words used in the accounting and finance literature to capture the tone and sentiment of the text: Fin_Neg, Fin_Pos, Fin_Unc, and Fin_Lit. Fin_Neg captures negative tones such as “negative profits reported at the end of the year,” Fin_Pos captures positive tones such as “we exceeded our profit targets,” Fin_Unc captures uncertain tones such as “cash flow has decreased,” and Fin_Lit, captures litigation situations such as “we incurred settlement expenses.” In addition, an uncertain tone may mean that the future of the firm is uncertain, and a litigious tone may mean that a litigation is in process or may be coming.
We conduct a principal component analysis on the four variables that measure the tone of the text: the frequency of positive, negative, uncertain, and litigious words. This approach helps with avoiding multicollinearity, given the possibility that more than one word may be measuring the same sentiment because the words necessarily are not mutually exclusive and gives a better perspective of the link between tone and sentiment and the investor assessment of the future performance. We retain two components requiring eigenvalues to be greater than one. For each section, the four variables that we use in the principal component analysis, measure different aspects of the tone of the text. For Item 1A, we run a principal analysis component on the following variables: positive words in Item 1A, negative words in Item 1A, uncertain words in Item 1A, and litigious words in Item 1A. For Item 7, we run a principal analysis component on the following variables: positive words in Item 7, negative words in Item 7, uncertain words in Item 7, and litigious words in Item 7. For Item 1A, the first principal component (POS 1A) is loaded with positive words, and the second principal component (NEGUNCLIT 1A) is loaded with negative, uncertain, and litigious words. For Item 7, the first principal component (POS 7) is loaded with positive words, and the second principal component (NEGUNCLIT 7) is loaded with negative, uncertain, and litigious words.
Variables POS 1A and POS 7 are based on Fin_Pos that include positive words. Fin_Pos includes 353 words such as achieve, profitable, efficient, and improve, among others. The variables in the second principal component NEGUNCLIT capture a negative, litigious, or uncertain tone. Negative words are based on Fin_Neg, which includes a list of negative financial words specific to business terminology developed by Loughran and McDonald (2011). Fin_Neg includes 2,337 words such as penalties, unpaid, misstatement, misconduct, and forfeiture, among others. Uncertain words are based on Fin_Unc, which includes a list of words denoting uncertainty, focusing on imprecision, and not risk. Fin_Unc includes 285 words such as uncertain, variability, fluctuate, and approximate, among others. Litigious words are based on Fin_Lit, which includes a list of words denoting a tendency for litigiousness. Fin_Lit includes 731 words such as tort, legislation, regulation, and claimant, among others.
Owing to the different writing styles and the unique nature of the sector where a firm operates, it is possible that some firms may write longer annual reports with corresponding longer sections. Also, Li (2008) finds that firms with losses and transient income write longer and more complex sentences using more positive terms, which can be attributed to the fact that managers may try to distract investors by discussing other good news or trying to hide poor management practices.
The longer the section, the higher the probability that more positive, negative, litigious, or uncertain words will be present in each section, but that does not mean that those specific firms have a more positive, more negative, more litigious, or more uncertain outlook. Furthermore, the quantity of disclosures is not a proxy for the quality of disclosures (Beretta & Bozzolan, 2008). To control for this effect, we scale the number of positive, negative, uncertain, and litigious words by the total number of words in their corresponding section to avoid the results being biased toward firms that have a style of writing longer texts in their annual reports.
The model that we use explains the investor assessment of future performance. To be precise, in our model, the dependent variable is Tobins’ Q, which is a measure of future performance. Tobins’ Q is defined as the market value of the firm divided by its assets’ replacement cost (market value of equity + book value of debt)/book value of assets. The independent variables consist of the textual variables extracted from Item 1A of the annual report and textual variables extracted from Item 7 of the annual report. We have the following textual variables in our model: POS 1A is the first principal component loaded by the number of positive words in Item 1A scaled by the total number of words in Item 1A, and NEGUNCLIT 1A is the second principal component loaded by the number of negative, uncertain, and litigious words in Item 1A scaled by the total number of words in Item 1A. POS 7 is the first principal component loaded by the number of positive words in Item 7 scaled by the total number of words in Item 7, and NEGUNCLIT 7 is the second principal component loaded by the number of negative, uncertain, and litigious words in Item 7 scaled by the total number of words in Item 7.
We also control for size, leverage, cash flow, research and development expenditures, and sales growth. We control for size because larger firms have more resources, and benefits are proportional to the firm’s size. To account for potential industry influences, we include industry-fixed effects controls from Fama and French (1997). It is important to control for industry effects because industry differences may affect performance. To control for year differences, we include year-fixed effects. It is also important to control for year effects to control for time trends. In our analyses, we use robust standard errors that adjust for firm-level clustering. Our future performance model is as follows:
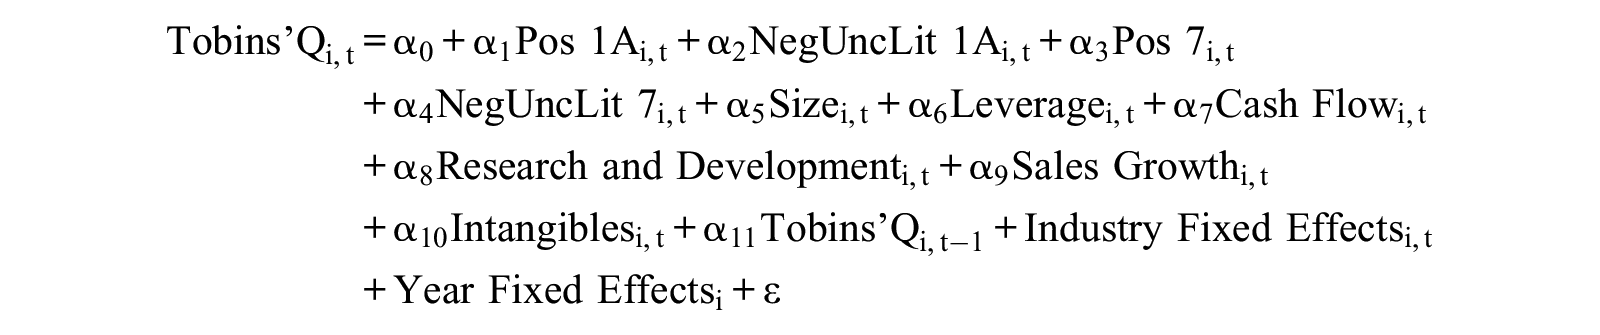
We expect the textual variables from Item 1A not to be associated with the investor assessment of the future performance quantified by Tobins’ Q. In contrast, we expect textual variables from Item 7 to be associated with the investor assessment of the future performance quantified by Tobins’ Q.
Controlling for Potential Endogeneity
A concern when evaluating the relationship between the sentiments and tones in the annual reports of firms and the information regarding the future performance of firms is that this could become a cyclical process wherein a negative tone in the text may generate a negative outlook for the performance of the firm, and consequently, a negative performance of the firm may generate a negative tone in the text in the following year, therefore creating a loop. A similar cyclical behavior could be expected when a positive tone is present. In general, market participants will incorporate new information that has been disclosed and will make corresponding adjustments that may impact the investor assessment of the future performance of the firm. Consequently, there are different approaches to control for potential endogeneity. In this study, we follow Cao et al. (2018), and we use the Arellano-Bond dynamic panel estimation (Arellano & Bond, 1991; Holtz-Eakin et al., 1988). The Arellano-Bond method uses a generalized dynamic panel moments estimator. We use two-period lags of the dependent variable and all the independent variables.
Empirical Results
Descriptive summary is presented in Table 3. The average number of words in Item 1A is 6,828, and the average number of words in Item 7 is 9,535. On average, firms write longer descriptions and statements in Item 7. Looking in detail into each of them, we find that in Item 1A, the average number of positive words is 70.06, while the number of negative and uncertain words is approximately three times the number of positive words. In Item 7, the average number of positive, negative, and uncertain words are approximately the same, but the number of litigious words is approximately double that number.
Descriptive Summary.
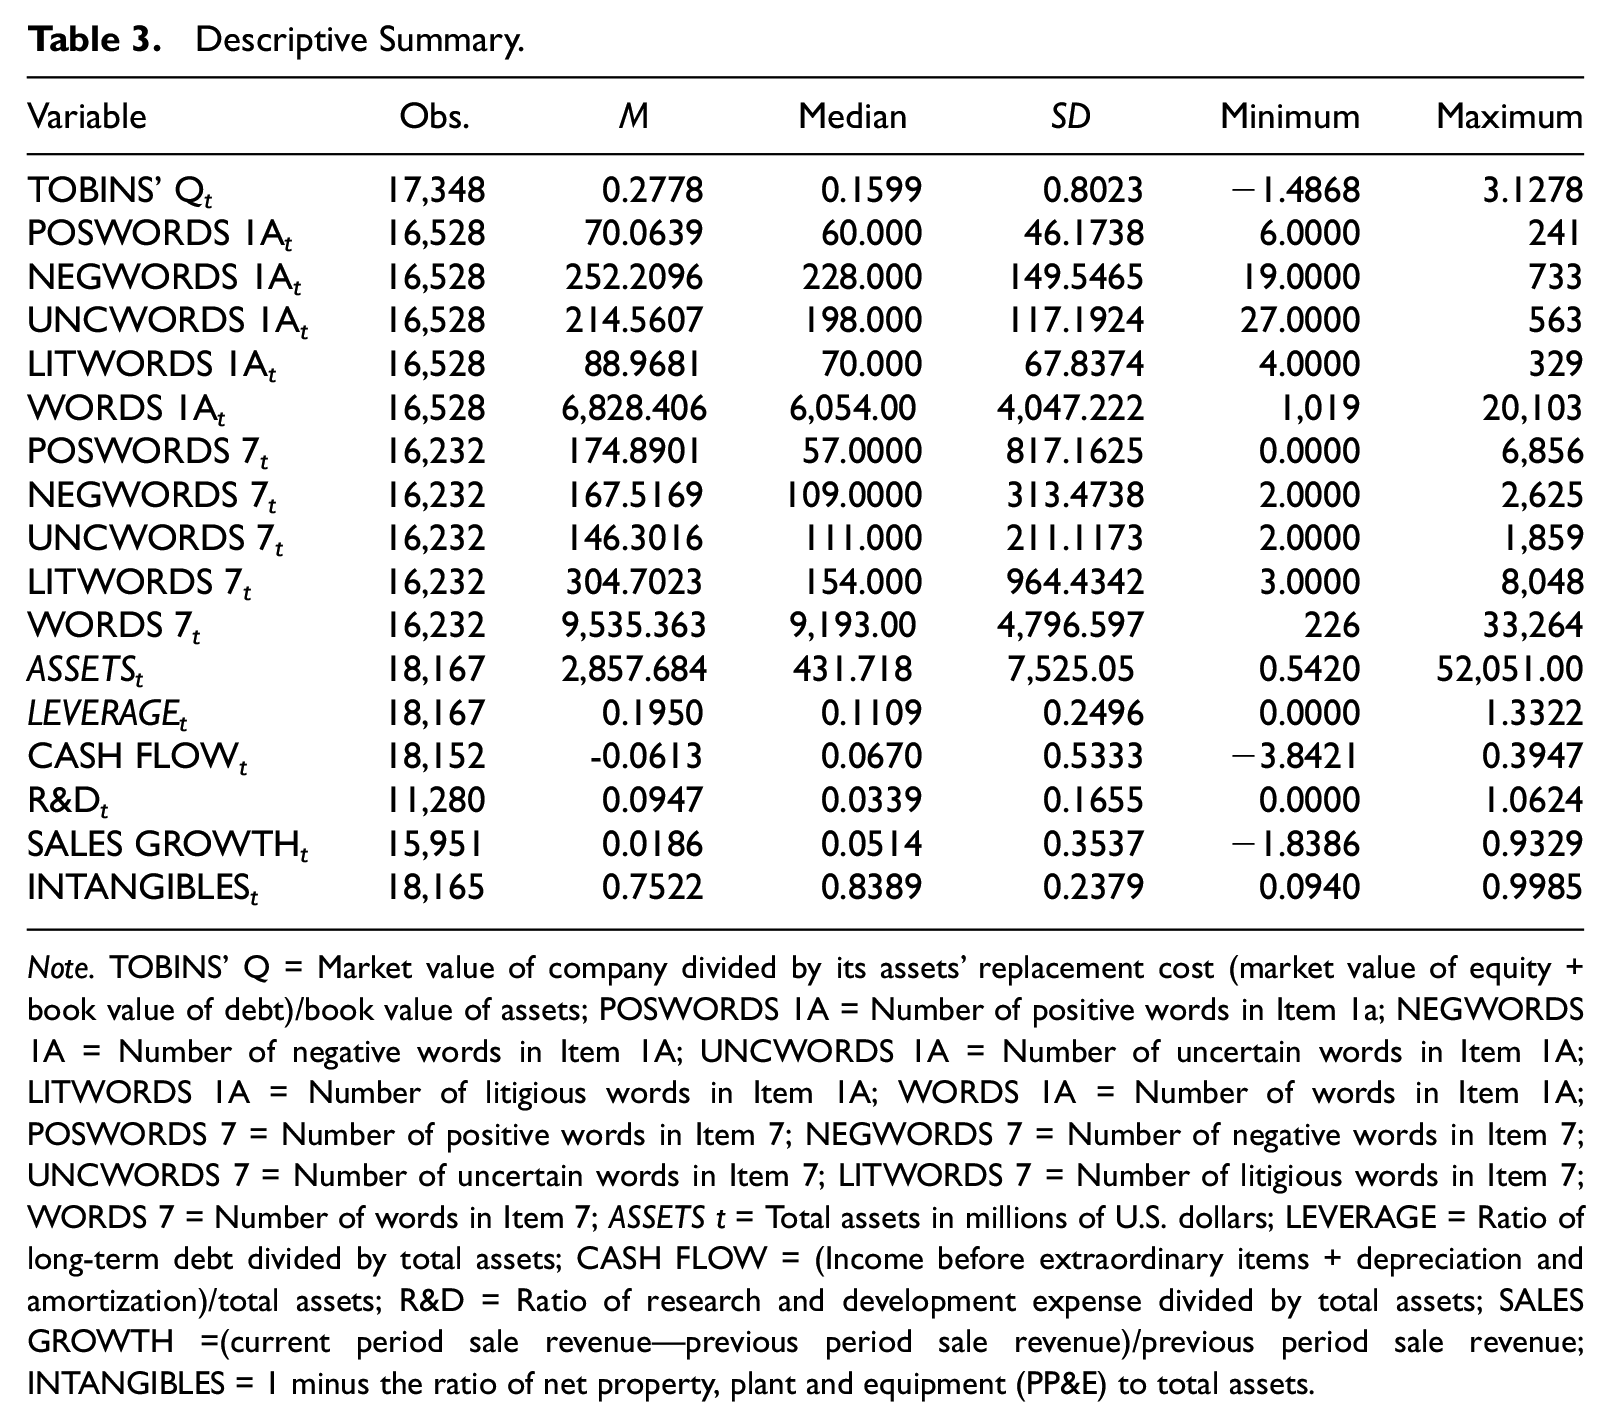
Note. TOBINS’ Q = Market value of company divided by its assets’ replacement cost (market value of equity + book value of debt)/book value of assets; POSWORDS 1A = Number of positive words in Item 1a; NEGWORDS 1A = Number of negative words in Item 1A; UNCWORDS 1A = Number of uncertain words in Item 1A; LITWORDS 1A = Number of litigious words in Item 1A; WORDS 1A = Number of words in Item 1A; POSWORDS 7 = Number of positive words in Item 7; NEGWORDS 7 = Number of negative words in Item 7; UNCWORDS 7 = Number of uncertain words in Item 7; LITWORDS 7 = Number of litigious words in Item 7; WORDS 7 = Number of words in Item 7; ASSETS t = Total assets in millions of U.S. dollars; LEVERAGE = Ratio of long-term debt divided by total assets; CASH FLOW = (Income before extraordinary items + depreciation and amortization)/total assets; R&D = Ratio of research and development expense divided by total assets; SALES GROWTH =(current period sale revenue—previous period sale revenue)/previous period sale revenue; INTANGIBLES = 1 minus the ratio of net property, plant and equipment (PP&E) to total assets.
Table 4 presents the Pearson and Spearman correlation matrixes of the key variables of interest. The top matrix shows the results for Pearson correlation, and the bottom matrix shows the results for Spearman correlation. We find that POS 1A, POS 7, NEGUNCLIT 1A, and NEGUNCLIT 7 are significantly correlated with the dependent variable Tobins’ Q, and that POS 1A and POS 7 are positive and significantly correlated between them, showing that both of them go in the same direction and that they do not contradict themselves. A similar relationship is observed between NEGUNCLIT 1A and NEGUNCLIT 7.
Pearson (Top-Half) and Spearman (Bottom-Half) Correlation Coefficients.

Note. TOBINS’ Q = Market value of company divided by its assets’ replacement cost (market value of equity + book value of debt)/book value of assets; POS 1A = Number of positive words in Item 1a scaled by total number of words in Item 1A; NEGUNCLIT 1A = Principal Component of number of negative, uncertain, and litigious words in Item 1A all scaled by total number of words in Item 1A; POS 7 = Number of positive words in Item 7 scaled by total number of words in Item 7; NEGUNCLIT 7 = Principal Component of number of negative, uncertain, and litigious words in Item 7 all scaled by total number of words in Item 7; SIZE = Natural logarithm of book value of total assets; LEVERAGE = Ratio of long-term debt divided by total assets; CASH FLOW = (Income before extraordinary items + depreciation and amortization)/total assets; R&D = Ratio of research and development expense divided by total assets; SALES GROWTH = (current period sale revenue—previous period sale revenue)/previous period sale revenue; INTANGIBLES = 1 minus the ratio of net property, plant and equipment (PP&E) to total assets.
, †, * Denote two-tailed statistical significance at the 1%, 5%, and 10% levels, respectively.
Table 5 presents the results of the model. The model is tested for multicollinearity, and in all cases, the variance inflation factors values were around 2, showing that there are no multicollinearity problems. From Table 5, we find that a positive tone (coefficient = 2.8139) in Item 7 has more weight than NEGUNCLIT (coefficient = −0.6689), which is composed of negative, uncertain, and litigious words in the same Item 7. The coefficient of POSWORDS 7 is 2.8139, significant at the 1% level, and the coefficient of NEGUNCLIT 7 is −0.6689 and significant at the 1% level. We test these results for the potential endogeneity issue that may arise from the tone of the text being correlated with the future performance of the firm as well as with the future tone of the text. Table 5 results are robust because when we run our endogeneity test and report the results in Table 6, we find that the coefficients for POSWORDS 7 and NEGUNCLIT 7 continue having the same signs and significance levels. Therefore, our main results from Table 5 show that our findings for Item 7 are not driven by reverse causality. Looking at the absolute values of the coefficients for POSWORDS 7 and NEGUNCLIT 7, 2.8139 versus 0.6689, we observe that a positive tone has a larger impact on the investor assessment of the future performance of the firm, and that is almost four times the impact of the combination of negative, uncertain, and litigious words. Looking at the results for Item 1A, we do not find any significant effect from positive words on the future performance of the firm. From Table 5, we see an apparent significant effect from NEGUNCLIT 1A, but this result is not significant in the endogeneity test from Table 6, showing that NEGUNCLIT 1A has no significant effect on the investor assessment of the future performance of the firm and that the apparent significant result in the main model from Table 5 was driven by reverse causality.
The Effect of Words From 10-Ks on Forward-Looking Performance.
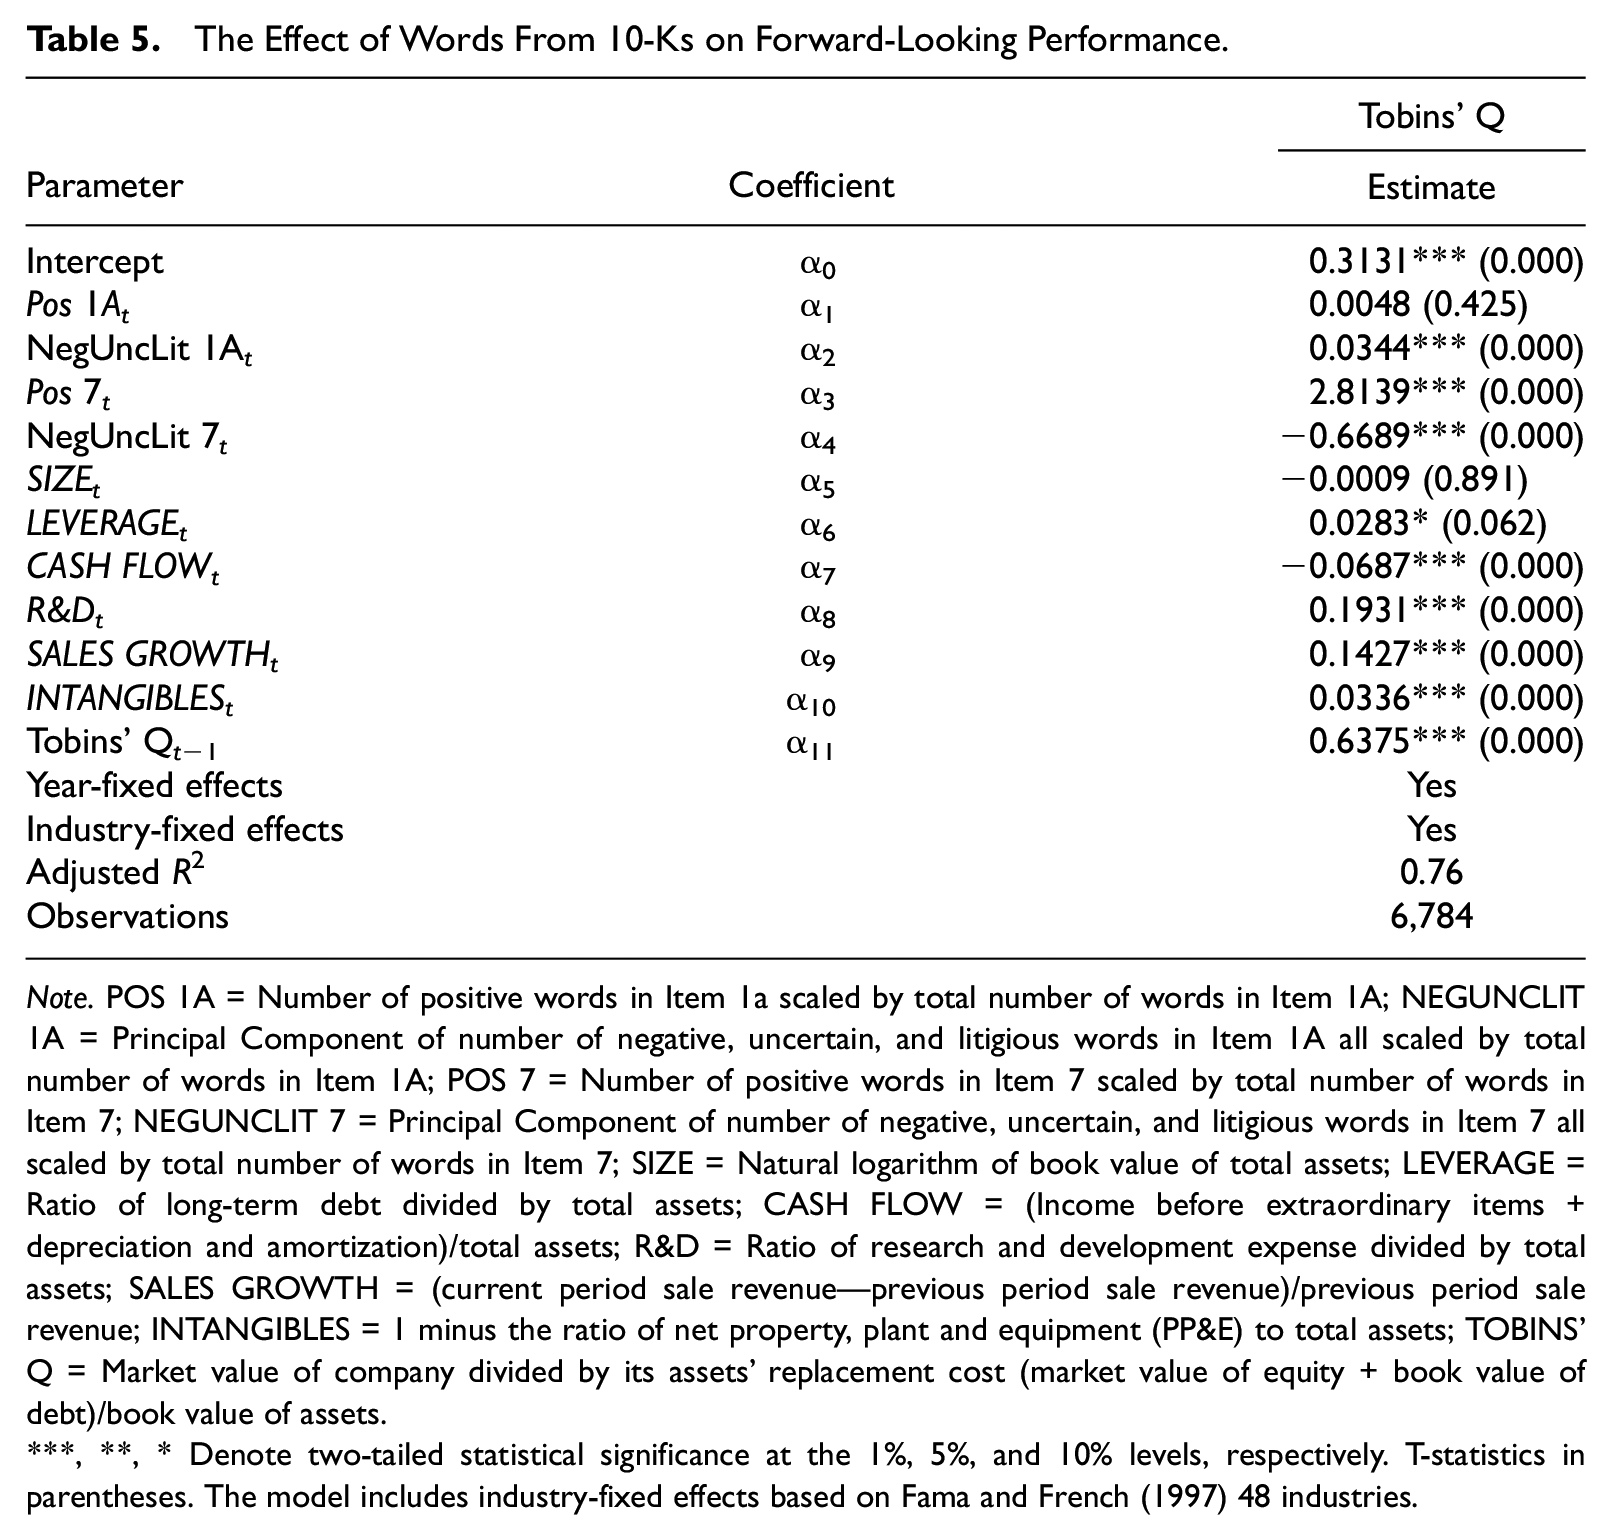
Note. POS 1A = Number of positive words in Item 1a scaled by total number of words in Item 1A; NEGUNCLIT 1A = Principal Component of number of negative, uncertain, and litigious words in Item 1A all scaled by total number of words in Item 1A; POS 7 = Number of positive words in Item 7 scaled by total number of words in Item 7; NEGUNCLIT 7 = Principal Component of number of negative, uncertain, and litigious words in Item 7 all scaled by total number of words in Item 7; SIZE = Natural logarithm of book value of total assets; LEVERAGE = Ratio of long-term debt divided by total assets; CASH FLOW = (Income before extraordinary items + depreciation and amortization)/total assets; R&D = Ratio of research and development expense divided by total assets; SALES GROWTH = (current period sale revenue—previous period sale revenue)/previous period sale revenue; INTANGIBLES = 1 minus the ratio of net property, plant and equipment (PP&E) to total assets; TOBINS’ Q = Market value of company divided by its assets’ replacement cost (market value of equity + book value of debt)/book value of assets.
, **, * Denote two-tailed statistical significance at the 1%, 5%, and 10% levels, respectively. T-statistics in parentheses. The model includes industry-fixed effects based on Fama and French (1997) 48 industries.
The Effect of Words From 10-Ks on Forward-Looking Performance Endogeneity Test.

Note. POS 1A = Number of positive words in Item 1a scaled by total number of words in Item 1A; NEGUNCLIT 1A = Principal Component of number of negative, uncertain, and litigious words in Item 1A all scaled by total number of words in Item 1A; POS 7 = Number of positive words in Item 7 scaled by total number of words in Item 7; NEGUNCLIT 7 = Principal Component of number of negative, uncertain, and litigious words in Item 7 all scaled by total number of words in Item 7; SIZE = Natural logarithm of book value of total assets; LEVERAGE = Ratio of long-term debt divided by total assets; CASH FLOW = (Income before extraordinary items + depreciation and amortization)/total assets; R&D = Ratio of research and development expense divided by total assets; SALES GROWTH = (current period sale revenue—previous period sale revenue)/previous period sale revenue; INTANGIBLES = 1 minus the ratio of net property, plant and equipment (PP&E) to total assets; TOBINS’ Q = Market value of company divided by its assets’ replacement cost (market value of equity + book value of debt)/book value of assets.
, **, * Denote two-tailed statistical significance at the 1%, 5%, and 10% levels, respectively. Z-statistics in parentheses. The model includes industry-fixed effects based on Fama and French (1997) 48 industries.
To test the robustness of our findings, we replicate our main analysis without using our principal component variables and only using positive and negative words for Items 1A and 7. We find that the results of these robustness tests are qualitatively similar to those reported in Table 5, suggesting that our main findings are robust (see Appendix).
Conclusion
Using a detailed textual analysis, we examine whether the tone and sentiments of the text in the Risk Disclosures section (Item 1A) and Management’s Discussion and Analysis section (Item 7) provide information regarding the investor assessment of the future performance of the firm. There has been academic debate on the significance of these disclosures, given that they overlap, and also for historical reasons, there were no qualitative disclosures in Item 1A before 2005. We collect data from Items 1A and 7 using three different Python scripts and develop a methodology for measuring their tone. We find that only the tone of the text in Item 7 has significant information regarding the investor assessment of the future performance of the firm and that the association is positive—a positive tone signals better future performance, whereas a negative litigious or uncertain tone signals negative future performance. We did not find any positive or negative association with the future performance of firms from the tone or sentiment of text from Item 1A. These results provide new insights and explain the channels through which the tone and sentiments of the text convey information about future performance.
This study contributes to the existing literature in three ways. First, this is one of the few studies that focus on extracting the tone and sentiments from Items 1A and 7 of U.S. annual reports and identifies differences between those sections. Second, this study uses principal components analysis to have a better understanding of the multidimensional nature of the tone and sentiments, categorizing the variables into two major groups that convey positive and negative information. Third, this study develops the foundation for future research opportunities showing researchers, managers, investors, and creditors for a more precise understanding of tone and sentiments in Items 1A and 7, and where to focus when they are looking for specific future performance information. This study is also useful for practitioners in helping them evaluate the financial position of a firm and helping them make decisions in order to allocate future resources.
Footnotes
Appendix
Robustness Test

| Parameter | Coefficient | Tobins’ Q |
|---|---|---|
| Estimate | ||
| Intercept | α0 | 0.2477*** (0.000) |
| Pos 1A t | α1 | 0.0040 (0.685) |
| Neg 1A t | α2 | 0.0369*** (0.000) |
| Pos 7 t | α3 | 0.1753*** (0.000) |
| Neg 7 t | α4 | −0.0185*** (0.009) |
| SIZEt | α5 | −0.0075 (0.320) |
| LEVERAGEt | α6 | 0.0223 (0.201) |
| CASH FLOWt | α7 | −0.0404** (0.036) |
| R&Dt | α8 | 0.1553*** (0.000) |
| SALES GROWTHt | α9 | 0.0387*** (0.021) |
| INTANGIBLESt | α10 | 0.0448*** (0.000) |
| Tobins’ Qt–1 | α11 | 0.6354*** (0.000) |
| Year-fixed effects | Yes | |
| Industry-fixed effects | Yes | |
| Adjusted R2 | 0.73 | |
| Observations | 6,784 |
Note. To test the robustness of our findings, we replicate our main analysis without using our principal component variables and only using positive and negative words for Items 1A and 7. We find that the results of these robustness tests are qualitatively similar to those reported in Table 5.
Declaration of Conflicting Interests
The author(s) declared no potential conflicts of interest with respect to the research, authorship, and/or publication of this article.
Funding
The author(s) received no financial support for the research, authorship, and/or publication of this article.