
Abstract
As African Americans are poorer than non-African Americans, increasing racial integration might lead to increasing poverty integration. Alternatively, if racial segregation pushed higher- and lower-income African Americans to reside together, increasing racial integration may lead higher-income African Americans to sort into higher-income non-African American neighborhoods, decreasing poverty integration. Using consistently bounded census tract data for thirty-six large metropolitan areas (MAs) from 1970 to 2009, a fixed effect model measures the relationship of a census tract’s end of the decade proportions of the metropolitan population by race and poverty status group between 1980 and 2009 to the proportions of each race and poverty group resident in a census tract at the start of the decade. The article finds that racial integration occurs mostly within own poverty groups and poverty integration occurs mostly within own racial groups, making these integration processes largely independent. Poverty and racial segregation were slightly decreased, however, because the nonpoor racially integrated with the poor in a manner consistent with gentrification and status caste exchange theory.
Keywords
Introduction
Residential neighborhoods in large MAs in the United States are more racially segregated than they are poverty segregated. Racial segregation declined substantially in large metro areas in every region of the United States between 1970 and 2009, however, while poverty segregation changed very little. After rising between 1970 and 1990 in large metros everywhere but the South, poverty segregation decreased slightly in 2000 and stayed roughly the same in 2009. This article empirically measures the connections between changes in racial segregation and in poverty segregation.
Poverty segregation is not surprising. Poor and nonpoor households consume different housing. Demand for housing varies with poverty status because the willingness, and the ability, to pay for characteristics of neighborhoods, such as schools, safety, access to recreation and other amenities, and transportation modes depends on income. These differences in housing demand by poverty status translate into differences in residential locations leading to poverty segregation. As household incomes became more unequal between 1970 and 2009, differences in housing demand and poverty segregation would be expected to increase. Similarly, MA populations shifting to the suburbs that have more residential zoning than central cities leads to a larger share of their populations residing in enclaves with more homogenous housing and, therefore, poverty segregation.
Racial segregation, on one hand, diminished for several reasons. Over the last fifty years, federal, state, and local legislation outlawing the use of race in all facets of the housing industry, decreases in the social acceptability of racist behavior and rhetoric, and decreases in the racial gap in earnings and other labor market differences have reduced racial differences in housing and neighborhood demands and in racial segregation. Furthermore, immigration from Asia, Central and South America, and Africa have increased the ethnic and racial diversity of MA populations, which may have further decreased resistance to racial integration.
The links between changes in racial and poverty integration are less clear. On one hand, decreases in racial segregation might be expected to increase poverty segregation. As race plays less of a role in housing decisions, economic forces may play a greater role, leading to increases in poverty segregation as racial segregation decreases. For example, if racial segregation had previously forced higher- and lower-income African Americans to reside in the same neighborhoods, declines in racial segregation may allow higher-income African Americans to shift away from lower-income African Americans and into higher-income non-African American neighborhoods, leading to increasing poverty segregation.
On the other hand, decreases in racial segregation may decrease poverty segregation. As African Americans are poorer, increases in racial integration could lead to more poor African Americans (PAAs) residing in nonpoor non-African American (nPnAAs) neighborhoods, decreasing both poverty and racial segregation. If non-African Americans were sufficiently resistant to racial integration to be willing to stay in neighborhoods with African Americans only when African American neighbors are of higher social economic status, then both racial and poverty integration would occur, as African Americans integrate by settling in neighborhoods with poorer non-African Americans. Furthermore, if higher-income non-African Americans were to “gentrify” the neighborhoods of PAA residents, then both racial and poverty integration would occur, at least for a time.
I am aware of only one study that has analyzed directly the income integration effects of racial integration. Alba, Logan, and Stults (2000) show that while middle-class African Americans in Cleveland, Chicago, and Detroit in 1990 are less segregated from whites than poorer African Americans, their neighbors have lower income and status than is the case for whites of equivalent social and economic status. They interpret their findings as consistent with a status caste exchange 1 whereby whites who are reluctant to accept African Americans as neighbors (expressed by whites not staying in neighborhoods that African Americans enter and/or by not moving to neighborhoods with African American residents) have their resistance eased when “the socioeconomic characteristics of African Americans are superior to those of whites themselves.” I found no other studies examining whether this explanation applies to other time periods or MAs.
Some studies have tried to sort out the effects of income or poverty on racial segregation indices across MAs by regressing MA segregation rates on other MA characteristics. Logan, Stults, and Farley (2004) regress the percentage change in the black–white segregation index (and other ethnicity segregation indices) between 1980 and 2000 on changes in black–white income differences in the MA and other characteristics, including population size, age, region, growth, and black representation, for 255 MAs. They find that changes in black/white income ratios within the MA are not correlated with changes in racial segregation. MA-level regression analyses require the inclusion of large numbers of MAs, and, therefore, estimate the segregation effects of (or coefficients on) income or of other characteristics based mostly on the characteristics of the smaller MAs that account for most of the observations, rather than on the characteristics of the small number of very large MAs with the greatest levels of segregation and most of the African American population. Larger MAs also have greater diversity among their neighborhoods across a wide range of characteristics. Racial segregation or dissimilarity indices for the large MAs used in this study are 11–17 percent higher than for the other, smaller MAs. 2 Furthermore, several studies find that population has a nonlinear effect on racial segregation. Farley and Frey (1994) find that small MAs are less segregated than large ones; Massey and Denton (1993) identify the sixteen most segregated MAs in 1980 and all but one (Gary) are among the large MAs studied here; Logan, Stults, and Farley (2004) find higher levels of racial and ethnic segregation in large MAs in 2000.
For these reasons, multivariate analyses of large numbers of MAs cannot measure the connections between racial and poverty segregation in the largest, most segregated MAs in the United States.
In this study, I use consistently bounded census tract data for thirty-six large metropolitan areas (metropolitan statistical areas [MSAs]) from 1970 to 2009 to measure the relationships between poverty and racial integration. I estimate how a census tract’s end of the decade proportions of the metropolitan population by race and poverty status group for 1980, 1990, 2000, and 2009 change with respect to the proportions of all other race and poverty status groups resident in a census tract at the start of the decade. I use these results to examine how racial integration is associated with poverty integration, and vice versa, in these MSAs.
I find that most shifts toward poverty or racial integration are independent of one another: the larger shifts toward poverty integration are within racial groups and the larger shifts toward racial integration are within poverty groups. I find slight shifts of the African American nonpoor to non-African American poor neighborhoods, consistent with status cast exchange theory in the Northeast and Midwest, and somewhat weaker shifts of the non-African American nonpoor to African American poor neighborhoods, consistent with gentrification in the Northeast, Midwest, and South. The second section discusses the data used to produce these findings, the third section presents the estimation strategy, and the fourth section discusses the results. The last section presents my conclusions.
Data
I study forty large central cities and their suburbs that are located in thirty-six MAs. 3 I examine how poverty and racial composition in a neighborhood at the start of each decade affects population shifts by race and poverty status into and out of the neighborhood over the subsequent decade, after controlling for characteristics of the neighborhood. 4 I use the CMSA (consolidated metropolitan statistical area) and the PMSA (primary metropolitan statistical area) boundaries and designations of the US Census for the 1990 Census to create a data set on the economic, demographic, and geographic characteristics of neighborhoods (census tracts) of these thirty-six large MAs for 1970, 1980, 1990, 2000, and 2005–2009.
To study how neighborhoods are changing with respect to the races and incomes of their occupants, it is critical to use neighborhoods that have the same boundaries over time. When boundaries shift over time, changes in race and income composition may be an artifact of boundary shifts and not of any change in where people live. The boundaries of census tracts, however, change each decade. I use the GeoLytics versions of CensusCD Neighborhood Change Database (NCDB) and American Community Survey (ACS) for 2005–2009. GeoLytics standardizes the 1970, 1980, and 1990 census tract boundaries to those for 2000 and reports the averages for the 2005–2009 ACS data for the same boundaries, allowing a comparison of the same geographic boundaries over time. 5
There is another advantage of using the 2000 census tract boundaries for the 1970, 1980, 1990, and 2005–2009 data. As the boundaries of census tracts were drawn for the express purpose of creating areas with homogeneous racial and income characteristics, 6 they are problematic for measuring the extent of segregation by race or poverty status at any point in time. When changes are studied over time for the same geographic area so that the reconstructed boundaries are less likely to maximize the homogeneity of the area in the earlier years, census tract geography becomes less problematic. Fixed neighborhood or census tract boundaries are necessary for measuring changes in segregation over time. Analyses of segregation changes in MAs over time, with changing census tract boundaries that are redrawn conditional on changes in income and racial characteristics, will also be biased toward finding higher rates of segregation.
Consistent with other studies (e.g., McKinney and Schnare 1989; Abramson and Tobin 1995; Logan, Stults, and Farley 2004), the data for these thirty-six large MAs show that racial segregation varies by region. Figure 1 shows the levels of racial segregation 7 of African Americans and non-African Americans 8 for MAs by region for 1970 through 2009. Racial segregation steadily declined in large MAs in each region, with the greatest pace of decline occurring in Western and Southern MAs. As a result, MAs in the West and in the South over the 2005 through 2009 period have substantially lower levels of racial segregation than MAs in the Northeast and Midwest.

Racial segregation in large MAs by region, 1970–2009.
Figure 2 shows the levels of poverty segregation for the same MAs and time periods. Although poverty segregation is greater in 2005–2009 than in 1970 is all regions but the South, poverty segregation does not show a clear pattern of change over time and is substantially lower than racial segregation in all regions. After rising between 1970 and 1990, poverty segregation decreased slightly in 2000 and changed little in 2009. The Western and Southern MAs also have less poverty segregation than Northeastern and Midwestern MAs.

Poverty segregation in large MAs by region, 1970–2009.
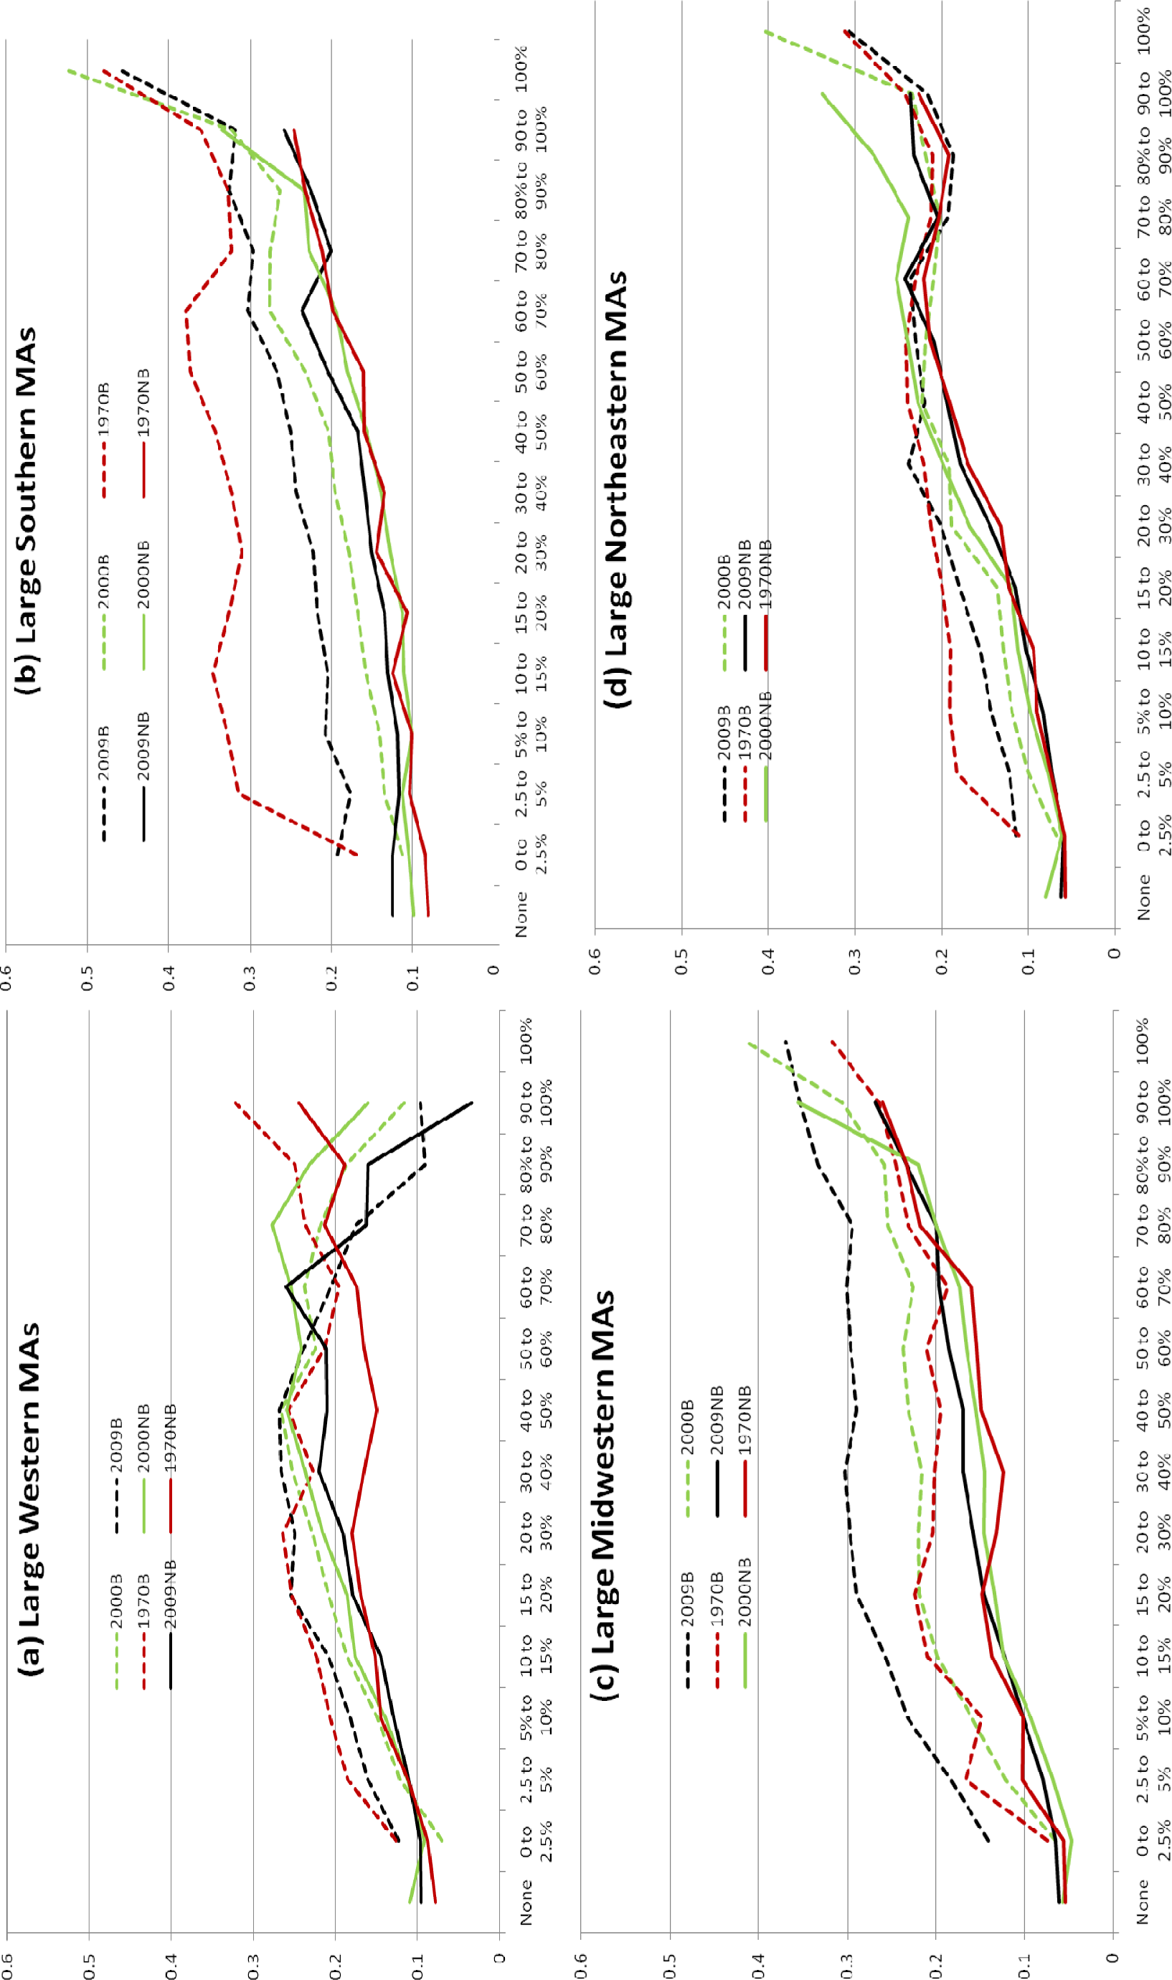
Figures 3a through 3d provide more details about how racial segregation declined in these MAs. They show the percentage of census tracts that are in each racial composition category, going from no African Americans to 100% African American, from 1970 to 2009 for large MAs in each region. Census tracts that are 0–2.5 percent African American are the most common racial composition in all years and regions with the exception of the South in 2009, and the proportion of tracts in the remaining composition categories declines as the proportion African American increases and we move to the more recent time periods, with the exceptions of spikes at 20–30 percent African American in all regions and also at 90–100 percent African American, except for the large Western MAs. The decline in racial segregation generally occurred, across all regions, by decreasing the number of tracts with less than 2.5 percent African Americans and increasing the number with between 2.5 percent and 30 percent, especially those between 2.5 percent and 15 percent. 9

Distributions of census tracts by proportion of African American, 1970–2009.
Changes in the relationship between the racial composition of census tracts and the poverty rates of both African American and non-African American residents are illustrated in Figure 4a through 4d, which graphs the average poverty rates (vertical axis) of census tracts as the percentages of African American residents (horizontal axis) increase. There is greater regional variation in the relationships between poverty and racial composition of census tracts than in the changes in the distribution of census tracts by racial composition shown in Figure 3. It does not appear that the status caste exchange findings of Alba, Logan, and Stults (2000) that the non-African American neighbors of African Americans tend to be of lower income, discussed above, can be generalized. Several patterns emerge: (1) Poverty rates for both African Americans and non-African Americans increase with the proportion of African Americans in the census tract. 10 (2) The positive relationship between the proportions of neighbors who are poor and who are African American in a census tract increased between 1970 and 2000 for non-African Americans (but declined in 2005–2009) and is greater for them than for African Americans. (Table 1, discussed below, reports these correlations by race and region for 1970 through 2009.) (3) Poverty rates for African Americans converged to those for non-African Americans when living in census tracts of the same racial composition between 1970 and 2000, regardless of the African American representation in the census tract, for each region except the Midwest. (4) For 2005–2009, the greater across the board increases in poverty rates for African Americans (particularly dramatic in the Midwest) reversed the 1970–2000 convergence of poverty rates by race by racial composition of neighborhood. (5) Non-African American poverty rates in census tracts with large representations of African Americans exceed those of African Americans, in the West and Northeast (and also in the South and Midwest in 2000).
Poverty rates of African American and non-African American residents in census tract by proportion of residents who are African American.
Correlation between Census Tract Percentage of Residents Who Are African American and Percentage of African American and non-African American Residents Who Are Poor, 1970–2009, Controlling for Central City and Adjacent Suburbs and MA.
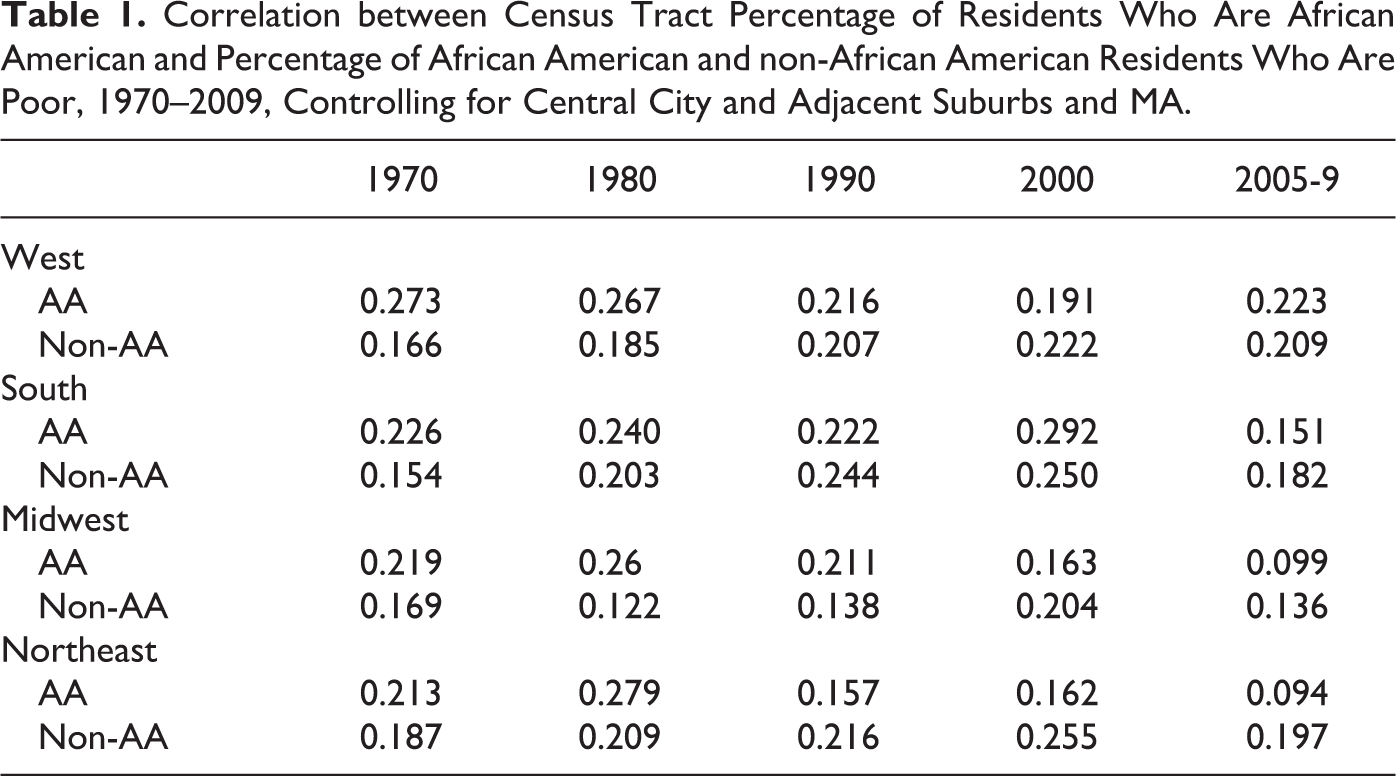
Table 1 shows the gradient for the relationship between racial composition and poverty rates for residents of census tracts by year and region of MA. The table reports the coefficients of the proportion of residents who are African American when the census tract poverty rate for African Americans (non-African Americans) is regressed on the African American proportion of residents, whether the census tract is in the central city, whether the census tract is suburban and adjacent to the central city boundary, and a series of dummy variables for the interaction of MA and year. The positive relationship between poverty rates and the proportion of residents who are African American in a census tract increased between 1970 and 2000 for non-African Americans in every region but decreased in the 2005–2009 period. The relationship for African Americans, however, weakened in every region but the South between 1970 and 2000. In 1970, there was a stronger relationship for African Americans than for non-African Americans, but that difference by race reversed itself in every region but the West by 2005–2009.
The positive relationship between poverty rates of all residents and the African American representation in census tracts, and the fact that the relationship tends to be stronger for non-African Americans who represent 88 percent of the population, suggests that decreases in racial segregation might add to poverty segregation. Higher-income non-African Americans may have relatively small numbers of higher-income African American neighbors, while PnAAs have increasingly larger numbers of PAA neighbors. Neighborhood racial composition may be becoming increasingly tied to poverty composition in many MAs.
In order to assess how both the race and the poverty status of residents affect whether a neighborhood attracted, and retained, residents of various race and poverty statuses, I measure the effects of both the race and the poverty compositions of neighborhoods on subsequent changes in those compositions.
The next section describes the approach for analyzing how neighborhoods integrated by race and income in large MAs across US regions from 1970 through 2000. The approach simultaneously considers the match between race and poverty status of neighbors and own race and poverty status and also controls for the role of other (nonracial, nonpoverty) characteristics of neighborhoods that might be mistaken for race or poverty effects if not considered.
Approach
Prior studies of the connections between poverty or income and racial segregation have examined the correlates between various MA characteristics and segregation levels for the entire MA. 11 In order to generate sufficient observations for statistical analyses, they use samples which are largely made up of smaller MAs. Because this study focuses on the thirty-six largest MAs and separates effects by region, there are an insufficient number of observations to analyze overall MA segregation levels. A study focusing on the sources of, and connections between, income and racial segregation levels only in large MAs requires a different strategy.
In order to analyze how the shifts of the four race-poverty groups affect racial segregation and poverty segregation, I analyze the components of the segregation indices, which are the proportion of the MA’s population of the race-poverty group residing in the census tract. By construction, the proportions sum to one for the each race-poverty group in each MA in each year. Also, the mean value of this proportion for the census tracts in each MA will be the same for each race-poverty group (because the proportions for each group must sum to one for the entire MA, the mean proportion for each group within an MA is one divided by the number of census tracts, which is the same for each group in the MA). Table 2 reports the mean proportions of the population (or any subgroup of the population) for each region, confirming that the mean is the same for each group for each year. The standard deviation of the mean for each region and race-poverty group confirms that PAAs are the most concentrated (largest standard deviation around the mean representation in a census tract in a region) and the nPnAAs are the least concentrated. Nonpoor African Americans (nPAAs) are more spatially concentrated than PnAAs in every region.
Means (and Standard Deviations) of Variables Used in Fixed Effect Analyses.

I do not use the more commonly used measure of the proportion of the census tract that is African American or poor. I use the proportion of the MA population of the race-poverty group residing in the census tract for the same reasons that these proportions are used for segregation indices. Changes in the proportion of the MA population of the race-poverty group residing in a census tract reflects the effects of the overall restructuring of population with the MA, including shifts into and out of neighborhoods on the census tract. The proportion measure is sensitive to relative differences in spatial concentration but is not sensitive to relative population sizes. Therefore, the proportion measure easily compares the severity of segregation of groups with very different sizes, allowing standardized comparisons across MAs, time periods, and groups. Also, the proportion measure “removes” or “standardizes” for swings in the population of a group due to secular economic changes in poverty rates and migration rates for an MA.
Fixed Effect Regression Analysis
It is extremely difficult to measure all of the attributes of a neighborhood that are valued by residents. When the racial and poverty compositions of the neighborhood are observed, and other characteristics that are correlated with racial and poverty compositions but that matter in neighborhood outcomes are not observed, an analysis of the effects of race and poverty composition themselves on neighborhood outcomes will be biased toward finding that race or poverty composition affects neighborhood characteristics. 12 By measuring the effects of changes in observed characteristics for neighborhoods whose unobserved characteristics are assumed to be constant over time, one can obtain consistent estimates of the effects of the observed characteristics.
Obviously, many neighborhood characteristics change between 1970 and 2009 and their effects are not measured by the neighborhood fixed effect. When these changing characteristics are the result of (i.e., endogenous to) the changes in race and income composition, they should not be controlled. When the characteristics change exogenously, that is independent of the changes in racial and income composition, however, then they should be controlled in order to get unbiased estimates of the effects of neighborhood racial and income compositions. I control for these characteristics to the extent possible with the data.
Model Specification
Specifically, I model the MA’s proportion of a race-poverty status group resident in a census tract as a fixed-effect panel of the form:
where
A fixed effect analysis cannot estimate the effects of any particular census tract attributes that do not change, that is the fixed effects. These effects are “controlled for” when estimating the race and income composition effects but are not separately evaluated. The only neighborhood effects that can be analyzed are those that change. To measure the effects of race and income composition of the neighborhood on subsequent population shifts within the MA, it is also necessary to control for other exogenous changes in neighborhood attributes (that are not included within the unchanging fixed effects); that is, changes in attributes that are not the result of changes in the racial and poverty composition of neighborhood residents. Because there may be exogenous changes in a neighborhood’s attributes over thirty years, I measure the effects of three general sets of neighborhood attributes.
First, I measure the relationships between the proportions of each race-poverty group at the beginning of the decade and the proportions of the dependent variable race-poverty group in the census tract at the end of the decade, such as the relationship between the proportions of the MA’s PAAs resident in a neighborhood at the end of the decade and the proportions of the other race-poverty groups at the beginning of the decade (i.e., PAAs, nPAAs, PnAAs, and nPnAAs). If the fixed effects and the controls for other exogenous changing neighborhood characteristics (discussed below) adequately control for the exogenous nonracial and nonpoverty characteristics of a neighborhood, then the coefficients of the initial or start of the decade proportions of other race-poverty groups measure the role of the racial and poverty characteristics of neighbors on the subsequent locations for each race-poverty group in the MA.
Second, I add the physical and socioeconomic characteristics that affect the relative attraction of the census tract for the various race-poverty groups that change exogenously between 1970 and 2009 (i.e., are not fixed census tract effects). Any characteristics that change as a result of changes in the poverty and racial composition of residents, such as tenure type or family composition, are endogenous and should not be included because they would bias the estimation of the racial and income composition effects (although enduring values are reflected in the fixed effect for 1970 through 2009). I concentrate on three changes that are likely to be exogenous: changes in the physical stock of housing due to overall population (as opposed to composition) change, changes in ethnic composition of non-African Americans, and changes in relative prices or affordability of housing.
I use three measures of the non-fixed physical changes in the housing stock within a census tract: population density at the start of the decade, population growth in the previous decade, and proportion of group housing at the start of the decade. Population density is an index of qualities of the housing stock such as the share of multifamily versus single family housing, the lot size for single family houses, and the construction of new housing developments. This attribute is exogenous because it changes with intrametropolitan shifts of the total population but not with the shifts in any particular poverty or racial grouping of the population. Change in population density of a neighborhood, however, may affect its appeal to particular race and poverty groups independent of the race and income composition of the neighborhood. Because higher-income residents disproportionately live in houses on larger lots, they shift more toward less densely populated neighborhoods. When other attributes of the neighborhood are the same, neighborhoods with greater population densities, then, are expected to be less attractive to higher-income residents. I include both population density of the census tract and its square at the start of the decade.
The percentage change in population (i.e., population growth) for the previous decade (after controlling for population size at the start of that prior decade), indexes the age and/or quality of the housing stock, including renovations and rehabilitations, as well as age of the housing when originally built (which would be reflected in the data on the decade the housing unit was built). I include both the population growth rate for the census tract for the previous decade and its square. To control for the larger values of the rate associated with a small base, I add a control for the census tract total population count at the start of the decade.
Because group housing often includes persons not making the usual neighborhood location decisions, I control for the proportion of the housing that is group housing and its square. I control for the proportion of the population over age 65 at the start of each decade, and its square, to index the underlying mobility differences associated with age that vary across census tracts.
The 1970 through 2009 period has seen a substantial increase in the rate of international immigration, altering the proportion of the non-African American population that is Hispanic or Asian. Furthermore, the increases in Hispanic representation have been regionally concentrated, more in the West and South than in the Northeast or Midwest (see Table 2), especially before 1990. Studies have conflicting findings on whether MAs with more ethnic diversity have greater racial segregation. 16 So as not to confuse the effects of the changing ethnic composition of non-African Americans with the effects of race and income composition of a neighborhood on its attraction for various groups, I add a control for the Hispanic proportion of the neighborhood population, and its square, at the start of each decade. 17
There are potential differences in the economic circumstances (wealth, access to credit, and income) by race of both the poor and the nonpoor (Wolfe 2000; LaCoer-Little 1999). Because African Americans of equivalent poverty status to non-African Americans typically have lower wealth and less access to mortgages and, within poverty status, African Americans have lower average income, if I do not control for changes in the affordability of housing in a neighborhood between 1970 and 2009, I may confuse the effects of race differences in income, wealth, and mortgage access with the effects of race and poverty of neighbors. 18 By adding the median household income in a census tract at the start of each decade relative to the MA median, I control implicitly for changes in housing or land values in the neighborhood that may be affordable differentially for African American and non-African American households of the same poverty status. (Of course, the neighborhood fixed effect controls for enduring differences in affordability of the neighborhood.) The addition of the median neighborhood income allows the coefficients on the presence of various racial-income groups to reflect the effects of the race and poverty characteristics of neighbors, rather than the affordability of housing in the neighborhood (assuming that median household income indexes housing costs in the neighborhood). For these same reasons, I control for the proportion of the population receiving public assistance at the start of the decade, and its square.
Finally, shifts in the shares of an MA’s race-poverty groups in a census tract occur when members of a group move away to other census tracts, move in from other census tracts, or do not move at all but change their poverty status. MAs, and census tracts within MAs, which are growing in population may have different racial and poverty integration dynamics from those that are declining in population because more of their compositional shifts are due to movements in, rather than out. In order to check whether the results are robust to different directions of movements, I reestimated all regression analyses separately for census tracts declining in population and those growing in population. Patterns were basically the same across declining and increasing population neighborhoods, with one difference. The positive effects of PAA presence in Northeastern, Midwestern, and Southern neighborhoods, as noted below, arose primarily in growing neighborhoods. These results are available from the author.
Results and Discussion
Tables 3 through 6 show the complete results of the sixteen fixed effects regression analyses of the census tract's proportion of the MA's population for each race-poverty group at the end of each decade, by region. If the fixed effect, coupled with controls for the year and MA interactions and the three changing neighborhood characteristics of income, density, and Hispanic composition and others, control for all of the characteristics of neighborhoods correlated with the racial and poverty composition of its residents, then the coefficients for the racial and poverty composition of residents reported in Tables 3 through 6 isolate the interactive effects of race and poverty composition of neighborhoods on the shifts in populations within MAs, given the options available. The dependent variables are the end of the decade’s proportions of the MA’s population of the racial-income groups residing in the census tract, which are the components of the racial and poverty dissimilarity indices for the MA. Table 3 reports the results for nPAAs, Table 4 for PAAs, Table 5 for nPnAAs, and Table 6 for PnAAs.
Fixed Effect Estimates of Proportions of MA Race-Poverty Group Resident in Neighborhoods Ten Years Earlier on Proportions of MA Nonpoor African American in Neighborhood of Metropolitan Areas: 1980–2009 by Region.

Note. Numbers in italics are t-statistics, all regressions also include MA-Year fixed effects.
Fixed Effect Estimates of Proportions of MA Race-Poverty Group Resident in Neighborhoods Ten Years Earlier on Proportions of MA Poor African American in Neighborhood of Large Metropolitan Areas: 1980–2009 by Region (Numbers in italics are t-statistics, all regressions also include MA-Year fixed effects).
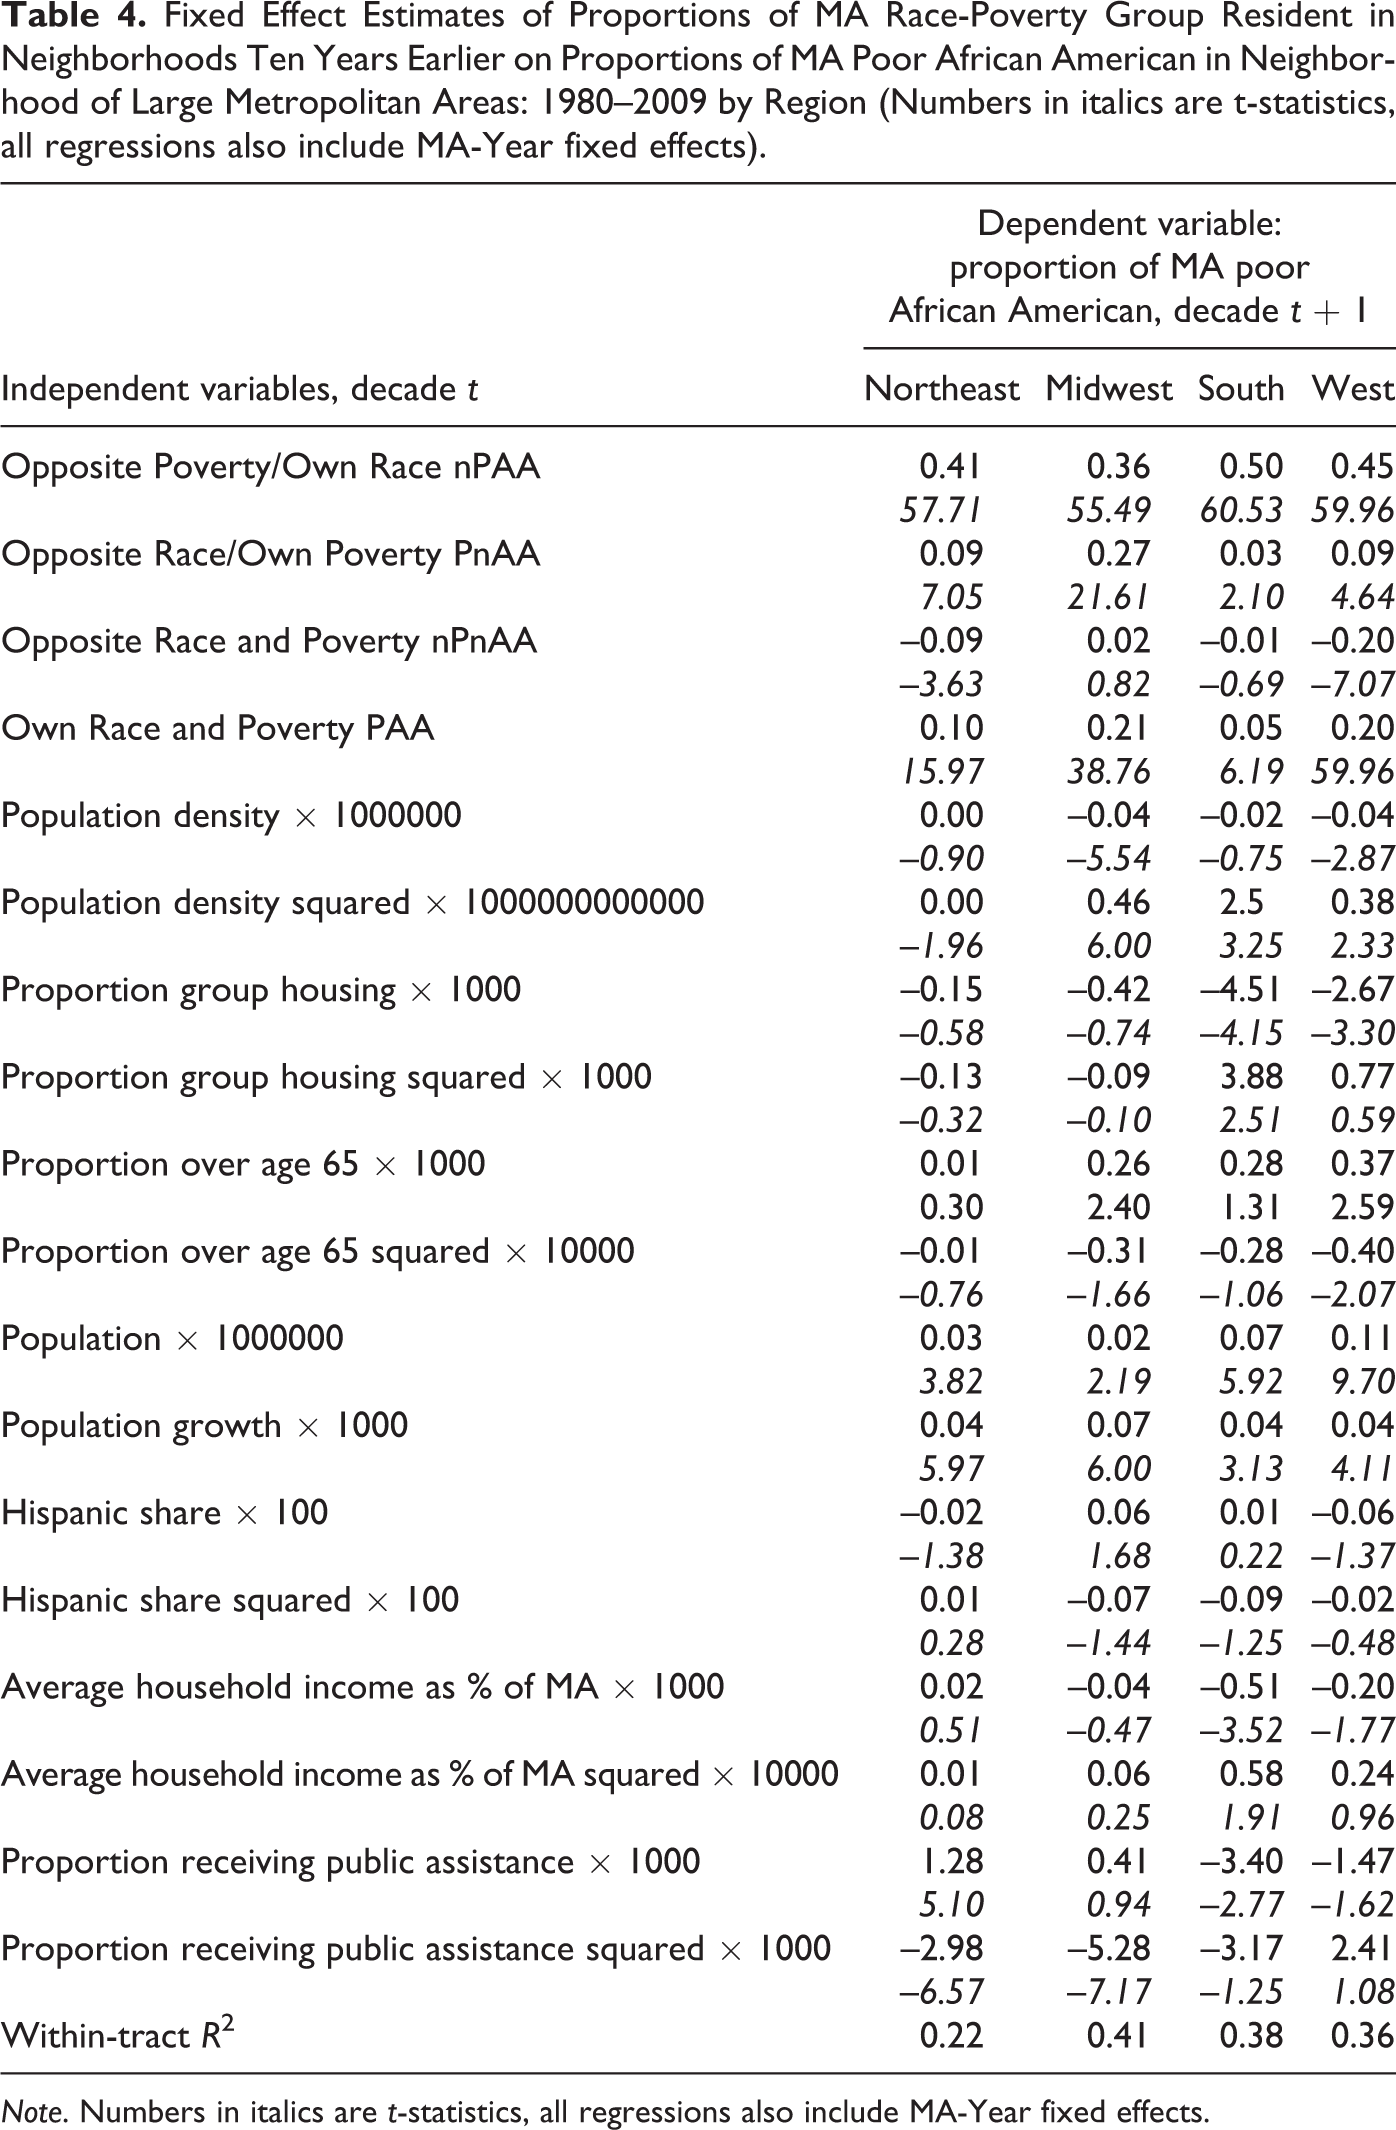
Note. Numbers in italics are t-statistics, all regressions also include MA-Year fixed effects.
Fixed Effect Estimates of Proportions of MA Racial Poverty Group Resident in Neighborhoods Ten Years Earlier on Proportions of MA Nonpoor Non-African American in Neighborhood of Large Metropolitan Areas: 1980–2009 by Region.

Note. Numbers in italics are t-statistics, all regressions also include MA-Year fixed effects.
Fixed Effect Estimates of Proportions of MA Racial Poverty Group Resident in Neighborhoods Ten Years Earlier on Proportions of MA Poor non-African American in Neighborhood of Large Metropolitan Areas: 1980–2009 by Region (Numbers in italics are t-statistics, all regressions also include MA-Year fixed effects).
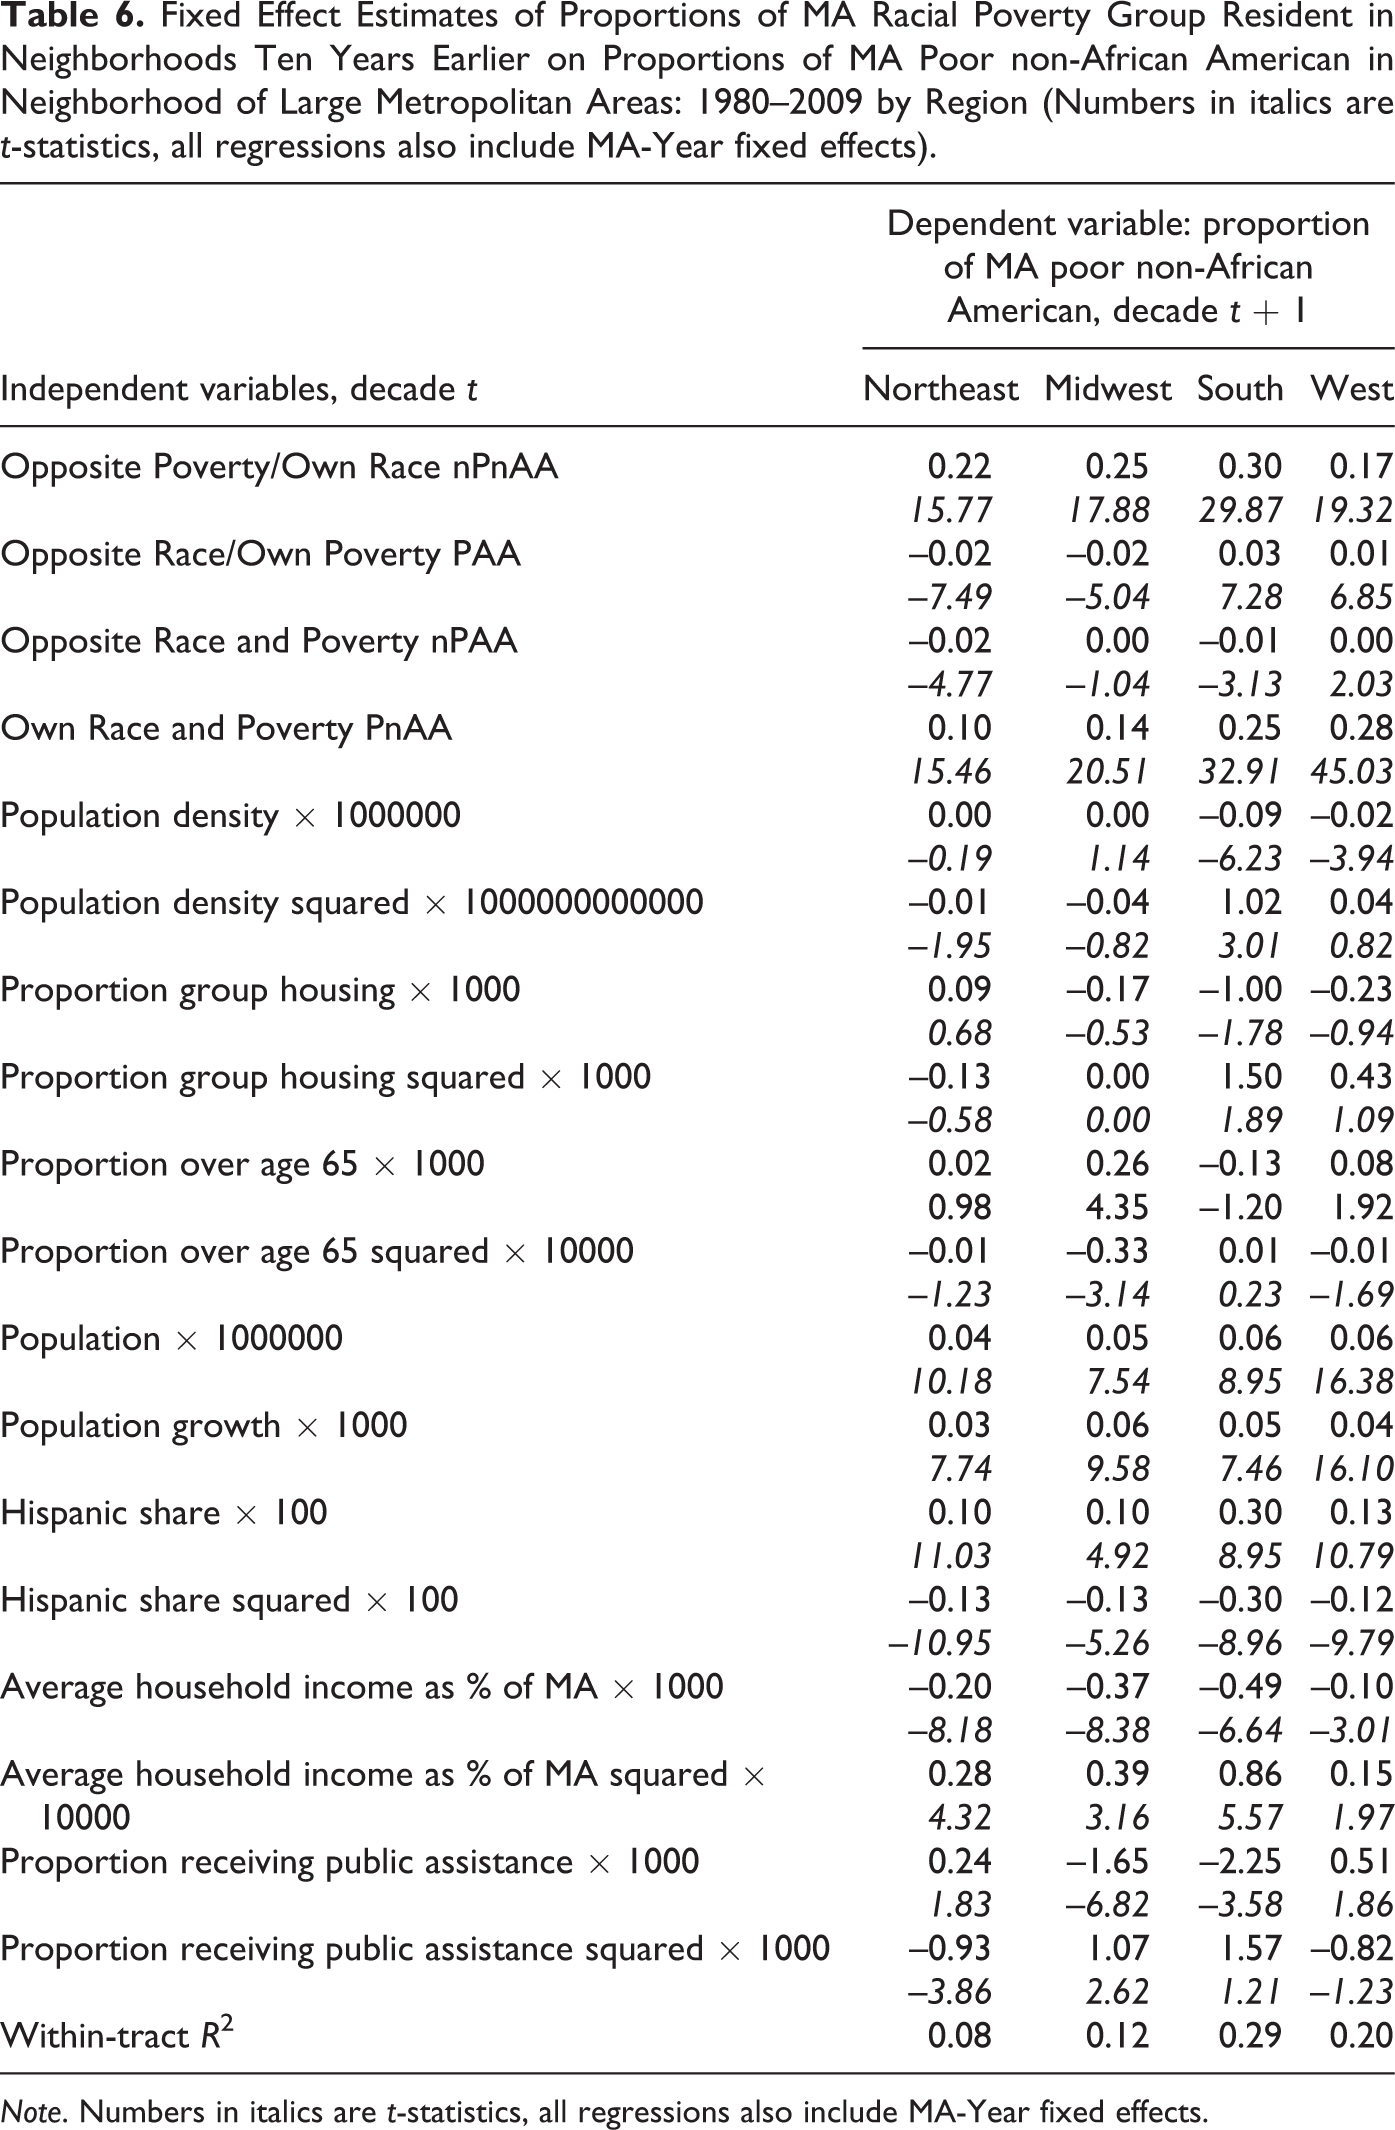
Note. Numbers in italics are t-statistics, all regressions also include MA-Year fixed effects.
Figure 5 summarizes the effects of race and poverty composition of residents on subsequent shifts into and out of neighborhoods for these large MAs by region, which are reported in detail in Tables 3 through 6. Horizontal arrows reflect shifts toward poverty integration; vertical arrows reflect shifts toward racial integration. Diagonal arrows reflect shifts that lead to integration both by race and poverty. The thickness of the arrows reflects the relative sizes (coefficients) of the effects.
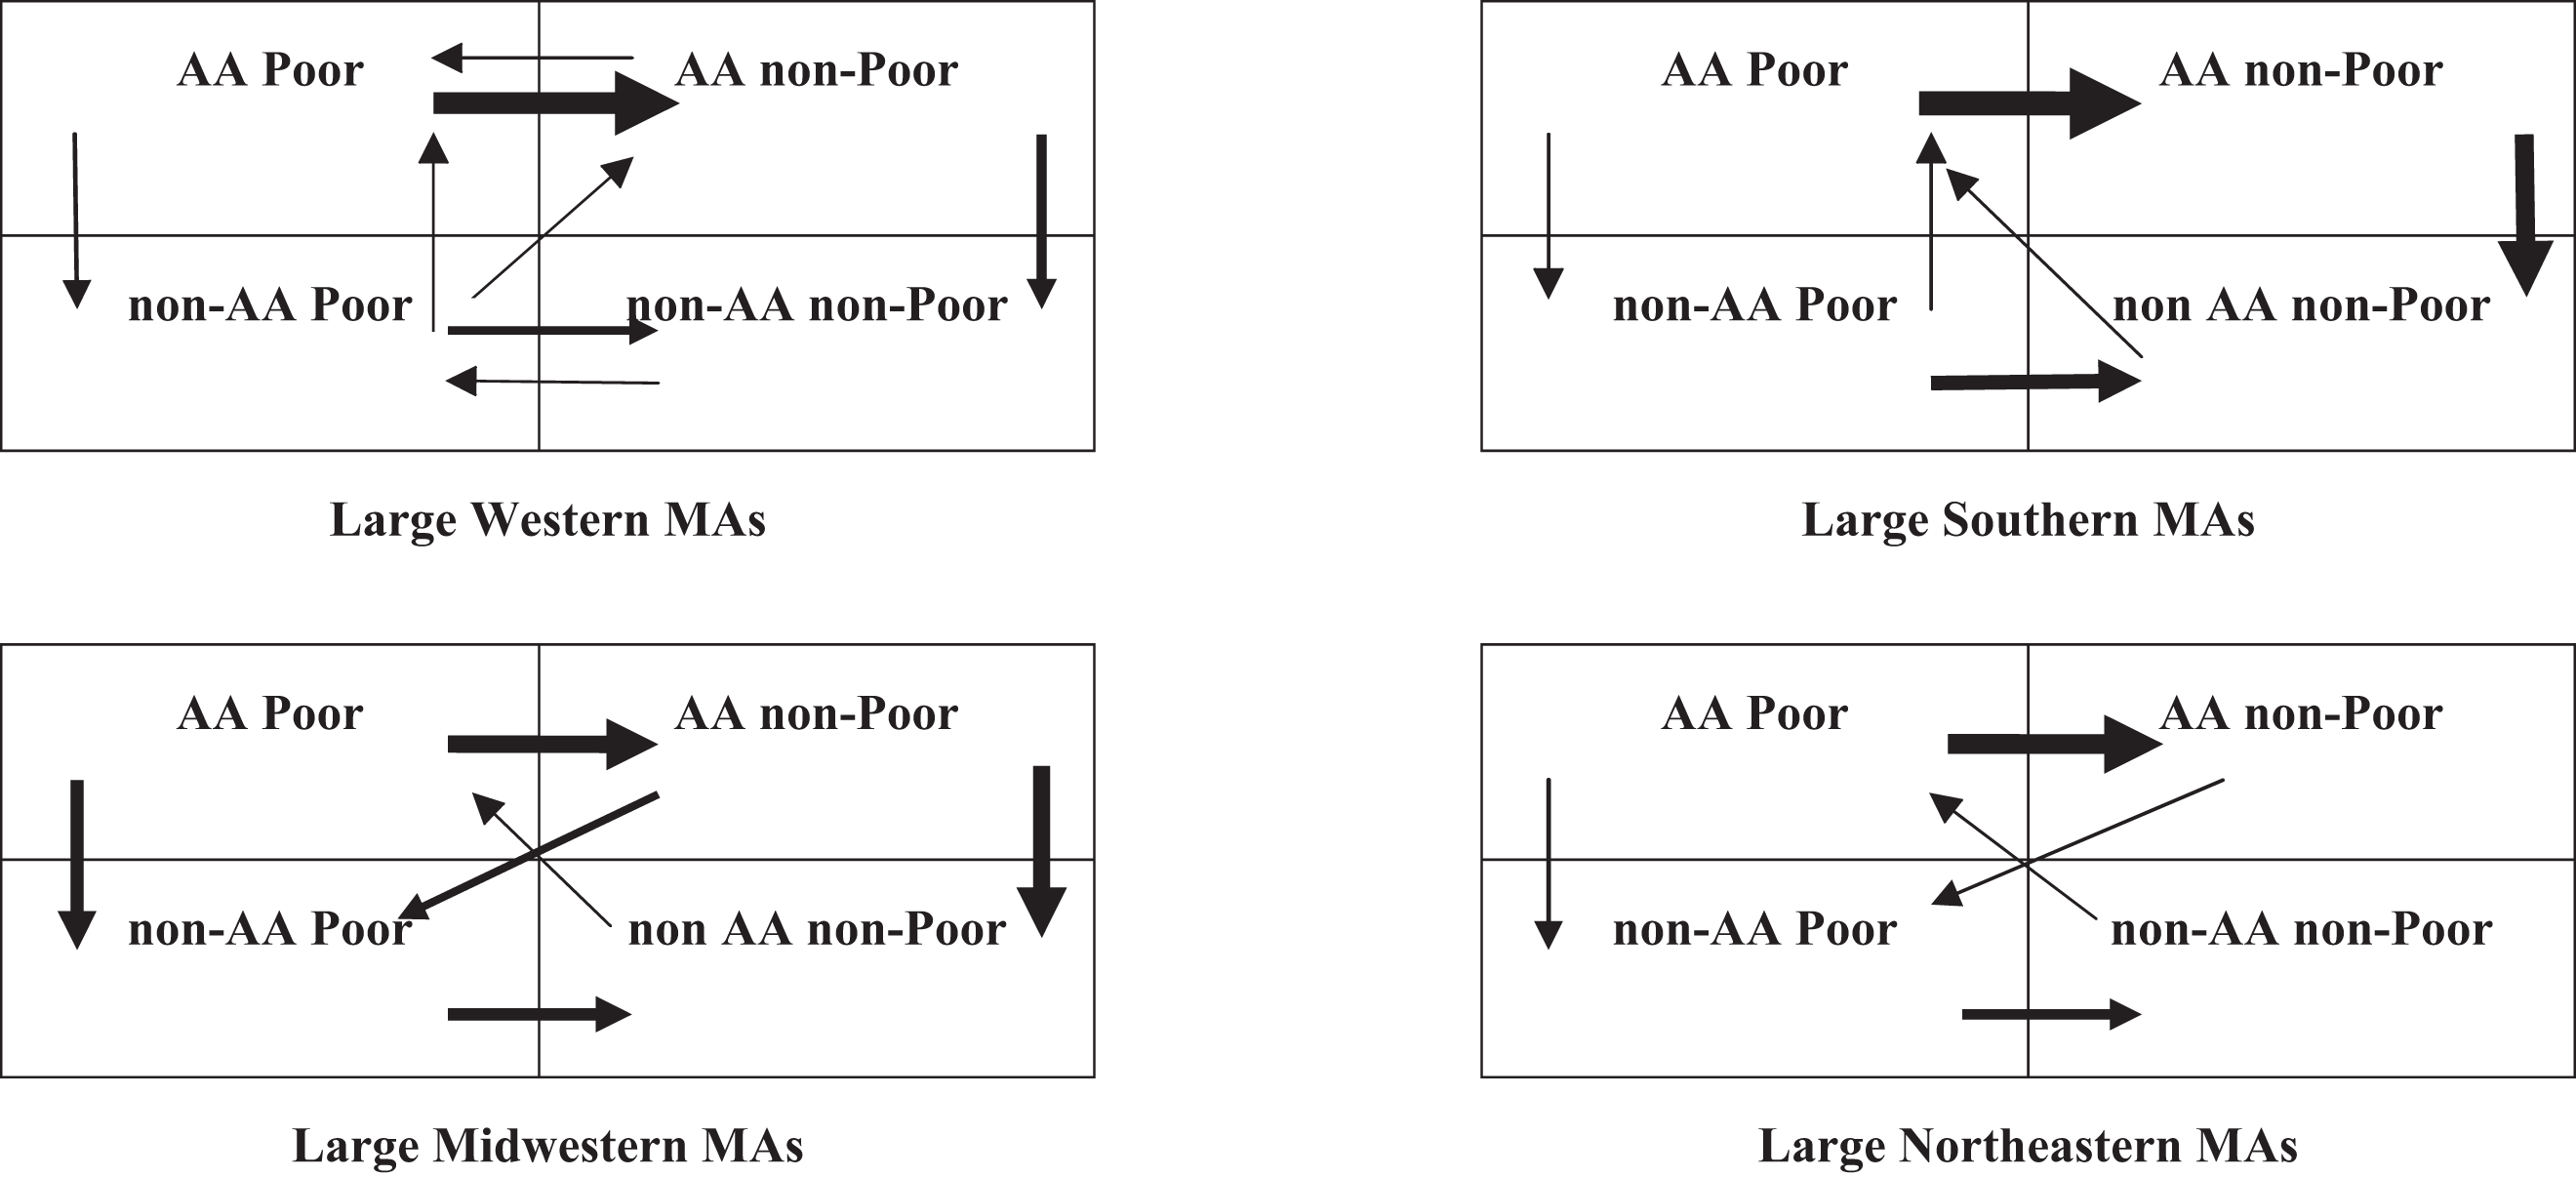
Figure 5 has more horizontal arrows than vertical arrows and the horizontal arrows are “thicker,” reflecting the fact, shown in Figure 1, that the poor and nonpoor are more integrated than African Americans and non-African Americans in large MAs. For MAs in all regions, consistent with housing filtering from the nonpoor to the poor over time, 19 the poor shift toward the neighborhoods with more nonpoor of their own race, and the effect is stronger for African Americans. Just as poverty integration tends to occur within racial groups, racial integration tends to occur within poverty groups. In all regions, racial integration occurs by African American poor shifting toward neighborhoods with non-African American poor. Similarly, the African American nonpoor shift toward neighborhoods with their non-African American counterparts everywhere but in the Northeastern MAs. In the West, South, and Midwest, these interracial shifts among the nonpoor are somewhat larger than among the poor, consistent with findings that integration levels for African Americans increase with income. 20
Diagonal arrows, which are fewer and “less thick” than horizontal (poverty integration) or vertical (race integration) arrows, reflect shifts toward both racial and poverty integration. The racial integration of the African American nonpoor in the Midwest and the Northeast is augmented by diagonal shifts of the African American nonpoor to neighborhoods with more non-African American poor, consistent with the expectations of status caste change as discussed above. Also consistent with status caste exchange, in the West, non-African American poor shift to neighborhoods with more African American nonpoor. In the South, Midwest, and Northeast, the diagonal arrows from the non-African American nonpoor to the African American poor indicate shifts toward poverty and racial integration that are consistent with gentrification. In the West, any gentrification by the non-African American nonpoor seems to be in non-African American poor neighborhoods; these shifts are not observed in any other region.
Table 3 presents the detailed results for shifts by nPAAs that are summarized on Figure 5. The third row (Opposite Race and Poverty) measures the effects, by region, of the initial representation at the beginning of the decade of PnAAs, on the proportion of nPAAs residing in the census tract at the end of the decade. The coefficients indicate how the representation of a neighborhood’s residents of opposite race and poverty at the start of the decade are associated with the proportion of MA nPAAs residing in the tract at the end of the decade. A positive coefficient in any region’s column for this row denotes a move toward both racial and poverty integration. For Northeastern MAs, the 0.07 coefficient in the third row, first column, indicates that a 0.01 percentage point greater proportion of the MA’s PnAAs (the opposite race and poverty group for nPAAs) in the neighborhood at the start of the decade leads to a 0.0007 percentage point increase in the percentage of MA’s nPAAs at the end of the decade. For nPAAs, the coefficients for the opposite race and poverty groups’ representation at the beginning of the decade are positive for MAs in the Northeast and Midwest, relatively large, and highly significant, but negative and absolutely smaller in size for the South and West (although less negative than for PAAs in the South). Among large MAs in the Northeast and Midwest, there is a strong tendency for nPAAs to integrate by race and poverty status by shifting toward neighborhoods with PnAAs, in a manner consistent with status caste exchange as suggested by Alba, Logan, and Stults (2000). When the model is estimated separately for census tracts declining in population and those increasing, opposite race and poverty status population (PnAAs) coefficients were positive and fairly close in magnitude for both increasing and declining population census tracts in the Northeast and Midwest regions, although they were somewhat larger for declining population census tracts in both regions.
The racial integration of the nPAAs across large MAs in the Midwest, South, and West regions was primarily within their same poverty group as indicated by the larger positive coefficients in the second row than in the third row of Table 3. So, in these regions, the shifts of nPAAs leading to racial integration did not contribute to poverty integration. The separate estimations for growing and declining census tracts indicate that the pattern of greater racial integration with same poverty group was substantially stronger in declining population census tracts for these two regions. The nPAAs in Western MAs also moved to neighborhoods with PAAs, but at a substantially slower pace, leading to some poverty integration within own race for nPAAs in these regions.
For PAAs (Table 4) and PnAAs (Table 6), the first row (Opposite Poverty/Own Race) measures the effects, by region, of the initial representation of the nonpoor of the group’s own race, on the proportion of poor residing in the census tract at the end of the decade. The large, positive coefficients in each region’s column denote relatively strong shifts toward poverty integration within race. All of the coefficients for the opposite poverty same race groups’ representation at the beginning of the decade (first row, all columns of Tables 4 and 6) are positive, larger than for any other group (including own), and highly significant. Among large MAs in all four regions, there is a strong tendency for the poor of both races to integrate with a higher-income group by shifting toward neighborhoods with higher income members of their own race. These strong shifts generally occur both in declining and in increasing population census tracts. The relative shifting of the poor to the census tracts where the nonpoor of their own race live is consistent with housing filtering from the nonpoor to the poor over time, although there is no reason why this should be exclusively within own race for nAAs.
The largest share of the population of any of these MAs is the nPnAAs, whose shifting intra-metropolitan locations are reported in Table 5. This group’s shifts across census tracts do little to promote either racial or poverty integration. The nPnAAs remain where they have already located, with no relative shifts toward census tracts with other race-poverty groups. For nPnAAs, all of the coefficients for the same race same poverty groups’ representation at the beginning of the decade (fourth row, all columns of Tables 5) are positive, overwhelmingly larger than any others, and highly significant. The only exceptions are small positive effects of PAAs in all but the West and the small positive effect of PnAAs in the West, consistent with racial and/or poverty integration associated with gentrification. This interpretation is consistent with the results for census tracts with increasing population levels. The relative shifts of nPnAAs vary with whether population in the census tract declines or increases. The positive effects of PAA presence in Northeastern, Midwestern, and Southern neighborhoods arose primarily in neighborhoods experiencing net in-migration over the decade, which is consistent with a gentrification interpretation. Otherwise, the patterns were basically the same across declining and increasing population neighborhoods.
Conclusions
There have been substantial decreases in racial segregation in large MAs throughout the United States with little change in poverty integration between 1970 and 2009. Nonetheless, US neighborhoods remain substantially more segregated by race than by poverty status. Racial integration has occurred mainly through decreases in the proportions of census tracts that include no African Americans and increases in the proportions with between 2.5 percent and 30 percent African American residents. I find that poverty segregation has not changed with decreasing racial segregation primarily because racial integration is occurring overwhelmingly among African Americans and non-African Americans who share the same poverty status. At the same time, there has been an increase in the sorting by poverty status of non-African Americans into census tracts with more African Americans. As a result, the non-African Americans in census tracts with greater representation of African American residents are increasingly poor, and increasingly poorer than their African American neighbors, especially between 1970 and 2000.
The nPAAs are increasing racial integration by shifting toward nPnAA census tracts in all regions but the Northeast. In the Northeastern and Midwestern MAs, there is a shift of nPAAs toward PnAA neighborhoods increasing both racial and poverty integration in a manner consistent with status caste exchange theory. In contrast, the shifts of nPAAs toward nPnAAs increase racial integration but not poverty integration in the South and West.
The poor shift primarily and largely toward the nonpoor of their own race in all regions, a pattern that contributes to less poverty segregation but not affecting racial segregation.
The nPnAAs, who account for over 80 percent of the population, make few shifts toward either poverty or racial integration; rather, PnAAs shift to their census tracts to increase poverty integration and nPAAs shift to increase racial integration. The exception is a small shift of nPnAAs toward PAAs in all regions but the West, consistent with gentrification. In the Western MAs, there is also evidence of gentrification but within race: nPnAAs shift slightly toward PnAA census tracts.
While the inclusion of controls for the percentage of residents who were Hispanic (and the square of that percentage) did not affect the correlations with race-poverty group representation in the census tracts, Hispanic representation frequently had an independent correlation with the shifts of race-poverty groups. Not surprisingly, neighborhoods increasing their shares of MA PnAAs had more Hispanic representation in each region. The neighborhood’s share of the MA’s PAAs was not correlated with Hispanic representation in any region. The neighborhood’s share of the MA’s nonpoor of both racial groups declined with Hispanic representation in the West, but increased in the Northeast. These regional variations may arise from differences in the proportions of residents who are Hispanic or from differences in the ethnic, and therefore social and economic, composition of the Hispanic population by region.
Footnotes
Declaration of Conflicting Interests
The author(s) declared no potential conflicts of interest with respect to the research, authorship, and/or publication of this article.
Funding
The author(s) received partial financial support for the research reported here from the U.S. Department of Housing and Urban Development, but no financial support for the authorship and/or publication of this article.