



Abstract
We propose a network flow model to study problems in commuting traffic in the railway network of the Tokyo Metropolitan area. Through this network, about seven million passengers commute, and about 7,500 trains transport them in morning rush hours. Trains are usually crowded and subject to delay caused by overcrowded passengers. In addition to the huge traffic volume, such facts intensify the situation that the commuters concentrate in commuting during short time period, traveling radial lines directing to the central district, and choosing a “better (higher speed)” train service. In order to relieve such conditions, not only investments in hardware but also soft approach are important to fully utilize the existing capacity of the network to average the number of passengers across the trains. Our model consists of a time–space network (or schedule-based network) and detailed traffic data on route choice of commuters. The former has been intensively studied to consider traffic problems where each vehicle service is operated according to a timetable. Using this network, every train services and actions of passengers can be represented by nodes and edges of the network. The latter is the questionnaire survey of commuting traffic in Metropolitan area being done in every five years. We use the survey conducted in 2005, which has about 140,000 respondents. Another important point of our model is that it is able to consider the whole railway network universally in one system.
Introduction
In the Tokyo Metropolitan area, about seven million commuter ticket holders use the public railway network to commute from their homes to working places or schools every weekday morning. The distribution of trip distances in the railway network is shown in Figure 1a, where the trips are classified into commuter ticket trips and onetime ticket trips. Moreover, trips are subdivided into groups according to their arrival times at their destination stations. Figure 1b shows the accumulated number of commuters (vertical axis) through their departure time (horizontal axis).
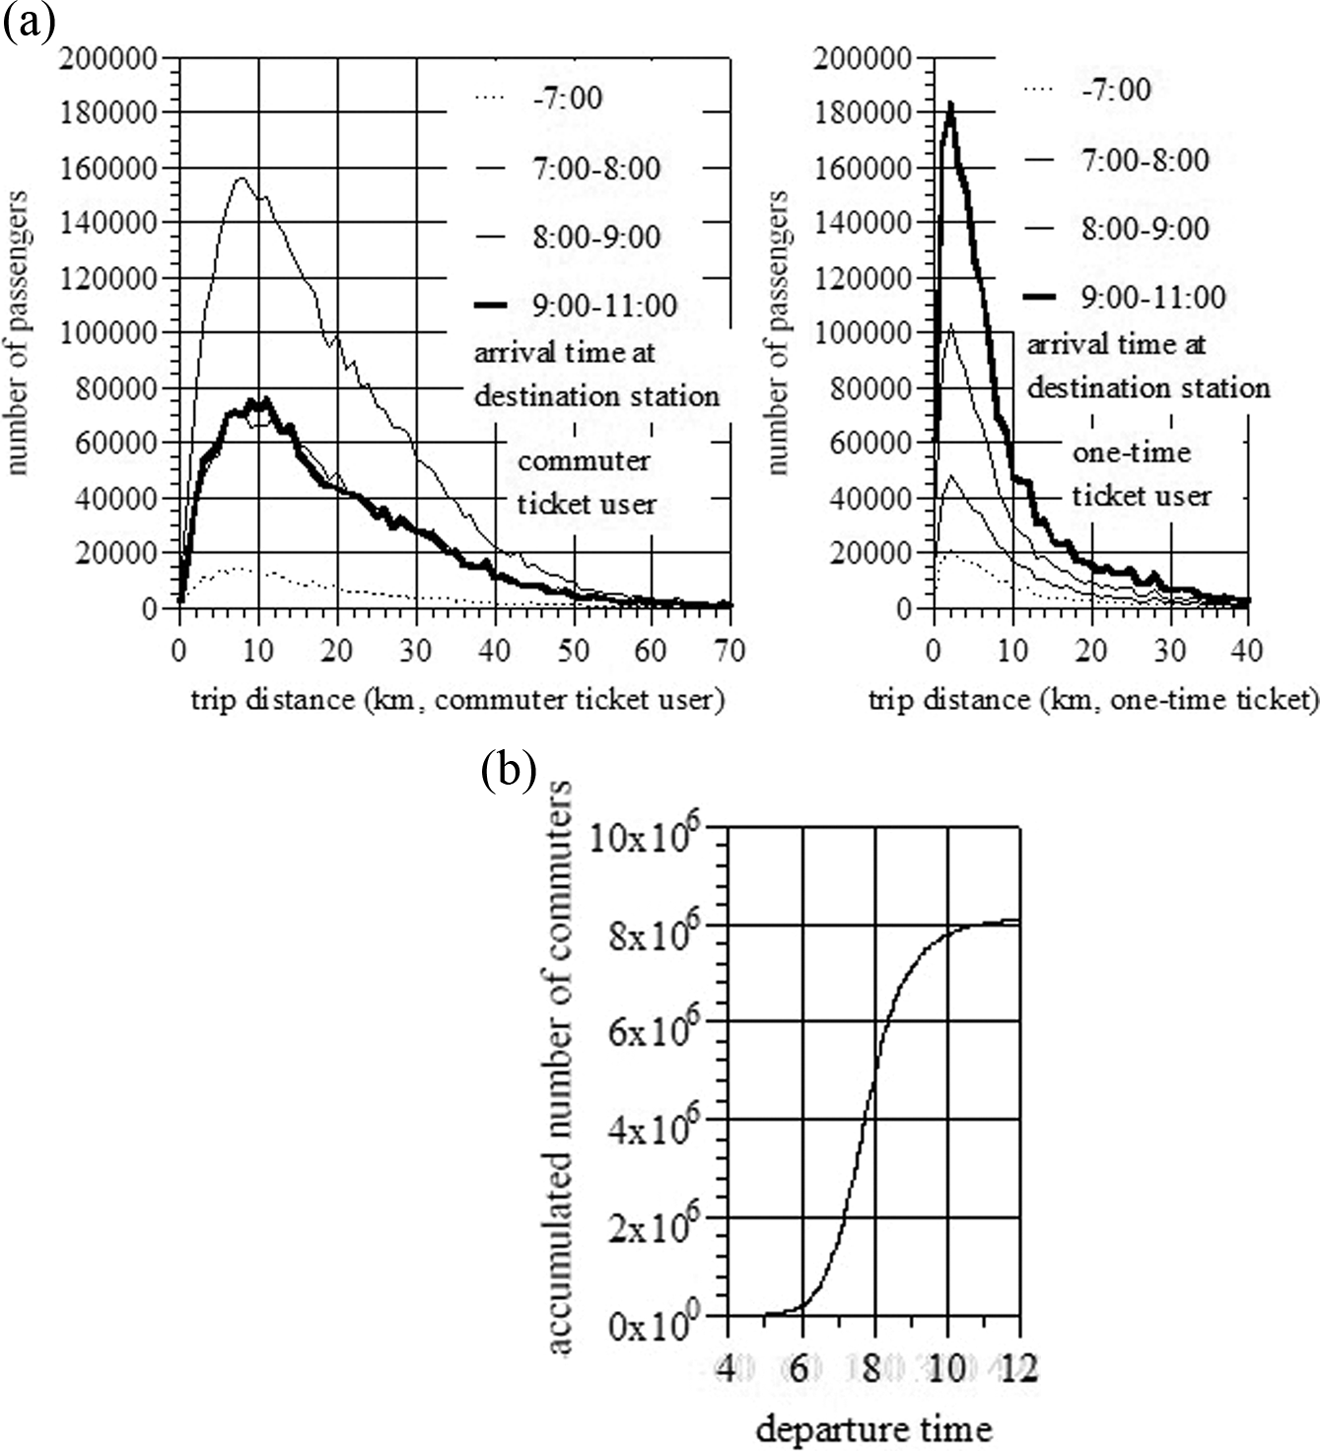
Commuter traffic in the railway network of the Tokyo Metropolitan area (based on the data in Institution for Transport Policy Studies [ITPS] 2007): (a) Trip distance distribution of commuters and (b) accumulated number of commuters on board.
Roughly speaking, commuters’ trip distance is much longer than that of onetime ticket users. Most of the commuters start their trips from seven to eight o’clock. During these hours, trains as well as stations are highly crowded with commuters.
For many years, various public investments have been done into the system of railways to make the traffic ordeal comfortable, such as opening new railway lines, doubling existing tracks, operating a direct train service through different lines, and providing an advanced train control system to increase frequencies of train service.
In addition to these investments in hardware, some improvements in software have been considered. The commuters concentrate to go to their working places in a relatively short period as indicated in Figure 1b. Furthermore, in space dimensions, almost all of them move from the suburbs to the central district of Tokyo, which leads to concentration in train services along several radial lines. Another cause is that many commuters care not so much congestion rather than trip time, and therefore when both local and express train services are available, they choose the latter first to make them crowded. In order to relieve such concentration, staggered commuting hours are encouraged, but yields little results.
Since the long-term decline in traffic demand of workers is forecasted along with the progression of aging in Japan, it is hardly worth investing in huge railway facilities. Therefore, it becomes more important to consider such plans using the existing hardware to control the traffic flow in the rush hours to spread over time and space.
We adopted a network flow model in Taguchi (2005a) and Taguchi et al. (2005), which could be used to consider how a proposed plan will be able to improve the traffic conditions mentioned previously. Since traffic demand of commuters is highly time dependent, and train services to transport them are also time dependent, any network model worth considering must accept time-dependent flow if we would handle commuter traffic in the real world. We have to consider another important view point. There are about thirty railway companies operating in the railway network of Tokyo. Within each company, they operate and manage train services as well as passenger traffic systematically in detail. However, it is not sufficient because passengers move by changing trains freely throughout the network caring little about what company operates his train. Therefore, it is necessary to construct a network model seeing the whole network universally in one system.
The train services to be considered are assumed to be operated according to a timetable, so that every train services and actions of passengers, such as boarding on and off, moving from one station to another, and changing trains, can be represented by nodes and edges of a static network, called scheduled-based network, or time–space network. Many studies have been conducted in this area, such as early studies Ieda et al. (1988) and Shida et al. (1989) in Japan, Nuzzolo and Crisalli (2004) and Pallottino and Scuttella (1998) and its references.
Using time–space networks, we formulated commuter traffic problems in the Tokyo Metropolitan area with time-dependent demand as static network flow problems. To this network, the traffic assignment procedure based on the user equilibrium principle (Wardrop's first principle; Potts and Oliver 1972) is introduced, and used to evaluate the effects on the commuter traffic achieved by a plan changing train services, or commuters’ behavior of choosing them. In Taguchi (2005a), we estimated the potential users of the new Nanboku line subway who would switch over from the existing rail services. We also discussed a paradoxical result of adoption of staggered office hours in Taguchi (2005b).
Another discussion in the Den'entoshi line is more realistic (Toriumi, Nakamura, and Taguchi 2005). Many railway companies have both express and local train services along the same line. It is usual that express trains are much more crowded than local ones, and this imbalance intensifies delay. If we have some means to force surplus commuters in express trains to use remaining capacities of local ones, congestion could be reduced by averaging the number of passengers across the trains. However, it might be hard to force some of the passengers to use local trains by persuading that their movements from express trains to local ones make the performance of the entire system better, when they are free to choose the former. We revised the existing train schedule to a new schedule in which all the express trains are degraded to local, so that every train becomes available at all stations and offers equal service in travel time. Consequently, the passengers have no chance to choose a “better” service and the boarding rate could be averaged. The Den'entoshi line has only one track for each upward and downward direction. It is a crucial point which leads our procedure to the success in averaging the traffic demand over several trains arriving at each station in close succession. Applying our train service simulation procedure, which will be described in the third section, we found that the average travel time becomes shorter than the present time although the former express trains have to stop at all stations. Our plan was slightly modified and adopted as a real train schedule.
In this article, we pick up the JR Chuo line. The Den'entoshi line is the most crowded line in Tokyo except the lines serviced by the East Japan Railway Company (JR East). The JR East is the biggest railway company in Japan and has forty lines in Tokyo Metropolitan Area. It is expected that we could translate our former approach to the Chuo line, which is one of the most crowded lines in the JR East. Through this line, about 353,000 commuters flow from the suburbs of western Tokyo into the center every morning. It is known to be heavily crowded and subject to disrupted schedule delays by congestion. Our approach is almost same in the case of the Den'entoshi line, but slightly modified in order to apply it to the Chuo line which has the different structure of railway tracks. The most crowded sections along the Chuo line are those from Nakano to Shinjuku. For these sections, the Sobu line runs in parallel to the Chuo line providing local train services. Since the trains of the Sobu line are less crowded than those of the Chuo line, they have a space to accept some of the passengers using the Chuo line. However, the fact that the Chou line has no platforms at those stations unique to the Sobu line makes us abandon the straight application of the former approach. Then, we propose a hypothetical procedure to spread the traffic flow among trains both of the Chuo line and the Sobu line. An idea how to realize the procedure will be discussed shortly at the last part of this article.
Network Flow Model for Commuter Traffic in Railway Network
Time–Space Network
We will construct a network which represents train services scheduled by a timetable. In this network, any trip of a passenger from the origin station to the destination can be represented by a sequence of nodes and edges (path). We explain the procedure to construct a network from a train schedule using an example shown in Figure 2.

Example to explain how to construct time–space network from train schedule: (a) Planar train network and (b) time–space network.
In Figure 2a, there are six stations A, B, B′, C, D, and E, and two lines 1 and 2. Stations B and B′ are in the same precincts, and stations C and E locate in a walking distance. Line 1 has three train services 11, 12, and 13, and line 2 has two services 21 and 22. Along each train service from the first stop to the last in the timetable, we define one node for each stop at a station, and one edge for each movement between successive stops by connecting corresponding nodes.
Next, within each station, we sort nodes in the order of departure time, and connect one node to another by an edge in that order. They are drawn as thin vertical arrows in Figure 2b. These edges correspond to a passenger waiting for coming trains. For each pair of stations locating within a walking distance, we define an edge from each node in one station to the first such node in the other station that a passenger could transfer from the former to the latter in time (dashed arrow from E21 to C13).
A time–space network and its constructive algorithm are provided by Taguchi (2005a) and Toriumi, Nakamura, and Taguchi (2005).
Traffic Census in Metropolitan Area
The questionnaire survey of commuting traffic in the Tokyo Metropolitan area has been done in every five years. The target of this survey are the commuter ticket holders and the respondents answer their origin and destination stations, stations at which they change trains, departing times at origin stations, and train service types (express or local) along their commuting paths. We use the survey conducted in 2005, which has about 140,000 respondents. Based on the disaggregated answers, we derive not only time-dependent origin destination traffic demands but also their exact paths.
We pick up the Chuo line which connects the suburbs of western Tokyo and the center of Tokyo. In the central area, Shinjuku station and Tokyo station are on the Chuo line, which are well-known business districts. The Sobu line originates Mitaka station which is also on the western part of the Chuo line, and connects the suburbs of western Tokyo via the center, and extends to the suburbs of eastern Tokyo (Figure 3). These two lines are drawn in parallel between Mitaka and Ochanomizu, where trains are heavily crowded every morning. Along this part of the lines, a Chuo line train service has ten stops (except five-stops super express service operated once an hour), and a Sobu line train service has eighteen stops, so that the former plays as express service and the latter as local service.
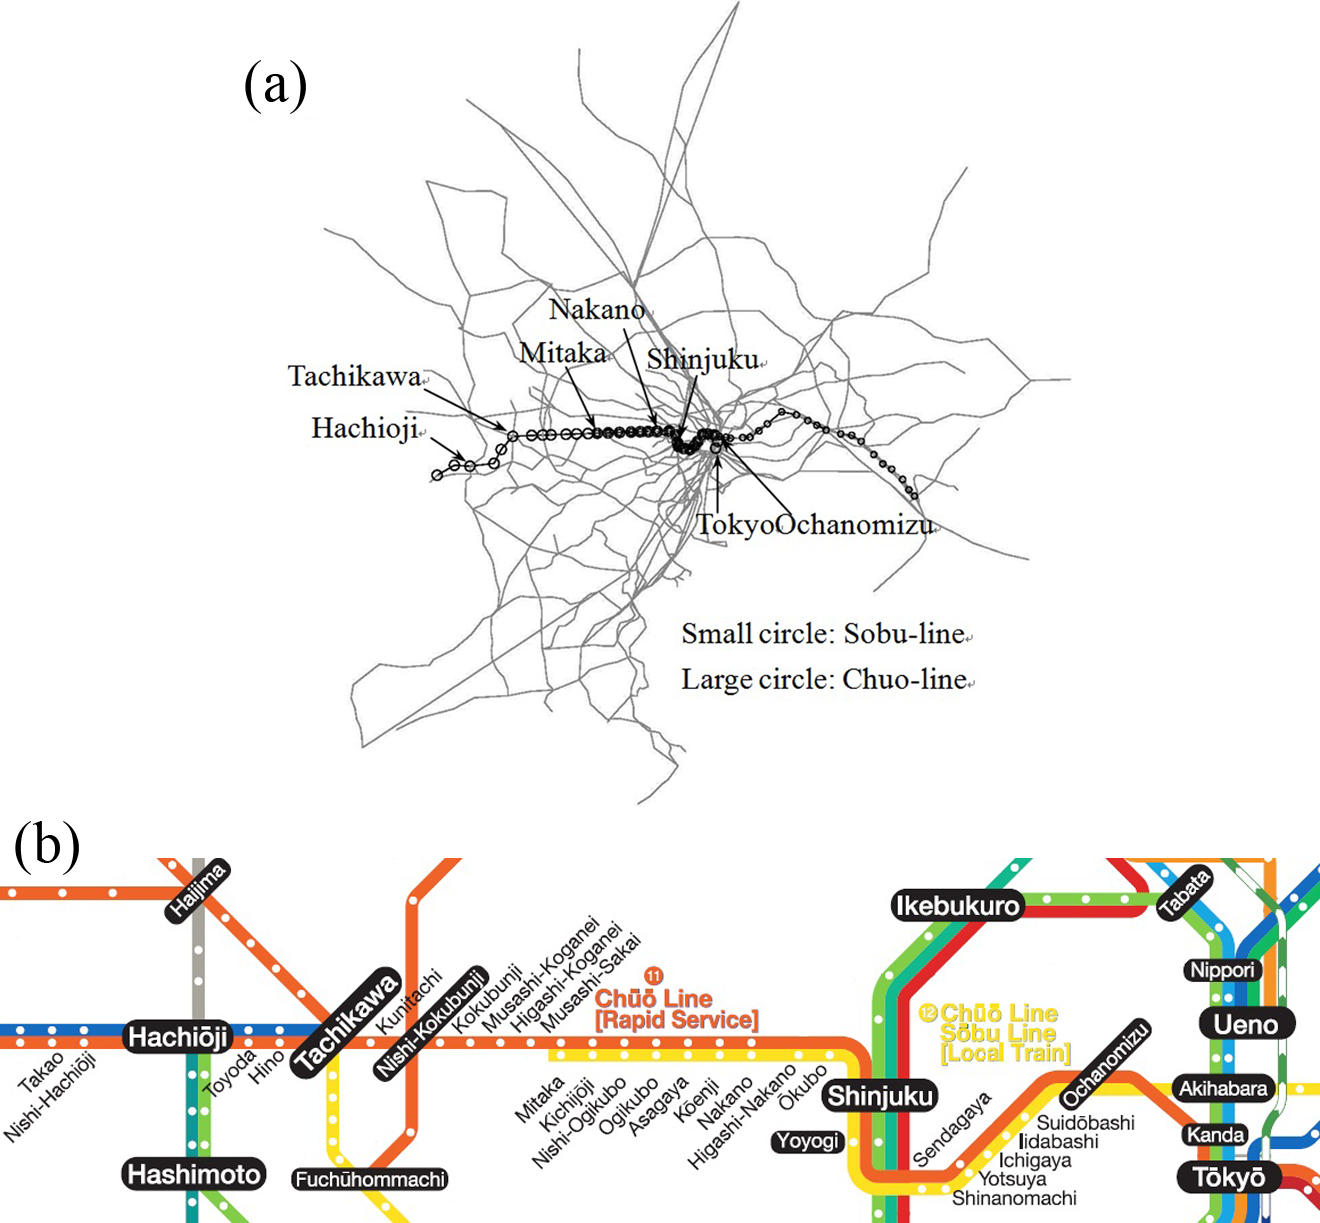
Railway network to be considered: (a) Railway network in the Tokyo Metropolitan area. (b) Chuo line and Sobu line for the case study (quoted from East Japan Railway Company [EJRC] 2013).
In the morning rush hours, about thirty trains arrive at Shinjuku station through the Chuo line from the suburbs and twenty-two trains through the Sobu line every hour. The boarding rates of trains along these lines are shown in Figure 4. The following facts put these two lines out of balance in capacity and demand. First, the Chuo line covers wider area in the western suburbs as origins of commuters than the Sobu line does. Second, travel times to the center of Tokyo through the Chuo line are less than those by the Sobu line, for example, from Mitaka to Ochanomizu it takes twenty-six minutes through the Chuo line and thirty-five minutes through the Sobu line in the early morning. Because of the high boarding rates of the Chuo line, trains usually arrive several minutes behind the schedule at Shinjuku and more at Tokyo even when no accident occurs.
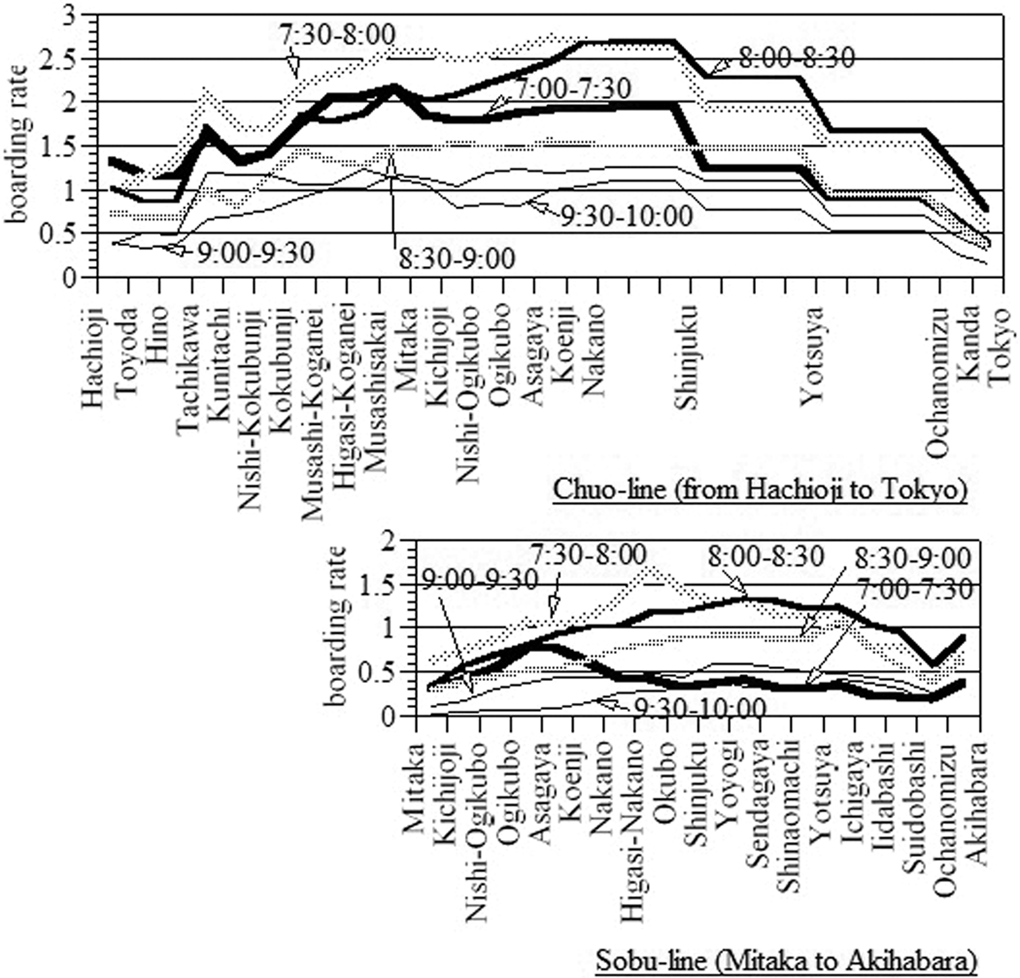
Boarding rate along the Chuo line and the Sobu line.
Train Service Simulation
Standing Time
We simulate how delay occurs and expands as trains travel from the suburbs to the center watching the number of commuters boarding on and off at each station. In the Den’entoshi line case, in order to reduce delay we took a soft approach by degrading express trains to local so that boarding rates are averaged. Here, we try to use the Sobu line instead of local train service. First of all, we extract such commuters from the whole Census data to obtain the time-dependent traffic demand and their paths that use the Chuo line and/or the Sobu line. In order to do so, we make the whole commuters flow into the time–space network according their paths answered in the Census, and extract all such paths that pass through parts of the two lines.
In the morning rush hours, necessary standing time D for a train to accept the passengers boarding off and on at a station depends on the number of passengers x through the most crowded door, and some experiments using mock-up coach had been done to estimate the relation (Aoki et al. 1999; Oto et al. 1999). The following relation between D and x was proposed by the same research group in Tsuzuki et al. (1998).

We adopt this relation, and in addition to it we assume that a train stands at least twenty seconds at a station to have the following relation.

We conducted a field study to find how well this relation fits the actual standing times. We observed seventy-five train stops at two stations from 7:00 to 8:40, counted the number of passengers boarding on and off through a door in the most crowded area on a platform, and the standing time of the train. These observations in Toriumi, Nakamura, and Taguchi (2005) as well as the equation (2) are plotted in Figure 5.
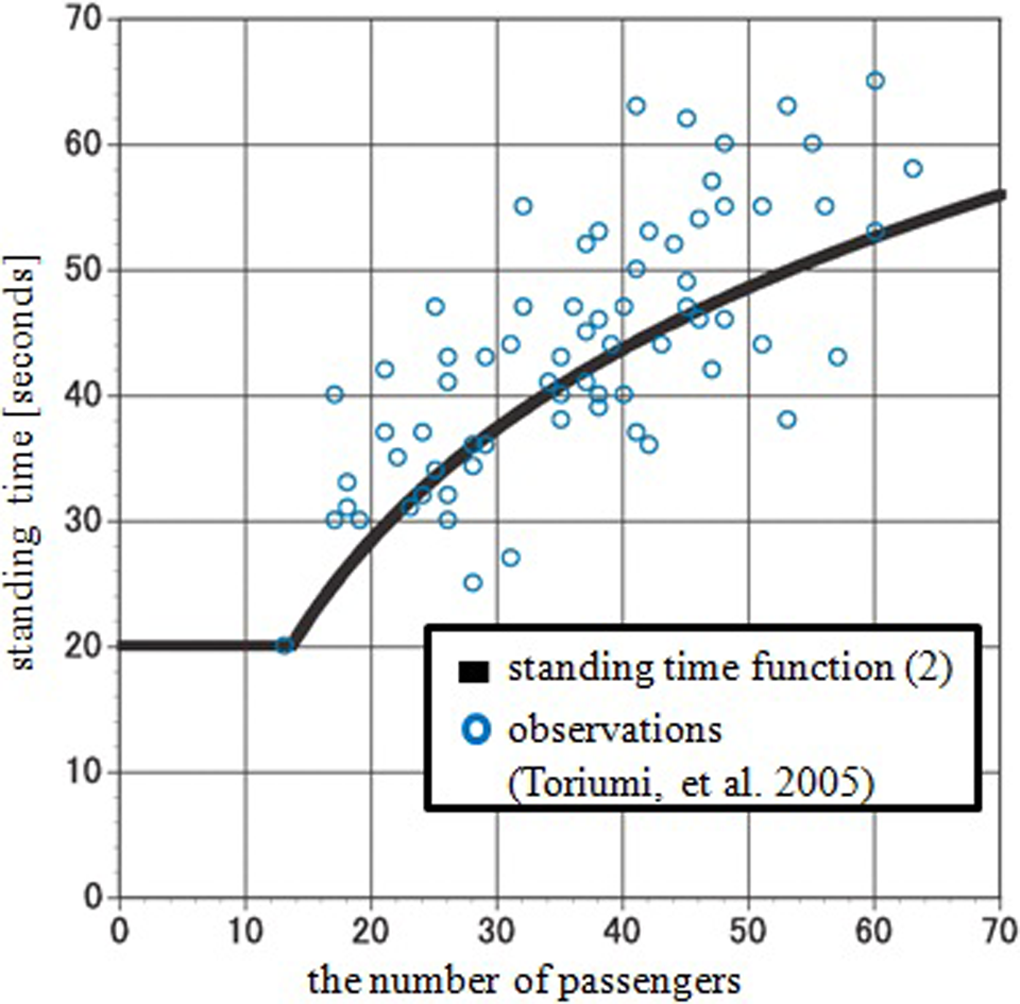
Standing time function.
In order to apply equation (2), we need an estimate of x from the total number of passengers y boarding on and off the train. In the morning rush hours, ten-coach trains with four doors a coach are used in the Chuo line, we make a rough estimate of x as twice of the number of passengers y divided by the number of doors (=40). This assumption almost coincides with the observations of the field study in Aoki et al. (1999).
It must be fair to say that the extra standing time is already incorporated into the schedule so that passengers can board on a train in time even in rush hours. The schedule during a period when trains are almost empty could be a good guess for the standard (minimum) times necessary to travel from one station to the next. An estimate for the extra time can be calculated as the difference between the scheduled time and the corresponding standard time. These times can be spared for a train to meet the schedule when extra standing time becomes necessary.
Train Service (Delay) Simulation
We will simulate how delay in train service occurs and expands train by train, and station by station, taking into account the following factors; the number of passengers boarding on and off at each station, time necessary for a train to stand at each station to accept the passengers, time necessary for a train to travel from one station to the next, train interval between successive trains necessary to be kept for safety.
Step 1
Put the commuters flow into the time–space network to construct the traffic flow according to their answers to the questionnaire. In order to do so, for each respondent in the Census data, choose a departure node of a train just after his departure time at his origin station, and find the shortest path to the first transfer station consisting of local or express train service as he answered, and continue to find such paths until he arrives at his destination station.
Step 2
For each train stop at each station, using the traffic flow calculated in step 1, estimate the number of passengers x through the most crowded door and calculate standing time D by the relation (2).
Step 3
Set extra standing time

If margin T included in the running time is positive, use T to make up for delay D′ as,

Step 4
For each train, looking at the diagram from the first stop to the last along its service, accumulate delay
Step 5
At each station, looking from the first train stop to the last, check whether the interval from the previous train stop is longer than 120 seconds. If it is less than 120 seconds, put the departure time behind so that the interval is equal to 120 seconds.
Step 6
For each train, looking at the modified diagram from the first stop to the last, if the trip time from one station to the next in the diagram is shorter than the standard time, let the arrival time at the latter station behind so that the trip time becomes equal to the standard time.
Step 7
Throughout steps 5 and 6, even one of the node times has been changed, return to step 5, if not, return to step 1.
In this procedure, even a single train stop is rescheduled, the number of passengers boarding on it as well as its successors could be changed, so that it is necessary to reconstruct the time–space network and make the whole commuters flow into the new network again. If this procedure safely converges at all, we have a schedule that satisfies the required conditions, but there is no guarantee for conversion.
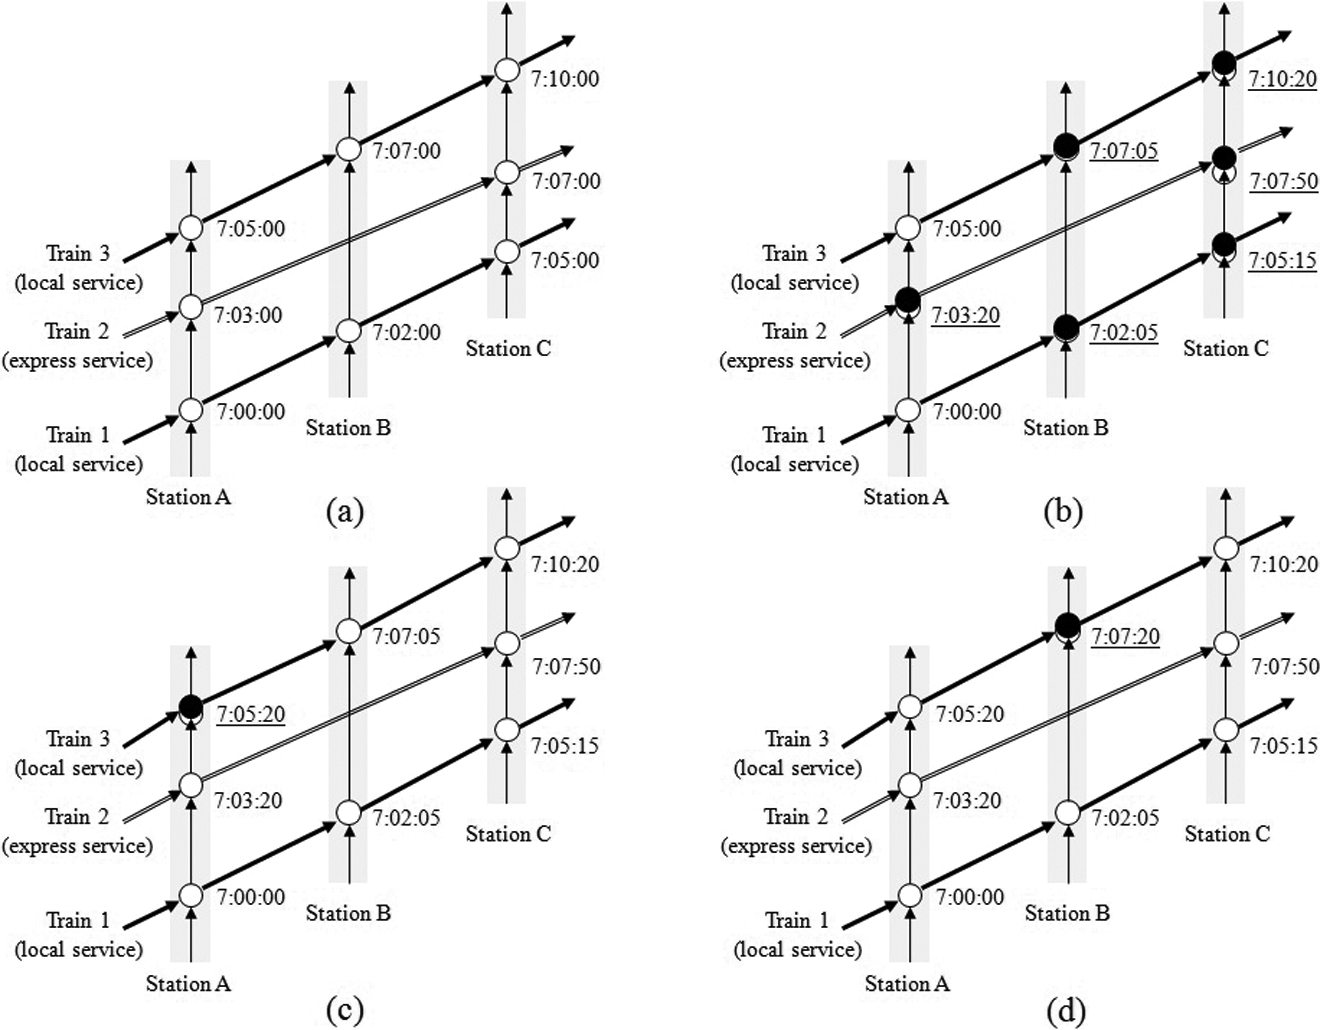
Let us explain the previously mentioned procedure using an example shown in Figure 6. There are three trains 1, 2, and 3 and three stations A, B, and C. Standard traveling time from A to B is two minutes, from B to C is three minutes, and from A to C by express service is four minutes. To make explanation simple, no margin times are included in the schedule. Execute steps 1 through 3 to calculate delays D’ caused by extra standing times at stations. Then in step 4, put the scheduled times behind, indicated by black circles in (b). In step 5, at station A, the time interval between trains 2 and 3 is less than 120 seconds, put the scheduled time of train 3 at station A 20 seconds behind (a black circle in [c]). This change makes the trip time from A to B of trains 3 be shorter than the standard time by fifteen seconds. Therefore, in step 6, the time of train 3 at station B is put 15 seconds behind (a black circle in [d]). Then return to step 5. Continue steps 1 through 7 until the whole schedule becomes unchanged.
Illustrative example for train service (delay) simulation.
Case Study in Train Service along the Chuo line
We apply the procedure proposed in the preceding section to the Chuo line and the Sobu line train services in order to calculate how the service actually works in everyday congestion and observe how delay occurs and is carried in following trains by overcrowded commuters. Then we test whether such plan is effective to reduce delay that utilizes the remaining capacity in the Sobu line train service.
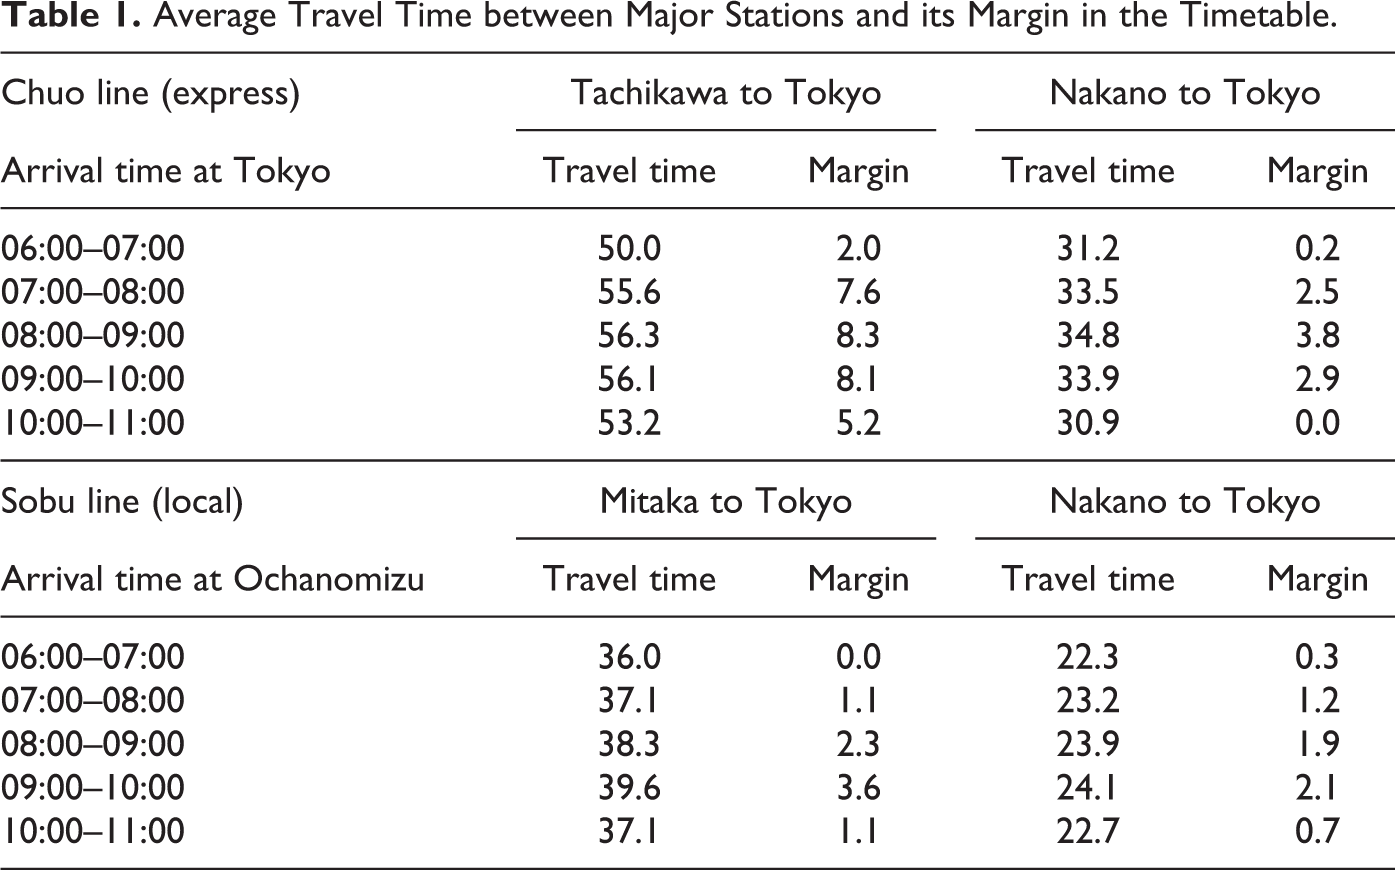
The railway company JR East announces the standard trip times between several major stations required for a train traveling with no crowded passengers. Table 1 shows the scheduled trip times in the timetable, and the margins prepared against extra standing time caused by crowded passengers. Here, we calculate the “margin” by subtracting the standard trip time from a scheduled trip time for each pair of stations. The margin implies an estimate by the JR for extra standing time, which becomes longer as time approaches to eight o’clock. For each train in consideration, the trip times scheduled in the timetable from one station to the next are compared to the trip times including delay calculated by our simulation. For each train in consideration, the trip times from its starting station to other stations scheduled in the timetable are compared to the trip times including delay calculated by our simulation. We denote the difference between a scheduled trip time and the corresponding trip time calculated by our simulation as the “delay.”
Average Travel Time between Major Stations and its Margin in the Timetable.
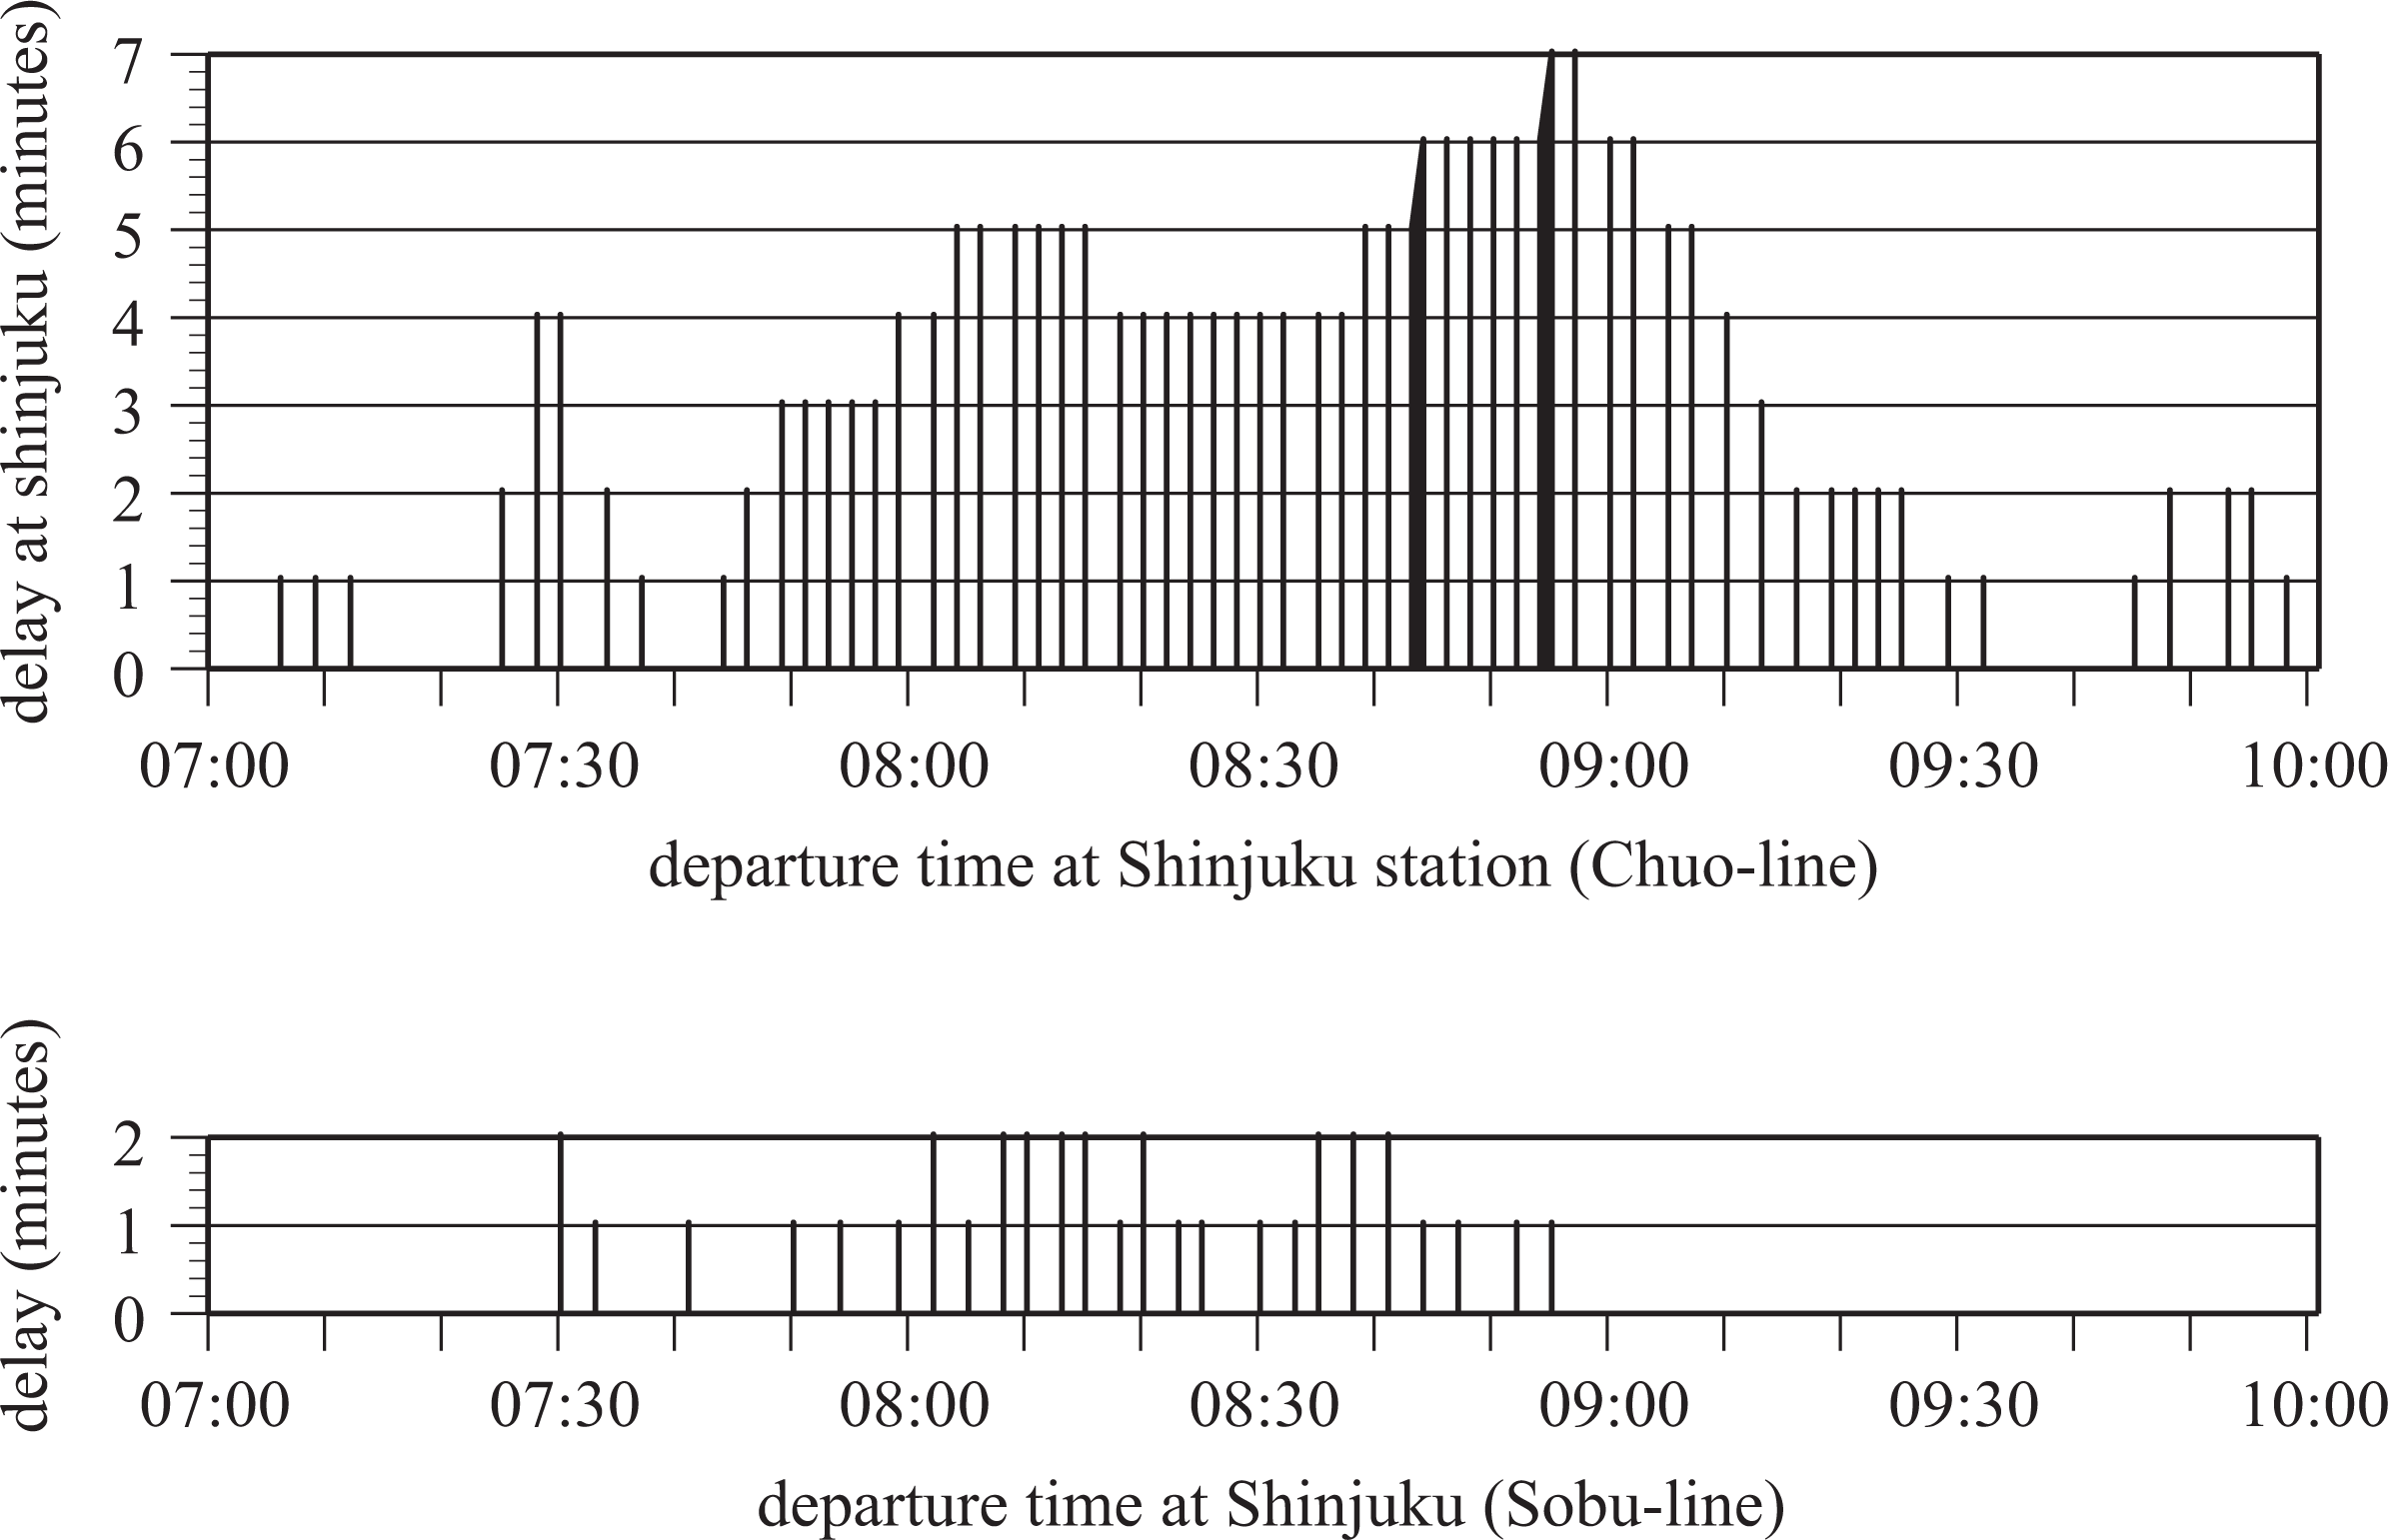
The temporal distribution of delay in each train service arriving at Shinjuku station through the Chuo line calculated by our simulation is shown in Figure 7a. The horizontal axis denotes the train departure time at Shinjuku in the original timetable, and the vertical axis denotes delay. Delay appears after seven o'clock, gets longer as time approaches eight o'clock, and continues by nine o’clock. It takes about one hour for delay to disappear. The distribution of delay at Ochanomizu station follows about 10 minutes after that of Shinjuku and grows up by 1–2 minutes. Figure 7b shows the distributions of delay through the Sobu line. It is small compared to that in the Chuo line.

Temporal distribution of delay in train services at Shinjuku station: (a) Chuo line and (b) Sobu line.
Since it is known that the trains arriving at Shinjuku around eight o'clock to nine are very crowded, the scheduled travel times for those include larger margins (Table 1). However, our calculation shows that they are not enough to compensate necessary standing time at crowded stations. Our calculation shows that the major delay at Shinjuku station is about seven minutes and roughly speaking, it corresponds with our daily experiences.
The trip time distribution of commuters using the Chuo line and/or the Sobu line is shown by a thin line in Figure 8, where trains are assumed to be operated precisely according to the original timetable. In the same figure, the corresponding distribution based on our result is also shown by a thick line to be compared. For each commuter, the trip time is measured from the origin to the destination along the whole path, and the trips starting the origin stations from seven o'clock to nine are counted. The trip time distributions of commuters who use the Sobu line but the Chuo line are also shown in the same figure.
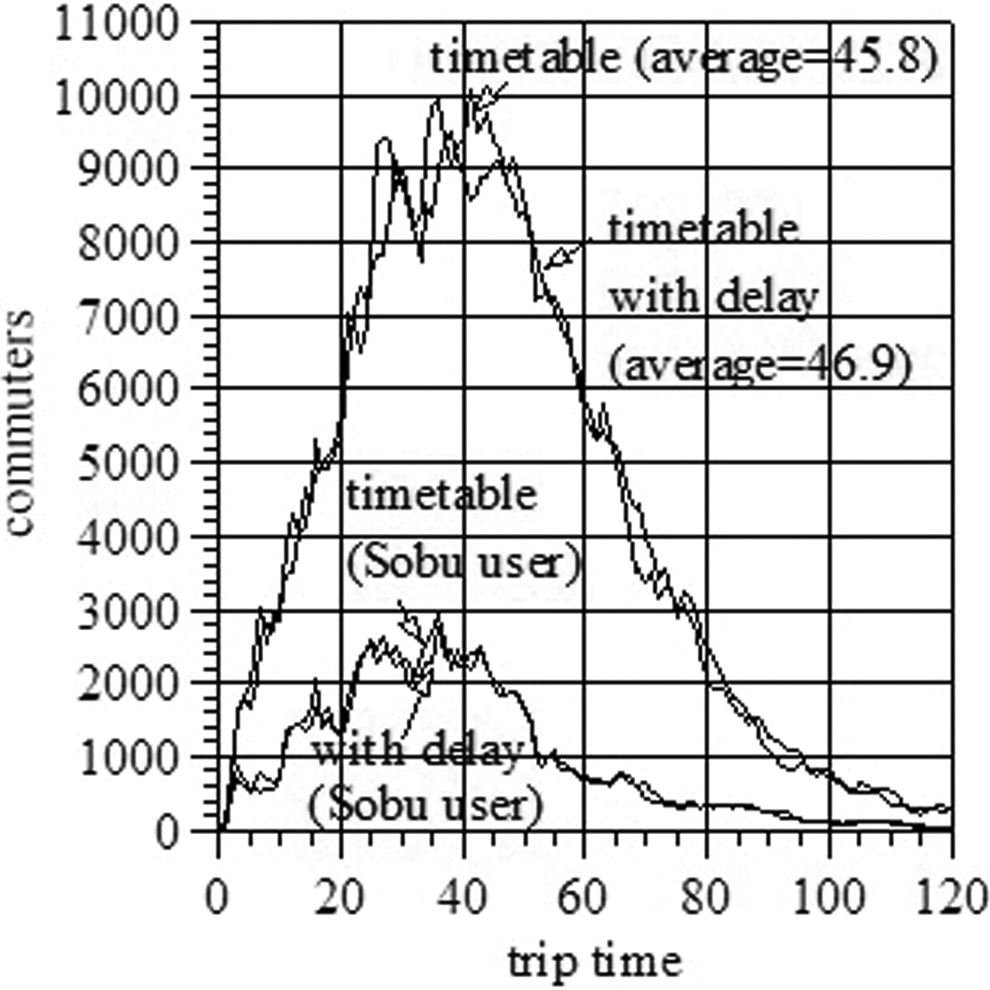
Comparison of the trip time distributions according to the original timetable and those calculated by our delay simulation: (a) Chuo line and (b) Sobu line.
The comparisons in Figures 7 and 8 show that in the Sobu line, the trip times with delay are almost equal to the scheduled times. Therefore, the Sobu line is almost free from congestion. However, in the Chuo line, the trip times with delay are longer than the scheduled times (shifted to the right), and congestion along this line should be heavy.
Use Full Capacity of the Network—“Use Sobu line” Plan
When we considered a similar problem in the Den'entoshi line, we proposed a train schedule such that all express train services were degraded to local services. In that case, both train services use the same railway tracks, so that an irregularity in a train schedule of one service has direct bearing on the other. Here, we regard the Chuo line as express service and the Sobu line as local service in the area where both lines run in parallel between Mitaka station and Ochanomizu station. These two lines use separate railway tracks, which is not the case in our former study of the Den'entoshi line.
We will investigate whether delay could be reduced by making use of remaining capacity in the Sobu line service for the overcrowded Chuo line passengers. Our plan is a compromise between the present service and the virtual nonstop Chuo line service from Mitaka to Tokyo. For the Chuo line passengers boarding on at one of the stations lying along the Sobu line (from Mitaka to Ochanomizu), we switched their routes to use the Sobu line. For the Chuo line passengers getting off at one of those stations, leave them as they do. We call this plan as “use Sobu line” plan. “Use Sobu line” plan should be applied to the Chuo line passengers only boarding on between Mitaka and Ochanomizu (not include passengers boarding off), because the passengers boarding on west of Mitaka and boarding off between Mitaka and Ochanomizu have to use the Chuo line. After switching the routes of passengers following the above rule, we did the same calculation to simulate the commuter traffic proposed in the third section.
The temporal distribution of delay at Shinjuku station through the Chuo line following the “use Sobu line” plan is shown in Figure 9a. Compared to Figure 7a, the delays are slightly reduced by one or two minutes. Figure 9b shows the distributions of delay through the Sobu line, where trains delayed by one or two minutes appear from eight to nine o'clock. These observations are very reasonable.
Temporal distribution of delay in train services at Shinjuku station following the “use Sobu line” plan.
The boarding rates of trains along the Chuo line and the Sobu line following the plan are shown in Figure 10. It successfully transfers the surplus commuters in the Chuo line to the Sobu line to average the boarding rates.
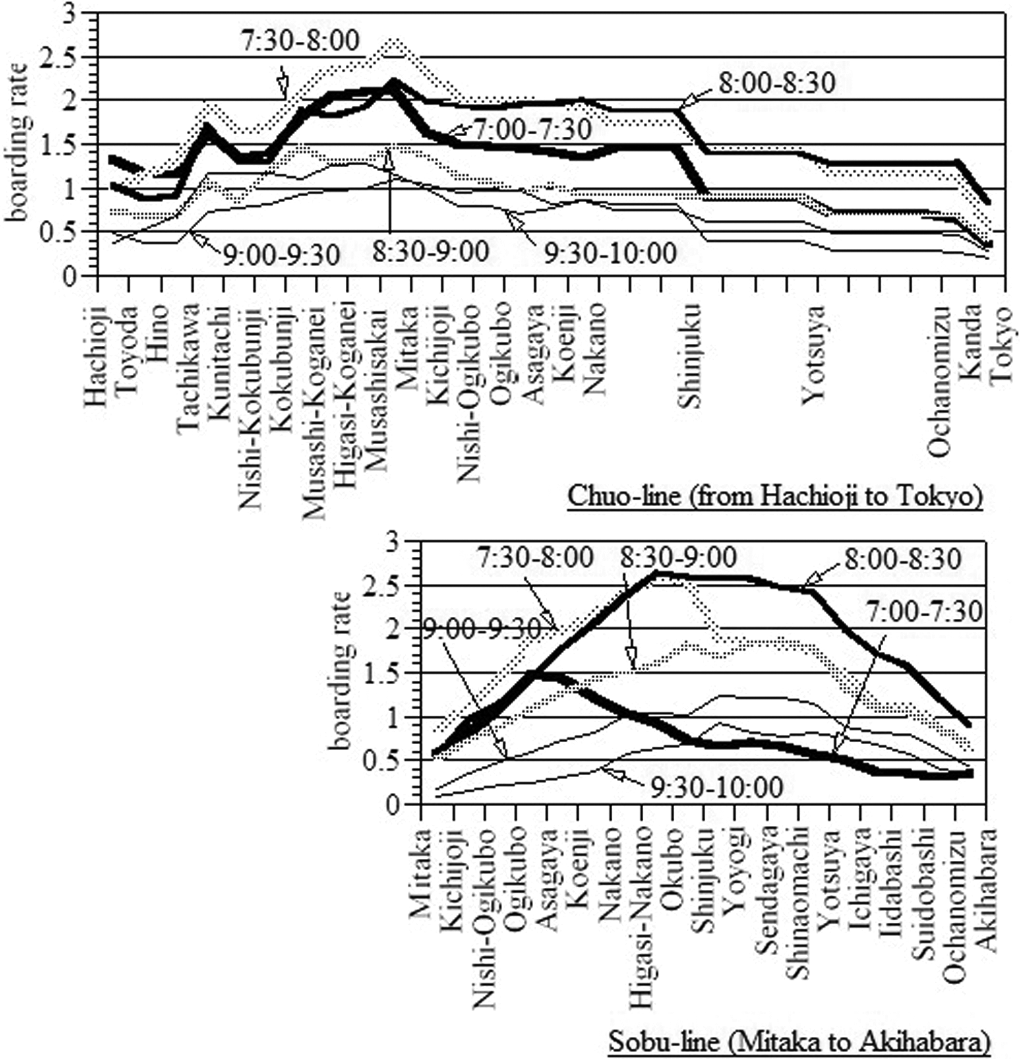
Boarding rate along the Chuo line and the Sobu line following the “use Sobu line” plan.
The trip time distribution of commuters choosing their routes following the “use Sobu line” plan is shown by a thin line in Figure 11. In the same figure, the trip time distribution of the original flow with delay is drawn by a thick line for comparison. Traffic volume of short trips (less than 30 minutes) and long trips (longer than 60 minutes) decreases and that of middle length trips increases. The average trip time becomes 47.4 minutes which is longer by 0.5 minutes than that of the original flow.
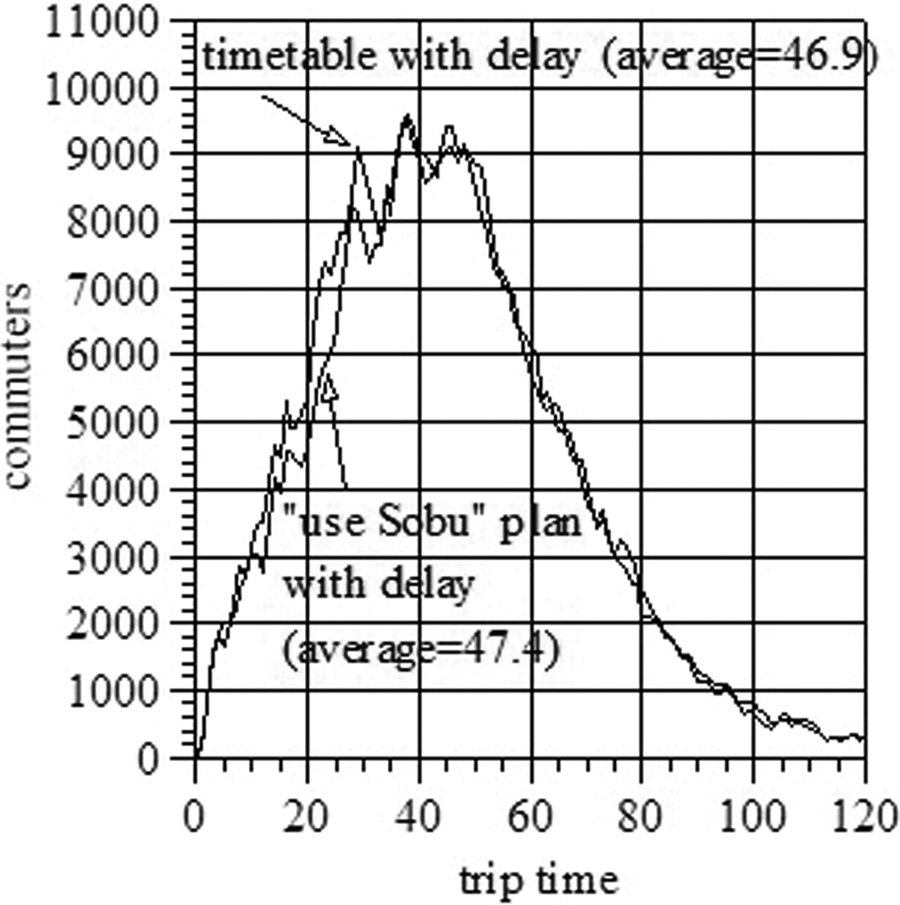
The trip time distributions in the case of “use Sobu line plan”.
We break the former Chuo line users down into (a) commuters still using the Chuo line, and (b) commuters being forced to use the Sobu line, to see the effect by the “use Sobu line” plan in detail. Figure 12a shows the number of commuters in (a) and (b), where they are classified according to the departure times at origin stations. Figure 12b shows the average of riding times through the Chuo line or the Sobu line included in their paths. Thick lines correspond to the traffic of original flow with delay, and the thin lines to that following the “use Sobu line” plan.
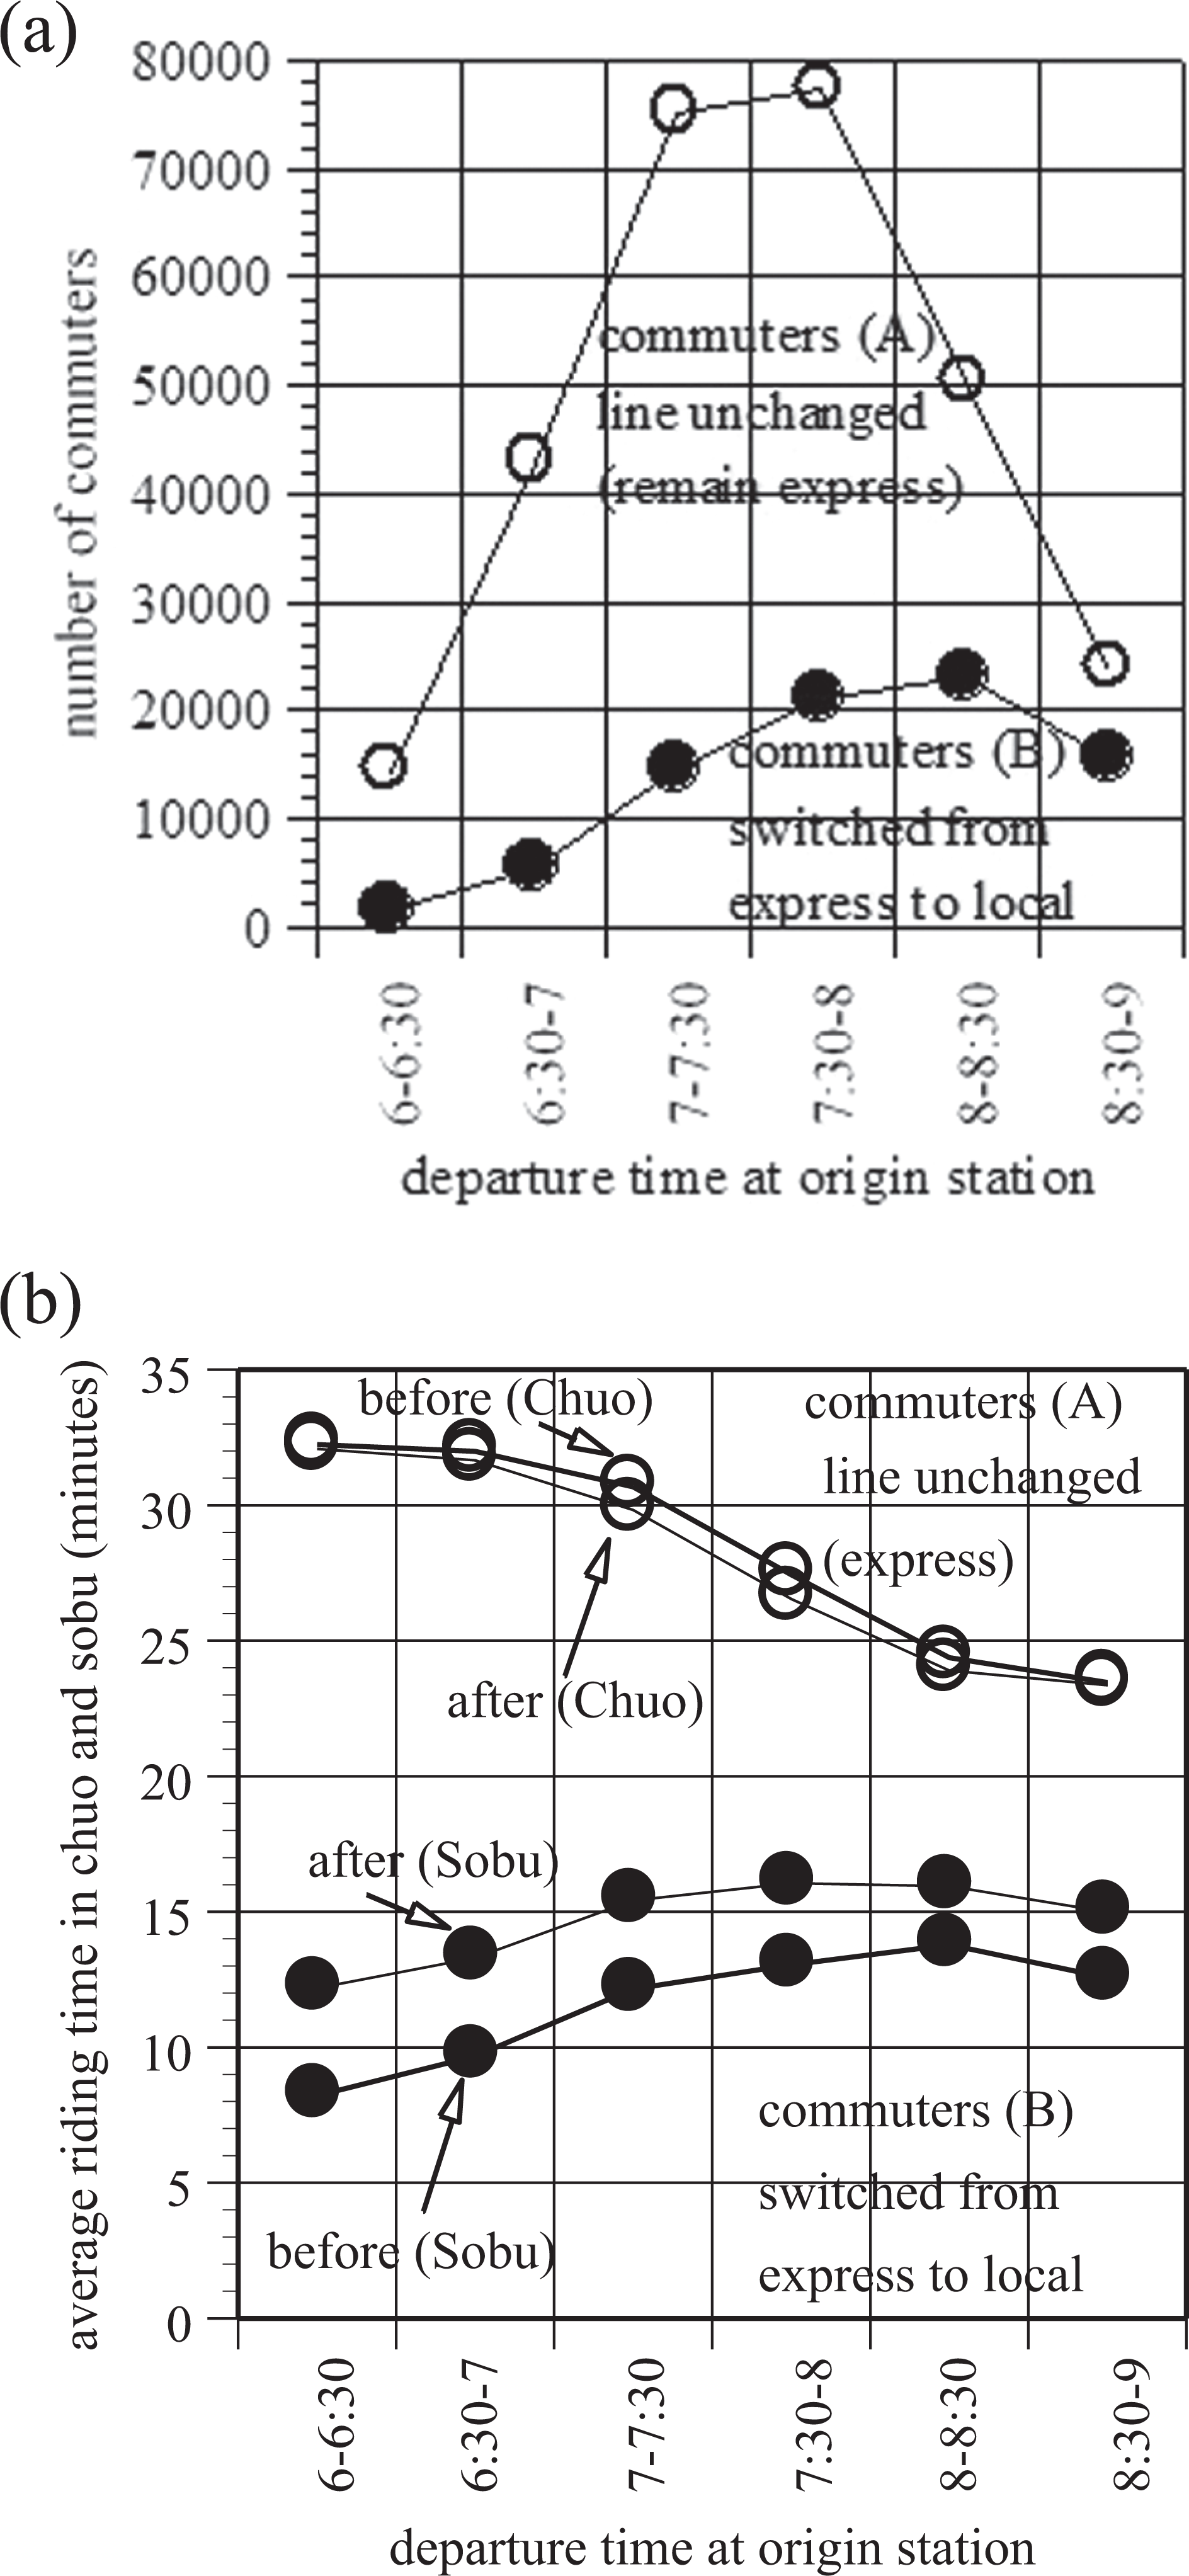
The former Chuo line users, classified into positively affected and negatively affected by the “use Sobu line” plan: (a) Number of commuters and (b) Average riding time.
Since the delays through the Chuo line are reduced, the commuters (a) using this line get this benefit, however, for the commuters (b) made to switch their routes to the Sobu line, their trip times become longer. Multiplying the number of commuters of each group, the negative effect slightly surpasses the positive effect. One reason is that the delay in the Chou line had affected not so much the Sobu line service because they use separate railway tracks, so that the effect of the plan in reduction of delay is limited within the Chuo line.
Conclusion
In this article, we introduced a network flow model to study commuter traffic problems in the railway network of the Tokyo Metropolitan area. It consists of a static network which is called a time–space network and detailed traffic data on route choice of commuters. The network precisely represents each train service scheduled in the timetable and passengers' actions using them. Based on this network model, we proposed a procedure to simulate how delay occurs and expands in train services.
We applied our procedure to the railway network of Tokyo and picked up the Chuo line to simulate the expansion of delay caused by crowded passengers. This line is one of the most crowded lines in the network. In order to reduce delay and congestion along the Chuo line, we considered a plan to utilize the remaining capacity in the Sobu line. This “use Sobu line” plan was tested by our procedure and shown to be effective in improving the situation slightly. This approach is similar to which we took in the Den'entoshi line case. In that case, our approach to make all train services flat was slightly modified and has been realized. That approach is relatively easy to implement because it requires no fundamental changes in hardware and leaves passengers no option to choose a better train service. However, in the Chuo line case, even if hardware issues are solved, an additional incentive might be necessary to force passengers to use slower service against their wishes to choose existing faster service. The result of our simulation shows that if the passengers will follow the plan to average the traffic demand over the Chuo line and the Sobu line, the congestion as well as delay shall be eased. It is likely to produce better effects in the real world because small accidents are liable to occur in a jam-packed train and easily lead to a sequence of delay events in a train schedule. At present, it becomes popular to use electronic devices in order to charge railway fare automatically. Therefore, it may be not so hard to install a system to give passengers some coupon to encourage them in choosing slower trains.
Footnotes
Declaration of Conflicting Interests
The author(s) declared no potential conflicts of interest with respect to the research, authorship, and/or publication of this article.
Funding
The author(s) disclosed receipt of the following financial support for the research, authorship, and/or publication of this article: This work was (partially) supported by JSPS KAKENHI Grant Number 24241054.