
Abstract
Building on work funded by the European Spatial Planning Observatory Network 2013 Program, the article analyzes the regional development of the “creative workforce” among its active population against regional economic growth measured by changes in per capita gross domestic product over the period 2001 to 2008. The analysis establishes regional typologies in this relationship according to the “sense” and evolution of this association, allowing a critical evaluation of processes and policies that may explain the large degree of spatial variation encountered, and addresses the issue of causal relationships between these two dimensions, suggesting the need to rethink development policies based on “creative capital.”
Introduction
In the past few years, the issue of culture and creative-led development has become increasingly present in the economic debate, also because of the interest raised by recent evaluations 1 of the economic dimension of cultural and creative industries in Europe and elsewhere (KEA 2006, 2009; EUROSTAT 2010). This interest has sparked in turn a growing literature on the so-called cultural turn (Amin and Thrift 2007) in social sciences (generally) and in regional sciences (specifically). The basic assumptions are that creative economy can contribute to a substantial degree to the shaping of a competitive knowledge-based economy, possibly conducive to a sustainable economic growth with more and better jobs and greater social cohesion.
Despite the significant macroeconomic impact of culture and creative industries, it is especially at the local level of analysis that it is possible to appreciate in some detail the different channels through which culture has an impact on long-run growth trajectories (Scott 2004; Pratt 2004; Santagata 2002; Sacco and Crociata 2013). As claimed by Scott (1997, 324), “the geography of culture is stretched across a tense force field of local and global relationships,” while the regenerative impacts of cultural production is remarkably driven by dynamics of clusterization (Mommaas 2004; Russo and Van der Borg 2010).
The cultural and creative industries as concept could be traced back since Adorno and Horkheimer dissertation on mass culture (see Pratt 2009 for historical background) even if the complex relationship between creative industries and place competitiveness was deeply influenced (and fueled) by Florida’s findings (2002, 2005, 2008) on United States. This work was so successful that many critics moved on the grounds that it lacks empirical corroboration in independent tests (see e.g., Hoyman and Faricy 2009) or from the sociological point of view, arguing that it is based on shaky foundations (see e.g., Markusen 2006) or an ideological biased approach (Fainstein 2005), or again for its conceptual regulatory framework (see e.g., Sacco and Crociata 2013).
In that sense, the relationship of each creative business with its location is a complex balance of factors (Comunian, Chapain, and Clifton 2010; Comunian, Faggian, and Jewell 2011); according to Comunian et al., four interrelated dimensions seem to determinate the potential of certain location to support the growth of creative economy (infrastructures/governance/soft infrastructures/markets). Yet policy efforts targeting creativity and innovation, as those driving the European Union (EU) innovation and smart specialization agenda, should be based on a better knowledge of these processes, for instance, incorporating concerns about the differential capacity of places to attract creative workers, on the processes of development of creative industries and on the mechanisms of “transmission” between them and the wider regional economies or specific sectors that are traditionally the real engines of employment and growth. At the same time, Pratt (2009) suggests that in addition to studying the location of cultural and creative industries (see. Boix et al. 2014), it could be suitable to analyze closer the operation of these industries with the rest of the economy. Accordingly, we consider that a very large part of the contribution of creativity is not directly related to the cultural industries but rather nested in other economic sectors. Within the mainstream industrial sectors, where increasingly, added value and competitiveness are crucially dependent on their capacity to produce and convey “meaning” to culture-aware consumers, to the service sectors catering for consumers and firms who are increasingly producers of idiosyncratic knowledge and experiences. According to this view, the leading edge of growth and innovation in the contemporary economy is constituted by sectors such as the high-technology industry, neo-artisanal manufacturing, business, and financial services (Trip 2007).
Without the pretension of addressing the full range of problems implied by the regenerative powers of creativity, this article aims at a better understanding of the regional patterns in creative work and its relationship with economic development. In this way, we expect to increase the knowledge of European policy makers and regional stakeholders about.
Thus, in the present article we address the following questions, which we nevertheless consider as basic in order to proceed in this direction with further research: What has been the spatial evolution of the creative workforce (CW) throughout the 2000 decade? Is there any clue that regions that have been lagging behind in the cultural turn of their economy are catching up? What is the degree of association between the growth in creative jobs and general economic growth, as measured by per capita gross domestic product (PCGDP)? Are there signs of a causal relation between these two dimensions and of its direction?
We use employment data in selected professional classes as provided by the Labour Force Survey (LFS) division of EUROSTAT (an approach similar to that developed by Higgs, Cunningham, and Bakhshi 2008), considering the Nomenclature of Units for Territorial Statistics (NUTS2) regional level as the finest spatial delimitation for which such extraction produces statistically significant results for every spatial unit, and allowing to distinguish predominantly urban from predominantly rural regions.
The account of the CW of Europe is based on an average of values of the population in selected International Standard Classification of Occupations (ISCO-88) classes (four digits) over the 2001 to 2004 and 2005 to 2008 period in NUTS2 regions in thirty-three countries (EU-27; plus partner countries Norway, Switzerland, and Iceland; and candidate countries Macedonia, Croatia, and Turkey. The LFS extraction has picked the estimated number of workers by four-digit ISCO-88 professions, selecting among classes of creative occupations according to the most popular classifications of creative professions in the literature (see Table AI in Appendix).
This selection considers previous taxonomies used by the literature (Boschma and Fritsch 2009; Higgs, Cunningham, and Bakhshi 2008; Tinagli and Florida 2005; EUROSTAT 2010). The pros and cons of using occupational definitions of the creative class over industrial segmentations have been clearly outlined by Markusen et al. (2008), who also highlight the degree of subjectivity involved in this choice and the need for an accounting and selection method that matches policy interests and contexts.
Accordingly, we decided to keep the occupational sectors included in our classification as broad as possible, both as a way to pick interesting phenomena across regions characterized by very different occupational structures (for instance public vs. private “cultural” employment) and to be able to distinguish how these different structures matter in their relation with economic development. In specific contexts, that could lead to an overestimation of the CW: for instance this critique has been raised by Cunningham (2014) to Tinagli and Florida’s (2005) accounts of creative workers in Italian cities. At the same time, the use of four-digit ISCO data allows us to pick creative professionals within broader categories not considered by the previous literature.
Following from this, we have contrasted the data on the CW in the 317 NUTS2 regions of the countries considered in this study (see Table 1) in the two reference periods (2001 to 2004 and 2005 to 2008) with the respective dimension of the active population and with the PCGDP at current prices, using annual EUROSTAT data averaged over the same periods. In a few countries with data gaps (Denmark, Switzerland for instance) we used instead sources available from national statistical offices or have applied regionalization or extrapolation techniques.
Dimension and Evolution of the Creative Workforce, National Data, Periods 2001 to 2004 and 2005 to 2008.
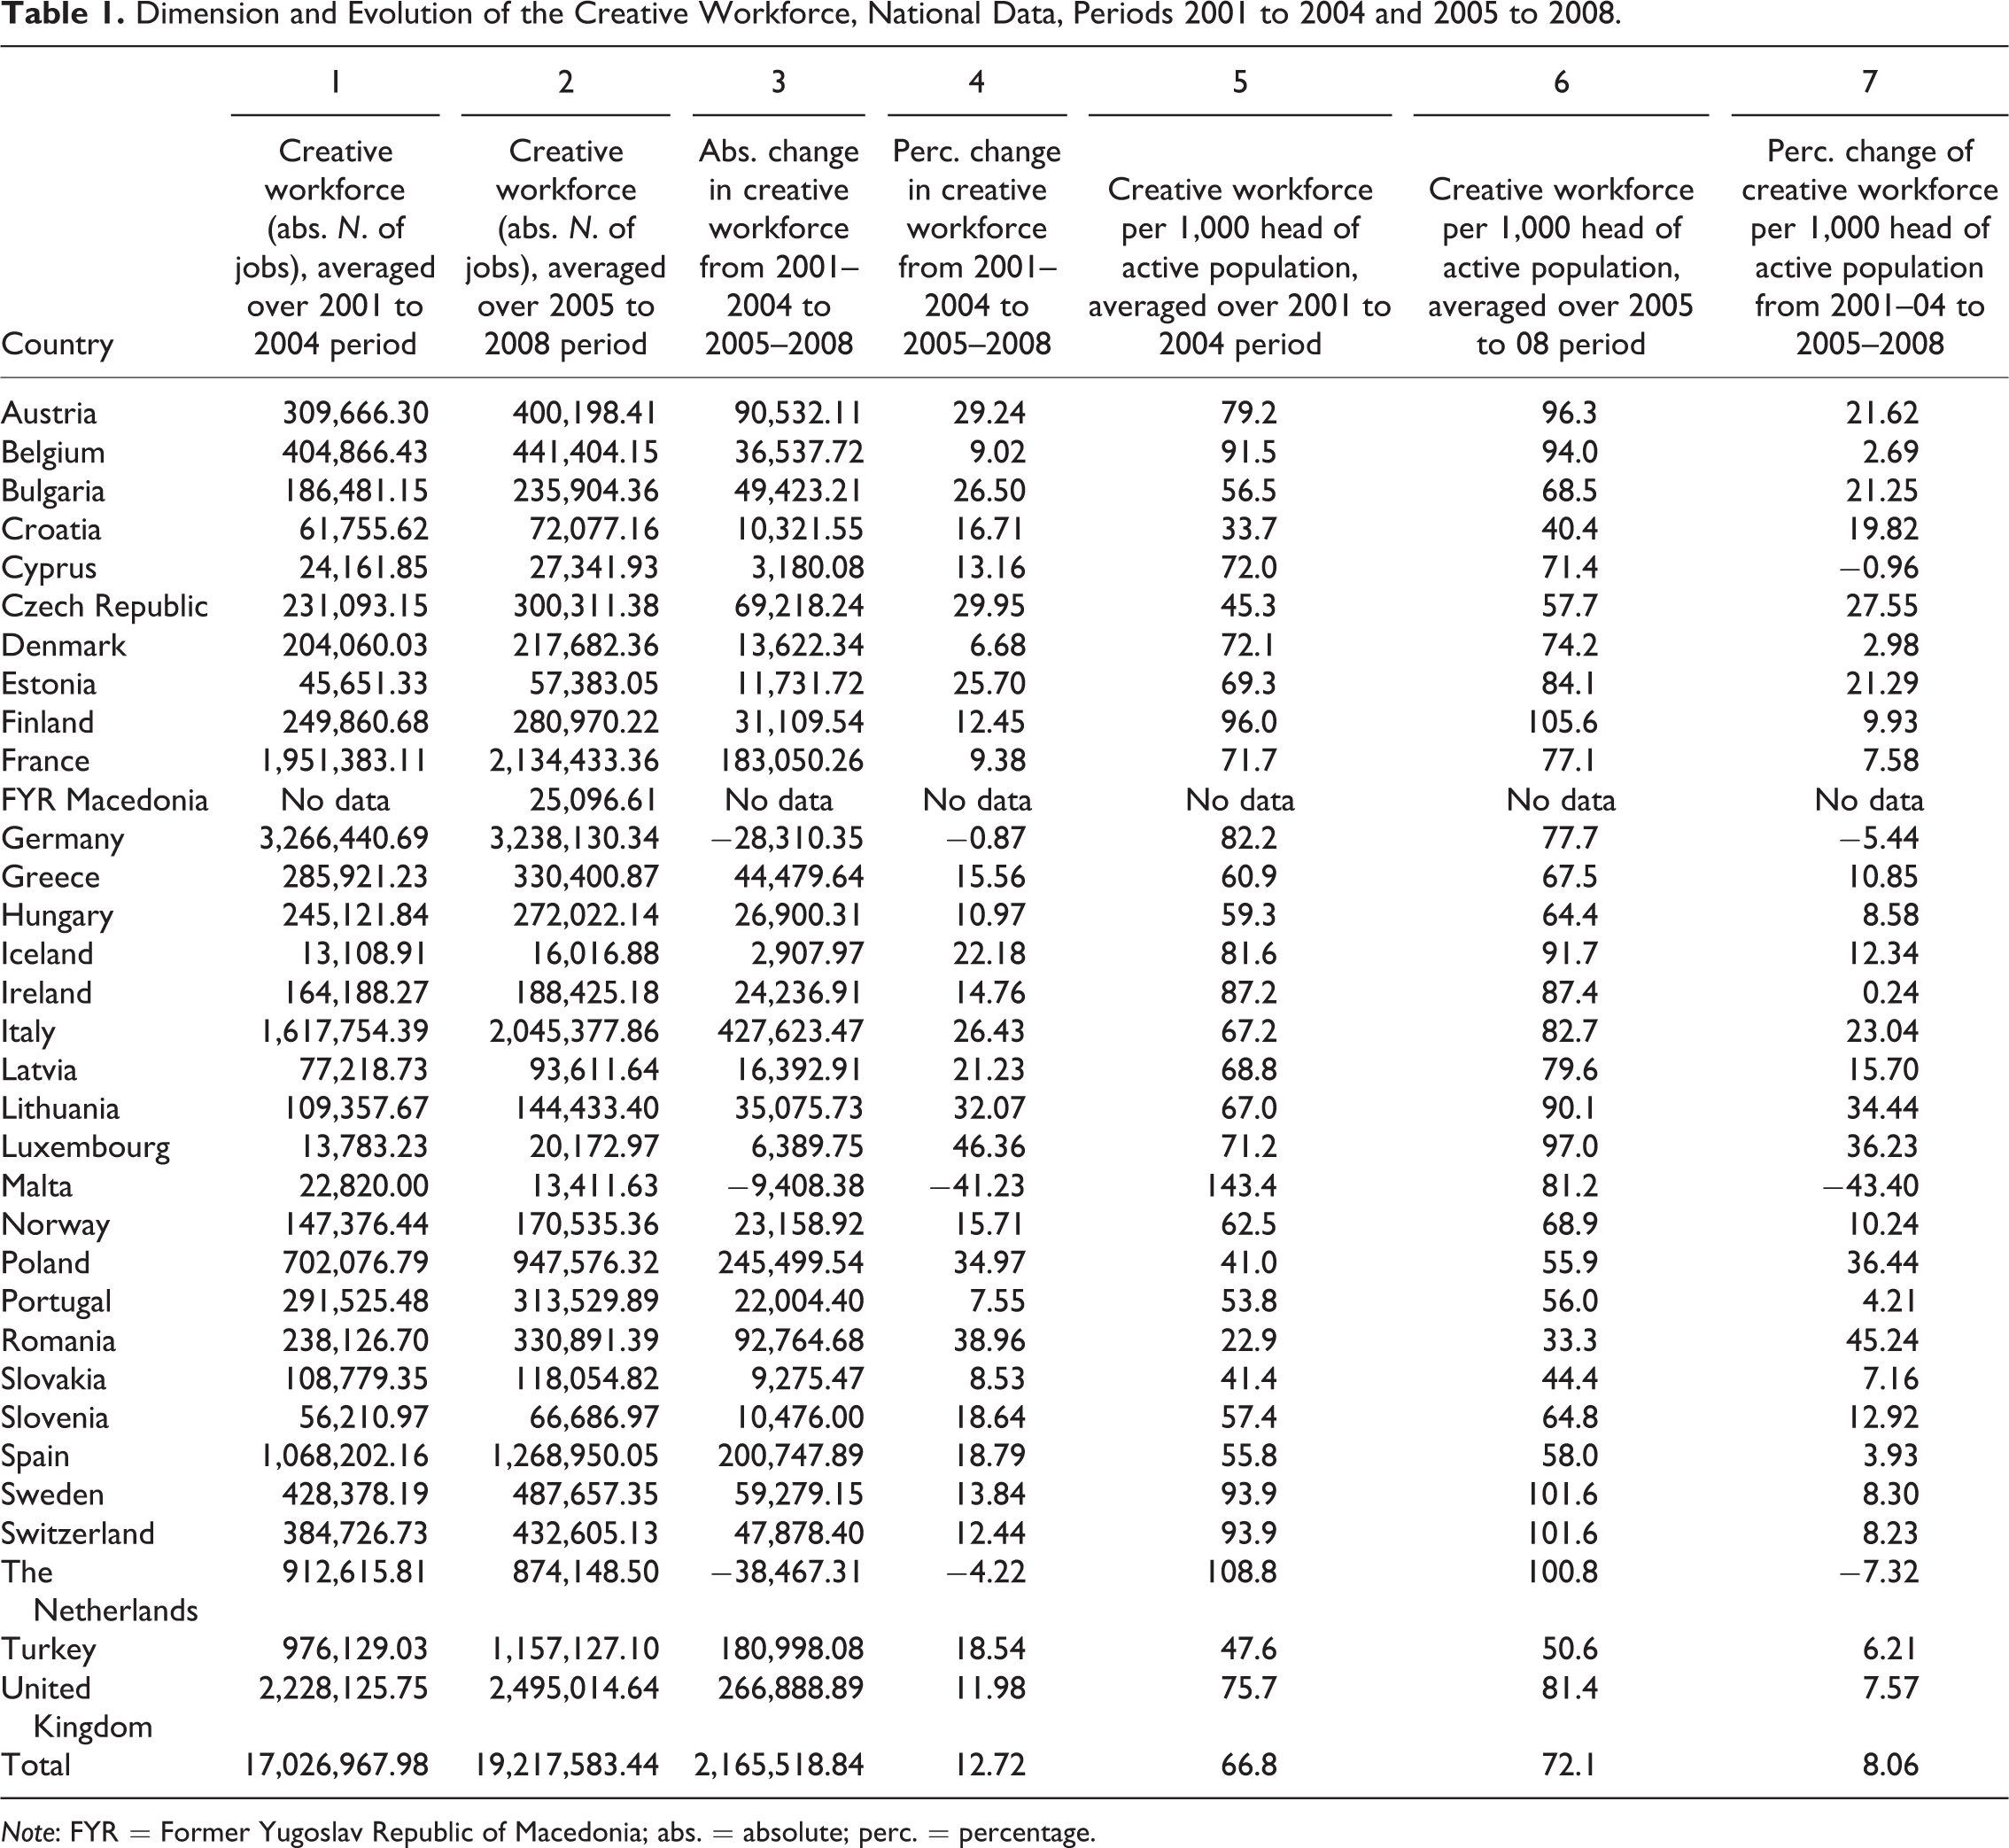
Note: FYR = Former Yugoslav Republic of Macedonia; abs. = absolute; perc. = percentage.
The second section presents our results regarding the geographical distribution of the CW and the relationship between creative work and economic development. The third section addresses the question of the causal relationship between these dimensions and discusses our findings in the light of the existing literature. The fourth section discusses the results and concludes with a number of insights for policy and further research. 2
The CW and Economic Growth in Europe
Dimension and Evolution of the CW during the 2000 Decade
The estimated number of creative workers in Europe in the 2005 to 2008 period is 19,217,583. Globally, the European CW has increased by 12.7 percent between the two reference periods, and has become less concentrated, with only Italy and Poland increasing their share.
Weighing the CW over the active population (Table 1, columns 5 to 7) returns that 7.2 percent of the workforce of Europe has creative professions in the second reference period (was 6.8 percent in the first), with percentages over 10 percent in Finland, Sweden, Switzerland, and the Netherlands, and the highest growth rates in Poland, Luxemburg, Lithuania, and Czech Republic, whereas Germany, the Netherlands, Malta, and Cyprus experienced a decrease.
Looking at regional data, Figures 1 and 2 provide an illustration of the spatial distribution of, namely, the CW contingents and the share of creative workers in the active population in the last reference period. The latter map nuances a high penetration of creative workers in a central European section broadly extending from the Scandinavian and Baltic countries to the Mediterranean region.
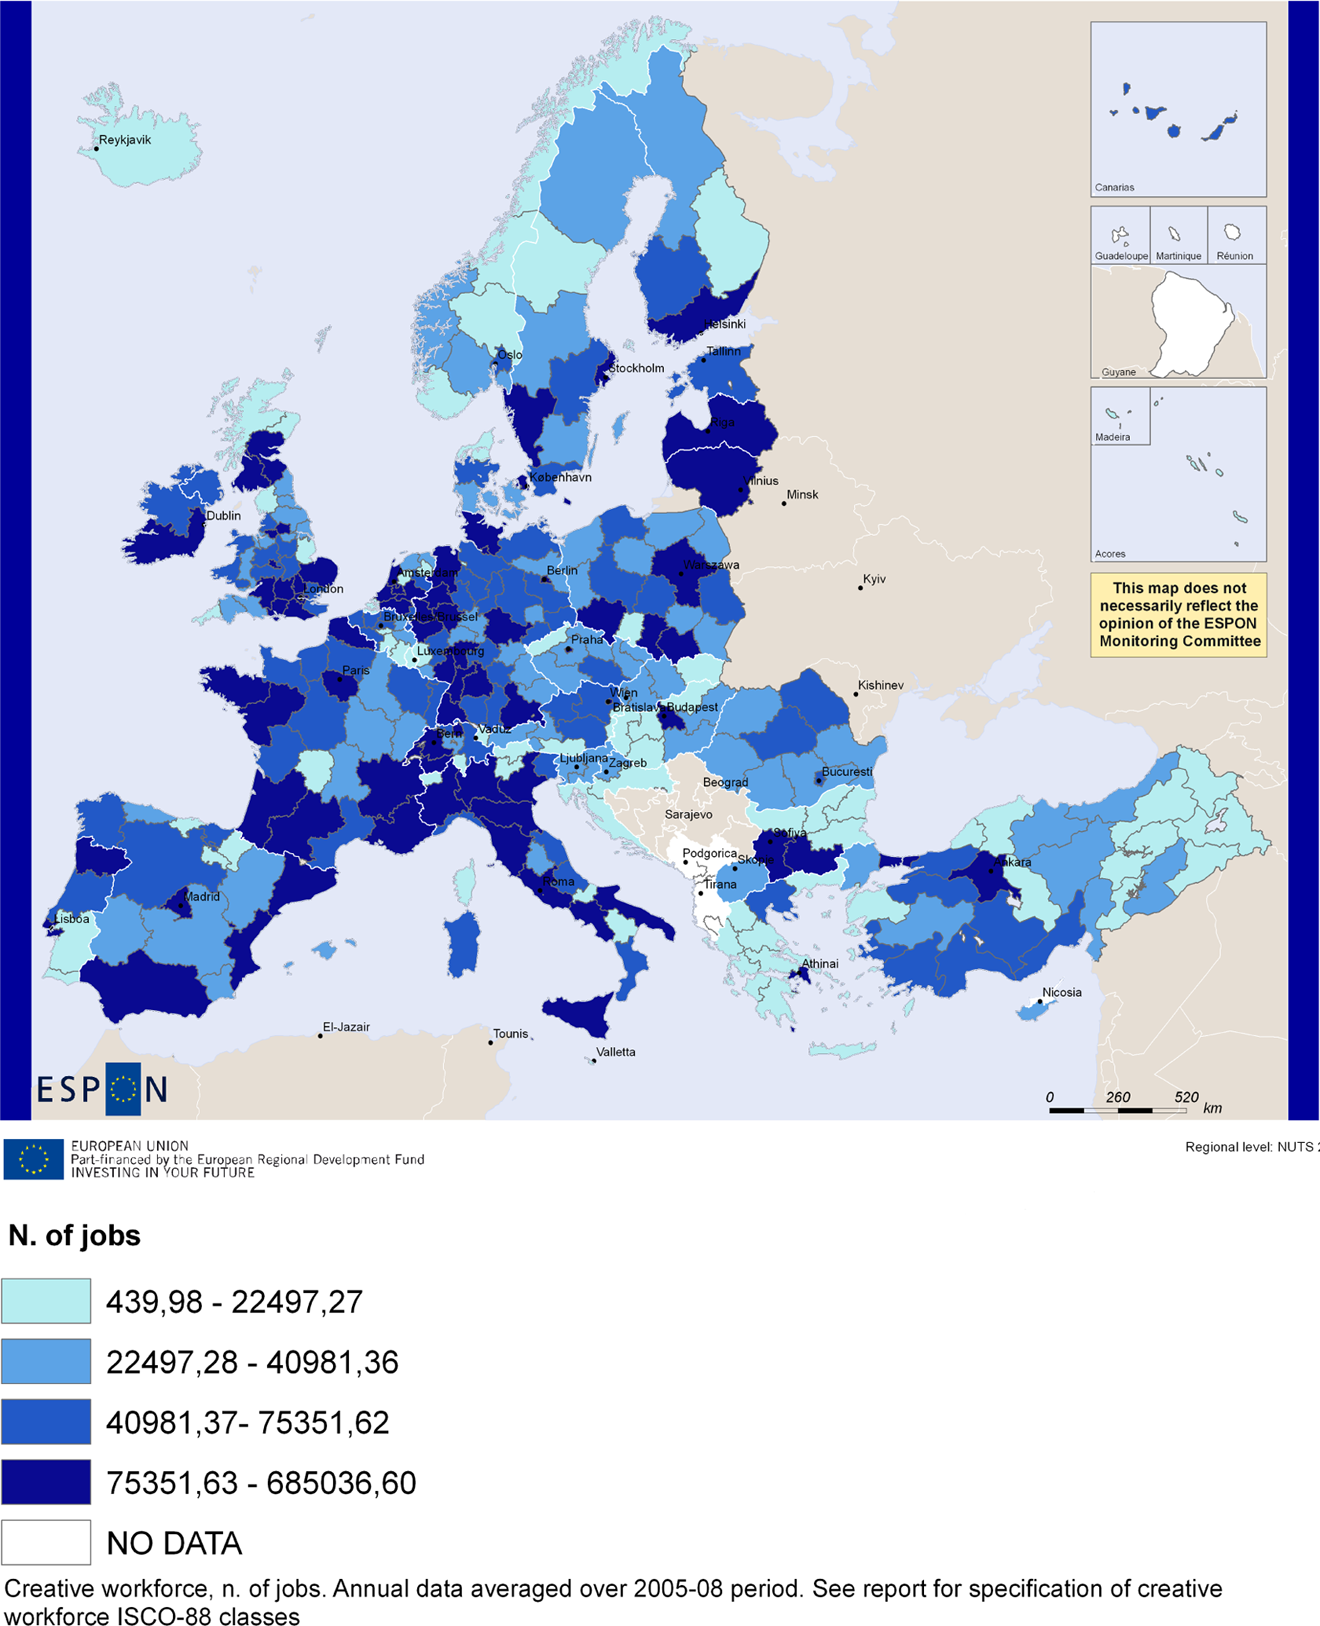
Creative workforce contingents, 2005 to 2008.

Creative workforce as a share of the active population, 2005 to 2008.
Figure 3 roughs up the information on change rates of such penetration indexes between the two reference periods in terms of quartile switches. This map suggests a progressive catch-up in terms of creative workers attracted or retained into regions that have been lagging behind in the early 2000s, with noncore and peripheral regions experiencing the largest improvements.

Evolution of the dimension of the creative workforce, 2001–2004 to 2005–2008.
Another factor nuanced in this map is the good performance of mature tourist coastal and island regions, such as the Balearic Islands, Algarve, Sardinia, the Dodecanese, and Brittany. This seems to confirm Anton Clavé and González Reverté’s (2007) argument on tourism as an agent of development through which local societies grow more complex and diverse, especially in its stage of maturity. This map also seems to indicate that the industrial core of the pentagon, as well as the two main urban regions of Spain register a relative rarefaction of their CW. For instance, Madrid and Barcelona, in spite of registering a large (and moderately increasing) contingent of creative workers, experience a larger increase in the “noncreative” professionals, diluting the potential for innovation of their economies. The situation for core industrial regions is, instead, one of net loss of creative workers.
CW and Economic Development
The next object of our analysis is the relation between the evolution of the CW and economic growth, captured by a simple PCGDP indicator. The degree of correlation between the evolution of the two indicators confirms that the general trend is that wealthier regions have a higher share of creative workers among their active population both in the 2001 to 2004 (R 2: 0.37) and 2005 to 2008 (R 2: 0.41) periods.
Figure 4 shows an association between high values of creative workers and PCGDP for the second reference period in core regions, while the same association, but with negative values, holds in most of Eastern Europe, the Iberian Peninsula, and Southern and insular Italy. A negative association between the two variables is found in few other regions, like the Baltic countries (high contingents of CW, low PCGDP) and in regions of western and in the “rust belt” of Central France, northern England and Scotland, and Norway (low contingents of CW, high PCGDP).
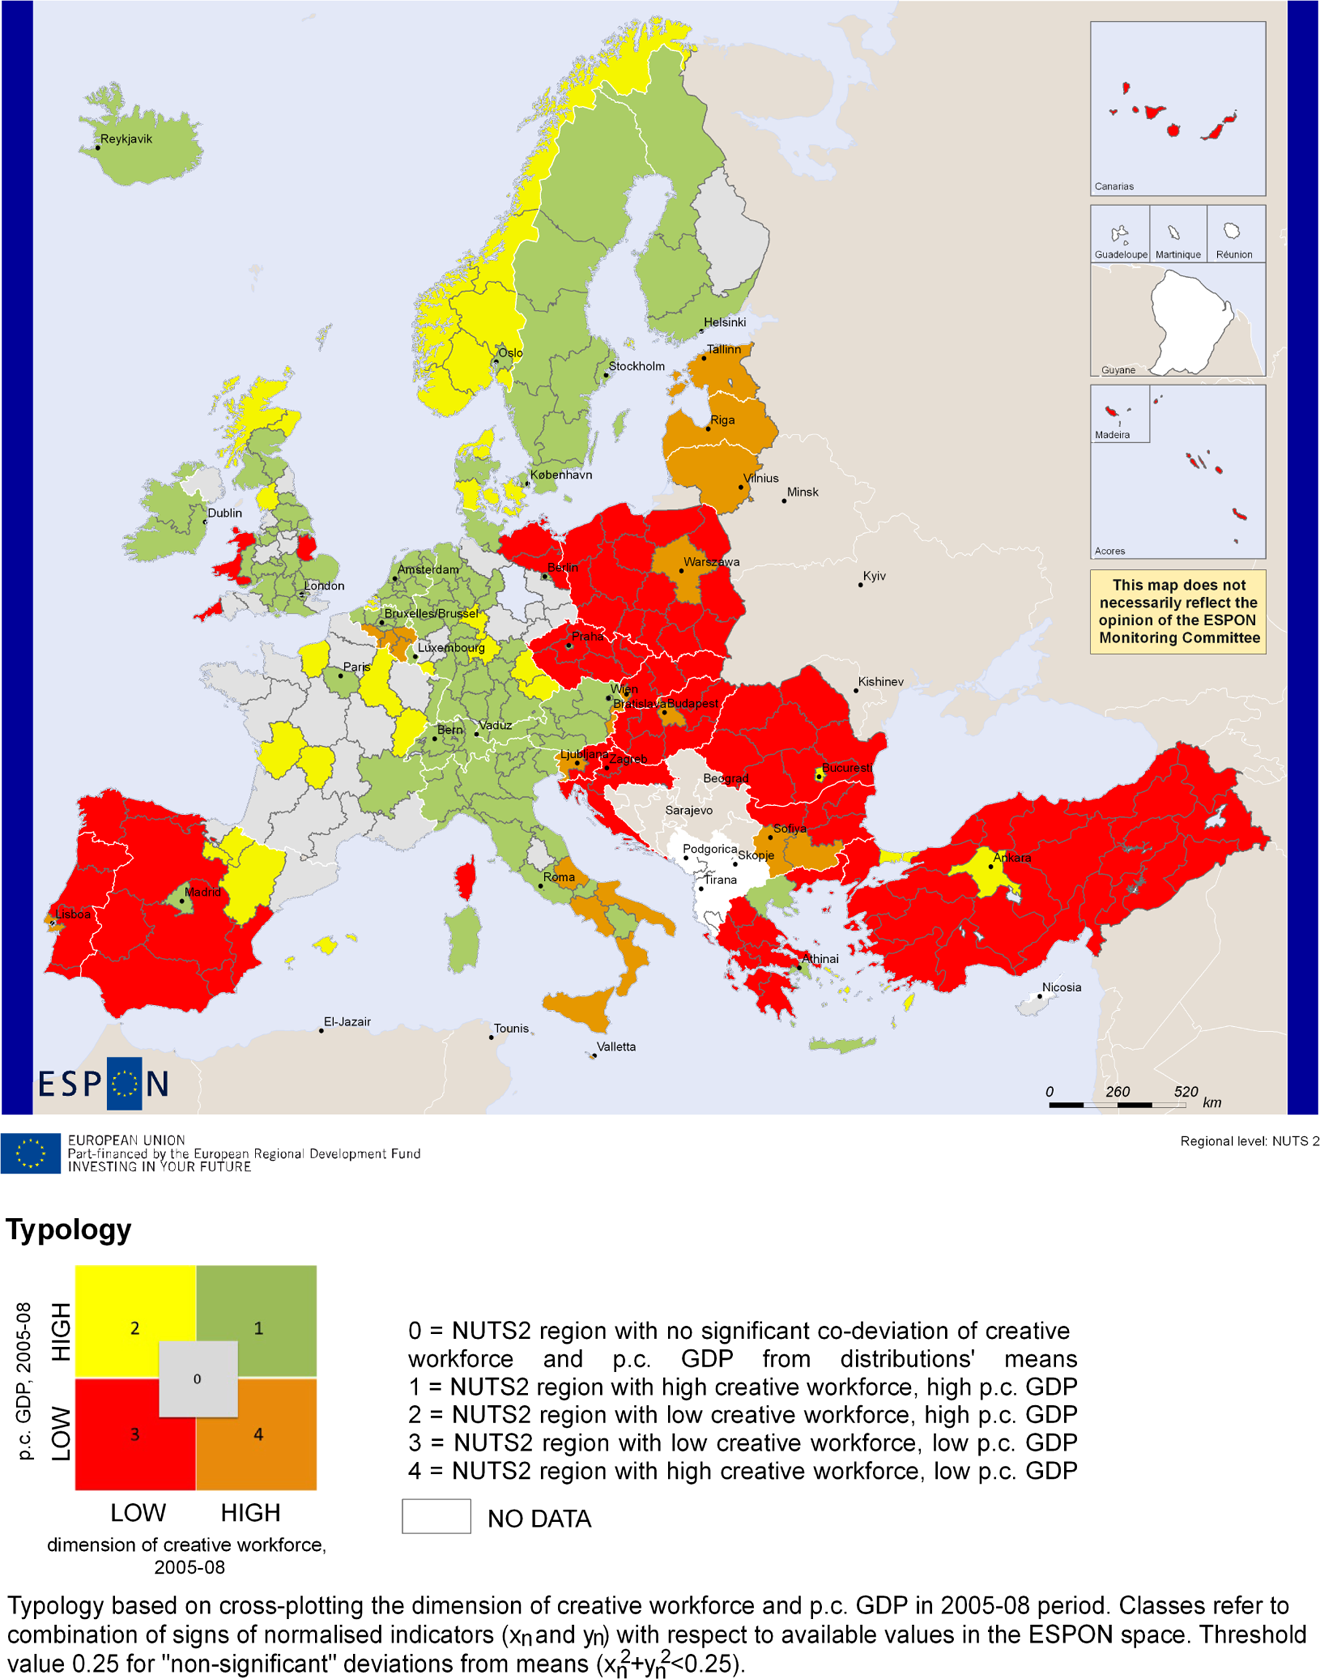
Relationship between dimension of the creative workforce and per capita gross domestic product, 2005 to 2008.
Concerning the dynamic from 2001–2004 to 2005–2008, Figure 5 classifies regions according to the sign of changes in both variables, using normalized change rates. Here, we consider positive and negative changes in both variables as differences from the European averages. 3 We have colored in gray a class of regions where changes in both variables are small and insignificant. 4 Regions colored in green and red exhibit “expected” change signs in the two variables, whereby these two indicators, respectively, grow or decrease simultaneously, consistently with the bulk of the literature on the creative class and its drivers to mobility (e.g., Florida 2005). Growing places attract symbolic workers, while places experiencing an economic downturn tend to lose them, triggering a “global competition for talent.”
Among “green” regions in Figure 5 we find most Polish and Czech regions, Romania and Croatia, large parts of continental Greece and Turkey, and the three Baltic countries, which by 2008 are positioned as one among the most dynamic regions of creativity in Europe. Although this possibility should be reviewed on the basis of a detailed research, it may be argued that the strategic orientation of structural funds available to these regions throughout the 2000s toward the development of Small Medium Enterprises (SMEs) in creative and knowledge-intensive sectors has been one of the main drivers of this leverage.
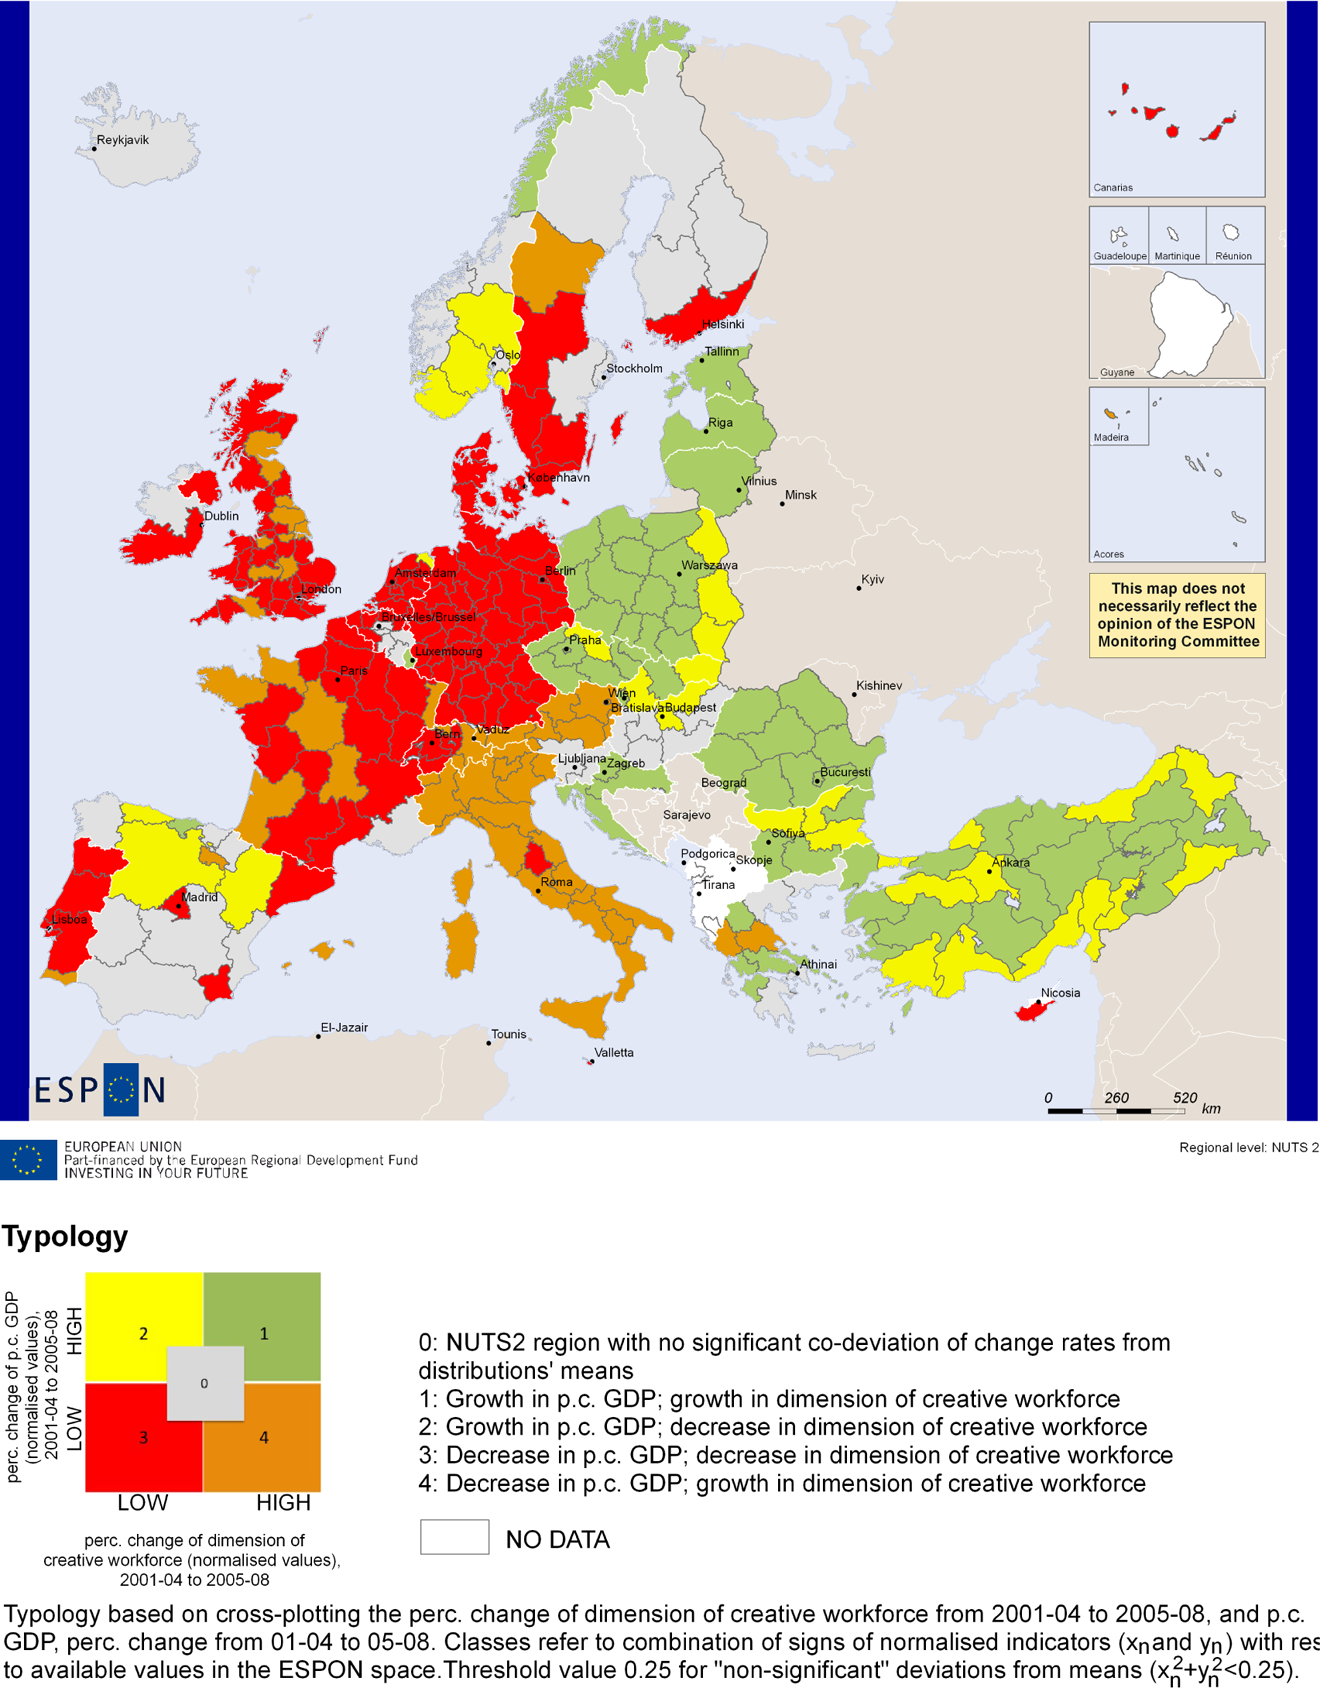
Relative coevolution of creative workforce and per capita gross domestic product between 2001 to 2004 and 2005 to 2008.
On the other hand, “red” regions are economically thriving regions that have seen a relative deceleration of growth and have lost some of their primacy in terms of creative resources. Possibly the reasons for this are to be sought in the loss of urban and environmental quality that accompanies economic maturity, where rising property prices, agglomeration disadvantages may start to deplete their attractiveness and capacity of retention for young creative talents (Russo and Van der Borg 2010).
At the other end of the spectrum, there are also a few yellow and orange spots. The former class includes regions where a relative growth in PCGDP has been accompanied by a relative decrease of the CW. This might be interpreted as a sign that economic growth in the last decade has been mainly driven by “noninnovative” sectors. Conversely, “orange” regions—where the CW has grown at a faster pace than the economy or even with opposite signs—may be seen as not having been fully able to capitalize on their CW, because of lack of institutional capacity or a certain “impermeability” between the cultural sphere and the mainstream economic sectors.
Approximately, a fifth of the European regions experienced a significant transition in the relationship between their distributions of CW and PCGDP, for instance, Ostschweiz in Switzerland, Valle d’Aosta, the Bolzano province, Friuli-Venezia Giulia in Italy, and Cheshire in the United Kingdom. Arguably, in these regions the good living conditions and a progressive cultural policy might have had the effect to retain creative talent or attract new creative workers. Finally, it is worth noting that while none of the first quadrant regions of Figure 4 loses substantially their economic advantage in the second period, a few of them experienced a substantial erosion of their primacy in terms of CW. 5
However, complex the interpretation of these “transition” effects, it is interesting to note that some regions that have been catching up in economic terms during the 2005 to 2008 period have also experienced a sensible growth in their CW, which should guarantee that their growth is more resilient. In any case, mechanisms of causality will be better understood after the analysis carried out in the next section.
CW and Economic Development: Causal Relations and Spatial Stratification
In this section, we deploy econometric techniques to learn more about the links between CW and economic development and their coevolution, which has been analyzed in the previous section in purely descriptive terms. In particular, the Granger causality test allows us only to determine the causal relationship between CW and PCGDP and not the magnitude of the impact of the independent variable on the dependent one. To this purpose, we implement the econometric estimates and we use EUROSTAT data for the 317 European regions, corresponding to the European level NUTS2, over the period from 2001 to 2008.
Methodology of Analysis
The procedure used to test the causality relationship in a panel data set 6 has been suggested by Holtz-Eakin, Newey, and Rosen (1988). The Granger causality test for panel data is expressed by (1):
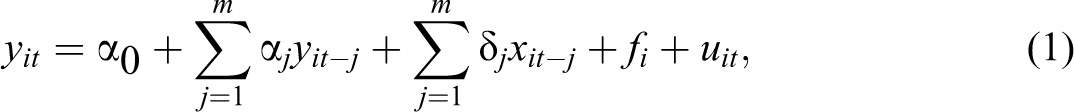
where i = 1, …, N are the observation units and t = 1, …, m represents the time index. The model in differences (2) allows us to eliminate the fixed effects (FEs; fi ):
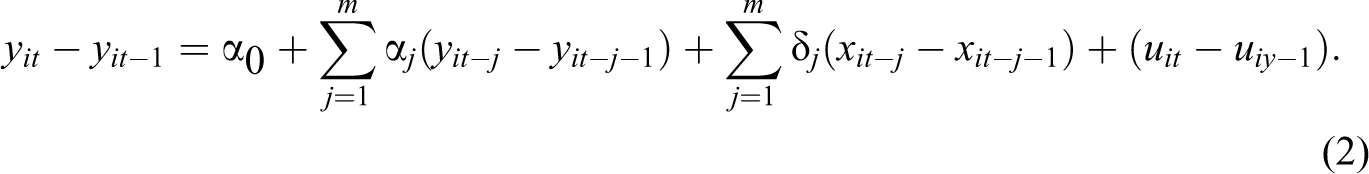
This specification introduces a simultaneity problem because the error term is correlated with
In order to verify, if x causes y it is necessary to test the joint hypothesis
Furthermore, in order to mitigate the distortion problem resulting from the omission of relevant variables, we control for education. To this aim, we have included in our analysis the EUROSTAT data set of employed population by highest level of education attained focusing on tertiary educational levels (5 to 8) at NUTS2 level. In fact, there are several other variables that are likely to contribute to the number of creative workers, for example, the business composition of NUTS regions, the number and quality of educational institutions, and so on but at present we do not have those variables. We overcome the problem by omitted variables by using panel data. In particular, panel data allow controlling for omitted (unobserved or mismeasured) variables (see Hsiao 2003; Wooldridge 2001).
In particular, we will use EUROSTAT data for the 317 European regions, corresponding to the European level NUTS3, over the period from 2001 to 2008.
Preliminary Analysis of Causal Relationships
The Granger test performed on CW and PCGDP shows that PCGDP Granger causes CW (regression 1, Table 2). 7 In particular, we observe that the null hypothesis which assumes that PCGDP does not cause CW is rejected at 1 percent. Conversely, when we test whether CW Granger causes PCGDP, the test does not reject the null hypothesis; consequently, CW does not cause PCGDP (regression 2, Table 2).
Granger Causality Test. 14
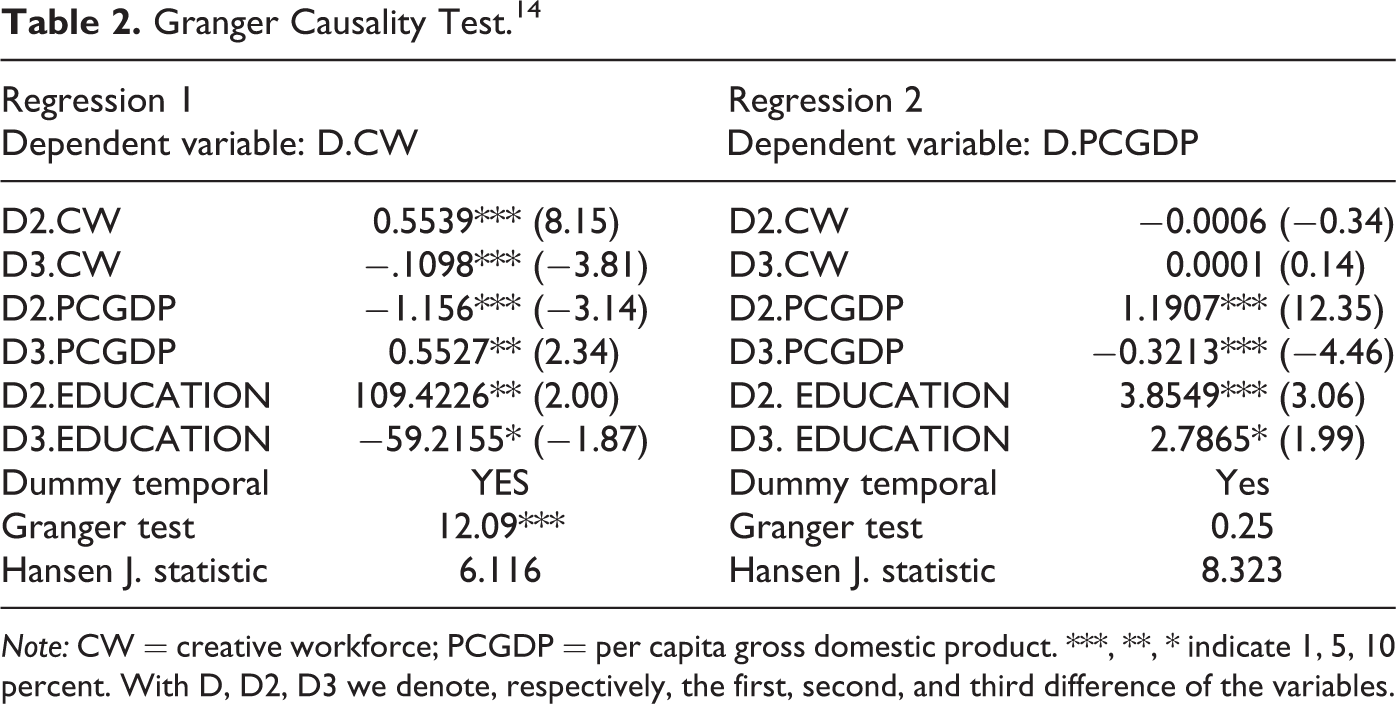
Note: CW = creative workforce; PCGDP = per capita gross domestic product. ***, **, * indicate 1, 5, 10 percent. With D, D2, D3 we denote, respectively, the first, second, and third difference of the variables.
In summary, we find absence of simultaneity due to the presence of a single causal relationship; this gives as scope to deploy the econometric analysis with the specifications that follow below. In fact, in the presence of simultaneity issues we would have to use an instrumental variables estimator.
Regression Analysis
Static analysis with panel data
In this analysis, we consider the following equation:

where CWit is the dependent variable, the subscript i refers to the statistic unity (the region), and t refers to the time; α, β1, β2 are the parameters that must be estimated; The PCGDP i ,t and EDUCATION i,t are the regressors; uit is the stochastic error term.
In the panel analysis, we distinguish between FEs and random effects (REs). In particular, in a panel analysis the error can be decomposed in,
In the panel with FEs, on the contrary, μ i is not a random variable but a parameter to be estimated and it is specific to the region; it captures a structural aspect of the region that differentiates it from other regions. Also λ t is a parameter that captures annual changes that are common to all regions. 10
Dynamic analysis with panel data
We also propose a dynamic model for panel data, whose specification is given by the equation:

The symbology is the same as equation (3), with the exception of the terms of the dependent variable and the regressors CW, PCGDP, and EDUCATION, which are one period lagged.
The estimation of this model faces several problems. First, using panel data, ordinary least square (OLS) coefficients are biased when unobservable region-specific effects (μ i ) are statistically significant, and when the regressors are correlated with these effects. In addition, in regard to the lagged dependent variable, CW i,t −1, OLS returns inconsistent estimates as CW i,t −1 and μ i are necessarily correlated, even if the idiosyncratic component of the error term is serially uncorrelated. It is thus necessary to eliminate the term μ i by taking first differences by equation (4). OLS still does not consistently estimate the parameters of interest because first differencing introduces correlation between the lagged dependent variable and differenced error terms CW i,t −1 and uit through the terms CW i,t –1 and uit −1.
One way to overcome these problems is the use of an instrumental variables procedure applied to a dynamic model of panel data. In particular, we refer to a generalized method of moments (GMMs) estimator that uses the dynamic properties of the data to generate proper instrumental variables (Arellano and Bond 1991; Arellano and Bover 1995). 11
Since the consistency of the parameters obtained by means of the GMM estimator depends crucially on the validity of the instruments, we consider two specification tests: the Sargan test of overidentifying restrictions, which tests the null hypothesis of overall validity of the instruments used, and the test for serial correlation of the error term, which tests the null hypothesis that the differenced error term is first and second order serially correlated. Failure to reject the null hypothesis of no second-order serial correlation implies that the original error term is serially uncorrelated, and the moment conditions are correctly specified.
Empirical Results
As for the static estimates (see equation [3]), we observe that the Hausman test rejects the null hypothesis and leads us to prefer FEs to random ones. Both the FEs and REs results show that the coefficient associated with PCGDP is not significant; in practice, an increase of PCGDP has no effect on CW. Education has positive expected sign and is statistically significant at 1 percent. This leads us to conclude that tertiary education is the driving force in the growth of the CW.
It would seem, from static estimates, that PCGDP has no relevance in determining the CW. It is possible that an increase in PCGDP does not produce immediate (simultaneously) its effects on CW but after a period of time (see equation [4]). In order to test this hypothesis we proceed to a dynamic estimation, introducing among the regressors, in addition to PCGDP contemporary, a lag of one period of PCGDP and of the dependent variable, CW. Also, we check for education and its one period lag. In this estimation, for econometric reasons which are provided in the methodology section, we will not proceed with an OLS estimator but with a GMM-system estimator.
The results of the dynamic estimation (GMM system) bring out the relevance (significant) of the coefficient associated with the lag of PCGDP, PCGDP(t−1); this shows that an increase in PCGDP affects CW only after one year. The coefficient associated with contemporary PCGDP is negative and not significant. The lag of the dependent variable, CW(t−1) also turns out to be significant in explaining CW, showing how an increase in CW in the past has a positive effect on CW in the present. Finally, we observe that education is the main factor driving the CW. In particular, we note that the coefficient associated with the EDUCATION is always positive and statistically significant at 1 percent. The magnitude of its impact on CW decreases over time (with parameters of 144.19 at time t and 135.76 at time t−1).
The Sargan test, which allows us to verify the validity of the instruments, does not reject the null hypothesis, and this confirms the validity of instruments used.
The Wald test—tests of significance of parameters—leads us to reject the null hypothesis of no significant of the parameters.
In addition, there is evidence of the presence of serial correlation of first order (we reject the null hypothesis); whereas, there is no evidence of the presence of second-order serial correlation (the null hypothesis is not rejected, Table 3). 12
Fixed, Random, and GMM Regressions.
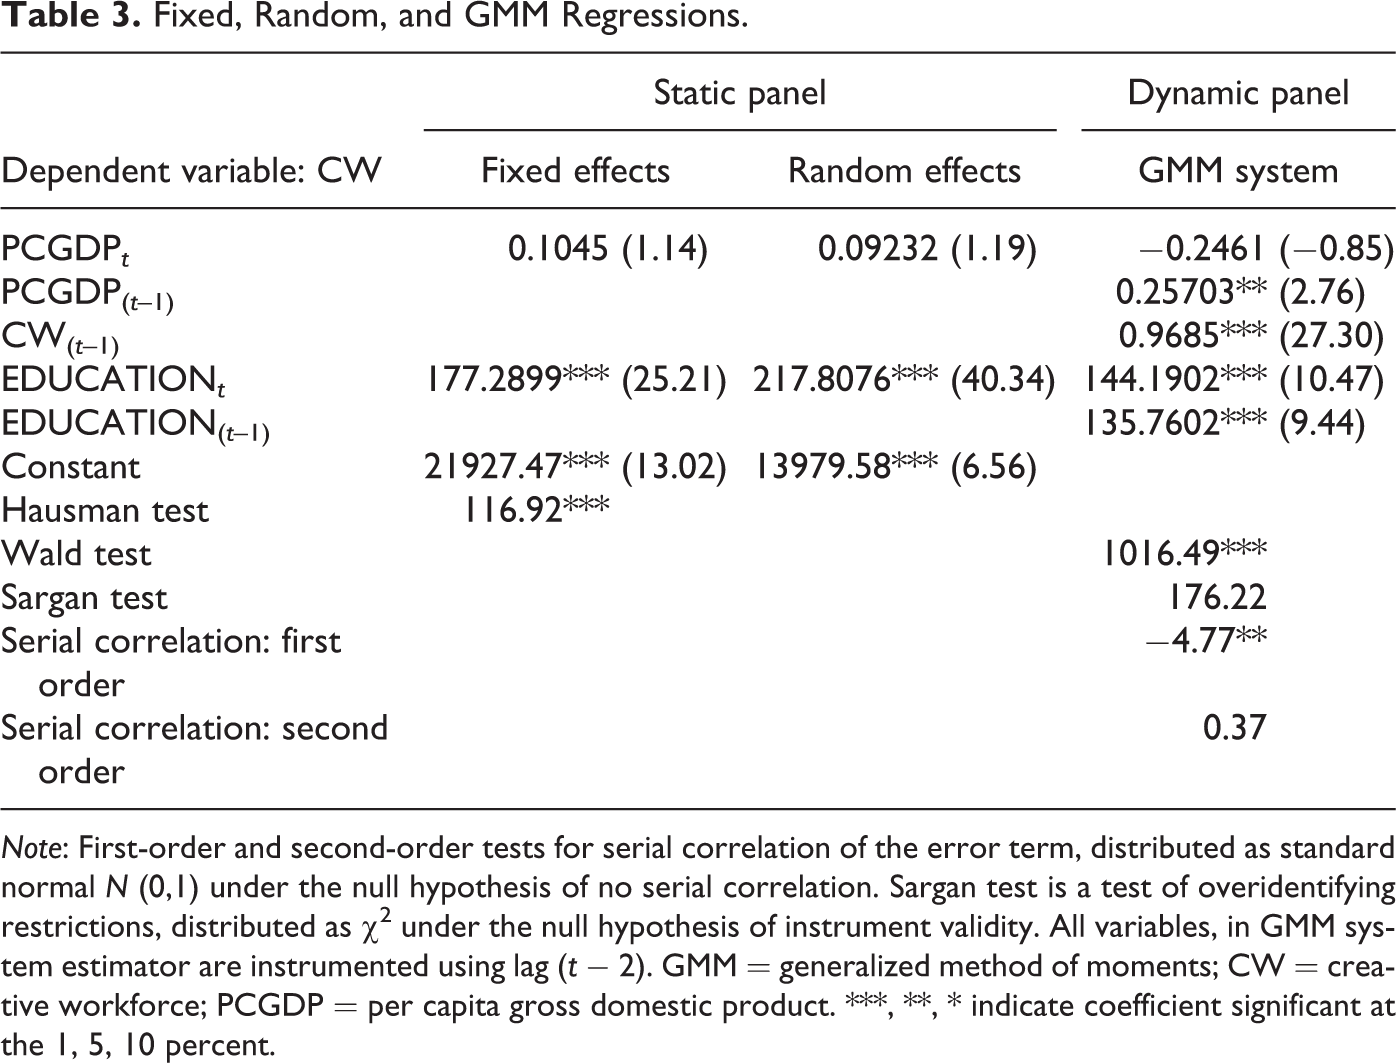
Note: First-order and second-order tests for serial correlation of the error term, distributed as standard normal N (0,1) under the null hypothesis of no serial correlation. Sargan test is a test of overidentifying restrictions, distributed as χ2 under the null hypothesis of instrument validity. All variables, in GMM system estimator are instrumented using lag (t − 2). GMM = generalized method of moments; CW = creative workforce; PCGDP = per capita gross domestic product. ***, **, * indicate coefficient significant at the 1, 5, 10 percent.
Granger Causality Test for Regional Clusters: A Preliminary Analysis
In this section, we will implement the Granger test on clusters of region in order to verify whether the results previously obtained on the whole sample of European regions are confirmed. In particular, we will refer two forms of segmentation: One defined on the basis of the status of eligibility for European funding, thus distinguishing regions in competitiveness and employment regions and convergence regions. One based on the attractiveness of European regions and cities for residents and visitors (ATTREG) typology of attractive regions,
13
thus distinguishing regions in “overheating” and “nonoverheating” regions.
Our goal is to verify, for both segmentations, if the tests confirm the previous results of Granger test, that is, the PCGDP Granger causes CW. Also, in this case we check for education. Our initial intuition is that these segmentations embed different processes through which the CW and economic development are related, in relation to “pull” or “push” effects through which growth leverages the inward mobility of the creative professionals versus the proactive agency of public policy in attracting creative workers. Thus, such relations may be “hidden” in the global analysis but may resurface when a cluster of regions with similar structural or evolutionary conditions of their economy are considered.
The Granger causality test conducted on the two clusters built on the basis of the status of eligibility for access to European funds returned the following results. With regard to regions defined as “competitiveness and employment regions” it leads to the conclusion of the absence of any type of causal relationship between the two variables (Table 4a, regressions 1 and 2). In particular, the Granger test performed both in regression 1, which tests the hypothesis that the PCGDP Granger causes CW, that in regression 2, which tests the hypothesis that CW Granger causes PCGDP, does not reject the null hypothesis. We conclude that for this group of regions, segmented according to the eligibility criteria of the European funds, there is no relationship between PCGDP and CW.
Granger Causality Test: Segmentation according to the Eligibility Criteria.
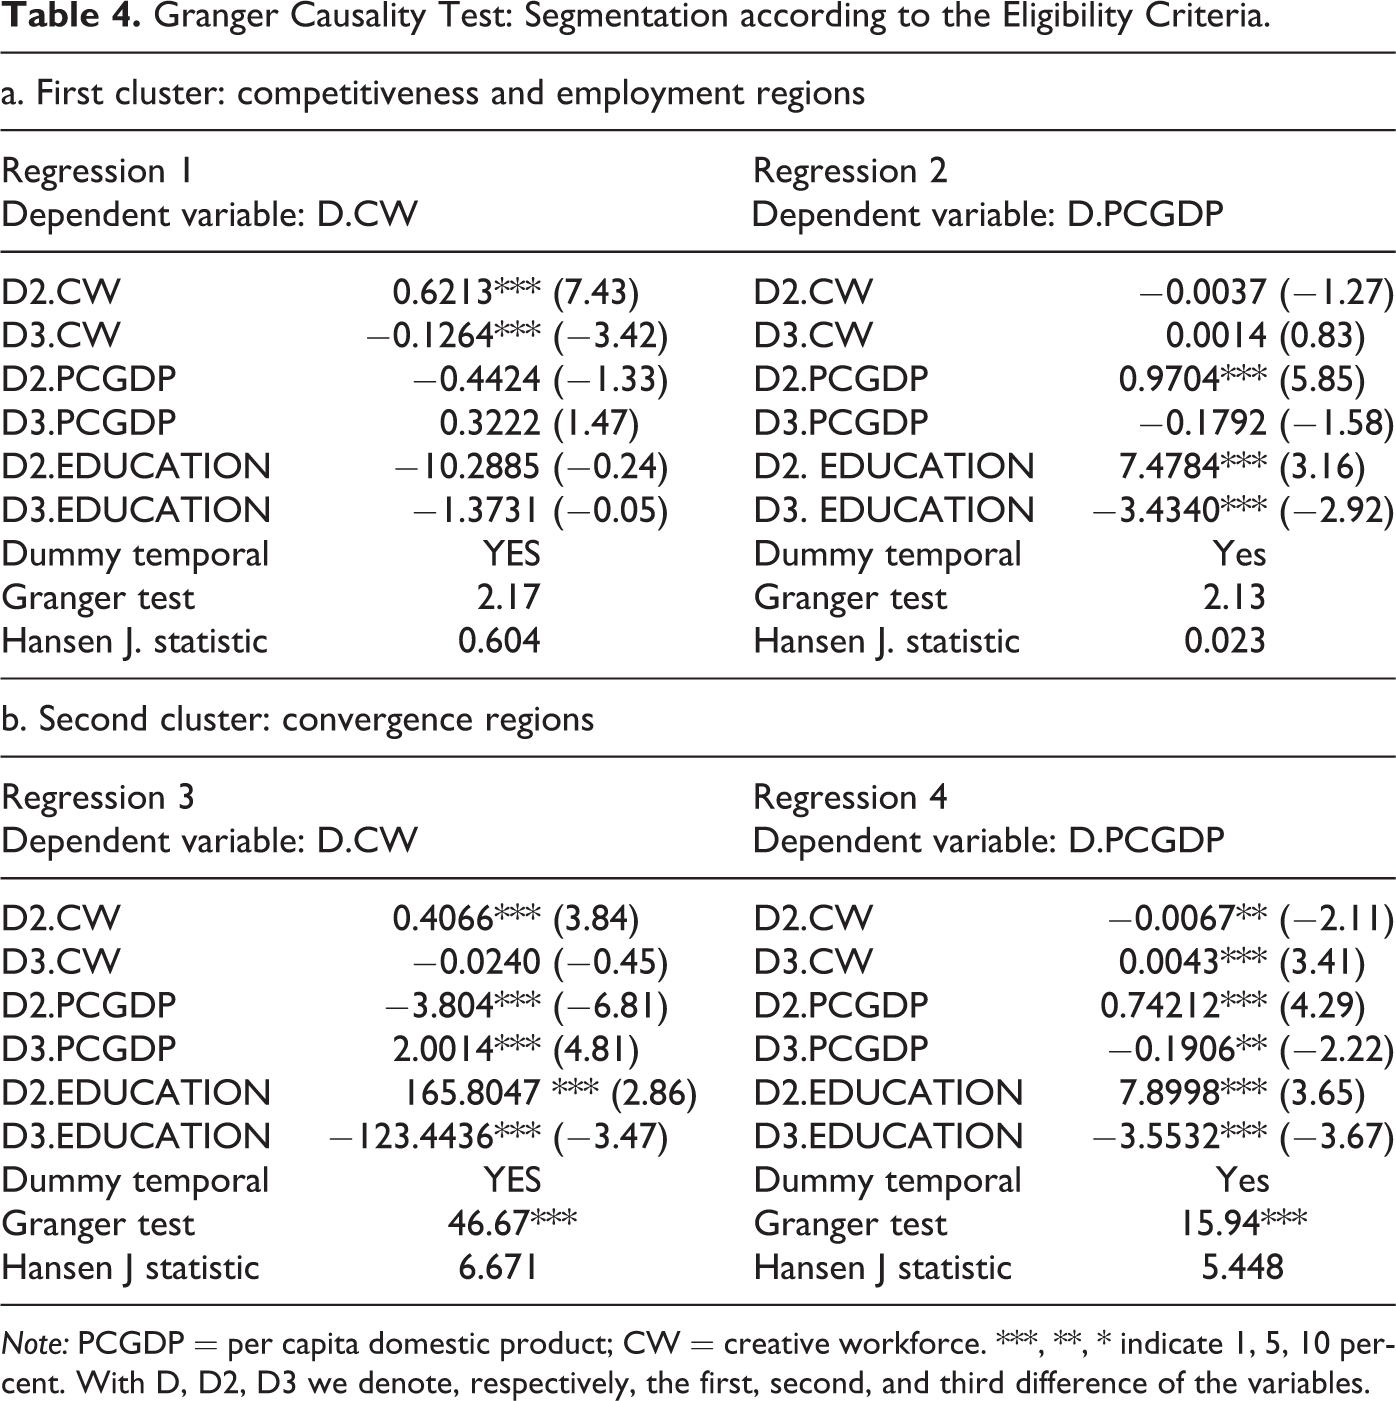
Note: PCGDP = per capita domestic product; CW = creative workforce. ***, **, * indicate 1, 5, 10 percent. With D, D2, D3 we denote, respectively, the first, second, and third difference of the variables.
For the second group of regions, the so-called convergence regions, we observe that the null hypothesis is rejected both in the case where it is assumed that PCGDP Granger causes CW (regression 3, Table 4b), and in the case where the inverse relationship is assumed, namely, that CW Granger causes PCGDP (regression 4, Table 4b). Hence, for this cluster of regions, the Granger test reveals a bidirectional relationship between CW and PCGDP.
Subsequently, we perform the Granger test for the segmentation based on the ATTREG typology of attractive regions. In particular, in the case of overheating regions, we observe that the Granger test rejects the null hypothesis, revealing that PCGDP Granger causes CW (regression 1, Table 5a); on the contrary, the Granger test does not reject the null hypothesis in regression 2 (Table 5a), revealing that CW does not cause PCGDP. Regarding the second group of regions (nonoverheating), we observe that the Granger test returns the same results obtained for the regions classified as overheating regions. In particular, the Granger test rejects the null hypothesis only when we investigate the hypothesis in which PCGDP Granger causes CW (regression 3, Table 5b); on the contrary, when we investigate the opposite hypothesis, that is, CW Granger causes PCGDP, the Granger test does not reject the null hypothesis (regression 4, Table 5b).
Granger Causality Test: Segmentation according to ATTREG on Migrations Criteria.
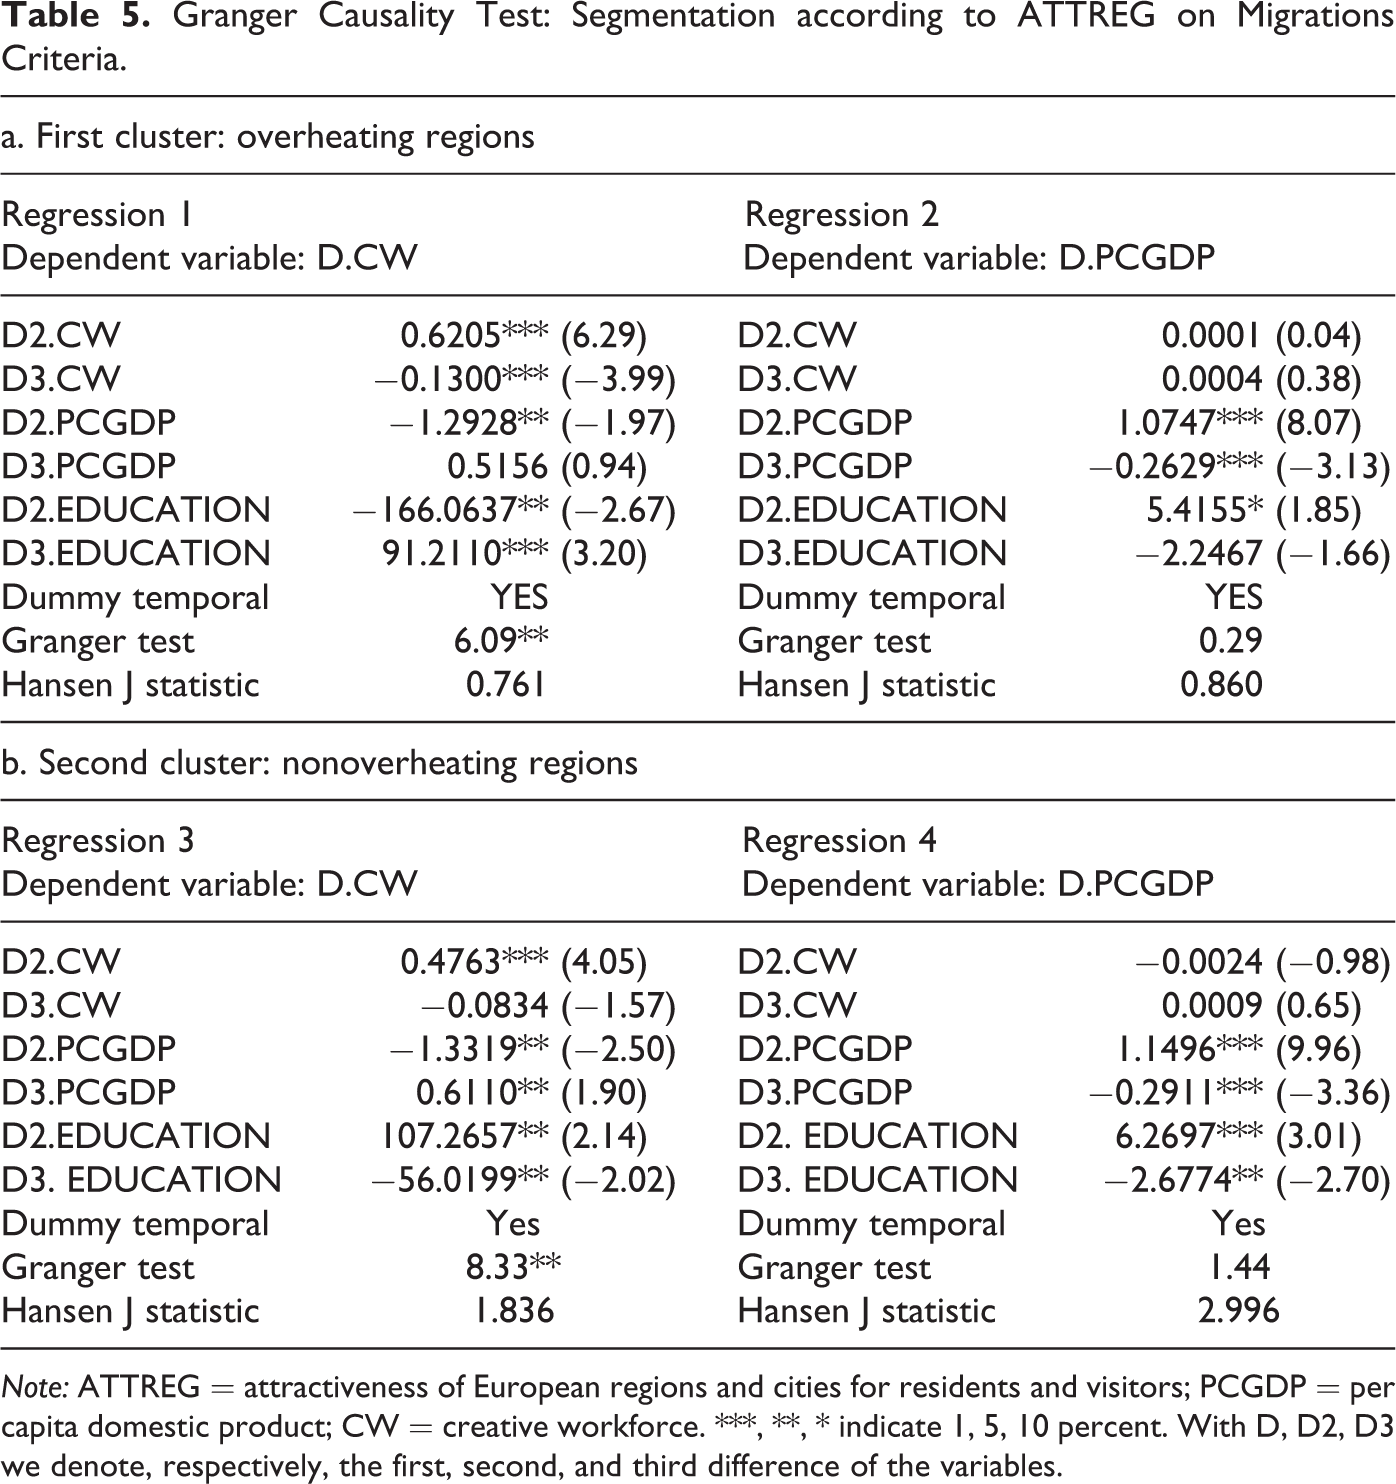
Note: ATTREG = attractiveness of European regions and cities for residents and visitors; PCGDP = per capita domestic product; CW = creative workforce. ***, **, * indicate 1, 5, 10 percent. With D, D2, D3 we denote, respectively, the first, second, and third difference of the variables.
Table 6 summarized these results. Causality tests return different results depending on the type of segmentation. Specifically, we observe that,
Summary of the Empirical Results.
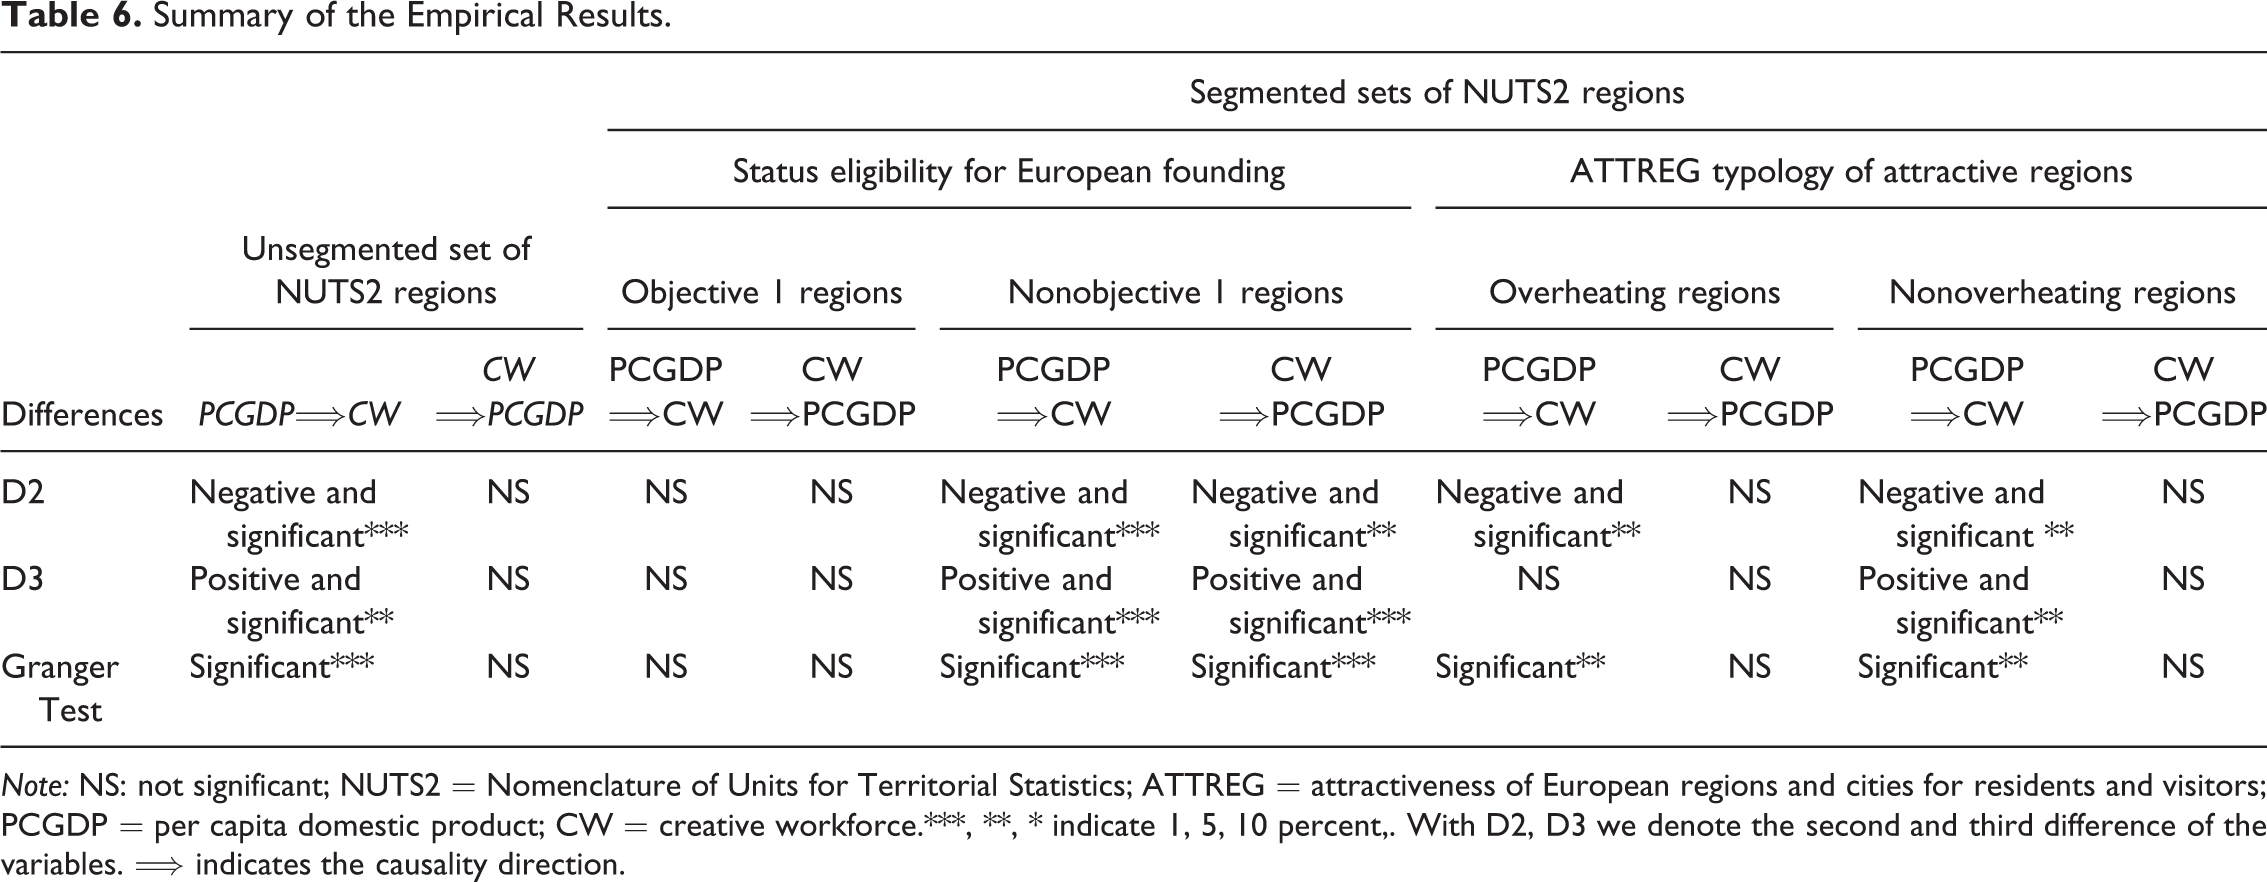
Note: NS: not significant; NUTS2 = Nomenclature of Units for Territorial Statistics; ATTREG = attractiveness of European regions and cities for residents and visitors; PCGDP = per capita domestic product; CW = creative workforce.***, **, * indicate 1, 5, 10 percent,. With D2, D3 we denote the second and third difference of the variables. ⟹ indicates the causality direction.
In the case of segmentation based on the eligibility criteria, when we consider the regions belonging to the first cluster (competitiveness and employment regions) there is proof of absence of any causal relationship between PCGDP and CW; instead, in the case of regions belonging to the second cluster (convergence regions) there emerges a bidirectional relationship in which PCGDP Granger causes CW and vice versa.
In the case of segmentation based on attractiveness criteria, the results in terms of causality are the same; in particular, we observe both in the first cluster of regions (overheating regions) and in the second cluster of regions (nonoverheating regions), that PCGDP Granger causes CW. This result is consistent with results obtained previously for the entire sample of regions. Thus, this type of segmentation does not provide any new knowledge on the processes of attraction of creative workers, although, as the research on which it is based shows (Smith and Atkinson 2011), the effects experienced on the local work market are quite different in the two groups of regions considered.
These results are not what we expected, although a different segmentation and a more sophisticated specification might derive different results. This point is to be picked up in future research.
Discussion of Results and Conclusions
The Territorial Agenda of the European Union 2020 “toward an inclusive, smart and sustainable Europe of diverse regions” (available online at http://www.eu2011.hu/files/bveu/documents/TA2020.pdf) identifies accelerating globalization and growing vulnerability to external shocks experienced by local and regional communities as among the most important challenges faced by the EU for the sustainable development of the European society. Countering these trends, it proposes and encourages, among other things, the development of innovation and smart specialization strategies in a place-based approach making the best use of social capital, creativity, and territorial assets to achieve greater and integrated competitiveness.
This article presented, first, some evidence suggesting that the implementation of these directives and their translation into regional policies should not overlook the role and spatial effects of the creative economy in Europe. In fact, it was shown that there exist clear spatial patterns in the distribution and evolution of the CW of Europe and its association with economic growth, which has been illustrated in the second section, and call for a place-based approach in different fields of European policy making (innovation, attraction of talent, migration, cultural investment, etc.).
For instance, this can be a relevant indication for regions which come out as exhibiting “odd” signs in their relation between CW and growth (also in terms of coevolution of these two variables), as illustrated in Figure 5. Thus, regions with a high rate of CW and low PCGDP (orange regions in Figure 5) or having experienced high-growth rates of their creative industries workforce as compared to their PCGDP (orange regions in Figure 5) should have been concerned about making their creative capital “matter” for economic growth. They may be regions offering good place amenities and showcasing substantial cultural assets which employ people in cultural industries, but they could not make a complete transition to a postindustrial economy where creative workers are a springboard for innovation in the local economy. Adequate local policy should target these shortcomings, for instance, designing arrangements and platforms for the “transfer” of creative knowledge into the local economy.
Conversely, regions that experience structural problems both with their CW and with their economic growth (red regions in Figure 5), should evaluate what investments in the cultural and creative infrastructure could represent a first step to trigger an economic regeneration trajectory. For instance, the development of cultural events, cultural tourism, and research clusters. This, indeed, is the current policy of Cyprus: 100 percent of the European Structural Funds devoted to culture is invested in one of the three implementation codes available, namely, the “development of cultural infrastructure,” while Finland is allocating only 24.8 percent and Italy 19.5 percent to this line of investments (European Institute for Comparative Cultural Research [CSES-ERICarts] 2010).
At EU level, similar initiatives could again be designed so as to achieve these “balancing” effects and within the context of a borderless Europe they may even have greater chances to bring about territorial cohesion as far as the innovation potential from creative human capital is concerned. For instance, interregional migration as well as educational, infrastructure, and tourism policy programs could be designed to as to favor local “virtuous cycles of creativity” in the smart development of rural and peripheral regions but also target consistently urban areas so as to integrate the objective of the attraction and inclusion of talent as a pillars of sustainable economic development.
Obviously, however, the financial meltdown of the years immediately following the period of this study has somewhat compromised the positive outlook. With few exceptions, the global crisis seems to have struck harder on regions that had been experiencing a spectacular recovery in the previous years. If their burgeoning CW could account for at least a small part of this recovery in a number of regions with specific characteristics, as we tried to argue using evidence from this study, it is not possible to demonstrate with the available data that indeed these regions have been more resilient than others to the present economic difficulties in the short term. As an example, the meltdown of the construction sector in tourist coasts of the Mediterranean is likely to have offset the possible gains that these regions experienced in the previous years in terms of innovation potential.
Our suggestion, though, is that these very regions may well be the better equipped to find their own way to recovery in the medium term, when the most devastating effects of the crisis will be over, on condition that they will be able to retain the CW that they have nurtured and attracted.
If instead the propensity to migrate will prevail, as increasing numbers of highly skilled workers are reported to be fleeing from countries that are experiencing the worst effects of the crisis, like Spain, Italy, or Greece, we could be experiencing again a “polarizing” trend leading to a less cohesive Europe.
However, our econometric analysis indicates that the causal effect between creative work and growth is not direct and simple but is likely to be complex and strongly mediated by policy and governance conditions, as is anticipated by, among others. While it is recognized and confirmed by our analysis that an economically buoyant situation is a magnet for creative workers and more in general is likely to engender longer term processes of development of a creative economy, the contrary (that creative workers cause economic development) is not proved.
These results need to be evaluated against the long-lasting hype about culture and creativity as potential key drivers of local development processes. In particular, they seem to challenge some of Florida’s findings (2002, 2005, 2008), consistently with the criticism we quoted in the first section of this work.
Sticking to mere regional economic considerations, we have found that whereas the presence of creative workers does not per se explain a better economic performance, the contrary is true. Economic buoyancy does seem to cause an increase in creative workers, and especially this is true after a lag of time and subject to lock-in effects, which may imply that two processes are possibly simultaneously taking place: a short-term effect by which well-off regions have higher chances to attract creative workers from other regions where these earn lower salaries, a classical production link, and besides they tend to migrate where a critical mass of creative workers is already present (in this latter sense picking up Florida’s argument on the capacity of the creative class to “make places attractive” for the high end of the labor market), a longer term effect by which economically buoyant regions are those places where there are higher chances that a creative economy is developed though a consumption link (there is a wealthier and more sophisticated local market for creative and designed products, which opens new opportunities for creative producers and engenders a process of specialization of the local workforce.
In either cases, a different specification of CW would probably produce different results, for instance, it was highlighted by Marrocu and Paci (2010) that creative workers do not per se engender processes of innovation, while highly educated people do. Creative workers may be rather attracted into places by quality of life and services than by the presence of a creative community.
In any case, our findings indicate that regional economies are not boosted by mere creativity according to a simple “plug and play mechanism.” The counter example from our study is the case of many Italian regions, that for Tinagli and Florida (2005) is a remarkably creative country in terms of Florida’s “3 T’s” but with important capacity building problems, or Austria and many regions of France. Not surprisingly, these are regions that cluster a very important cultural heritage and cultural institutions: the CW is then largely relegated in “cultural industries” with a very important symbolic role for their countries but a marginal effect in terms of economic development. In times of serious financial crisis and spending reviews, the dependence on public bodies shows the fragility of the creative sector in these regions.
Data limitations (in time and scale) and the purely geostatistical approach of this article clearly constrain its capacity to provide incontrovertible answers to all these issues and should be complemented by a finer scale analysis as well as by case study-based research focusing on drivers and processes of transmission between creativity and economic performance, which we leave for future research.
To conclude, our exploratory results refute a commonly accepted causal scheme by which cultural and creative attractors cause a multiplier effects by boosting local economy in a sort of postindustrial Keynesianism. It is illusory that a true long-term growth dynamics can be originated in this way; rather, it is more likely that large cultural and creative attractors will have a positive impact on the local economy if the latter is already highly productive and efficiently organized (Plaza 2008).
Footnotes
Appendix
ISCO-88 data on cultural professions (columns 2 and 3): 4D: four-digit data available 3D: three-digit ISCO-88 data available
EUROSTAT data on active population and GDP per capita: NUTS2: data at NUTS2 level available NUTS0: data at NUTS0 level available only
Declaration of Conflicting Interests
The author(s) declared no potential conflicts of interest with respect to the research, authorship, and/or publication of this article.
Funding
The author(s) received no financial support for the research, authorship, and/or publication of this article.