
Abstract
Alcohol availability plays an important role in violence. Less is known about how spatiotemporal patterns of alcohol–violence association vary across time of day and across various crime types. This study examined whether and how the associations between on- and off-premise alcohol outlets and assaults, and between on- and off-premise alcohol outlets and robberies, vary across different times of day (morning, daytime, evening, and late night). This cross-sectional study used socioeconomic, alcohol license, and crime data from Milwaukee, Wisconsin, aggregated to US Census block groups and estimated spatially lagged maximum likelihood regression models that controlled for spatial dependence. On-premise outlets were negatively associated with evening assaults and positively associated with daytime and late-night robberies. Off-premise outlets were positively associated with evening assaults, late-night assaults, daytime robberies, and evening robberies. Spatiotemporal alcohol–violence associations vary across crime types and across time of day. On- and off-premise alcohol outlets play a unique role across four different temporal categories and across two violent crime types. These findings have the potential to inform theoretical explanations of the alcohol–violence relationship and may be beneficial when considering and designing custom-tailored local alcohol policy to reduce alcohol-related harm.
This study examined the association between alcohol availability and violence. It adds to the current alcohol–violence literature by investigating whether this association varies across time of day (morning, daytime, evening, and late night) and across violent crime types (assault and robbery).
Alcohol outlets, a common proxy for alcohol availability, play a significant role in explaining community violence rates (Gruenewald et al. 2006; Livingston, Chikritzhs, and Room 2007; Pridemore and Grubesic 2012; Snowden and Freiburger 2015; Snowden and Pridemore 2013). The association between alcohol outlets and violence holds even when controlling for important neighborhood characteristics (Mair et al. 2013; Sparks 2011; Toomey et al. 2012). Less is known, however, about the nuanced spatial and temporal nature of this association (Haberman and Ratcliffe 2015) and whether these spatiotemporal patterns are similar for different violent crime types. In line with prior studies, this study disaggregated alcohol outlets into on-premise and off-premise outlets and examined separately the association between these two broad outlet types and morning, daytime, evening, and late-night assaults. Additionally, this study examined the association between on-premise and off-premise outlets and morning, daytime, evening, and late-night robberies. This approach fills an important gap in the current knowledge, provides a more detailed interpretation of the role that alcohol availability plays in violence, and can inform local alcohol policy efforts.
Literature Review
Theoretical Perspectives and Prior Empirical Studies
Two broad theoretical approaches (Gorman, Gruenewald, and Waller 2013) can explain the relationship between alcohol outlets and community violence rates. First, the alcohol–violence association may be due to the neighborhood characteristics. From the perspective of the social disorganization framework, neighborhood characteristics, such as ethnic heterogeneity, residential instability, family disruption, and rapid population growth (Sampson and Raudenbush 1999; Shaw and McKay 1942), contribute to disproportionate violent crime rates experienced by some neighborhoods. In addition to experiencing higher violent crime rates, such neighborhoods may be unable to organize their efforts to effectively limit alcohol outlets from opening within their boundaries (Pridemore and Grubesic 2012). As a result, socially disorganized neighborhoods may have both high violence levels and high availability of alcohol outlets (Snowden 2016). Second, the alcohol–violence association may also be due to the types of places licensed to operate within the neighborhoods. Interpreted through the lenses of routine activities theory, alcohol outlets create opportunities for convergence in time and space of motivated offenders, suitable targets, and lack of capable guardians (Cohen and Felson 1979). Alcohol outlets may be crime generators or crime attractors (Brantingham and Brantingham 1993) and create high violent crime levels in the neighborhoods where these places are licensed to operate. Therefore, the association between alcohol outlets and community violence rates can best be understood by considering both the neighborhood and the place attributes (Miethe and McDowall 1993; Weisburd 2012).
Rich, multidisciplinary literature provides support for these neighborhood- and place-based arguments and suggests these theoretical premises provide useful perspectives through which we can interpret the alcohol–violence association. These studies suggest that while neighborhood characteristics, such as social disorganization, are important predictors of neighborhood violence rates, availability of on- and off-premise alcohol outlets in neighborhoods warrants a careful consideration in any attempt to better understand neighborhood violent crime rates. Alcohol outlet availability is associated with violent crimes (Britt et al. 2005; Franklin et al. 2010; Gorman et al. 2001; Sparks 2011; Toomey et al. 2012; Zhu, Gorman, and Horel 2004, 2006), assaults (Pridemore and Grubesic 2012; Yu et al. 2008), hospitalizations for assaults (Mair et al. 2013), assaultive injury (Gruenewald et al. 2006), and access to alcohol, which is a significant predictor of violence (Day et al. 2012), net of important neighborhood characteristics that capture neighborhood social disorganization dimensions. However, this rich body of knowledge seems to be limited in considering how spatiotemporal patterns vary across different crime types (Grubesic and Mack 2008) and the extent to which alcohol outlets can explain some of these patterns. Certainly, we know that neighborhood dynamics and the nature of places that operate in neighborhoods matter for the alcohol–violence association, but we know much less about how the influence of alcohol outlets on violence varies across time of day and whether this variation is similar for different violent crime types, such as assaults and robberies. A few studies that exist in this area conceptualized violence as assaults or assaultive injuries and found violence-related injuries peak in the early morning hours in areas with highest density of bars and clubs (Cusimano et al. 2010; Nelson, Bromley, and Thomas 2001), and assaults are most common when bars close (Brower and Carroll 2007; Cusimano et al. 2010; Nelson, Bromley, and Thomas 2001). Importantly, few studies in this area systematically examined the unique role that alcohol outlets may play for different crime types (such as assaults and robberies) occurring during different temporal categories (such as morning, daytime, evening, and late-evening hours). Therefore, it is to be determined whether these findings can be generalized to other time periods (beyond early morning and closing hours) and to other types of violent outcomes (beyond injuries and assaults). As discussed in more detail below, there are reasons to expect that the association between alcohol availability may vary not only across different times of day but also across these two broad crime types. This study is important for theoretical and practical reasons. Theoretical developments are necessary to move the literature forward to also consider the temporal aspect of this relationship. Practical information can inform the design of custom-tailored local alcohol policies to both reduce the unnecessary burden of alcohol limitations and maximize the benefit of limiting alcohol availability for particular time of the day when such efforts may be most needed to reduce certain violent outcomes.
In sum, this study fills an important gap by examining the following research questions. First, does the association between alcohol outlets and assaults vary across different times of the day? Second, does the association between alcohol outlets and robberies also vary across different times of the day? Lastly, what similarities and differences in these associations exist for the two different violent crime types? Given the nature of guardianship and the difference in the time spent at each of the two alcohol outlet types (i.e., on- and off-premises), it is to be expected that the associations between on-premises and violent crimes will be different than the associations between off-premises and violent crimes. Additionally, the opportunities and motivations for engaging in robbery may be different than that for assaults, and alcohol outlets may contribute in unique ways to assaults and robberies occurring during different times of the day. For on-premise outlets, it is to be expected that in the evening hours (when many individuals go to these places in search of socialization rather than intoxication purposes), many on-premise patrons may serve as capable guardians. Additionally, on-premise employees and door staff may also quickly intervene and deescalate situations that may be undesirable for their establishment and patrons. As such, it is to be expected that a negative association would exist between on-premises and evening assaults and on-premises and evening robberies. However, on-premise outlets may be crime attractors at late night when a flow of patrons (some of whom may be intoxicated, vulnerable targets) leave these guarded premises and travel away from the places that provide capable guardians. Therefore, it is to be expected that the association would exist between on-premises and late-night assaults as well as between on-premises and late-night robberies.
For off-premise outlets, it is to be expected that the greatest effect of off-premises on assaults would occur in the late evening hours when most of the consumption of beverages purchased from these premises occurs in private settings that typically lack capable guardians. In terms of robbery, it is to be expected that robberies may occur in areas that have a high availability of off-premises and that the effect would be greatest in daytime and evening hours when patrons visit these establishments to purchase alcohol. In this research site, off-premise alcohol outlets must cease the sale of alcoholic beverages at 9 p.m., and most of these outlets close at that time. Therefore, it is to be expected that off-premise alcohol outlets would be unrelated to late-night robberies, as there would be a lack of available victims and opportunities for victimization.
Hypotheses
Given this literature review and gaps identified in the current understanding of the alcohol–violence association, this study will test the following hypotheses: (1) on-premise alcohol outlets will be associated with both late-night assaults and with late-night robberies; (2) off-premise alcohol outlets will be associated with late-night assaults, daytime robberies, and evening robberies.
Data and Methods
The data for this study come from Milwaukee, Wisconsin. With the estimated 2015 population of 600,155, Milwaukee is the largest city in the state of Wisconsin, the fifth largest city in the Midwest, and the thirty-first largest city in the United States (US Census Bureau, n.d.). The 2015 Milwaukee violent crime rate of 1,596.1/100,000 population is almost four times higher than the US national crime rate of 372.6/100,000 (US Department of Justice 2015a, 2015b) and almost two times higher than the 836/100,000 crime rate for cities with similar population (US Department of Justice 2015c). Milwaukee is also a city known for its long history of alcohol production. As of 2015, there were 1,308 active alcohol licenses in the city, the equivalent of 218/100,000 population or 14/square mile (City of Milwaukee n.d.). Clearly, the city of Milwaukee is exactly the type of research site where a better understanding of the alcohol–violence association is necessary.
The units of analysis for this study are 572 US Census block groups that lie within the city of Milwaukee boundaries. Although there are some limitations with the use of census block groups to capture neighborhood dynamics (Hipp 2007), it is a commonly used unit of analysis for neighborhood-level criminological research.
Dependent Variables
Assault and robbery data are publicly available from the City of Milwaukee website. In 2014, there were 8,460 assaults and 3,569 robberies. The data were geocoded using ArcGIS software with 99 percent success rate. Subsequently, the assault and robbery data were disaggregated into four temporal categories: morning (6:45 a.m. to 9:59 a.m.), daytime (10:00 a.m. to 4:29 p.m.), evening (4:30 p.m. to 9:14 p.m.), and late night (9:15 p.m. to 6:44 a.m.), providing data on the number of violent events during each of these time periods in each block group. This approach is similar to the classification method carried out in recent criminological literature (Haberman and Ratcliffe 2015). In the end, the data were standardized by the census block group area size because doing so considers the movement of victims and offenders across the boundaries of the census block groups during their everyday activities. The distribution of the crime data was skewed, so the scores were transformed using square root transformation. This transformation approach better reduced skewness of the data relative to other transformation approaches.
Independent Variables
The main independent variables include on- and off-premise alcohol outlets. The data on all 2014 active alcohol licenses were obtained from the Wisconsin Department of Revenue and filtered by the alcohol license categories to capture the two main broad alcohol outlet types. In 2014, there were 937 active on-premise and 287 active off-premise outlets. Like with the dependent variables, the alcohol outlet density for both alcohol outlet types was standardized by the census block group area size and transformed using square root transformation to reduce the skewness.
Control Variables
Social disorganization and routine activities theory indicators were calculated using the US Census Bureau 2013 American Community Survey data. In line with prior research (e.g., Sampson, Morenoff, and Earls 1999; Snowden, Hockin, and Pridemore forthcoming), social disorganization, included measures of concentrated affluence, concentrated disadvantage, concentrated immigration, and residential stability, was calculated using principal component analysis. Concentrated affluence (α = .85) consisted of percentage of adults with college education or beyond, percentage of professionals and managers among those in the civilian labor force, and percentage of families with incomes >US$75,000. Concentrated disadvantage (α = .62) included percent African American, percentage of households on public assistance, percent unemployed, and percent living below poverty line. Concentrated immigration (α = .75) was comprised of percent Hispanic or Latino and percent foreign born. Residential stability (α = .67) included percent living in the same house one year prior and percent owner occupied housing units. Routine activities theory measures included population density and percent vacant housing units. The routine activity variables were transformed using square root transformation because this approach was the most optimal in reducing the skewness.
Analytic Approach
IBM SPSS software version 24 was used to estimate the social disorganization measures, and ESRI ArcGIS software version 10.4.1 was used to enter, clean, and geocode spatially referenced data. Additionally, GeoDa software version 1.8.16.4 was used to estimate eight maximum likelihood spatially lagged regression models to test the hypotheses and to create regression residual maps. Because the crime and alcohol availability data are spatially referenced and the unit of analysis has artificially imposed boundaries, spatially lagged regression models are better suited for analysis of such data, relative to Ordinary Least Squares (OLS) models. Spatially referenced data are the type of data where, in addition to the phenomenon of interest, the location of where the phenomenon occurred is also recorded. For example, crime data not only have information about who committed the crime, the incident number, or when a crime occurred, it also have data on where the crime occurred. Spatially referenced data create special problems for OLS regression that assumes independent observations and independent errors because the crime and alcohol outlets exist in areas that have artificial boundaries (e.g., census block groups) and the processes occurring in one area are typically dependent on the processes occurring in the neighboring areas. Additionally, the units of analysis (e.g., census block groups) are often of different sizes, and the large variation of attributes in the variable of interest suggests heteroskedasticity in the data, violating OLS assumptions of identical and independent observations. To be sure, a set of regression diagnostics was evaluated to ensure that spatially lagged regression models were suitable for the nature of the data analyzed here. For example, the stronger fit of the spatial lag model was evident in the values of log likelihood, Akaike information criterion (AIC), and Schwarz criterion (SC), all of which were reduced in the spatial lag model relative to the OLS model. Additionally, preliminary analyses indicated spatial dependence in the dependent variables (indicated by the statistically significant value of Moran’s I) and the spatially lagged approach controlled for the influence of this nuisance (captured by spatially lagged term ρ) on parameter estimates (Anselin 1988; Anselin and Bera 1998). Additionally, tests for spatial dependence indicated that spatially lagged models were more appropriate than spatial error models, suggested by both Lagrange Multiplier (LM); (lag) and robust LM (lab), relative to LM (error) and robust LM (error) values. Ultimately, two sets of analyses were carried out. The first four models examined the role on- and off-premise density plays in morning, daytime, evening, and late-night assaults. The last four models examined the role on- and off-premise density plays in morning, daytime, evening, and late-night robberies.
Results
Table 1 shows the descriptive statistics for the variables before they were transformed. For an average Milwaukee block group, assaults were more prevalent than robberies, and both late-night assaults (64.95/square mile) and late-night robberies (28.96/square mile) occurred more often compared to assaults and robberies occurring in other time periods. In addition, an average Milwaukee block group contained about fifteen on-premise and about six off-premise alcohol outlets per square mile. As described above, apart from the social disorganization measures, the variables were transformed prior to estimation to reduce the skewness in the data, and the descriptive statistics for the transformed variables are shown in Table 2.
Descriptive Statistics for Untransformed Variables for Milwaukee Block Groups.
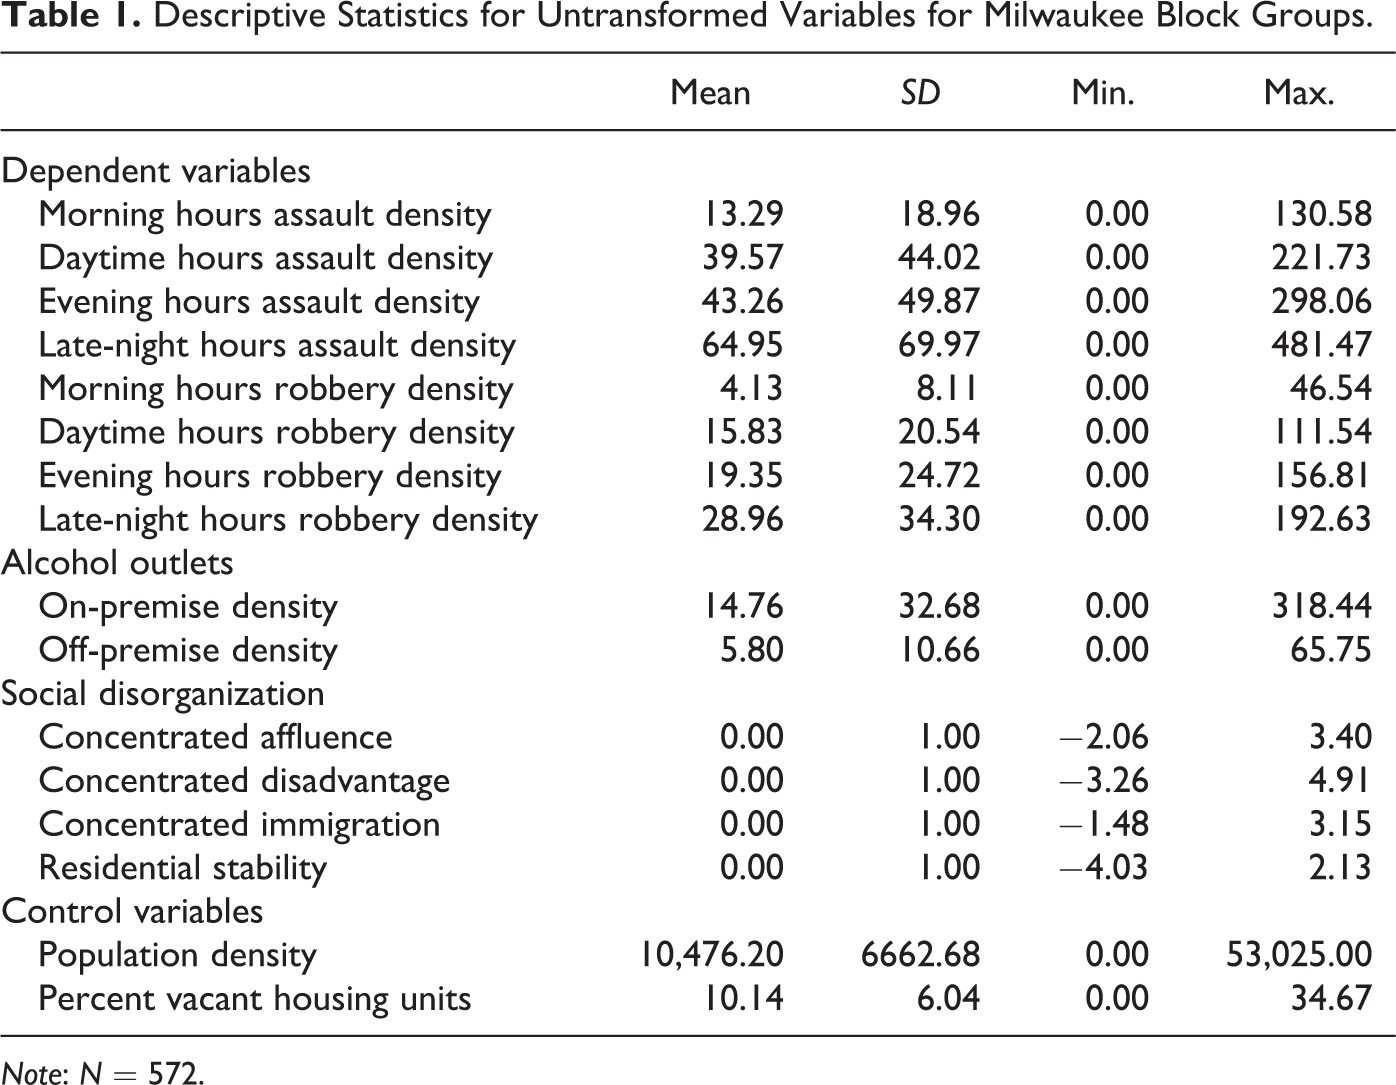
Note: N = 572.
Descriptive Statistics for Transformed Variables for Milwaukee Block Groups.

Note: N = 572.
Table 3 shows the results of assault density regressed on on-premise and off-premise alcohol outlet density and control variables. Model 1 shows the results for morning assault density, suggesting that the availability of both on-premise and of off-premise alcohol outlets was unrelated to morning assault density (b = −.04, p = .21; b = .04, p = .46, respectively). Similarly, the results of model 2 for daytime assault density suggest that both on-premise and off-premise alcohol outlets were unrelated to daytime assault density (b = .02, p = .54; b = −.00, p = .94, respectively). However, the results for evening and late-night assaults provide evidence that alcohol outlets matter for assaults occurring during these temporal categories. Model 3 results suggest that on-premise alcohol outlets were negatively associated with evening assaults (b = −.11, p = .00), and off-premise alcohol outlets were positively related to evening assaults (b = .11, p = .04). Lastly, the results of model 4 suggest that while on-premise alcohol outlets were unrelated to late-night assaults (b = .04, p = .31), off-premise alcohol outlets were positively associated with late-night assaults (b = .23, p = .00). With the exception of the spatial lag (ρ) term for the morning assaults model (b = .11, p = .06), the spatial lag (ρ) terms were significant contributors to the models 2–4 (b = .29, p = .00; b = .32, p = .00; and b = .34, p = .00, respectively). The value of R 2 for models 1–4 ranged from .37 (for morning assault density) to .72 (for late-night assault density), and as indicated by the value of multicollinearity condition number value of 13.78, correlation between the control variables was not a problem for models 1–4 (Anselin 2004).
Assault Density Regressed on Alcohol Outlet Density and Control Variables for Milwaukee Block Groups.
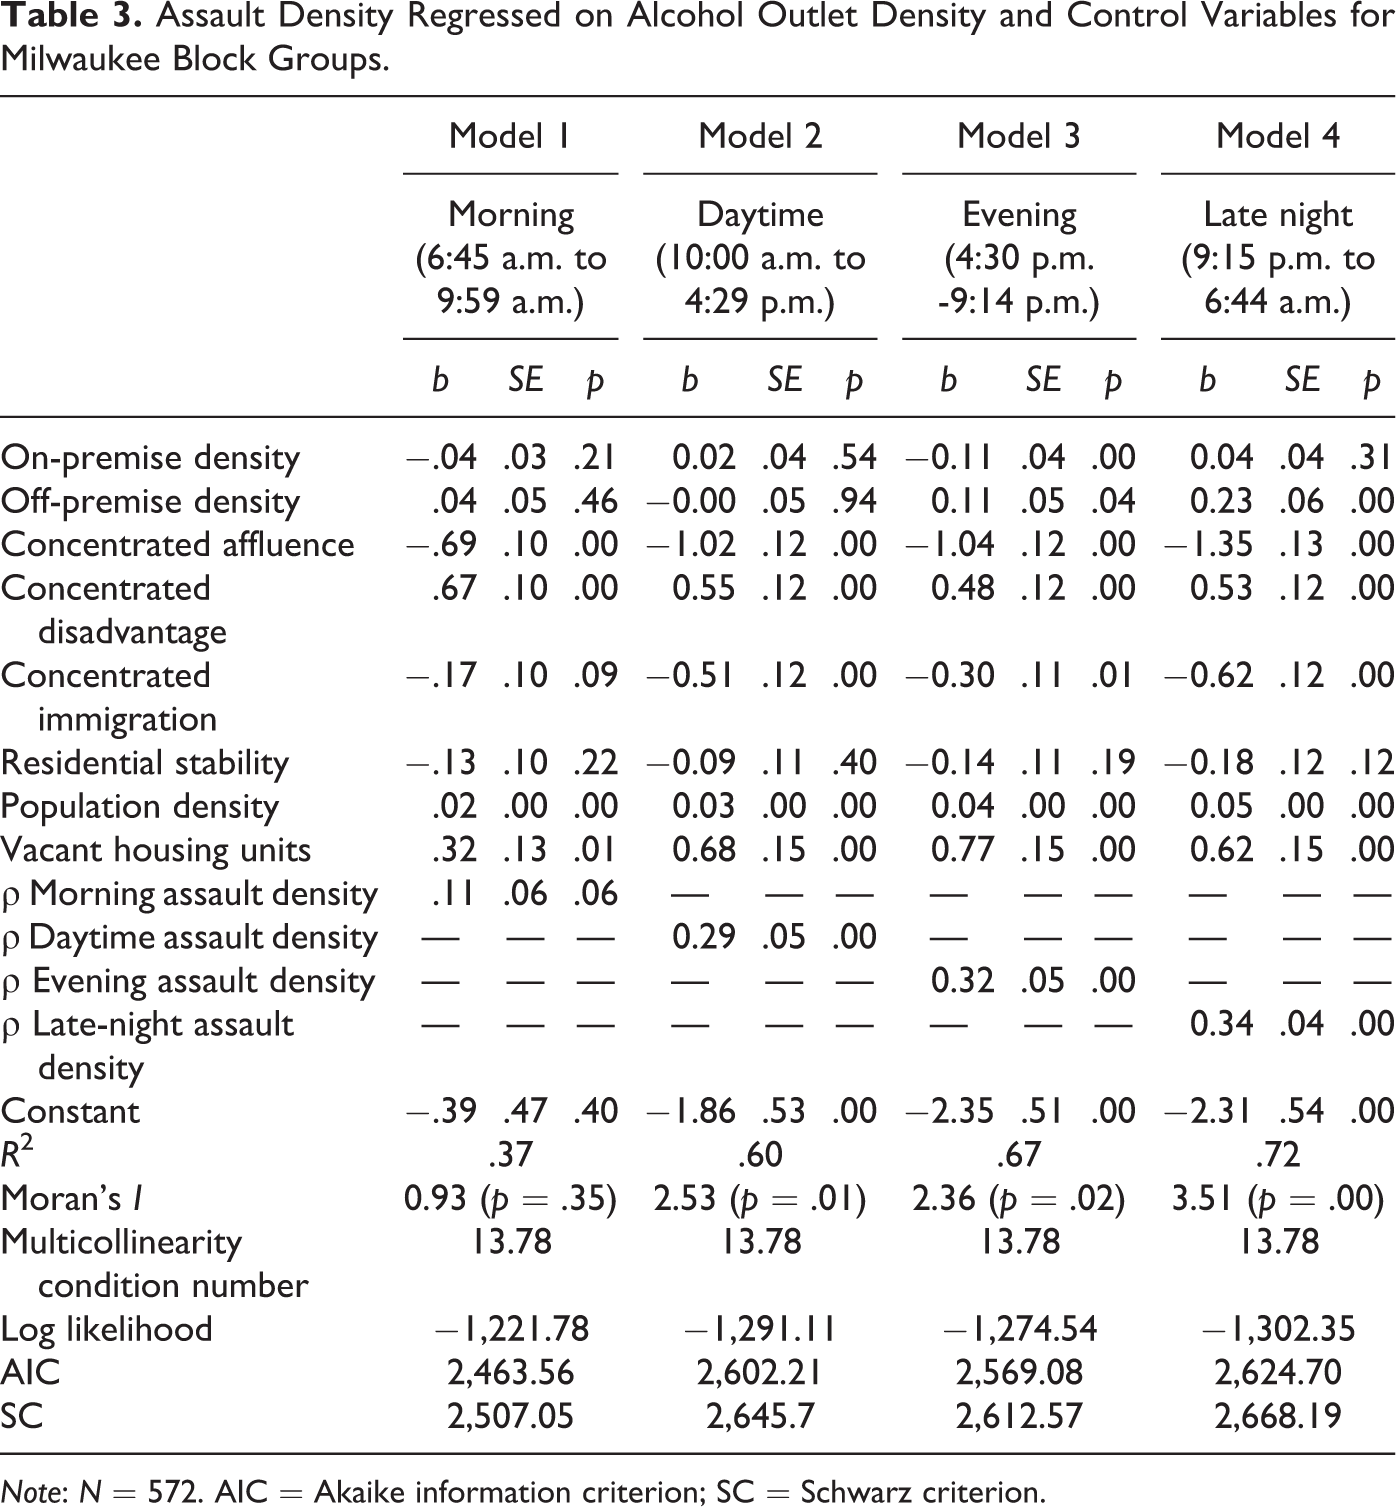
Note: N = 572. AIC = Akaike information criterion; SC = Schwarz criterion.
As expected, the negative association between on-premise density and evening assault density can be explained by the guardianship by patrons and outlet staff provided by on-premises, who may act quickly to deescalate conflicts. As such, areas with high on-premise alcohol outlet density have low evening assault density. The role of off-premises was most evident for evening assaults and late-night assaults, findings that can be interpreted due to consumption of beverages in private settings that often lack capable guardians. In other words, areas with high off-premise density also have high evening and late-night assault density.
Table 4 shows the results of robbery density regressed on on-premise and off-premise alcohol outlet density and control variables. Model 5 shows the results for morning robbery density, and as with morning assault density, both on- and off-premise density were not associated with morning robbery density (b = .38, p = .17; b = −.04, p = .24, respectively). The results for daytime robbery density, shown in model 6, suggest that both on-premise and off-premise density were positively associated with daytime robbery density (b = .11, p = .00; b = .11, p = .02, respectively). While both outlet types matter for daytime robberies, the relationship between these outlet types and evening robberies is only evident for off-premises but not on-premises. Model 7 shows the results for evening robbery density and suggests that off-premise, but not on-premise, density was associated with evening robbery density (b = .25, p = .00; b = .06, p = .12, respectively). Lastly, model 8 shows the opposite to hold true for late-night robbery density. For late-night robbery density, on-premise, but not off-premise, density matters (b = .08, p = .03; b = .08, p = .15, respectively). Daytime, evening, and late-night robbery spatial lag (ρ) terms were significant contributors to the models (b = .26, p = .00; b = .25, p = .00; and b = .44, p = .00, respectively), although the morning robbery spatial lag (ρ) term was not (b = .03, p = .67). The value of R 2 for models 5–8 ranged from .16 (for morning robbery density) to .53 (for late-night robbery density). As with previous models estimated for assaults in Table 3, multicollinearity was not a problem for models 5–8, indicated by the value of multicollinearity condition number of 13.78 (Anselin 2004).
Robbery Density Regressed on Alcohol Outlet Density and Control Variables for Milwaukee Block Groups.
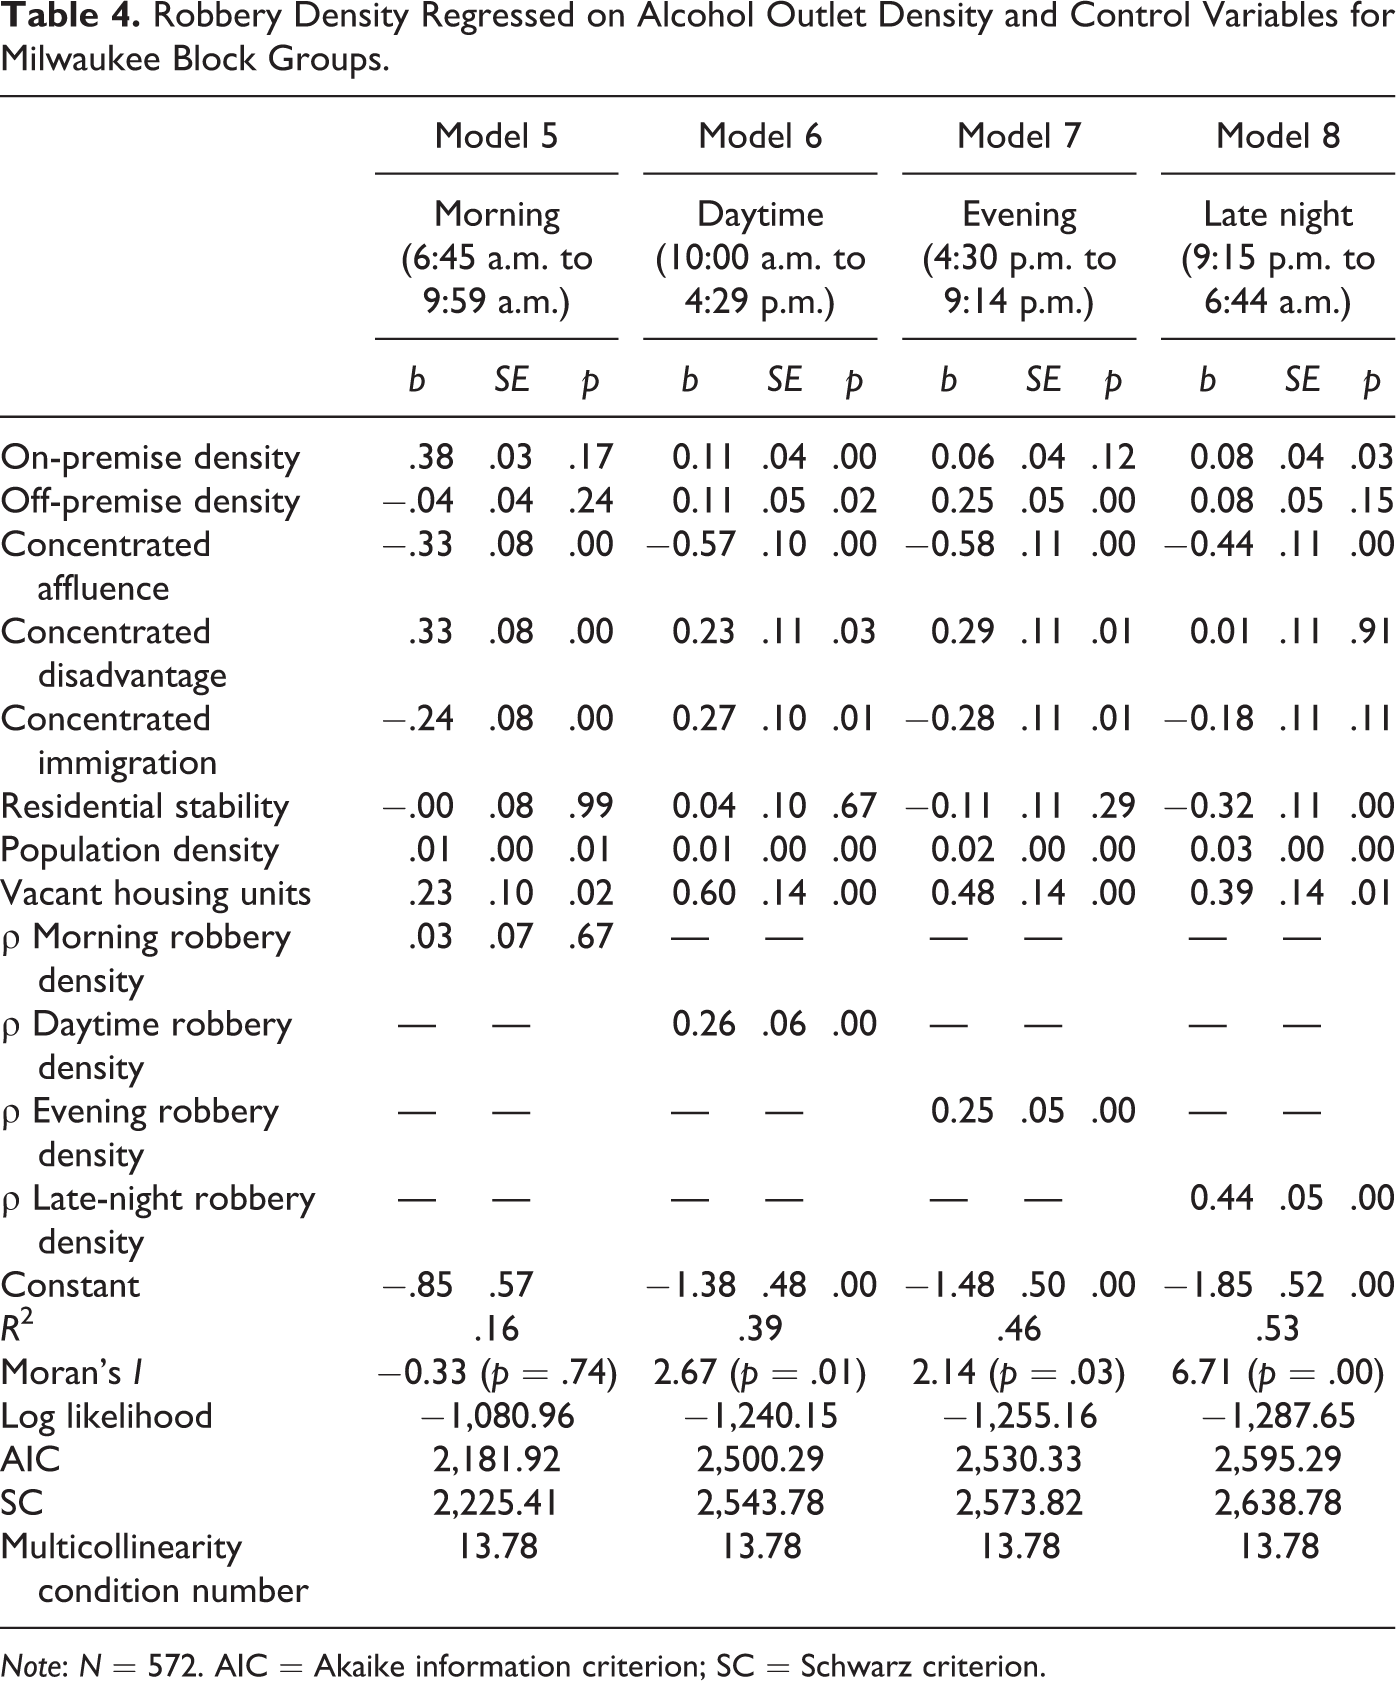
Note: N = 572. AIC = Akaike information criterion; SC = Schwarz criterion.
While the association between on-premise outlets and daytime robberies was unexpected, the association may be explained by the opportunity for robbery victimization provided by a flow of patrons to the area. As expected, the association between on-premises and late-night robberies was significant, suggesting that on-premises may be crime attractors at late-night hours when patrons travel away from the places that provide capable guardians. As expected, the association between off-premises and daytime robberies, and between off-premises and evening robberies, may be understood through the context of operating hours when patrons visit off-premise establishments to purchase alcohol.
To better understand the relationship between alcohol and violence, Figures 1 and 2 include maps for all the models estimated above to show where this relationship is most apparent. Figure 1 shows regression residual maps for morning, daytime, evening, and late-night assaults, classified according to the standard deviation classification method. Figure 2 shows regression residual maps for morning, daytime, evening, and late-night robberies, similarly classified. These maps are color coded with red areas indicating locations where the observed values are larger than the expected values. While a visual inspection of the residuals map may suggest a presence of clusters of higher than expected assaults and robberies, formal tests for spatial clustering of the residuals suggest a lack of global spatial autocorrelation. In fact, formal tests for autocorrelation in residuals were carried out, and the resulting Moran’s I values suggest that over predictions (negative residuals or blue areas) and under predictions (positive residuals or red areas) were randomly distributed for assault models 1–4 (Moran’s I = −.01, p = .43; Moran’s I = −.01, p = .65; Moran’s I = −.02, p = .28; and Moran’s I = −.01, p = .51, for morning, daytime, evening, and late-night assaults, respectively). Figure 2 shows residual map for robberies, and as with assaults residuals, formal tests for spatial clustering suggest that robbery residuals were similarly randomly distributed for robbery models 5–8 (Moran’s I = −.00, p = .83; Moran’s I = .01, p = .37; Moran’s I = −.00, p = .92; and Moran’s I = .02, p = .15, for morning, daytime, evening, and late-night robberies, respectively). In other words, the lack of autocorrelation in the residuals suggests a lack of clustering of the residuals and confirms that the models estimated in this study were appropriately specified. The regression residual maps seem to indicate random pattern, as the residuals appear to be neither uniformly nor spatially distributed.
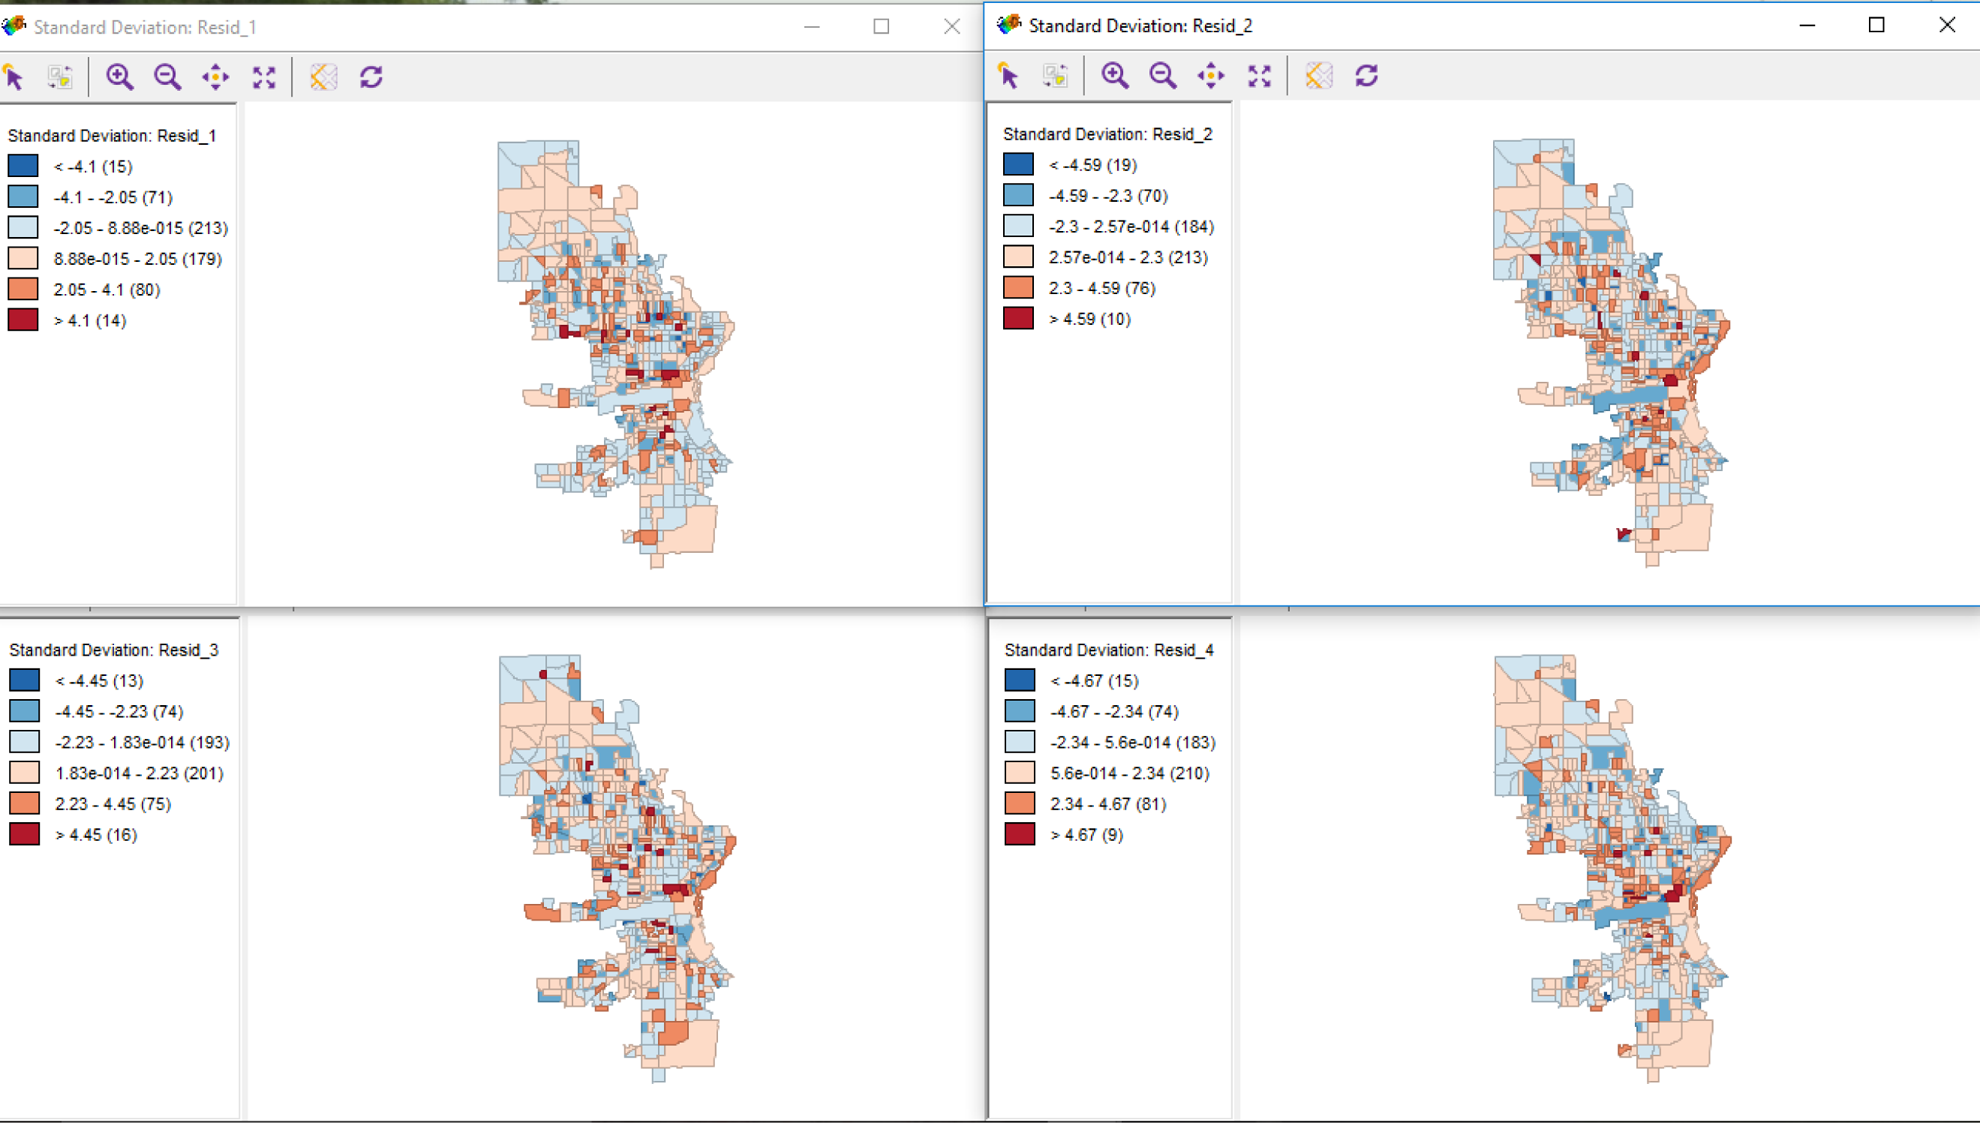
Residual map for models 1–4 for Milwaukee census block groups (N = 572).
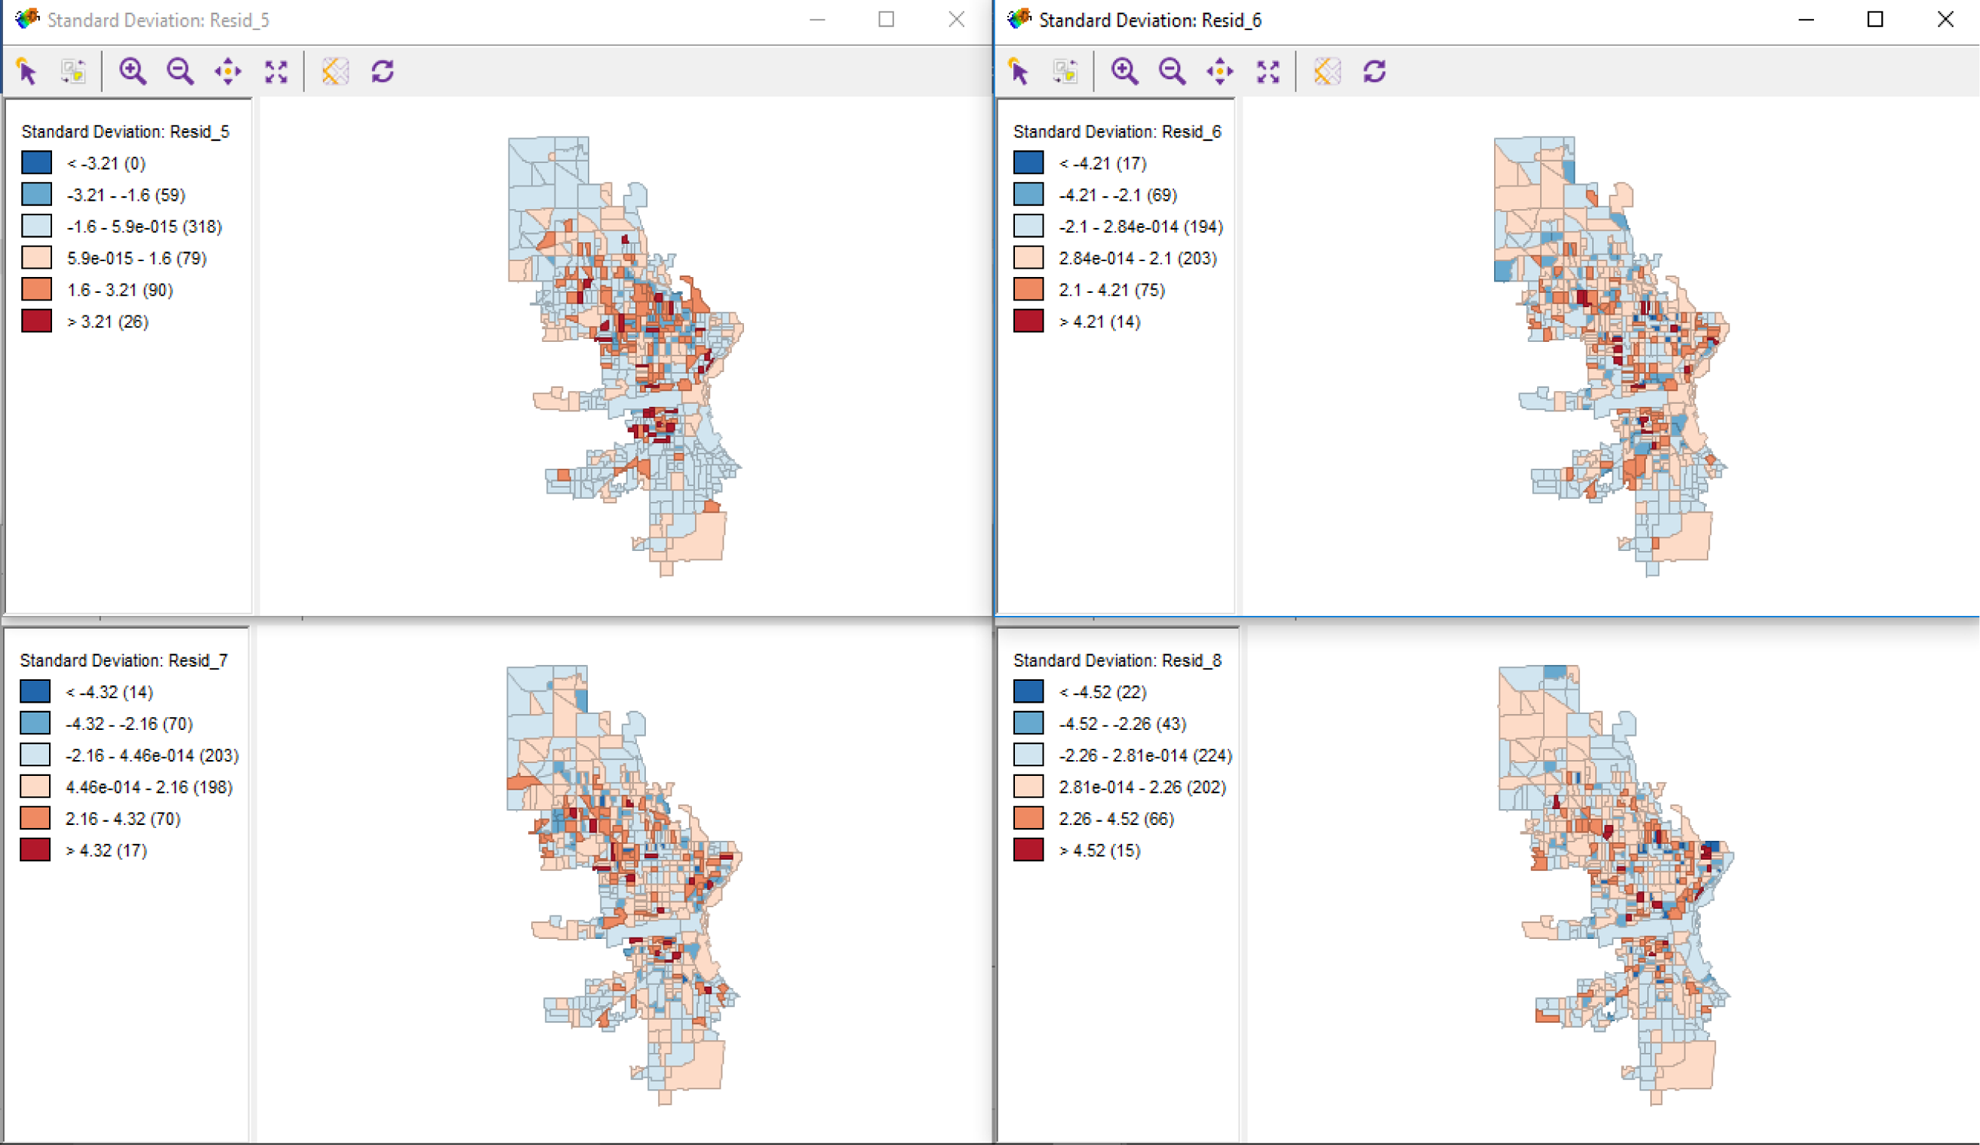
Residual map for models 5–8 for Milwaukee census block groups (N = 572).
Additionally, in the absence of global autocorrelation as indicated by the global Moran’s I, local indicators of spatial autocorrelation (LISA) tests were estimated to identify whether spatial autocorrelation was evident in smaller areas. Figure 3 shows LISA clusters for assaults residuals (specified using randomization with 999 permutations and 0.01 significance filter), and Figure 4 shows LISA clusters for robbery residuals, similarly specified as Figure 3 clusters. High–high locations and low–low locations (i.e., positive local spatial autocorrelation) are identified as spatial clusters, and the high–low locations and low–high locations (i.e., negative local spatial autocorrelation) are identified as spatial outliers (Anselin 2004). Spatial clusters are identified based on their similarity to their neighbors beyond what we would expect to occur due to random spatial chance (Anselin 2004). In Figure 3, there were four high–high clusters for morning assaults, most of them located near city center or near south side. For daytime assaults, there were six high–high clusters, one located in city center and several on the near south side. For evening assaults, two high–high clusters were evident south of the city, and for late-night assaults, one cluster was found south of the city and two were found on the near west side. In these small areas, these high–high clusters aid in identifying the areas where clustering of higher than expected assaults was evident in the areas that border those with similarly higher than expected assaults.

Local indicator of spatial autocorrelation cluster map for models 1–4 for Milwaukee census block groups (N = 572).
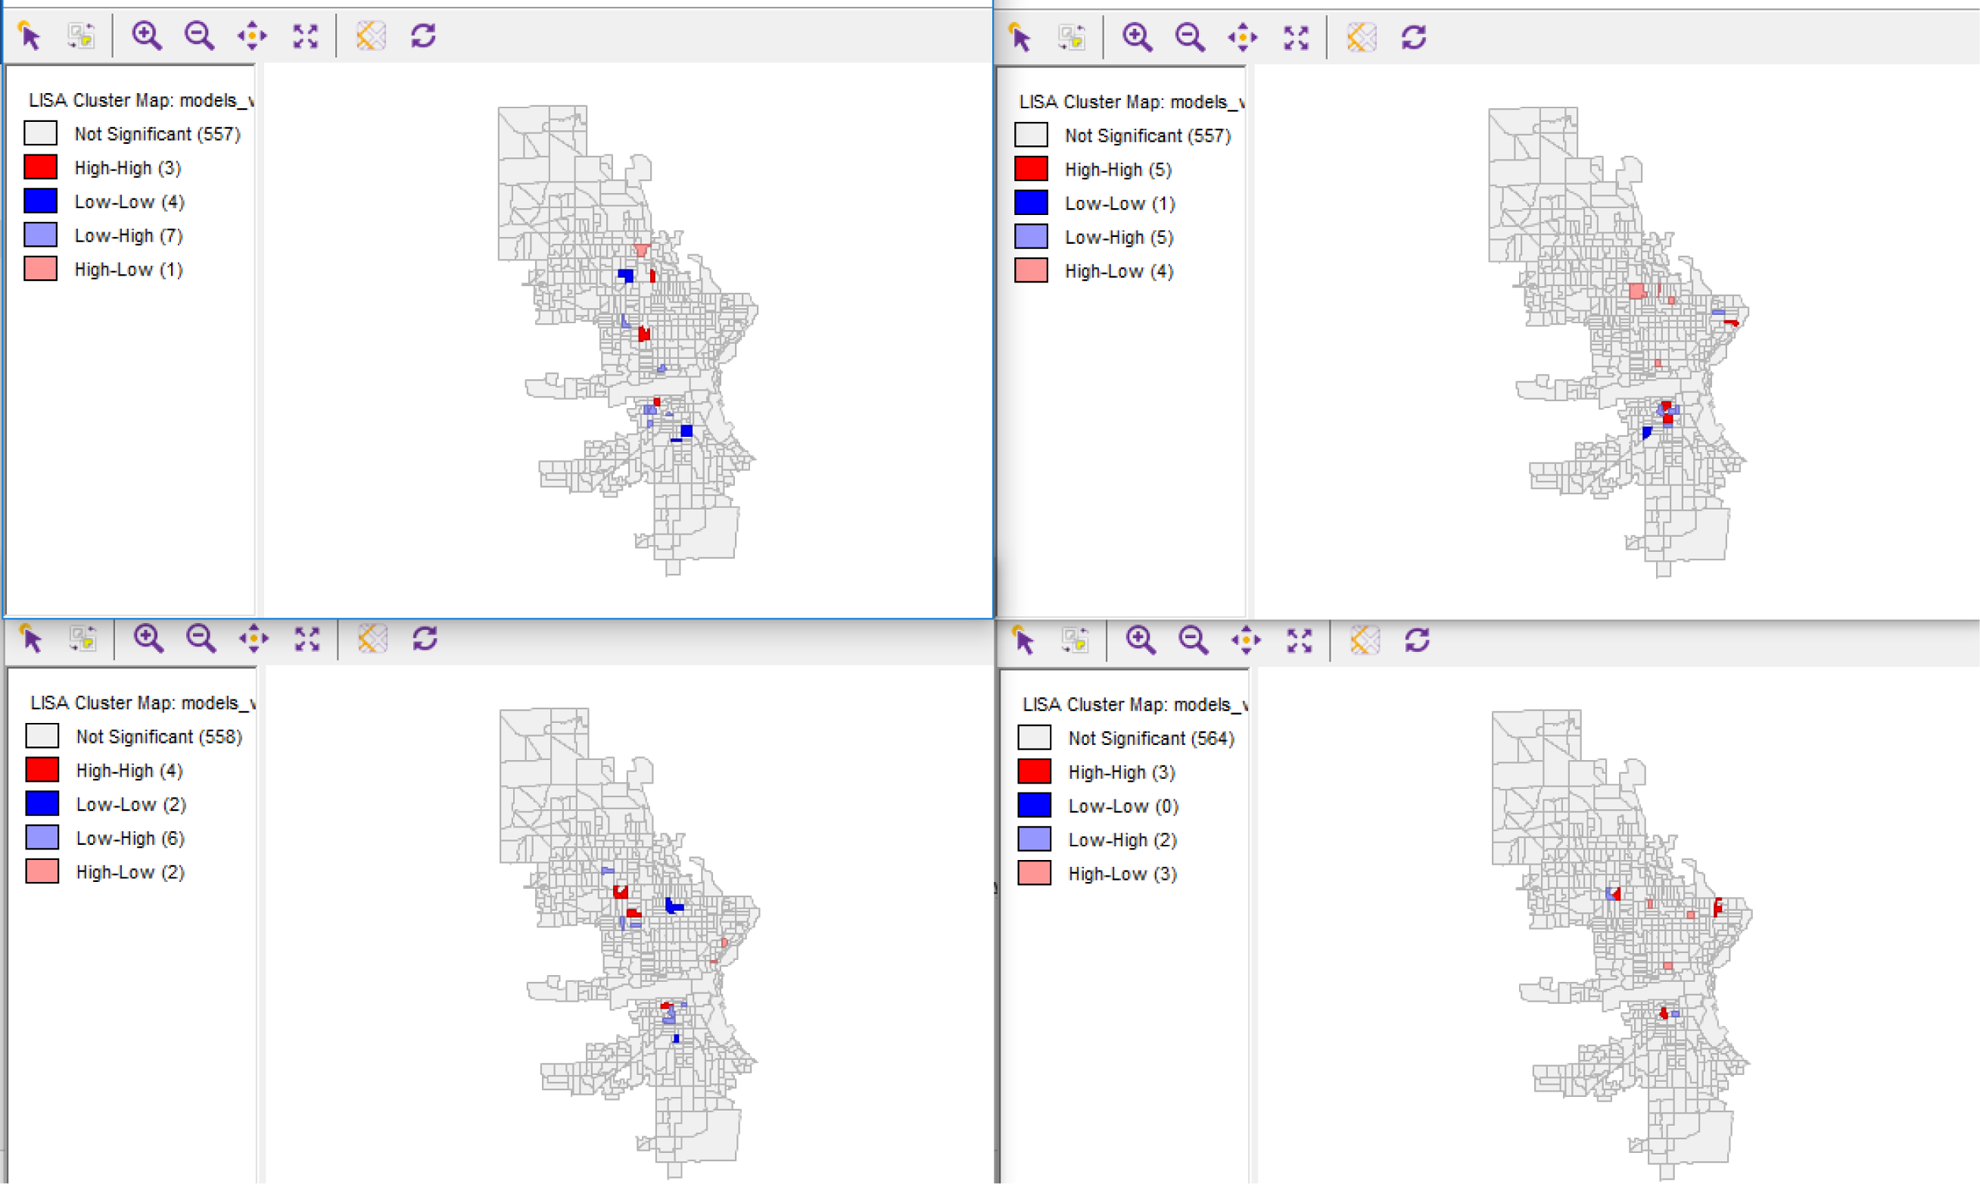
Local indicator of spatial autocorrelation cluster map for models 5–8 for Milwaukee census block groups (N = 572).
Like the LISA assault clusters evident on the near south side, Figure 4 shows that robbery was also clustered in the same general areas. High–high morning robbery clusters were evident on the near south side and west of the city. In addition, several high–high daytime robbery clusters were found on the south side and on the upper east side. One high–high evening robbery cluster was evident on the south side, and three high–high evening robbery clusters were found on the west side. Lastly, several late-night robbery clusters were found on the upper east side, south of the city center, and west of the city center. High–high robbery clusters have higher values of observed robberies than expected robberies, and such areas also border the areas with similarly higher than expected robberies.
In sum, while the standardized residual maps shown in Figures 1 and 2 suggest that the model residuals were randomly distributed across the units of analysis, LISA maps shown in Figures 3 and 4 suggest that clustering of assaults and robberies was evident when examined at a smaller scale. For assaults, positive clustering was found on the near south side, city center, and the near west side, while for robberies, positive clustering was evident on the near south side, upper east side, and the west side.
Discussion and Conclusions
This study provides a more nuanced understanding of the association between alcohol availability and violence. It does so by examining whether the alcohol outlet density (i.e., on- and off-premise) association with violent crimes (i.e., assault and robbery) varies across time of day (i.e., morning, daytime, evening, and late night) and whether the associations are similar for different violent crime types.
The findings of this study suggest that the alcohol–violence associations vary across time of day and across crime types. With the exception of the consistent relationship found between off-premise outlets and evening assaults and robberies, it seems on- and off-premise alcohol outlets play a unique role across the four temporal periods and across the two crime types. For example, when considering the findings across all eight models for on-premise outlets, on-premise outlets are not associated with daytime assaults, but they appear to be significantly associated with daytime robberies. Additionally, it appears these outlets play a protective role for evening assaults but have no impact on evening robberies. Lastly, on-premise outlets are not associated with late-night assaults but seem to play a significant role for late-night robberies. The temporal associations between the off-premise outlets and the two violent crime types are also different. Off-premise outlets do not have a significant role in morning and daytime assaults, but they are important predictors of daytime robberies. Additionally, while off-premise outlets are important predictors of late-night assaults, it seems they do not matter for late-night robberies. When considering the occurrence of the assaults and robberies from a global perspective, the maps shown in Figures 1 and 2 suggest that model residuals were not spatially clustered. However, when considering maps shown in Figures 3 and 4, there seems to be some evidence of positive clustering evident in some parts of the city. It appears that for both types of crimes, areas that experienced higher than expected assaults and robberies also bordered areas with similarly higher than expected levels of crime. The evidence for clustering was particularly evident on the near south side, near west side, and downtown for assaults; east side, west side, and near south side for robberies.
The differences in the associations of on- and off-premise alcohol outlets with different outcomes are consistent with the findings of prior studies (Livingston 2011; Snowden and Pridemore 2013). It was expected the association would exist between late-night assaults and on-premise outlets (Brower and Carroll 2007; Cusimano et al. 2010; Nelson, Bromley, and Thomas 2001), explained by the closing hours of the outlets when many patrons may be vulnerable targets (Cohen and Felson 1979), but expectation was not met. It seems that rather than contributing to late-night assaults, on-premise alcohol outlets contribute to late-night robberies, instead. This finding provides an important contribution to the alcohol–violence literature that often examines other forms of violence (i.e., injuries, hospitalizations, and assaults) and less frequently investigates robberies as a violent outcome.
As a recent review suggested (Holmes et al. 2014), a better understanding is necessary about how the temporal availability of alcohol results in harm. The results of this study provide preliminary indication that temporal associations between alcohol outlets and violent crimes vary. These associations may be understood through the guardianship aspects (Cohen and Felson 1979) and the operating hours of the outlets (Popova et al. 2009; Rossow and Norstrom 2012). This is especially evident for the off-premise outlet associations with daytime and evening robberies, during a time when these places are open for trade and provide available targets for robbery victimization. Additionally, off-premise outlets may serve as a social gathering spot but less well guarded relative to on-premise outlets. As such, off-premise outlets may be places where the gathering of people in general could explain the associations presented here. Future studies of alcohol–violence should focus on such outlet-level characteristics and examine whether and how operating hours (Popova et al. 2009; Rossow and Norstrom 2012) and the use of space both in and around these outlets can inform the differences in the spatiotemporal associations. Additionally, future studies of spatiotemporal associations between alcohol availability and violence should examine the relationship of alcohol and violence over space and time simultaneously (Tabb, Ballester, and Grubesic 2016; Waller et al. 2007) to provide a simultaneous impact of space and time on crime patterns.
This study has a few limitations. First, given the cross-sectional ecological approach of this study, the causal mechanism driving the associations is not clear (Gmel, Holmes, and Studer 2016). Second, the outlet data are collected by the Wisconsin Department of Revenue and limited by the aggregated attributes of alcohol outlets. Therefore, this study cannot speak to the associations that subtypes of alcohol outlets (i.e., bars, pubs, liquor stores, etc.) have with these types of violent crimes. Third, the nature of the surrounding environment in which these alcohol outlets operate may influence violence, and land use patterns can provide an additional information about these associations (Pridemore and Grubesic 2012). Nonetheless, this study was carefully designed to fill important gaps in our theoretical and practical understanding of the role that alcohol plays in violence by investigating whether this association varies across time of day and across violent crime types. This detailed understanding is necessary for designing and carefully implementing alcohol policies tailored to reduce alcohol-related harm.
Footnotes
Declaration of Conflicting Interests
The author(s) declared no potential conflicts of interest with respect to the research, authorship, and/or publication of this article.
Funding
The author(s) received no financial support for the research, authorship, and/or publication of this article.