
Abstract
The literature on firm location selection allows us to retrospectively explain why firms did locate in particular places. However, it remains challenging to prospectively predict where they will locate. In this article, we propose a simple conceptual model of firm location decisions, then operationalize it using the ordinal stochastic degree sequence model (oSDSM). We use this model to predict whether 104 advanced producer service firms will expand, contract, or maintain their presence in each of 525 cities, and find that these predictions are accurate in more than 86 percent of cases. We conclude with suggestions for further refinement of this model.
Keywords
Understanding how firms decide where to locate, and later when and where to expand or contract, has been a central focus of economic geography. As a result, a vast literature has developed that has been synthesized by numerous theoretical and empirical reviews (e.g., Bhutta 2004; Blair and Premus 1987; Brown 1979; Buss 2001; Devereux and Griffith 2002; Melo, Nickle, and Saldanha-da-Gama 2009; Owen and Daskin 1998; Snyder 2006). Contemporary studies of firms’ location decisions often focus on pinpointing the effect of ever-narrower factors (e.g., Barkley and McNamara 1994; Barrios, Görg, and Strobl 2006; Cader, Crespi, and Leatherman 2011; Elgar and Miller 2010). From these reviews and highly targeted empirical studies, we now know a great deal about a wide range of factors that influence location decisions, including taxation, labor markets, accessibility, amenities, and agglomeration economies. However, although this work has provided us a nuanced portrait of the many parts of the location decision process, we still lack a practical way to integrate these insights into a single framework for making predictions about when and where firms will expand or contract their presence in the future. That is, although we can retrospectively explain why firms did locate in particular places, it remains challenging to prospectively predict where they will locate (Longhi et al. 2005; Shmueli 2010). Moreover, much of the past work has focused on firms in general or on firms in a particular region, while we know less about the firm location process in the particular case of advanced producer service firms, which now play a critical role in coordinating global economic activity.
To facilitate this move from explanation to prediction, and provide a better understanding of advanced producer firm location, we draw on the existing literature to propose a very simple conceptual model in which location decisions are driven by two factors: the firm’s capacity to expand and the location’s capacity to attract. This model aims to capture what might seem obvious: firm expansions are most likely to occur (a) for firms with a high capacity for expansion and (b) in locations with a high capacity to attract firms. We then adapt the ordinal stochastic degree sequence model (oSDSM; Neal 2014, 2017; van Meeteren, Neal, and Derudder 2016) from the network science literature to operationalize this model and use it to make predictions about whether each of the 104 advanced producer service firms will maintain, expand, or contract its presence in each of the 525 cities between 2010 and 2016. Using only information about the locations of these firms in 2010, the model’s predictions are accurate in about 86 percent of cases. The simplicity and modest input data requirements of the model identify a promising new avenue for prediction of firms’ future behavior, while the model itself provides some clues about the forces that shape where firms choose to expand or contract their presence.
This article is organized in four sections. In the first section, we begin by reviewing the literature on the internationalization and geographical dynamics of service firms. Building on these ideas, we then sketch our simplified model, which reduces the location decision to issues of firm and location capacity, and briefly consider the distinction between explanatory and predictive models. In the second section, we describe the Globalization and World Cities (GaWC) data, which capture the office sizes of 175 advanced producer service firms in each of the 525 cities around the world in 2010 and in 707 cities in 2016. We then employ an adaptation of the oSDSM to predict changes in these firms’ office sizes from 2010 to 2016. In the third section, we report metrics of the accuracy of the model’s predictions and examine the location and severity of prediction errors. We conclude, in the fourth section, with a discussion of the model’s limitations and directions for its future development.
How and Why Do Service Firms Internationalize?
The economic geography literature has a long-standing interest in the globalization of producer services firms. The relevance of this body of research is broadly premised on the observation that the sector has been expanding in both scale and scope. Importantly, this expansion also implies that the geographical reach of producer services firms has been growing fast (e.g., Henderson and Alderson 2016). In this section, we discuss the major tenets of the economic geography literature dealing with the globalization of the producer services sector, as this provides the background for the model developed in this article. We begin with a review of the major forces behind the expansion of the sector, and how this has led to a sector in which firms pursue an office network strategy combining a “global” presence with intensely “local” knowledge, then review previous research on the location dynamics of globalizing producer services firms. We conclude the section by describing a proposed conceptual model of producer services firm location decisions that integrates these past ideas.
The Expansion of the Producer Services Sector
What are now called producer services firms needed to interact across borders long before the emergence of contemporary globalization. In the mid-twentieth century, for instance, international monetary transactions commonly required financial institutions in different parts of the world to work together: banks would recommend their clients to use their correspondent banks, “favored” partners in other countries, a practice that remains important in parts of the world that are less integrated in the global economy (Alwazir et al. 2017). Such practices commonly consist of a series of ad hoc arrangements brought into play as necessary.
In addition to a number of wide-ranging innovations in the technological domain (e.g., the information technology revolution) and changes in regulatory arrangements (e.g., the General Agreement on Trade in Services agreement that went into force in 1995), economic globalization processes have undermined the viability of such ad hoc arrangements in three fundamental ways. First, the globalization of their major clients’ business meant that producer services firms had to follow suit (Aharoni and Nachum 2000). Obviously, a major multinational corporation would not want to deal with, say, a different accountancy firm in every country it does business in. For example, over the past years, we have increasingly seen the explicit exploitation by multinationals of globalized accountancy, management consultancy, and law firms to engineer transnational solutions to the capital draining “problem” of taxes (Engelen 2012; Wójcik 2013).
Second, as service firms moved from mainly following their clients across the world to developing their own global strategies to win new business, they became concerned to protect their brand integrity. The old ad hoc arrangements provided no guarantee that clients would be serviced at a level and in the ways expected in the home market. Providing a direct service under the same flag allowed for quality control for the service firm and offered a seamless service for the client (Faulconbridge, Muzio, and Cook 2012), thus further facilitating the purposeful globalization strategies of producer services firms. Third, and closely related to the two previous points, the globalization of the sector itself has set in motion a self-propelling dynamic: expansion allowed for the development of further advantages of economies of scale and scope. As Yeung (2005) points out, for service firms, a global presence may itself lead to the creation of new opportunities for profitability because of bigger markets and the potential for diversification that comes with those bigger markets. Indeed, although perhaps not as visible as geographical expansion per se, the growth and creation of new product markets has been instrumental for the rise of the sector in general and the size of leading firms in particular (Ward 2004). Arguably the most visible example of this expansion is the emergence of “the big four” (Ernst and Young, Deloitte, PwC, and KPMG): four professional services networks offering worldwide auditing and taxation consultancy as well as progressively more diverse advice on actuarial, corporate finance, and legal matters. As a result of these entwined processes, an increasingly large number of producer service firms have globalized to provide the financial, professional, and creative means to facilitate economic agents in their global pursuits. These activities range from resourcing and redirecting capital, to legally navigating multiple jurisdictions, to adapting global marketing strategies to local contexts. For example, Beaverstock (2004) shows how legal firms expatriate staff to export English Common Law to their international offices but simultaneously employ the services of “local” staff to practice local jurisdiction law. Phelps and Woods (2017), in turn, use the case of site selection consultants to interpret this particular example of service provision as mediating between a demand for locations emanating from multinational corporations and a supply of locations provided by national and subnational territories. They illustrate how this intermediary role extends beyond economizing on search costs and into the market-creating and value-adding opportunities offered by location, and show how the knowledge mobilized by consultants is quintessentially geographical in that it is at the intersection of the global mobility of economic activities and its local implementation.
An important aspect of the literature on producer services has been to highlight the increasing diversity of the sector. On one level, this simply entails recognizing the diversity of what the sector “does,” which ranges from more traditional forms of servicing such as legal advice (Henderson and Alderson 2016) and real estate investment (Lizieri and Pain 2014) to newer forms of services such as the organization of staffing (Ward 2004) and site selection consultancy (Phelps and Woods 2017), to the bespoke servicing of specific branches of the global economy as in the case of maritime producer services (Jacobs, Koster, and Hall 2011). In addition, and as mentioned above, leading service firms such as “the big four” have developed service portfolios that straddle or even defy sectoral boundaries within the producer services sector (Smith 2014).
However, above all, this recognition of increased intrasectoral diversity and complexity serves to highlight an associated intricacy in the nature of the organization and expansion of firms as they globalize. Drawing on in-depth research on the organizational strategies of firms in investment banking and management consultancy, Jones (2005) argues that the straightforward interpretation of the emergence of “global service firms” may be epistemologically misguided, as it is unable to adequately capture the complex nature of connectivity and spatiality developing in and between service firms. This has led to a body of research explicitly exploring this complexity. For example, based on a review of previous research on the globalization of law firms, Faulconbridge, Hall, and Beaverstock (2008) note that firms use combinations of “organic” office openings, mergers and acquisitions, and alliances. This then leads to different types of integration and spatial economies in the office networks of service firms, which in turn depend on corporate culture and the nature of the new market in question. Returning to the example of the expatriation of staff discussed in Beaverstock (2004), it was also found that expatriation is not homogenous for every region of the globe. In East Asia, expatriation was characterized by one-way knowledge diffusion from London and a demarcation of labor where expatriates manage offices, departments, and teams. In contrast, expatriation in Europe and North America was developed and diffused in a network of relationships. Here, expatriates worked with locally qualified partners and lawyers, and expatriates of other nationalities, in an environment where locals, expatriates of other nationalities, and British-qualified staff manage, held partnerships and lead teams. Thus, the notion of a “firm network” is in practice often associated with very different levels and types of corporate integration.
However, in spite of these substantial geographical and organizational differences, it is clear that producer services firms are now constantly looking for the “right” balance between a “global” presence and “local” knowledge for navigating regulatory structures and markets. The end result is an extensive and inherently dynamic office network centered on what firms deem to be the best locations for organizing and carrying out their business. The purpose of this article is to enhance our understanding of this dynamism, and our ability to make predictions about its consequences.
Before moving to the discussion of previous research specifically dealing with the shifting geographies of producer services firms’ office networks, however, it is also important to note that although much of the literature identifies and focuses on the (geographical) expansion of these firms, there is in practice a more complex dynamic that also includes contraction. In addition to crisis-induced cutbacks as detailed in Derudder, Hoyler, and Taylor (2011), more dramatic and idiosyncratic examples include the contraction of the Arthur Andersen network in the wake of the Enron scandal. Although its role in Enron’s demise theoretically left Arthur Andersen free to resume operations, the damage to the brand name was so severe that a combination of a dramatically scaled-down presence restricted to Chicago, the development of new and dramatically smaller companies, and fractional acquisitions by other consulting firms replaced the Arthur Andersen office network. The net result was a smaller and less integrated set of offices than before, reducing “the big five” to “the big four.” Overall, the observed geographical expansion of the office networks of producer services firms (cf., Derudder and Taylor 2016) is therefore best thought of as the net result of simultaneous processes of growth and contraction across cities and firms.
The Geographical Dynamics of Producer Services Firms
Previous research on the geographical dynamics of producer services firms has made use of both qualitative and quantitative research methods to comprehend these dynamics. Qualitative research methods produce in-depth insight into the how and why of the expansion of service firms. For example, drawing on interviews conducted in the European executive search industry, Beaverstock, Faulconbridge, and Hall (2010) reveal how firms and professional associations have combined cultural- and political-economic strategies of professionalization to legitimize the internationalization of the industry. They show how the success of these approaches is determined by the degree to which geographical variability exists in the use of cultural- and political-economic market production and legitimation tactics.
Previous quantitative research has identified various demand- and supply-side influences on the attraction of globalizing producer services firms to specific cities. Although not focusing on the dynamics of the industry per se, cross-sectional research gives insight into some of these influences. For example, zooming in on the case of maritime producer services sector, Jacobs, Koster, and Hall (2011) find that the presence of global service firms in this sector is correlated with maritime localization economies as expressed in the presence of shipowners and port-related industry rather than with the volume of throughput of ports.
Quantitative analysis of the dynamics of office networks should ideally be based on a full-fledged longitudinal framework. However, such research remains rare. A notable exception is the work of Jacobs, Koster, and van Oort (2014), who, echoing Wood’s (1991, 162) observation that “the essential quality of business services firms is (…) the close integration of the expertise they offer with the operational activities, and in-house support services of customer organizations,” test the hypothesis that producer services firms shift their locations to be proximate to the multinational corporations they serve. Focusing on the case of Amsterdam, they find that proximity to multinational corporations is indeed steering the location of producer services firms. Analyzing the fast-expanding office networks of US law firms in foreign markets in the wake of the global financial crisis, Henderson and Alderson (2016) interpret these changes by discussing three intertwined patterns of spatial change: firms (i) following the geographic expansion of their clients, thereby relying on (ii) traditional agglomeration economies as well as on (iii) agglomeration benefits emerging from a location’s connectivity to other important geographies.
Henderson and Alderson’s (2016) paper is rare in that it demonstrates how a combination of longitudinal analysis on the one hand, and network analysis and a relational approach to the organization of globalizing firms on the other hand, can yield insights into the geographical dynamics of the producer services sector. The relative absence of such analytical frameworks can be traced in part to the consecutive “turns” in economic geography, which have lead parts of economic geography away from quantification. Recent progress in longitudinal analysis allows broadening the scope of research, but at the same time, many of these approaches suffer from methodological complexity and associated interpretation problems. For example, using a stochastic actor-based modeling framework to analyze the coevolution of globalized service firms and the supply of air travel connections, Liu, Derudder, and Gago Farcia (2013) reveal the importance of (1) exogenous effects such as the impact of economic development and regional dimensions, (2) endogenous microlevel effects such as triadic closure and preferential attachment processes, and (3) the two-way impact between both networks. However, with the exception of the straightforward interpretation of the exogenous control variables, many of these findings are hard to interpret in formative terms. Therefore, in this article, we develop a conceptually simple model that does not require substantial exogenous data and does not yield difficult-to-interpret coefficients, and ask whether it can make useful predictions that capture the geographical dynamics observed in the office networks of producer services firms.
A Simplified Model
As this review illustrates, a number of factors play a role in the internationalization of advanced producer services. However, at its core, such firms’ decisions about when and where to locate can be viewed as a kind of allocation problem: there is a supply of locations (i.e., cities) where firms may choose to operate an office, and firms demand locations to conduct their activity. Under ideal circumstances, firms seek to locate in the optimal location(s), making the location selection process a game of matching the right firms to the right locations (Nakamura 2018). Viewed in this simplified way, the vast majority of factors identified by past studies of multinational firm locations (e.g., Barrios, Görg, and Strobl 2006; Cader, Crespi, and Leatherman 2011) and of firm managers’ location decision process (e.g., Barkley and McNamara 1994; Elgar and Miller 2010) can be grouped under two broad headings: firm factors and location factors.
Firm factors include the complete bundle of factors that make firms able or willing to expand (i.e., to operate in new locations or enlarge operations in existing locations) or that make it necessary for firms to contract (i.e., to reduce or cease operation existing locations; Baumol 1962; Corman, Lussier, and Nolan 1996). For example, a firm’s size, age, and current growth rate all play an important role: a large, established, or growing firm may be more capable of expansion than a small, new, or shrinking firm. Similarly, a firm’s sector or technology is important: a firm operating in a sector that is growing, or that uses a technology that is in demand, may be more capable of expansion than a firm operating in a declining sector or using an obsolete technology (Mitchell and Singh 1992). The style of leadership in a particular firm may also play a role: firms led by executives with an aggressive management style may be more likely to pursue expansion than those led by executives with a conservative or risk-averse management style (Fuxiua et al. 2009). Moreover, although general theories of firm expansion exist (e.g., Baumol 1962), specific segments of the advanced producer services sector such as law firms may be guided by different expansion trajectories (Daniels 1993). Without seeking to enumerate and distinguish particular firm factors, we treat the combined set of firm-specific factors influencing firm location decisions as firm capacity. Firms differ in their capacity to expand, and those with greater capacity to expand are more likely to do so.
Location factors include the complete bundle of factors that make locations able to attract firms (i.e., that offer resources attractive to firms seeking to open new, or enlarge existing, locations). Past research has provided a long list of potential location factors that include tax incentives, labor markets, transportation accessibility, residential amenities, and the presence of other firms that support the formation of agglomeration economies and offer spillover benefits (Bhutta 2004; Blair and Premus 1987; Brown 1979; Buss 2001; Devereux and Griffith 2002; Melo, Nickle, and Saldanha-da-Gama 2009; Owen and Daskin 1998; Snyder 2006). Again, without seeking to enumerate and distinguish particular location factors, we treat the combined set of location-specific factors influencing firm location decisions as location capacity. Locations differ in their capacity to attract firms, and those with greater capacity to attract are more likely to do so.
In this simplified conceptual model of location selection, the size of a given firm’s optimal presence in a given location is a joint function of the firm’s capacity and the location’s capacity (Nakamura 2018). At one extreme, the largest offices are expected to be maintained by the firms with the greatest capacity, in the locations with the greatest capacity: big firms aim to operate their biggest offices in the most attractive cities. Conversely, at the opposite extreme, the smallest offices or a complete lack of presence is expected to occur for firms with the least capacity, in locations with the least capacity: small firms aim to avoid operating in the least attractive cities. More generally, this conceptual model aims to make predictions about firm locations decisions by identifying firms’ oversized and undersized presence in specific locations, given the firm’s and the location’s capacities, driven by the hypothesis that firms will avoid being oversized or undersized and seek to be optimally sized. Accordingly, it models firm location as a Markov process in which predictions about firms’ future locations depend only on the present state of the system (i.e., firms’ and locations’ present capacities) and not on historical states of the system or factors exogenous to the system.
As a result, this model omits a broad range of historical and exogenous reasons that a firm’s presence in a location may deviate from what is optimal (Nakamura 2018). For example, the forces of path dependence and lock in may lead a small firm to maintain an inappropriately large presence in a relatively unattractive location simply because it was founded there. Similarly, the forces of inertia may lead a large firm to maintain an inappropriately small presence in an attractive location because it has been slow to recognize the potential for growth. In the former case, this conceptual model would predict that the firm will contract its presence, while in the latter case that the firm will expand its presence, but in practice, these predictions may not be borne out. Our evaluation of the model’s predictive accuracy below offers an opportunity to examine the severity of error introduced by omitting such considerations.
Explanation or Prediction
The conceptual model we outline above, and formally operationalize in the next section, is intended to be predictive but not explanatory, which Shmueli (2010) observes is an important but frequently conflated distinction. The majority of models in geography and other social sciences are explanatory: they aim to provide evidence for a causal theory that explains why or how an outcome occurs. In the context of firm location, explanatory models aim to explain why firms are located where they are or why they change their locations over time. The model proposed here is not explanatory because it is not designed to test a causal theory about why or how observed firm locations occur; application of the model will not provide us insight into the causal mechanisms that lead firms to locate in some places but not others.
In predictive models, the goal is not to explain why an outcome happens but instead to use “observations until time t (the input)…to forecast future values at time t + k” (Shmueli 2010, 291). In this case, the proposed model uses observations of firms’ locations and sizes at one time to predict their locations and sizes at an unspecified future time. For the sake of assessing the accuracy of these predictions, in the next section, we apply the model retrospectively, where t = 2010 and k = 6. But, pending a demonstration of the model’s predictive accuracy, in practice, it would be applied to contemporary data (e.g., t = present) to make predictions about the future (i.e., k > 0). Although such a predictive model does not directly advance our ability to explain why or how firm locations happen, it is nonetheless useful for several reasons. First, as Shmueli (2010) observes, “prediction [is] a necessary scientific endeavor…for the purpose of developing and testing theories” because it “enables assessing the distance between theory and practice, thereby serving as a reality check to the relevance of theories” (p. 292). Second, in the specific case of this model and these data, it provides a formal approach to considering the world city network’s possible future structure, which can guide the research agenda in this field. Finally, accurate predictions about future firm locations can be useful for economic development professionals to identify windows of opportunity to retain firms predicted to exit, or to recruit firms predicted to enter, a given market.
Method
The GaWC Data
The GaWC data, gathered for the first time in 2000, detail the (importance of the) presences of producer services firms in cities across the world. The data collection approach is explained in detail in Taylor and Derudder (2016), and data generated using this approach have been widely used in research on globalization and world cities (e.g., Neal 2012, 2017; Taylor et al. 2014; Taylor and Derudder 2016). Here, we briefly summarize the process employed when these data were collected in 2010 and 2016, which we analyze below.
In 2016, information was collected on the location strategies of 175 firms: 75 financial services firms, 25 management consultancy firms, 25 advertising firms, 25 law firms, and 25 accountancy firms. Firms were selected based on sectoral rankings for 2016, which tended to be based upon 2015 data. We selected financial services firms from Brand Finance’s Top 500 financial services and insurance companies, which is based on a benchmark study of the strength, risk, and future potential of financial services firms; accountancy firms were chosen from World Accounting Intelligence’s ranking, which is based on an analysis of aggregated company revenues; advertising agencies were selected based on Brandirectory’s analysis of the valuable brands in the advertising sector; law firms were selected based on Chambers’ ranking of leading corporate law firms; and management consultancy firms were selected from Vault Management and Strategy Consulting’s Survey, which ranks firms in terms of their “prestige” based on a large survey of professionals. The 2010 selection of firms followed a similar approach.
In 2016, location strategies were recorded across 707 cities. This selection was based on a number of overlapping criteria. In addition to the cities that featured in earlier data gatherings and publications in the world city literature, we included all cities with a population of more than 1.5 million inhabitants in 2015. Previous data gatherings featured all capital cities of states with a population of more than 1 million, every city with a headquarter office of one of our selected firms, and a broad range of cities that featured in our earlier research on “world cities.” The 2010 selection of cities featured 525 cities, all of which were included in the 2016 data.
A putative “global presence”—no matter how uneven it is in practice—has become an integral part of the leading firms’ public marketing and recruitment policies (e.g., Beaverstock, Faulconbridge, and Hall 2010). Hence, among producer service firms, locational strategy is quite transparent. The corporate websites of these firms therefore customarily showcase the geographical range of the services on offer, which we exploit for data collection. For each firm–city pair, two types of information were collected. First, information about the size of a firm’s presence in a city is obtained, ranging from the number of offices the firm has in a city for accountancy/financial services firms to the areas of expertise for law firms. Second, the extralocational functions of a firm’s office (e.g., headquarter functions) in a city are recorded. This information was then used to assign each firm–city pair a standardized service value (Sfc ) on a 0–4 scale. When firm f’s headquarters is located in city c, Sfc = 4, while when firm f does not operate an office in city c, Sfc = 0. Intermediate values were assigned as follows: 3 for offices with important extraterritorial functions (e.g., regional headquarters), 2 for particularly large offices, and 1 for all other offices (i.e., typical offices). This data collection process yielded a 525 city × 175 firm matrix of service values in 2010, and a 707 city × 175 firm matrix of service values in 2016. 1
The oSDSM
The oSDSM was originally developed to solve a general analytic problem in the network science literature—the identification of important connections in a bipartite projection network—which has particular implications for research on world city networks (Neal 2012). For example, in a network that views two legislators as linked because they sponsor the same bills (Neal 2014) or that views two cities as linked because they host the same firms (Neal 2017), the oSDSM provides a way of determining how many cosponsored bills or colocated firms must be observed to make these linkages significant. Here, we explore a partial implementation of this model, 2 which offers an operationalization of the conceptual model of firm location selection sketched above and allows predictions to be made about when and where firms will expand, maintain, or contract their presence.
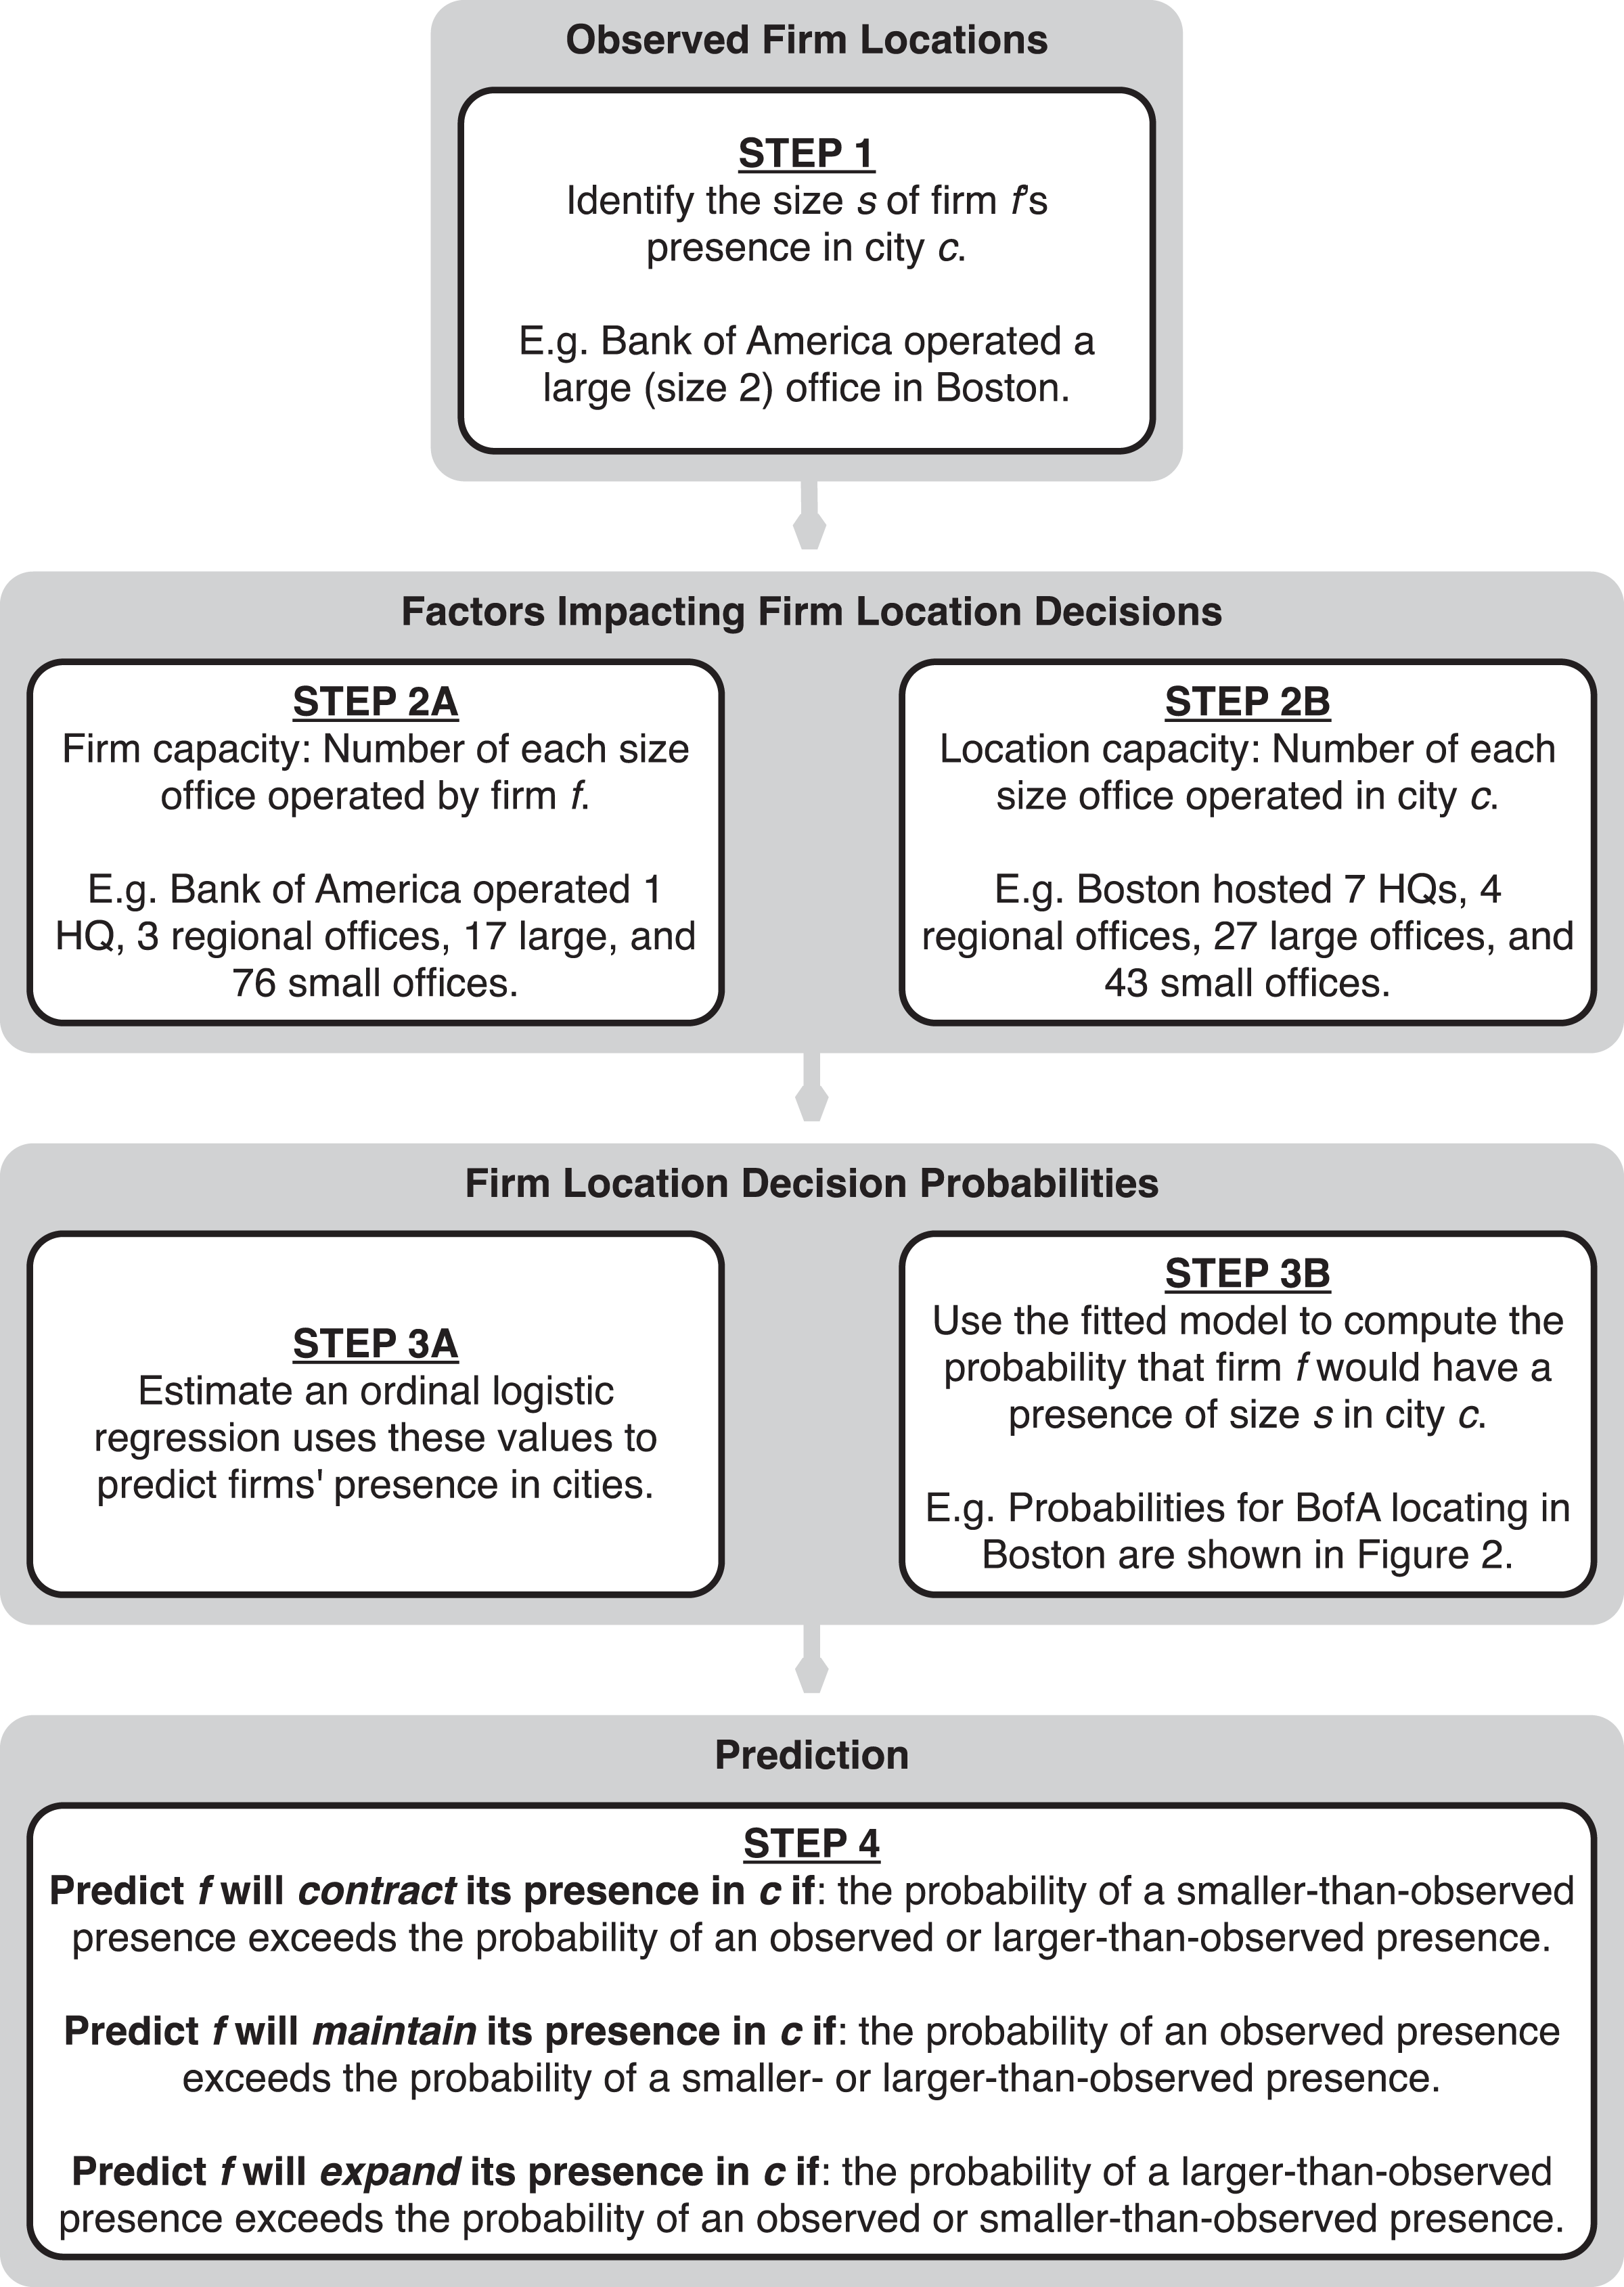
Figure 1 illustrates the relevant steps of the oSDSM for making predictions about firm location selection. In the remainder of this section, we describe the application of the oSDSM for this purpose, focusing on the case of Bank of America’s presence in Boston for the sake of illustration. Step 1 involves identifying the current size of a given firm’s presence in a given city (Sfc ). For example, the GaWC data indicate that in 2010, Bank of America maintained a large office in Boston that was not a regional headquarters. Using the GaWC five-point scale described above, S BofA,Boston = 2.
Adapted ordinal stochastic degree sequence model.
Step 2 involves measuring the two key factors viewed as driving firm location decisions: firm capacity and location capacity. There are a variety of exogenous indicators that might be used to capture these factors (e.g., firm size and location tax environment); however, the oSDSM measures these factors endogenously. Firm capacity is measured using the distribution of sizes of a firm’s presences in all locations. For example, in 2010, Bank of America maintained one global headquarters, that is, Σ(S BofA = 4) = 1; three regional headquarters, that is, Σ(S BofA = 3) = 3; seventeen large offices, that is, Σ(S BofA = 2) = 17; and seventy-six small offices, that is, Σ(S BofA = 1) = 76. These data directly capture Bank of America’s then-current office-operating capacity, which displays a hierarchical structure that is typical of a large multinational corporation. Similarly, location capacity is measured using the distribution of sizes of a location’s firm presences. For example, in 2010, Boston was the location of seven firms’ global headquarters, that is, Σ(S Boston = 4) = 7; four firms’ regional headquarters, that is, Σ(S Boston = 3) = 4; twenty-seven firms’ large offices, that is, Σ(S Boston = 2) = 27; and forty-three firms’ small offices, that is, Σ(S Boston = 1) = 43. These data directly capture Boston’s then-current capacity for attracting firms, which is consistent with typical views of Boston as a significant corporate center but not the largest.
Step 3 involves estimating the probability that a firm would (i.e., following the conceptual model outlined above) maintain a given size presence in a location, given the respective firm’s and location’s capacities. First, an ordinal logistic regression is estimated that uses firm and location capacities and their interactions to predict firms’ current sizes and locations:
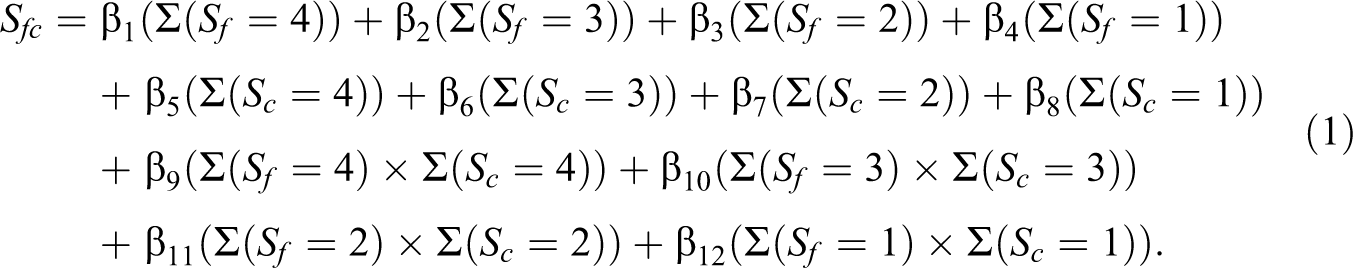
The estimates of β1–β12 and their associated standard errors are not of direct interest but instead are only used to compute the predicted probabilities. The right panel of Figure 2 illustrates these probabilities for the case of Bank of America in Boston. Given Bank of America’s and Boston’s capacities in 2010, there was a 48 percent chance Bank of America would maintain no presence in Boston, a 44 percent chance of a small office, a 7 percent chance of a large office, a 1 percent chance of a regional headquarters, and a 0.2 percent chance of its global headquarters.

Predicted office size probabilities.
The final step involves comparing these probabilities to a firm’s observed presence in a location to make a prediction about its likely presence in the future. We make these predictions by considering whether a larger (green bars) or smaller (red bars) presence is more likely than a firm’s current presence (blue bar). The model suggests that Bank of America’s large presence in Boston far exceeded the firm’s and location’s capacities and that a smaller office would be more appropriate given these capacities. Based on these estimates, model predicts that Bank of America will contract its presence in Boston. This prediction was correct: by 2016, Bank of America maintained only a small office in Boston (S BofA,Boston = 1).
The other panels of Figure 2 illustrate the model’s results for two additional cases. First, in 2010, Praxity maintained a small office in Amsterdam, which the model suggests was too small given its capacity and the capacity of Amsterdam. In this case, the probability of a small office was estimated at 43 percent, while the probability of a larger presence was estimated at 49 percent, leading us to predict that Praxity would expand its presence in Amsterdam. This prediction was correct: by 2016, Praxity was operating a large office in Amsterdam. Second, in 2010, HSBC maintained a regional headquarters in Singapore. The model suggested that this size presence was more probable (41 percent) than a larger (39 percent) or smaller (20 percent) presence, leading us to predict that HSBC would maintain its existing regional headquarters in Singapore. Again, this prediction was correct: in 2016, HSBC still maintained a regional headquarters presence in Singapore. These examples all offer illustrations where the method yields accurate predictions, and are provided to illustrate how the framework is intended to work. Below we discuss the method’s accuracy rate and more closely examine cases where it yields inaccurate predictions.
The oSDSM approach to modeling and predicting firm location decisions resembles the discrete choice model first implemented by Carlton (1979), which uses a conditional or multinomial logit model to estimate the probability that a given firm will select a given location as a function of a vector of explanatory variables. It is also similar to the modeling strategy adopted by van Dijk and Pellenbarg (2000) who use an ordinal logistic regression to predict firm movement as a function of firm and location factors. However, this approach differs from earlier modeling approaches in several important ways. First, unlike the discrete choice model that can be estimated only for a small number of highly aggregated locations (Guimarães, Figueirdo, and Woodward 2003), the oSDSM can be estimated for a large number of specific locations (here, 525 cities). Second, both of these approaches aim to estimate whether or not (or the probability with which) a firm will choose a particular location, while the oSDSM also estimates the size of the firm’s presence in the chosen location. Finally, both of these approaches require the measurement of one or more explanatory variables, which can be difficult and time-consuming particularly when this measurement requires surveying firm personnel (e.g., Barkley and McNamara 1994; Elgar and Miller 2010), while no additional data beyond current firm locations and sizes are required by the oSDSM.
Results
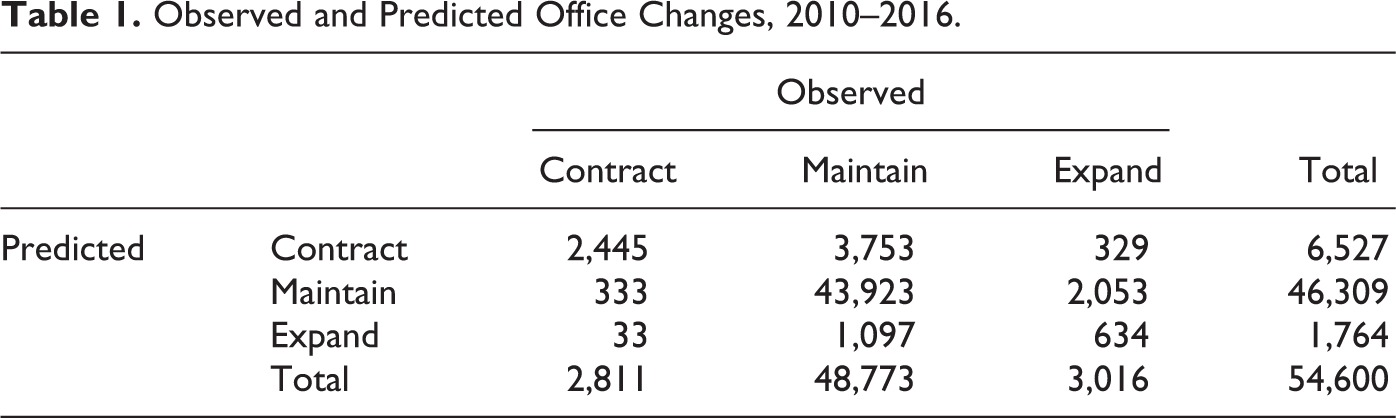
To investigate the accuracy of firm location predictions derived from the oSDSM, we used GaWC firm location and size data on 175 firms in 525 cities in 2010 to make predictions about whether they would expand, contract, or maintain their presence in these locations (i.e., 91,875 independent predictions). We then compared these predictions with the sizes and locations in these 525 cities of the 104 firms that still existed in the same form in 2016 (i.e., 54,600 prediction–observation pairs). 3 Table 1 reports the observed and predicted changes for each of these firm–city pairs, while Table 2 reports a series of metrics that evaluate the accuracy of the predictions. The simplest metric is raw agreement: the percentage of cases in which the prediction matches the observation. We find that the oSDSM predictions are accurate in about 86 percent of the cases; these are the 47,002 cases located along the diagonal of Table 1. While this level of accuracy is quite good, it does not take account of the fact that even guessing whether a firm would expand, contract, or maintain its presence in a city would be accurate in at least some cases. Cohen’s κ is the most widely used metric of agreement that controls for chance levels of accuracy and ranges from 0 (no better than chance accuracy) to 1 (perfect accuracy). Using Landis and Koch’s (1977) guidelines, a κ = .407 indicates moderate agreement. However, despite its widespread use, κ is now known to be downwardly biased and an alternative metric known as the AC1 coefficient is preferred (Gwet 2008). Here, AC1 = 0.843, which falls within Landis and Koch’s (1977) range of “almost perfect agreement.”
Observed and Predicted Office Changes, 2010–2016.
Measures of Prediction Accuracy.
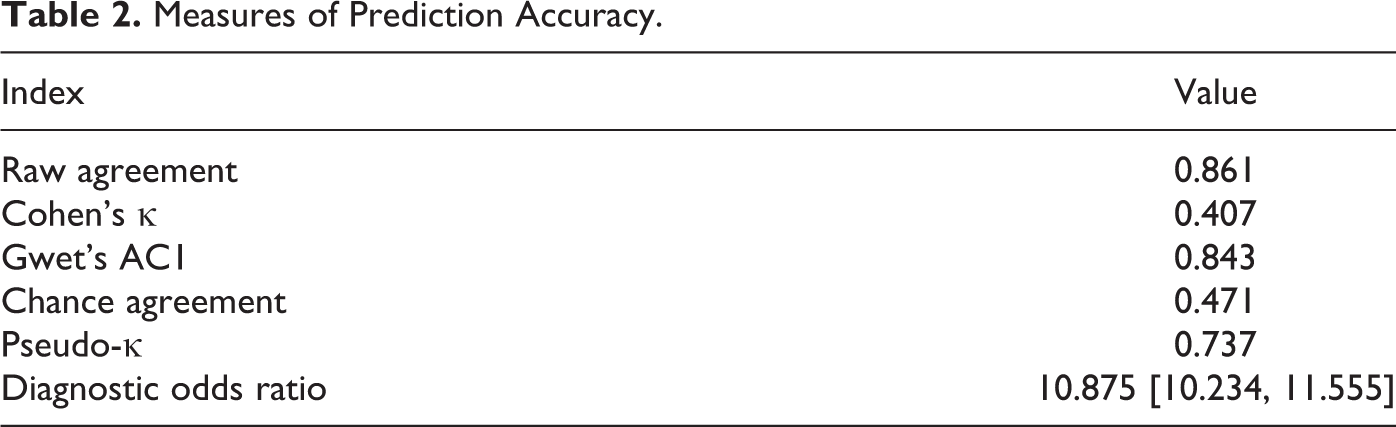
The computation of both κ and AC1 employs general-purpose models of guessing and chance agreement, and they are presented here because they are among the most widely used such measures. However, given the particular structure of the GaWC data, it is possible to construct a more relevant model of guessing. If a firm maintains no presence in a city (i.e., if Sfc = 0), then a forecaster is only guessing between whether the firm will maintain that level of presence or expand. Similarly, if a firm maintains a global headquarters in a city (i.e., if Sfc = 4), a forecaster is only guessing between whether the firm will maintain that level of presence or contract. For other sizes of presence, a forecaster may guess the firm will expand, contract, or maintain its presence. A forecaster making random guesses within these constraints would be accurate in about 47.1 percent of cases, yielding a pseudo-κ based on this more relevant guessing model of .737, which Landis and Koch (1977) still view as “substantial” agreement.
More often used in medical applications, the diagnostic odds ratio (DOR) offers a third index of prediction accuracy. The DOR is a likelihood ratio defined as the ratio of true positives to false positives, divided by the ratio of false negatives to true negatives. It ranges from 0 to infinity, with values greater than 1 indicating the test provides predictively useful information. The oSDSM, when used to predict firm location changes between 2010 and 2016, has a DOR of 10.875 (95 percent CI: [10.234, 11.555]), which indicates that this approach to predicting firms’ location changes is more than ten times more accurate than guessing. Deeks (2001) describes DOR values >10 as “providing convincing diagnostic evidence,” where the “diagnosis” in this case is whether a firm will expand, contract, or maintain its presence in a given location.
The values reported in Table 2 describe the model prediction’s accuracy over the entire population of cities and firms. However, we also investigated whether there is variation in prediction accuracy by firm sector or city region. Generally, there is not. Focusing only on predictions made about firms in a specific sector, pseudo-κ values were relatively high for firms in advertising (.704), consulting (.822), banking (.806), and law (.895) but were notably lower for accounting firms (.473). This may indicate that accounting firms follow less predictable global location selection strategies than firms in other sectors and may also be a reflection of the shake-up among accounting firms following Arthur Andersen’s conviction (in 2001) and subsequent exoneration (in 2005) surrounding the Enron scandal. Focusing only on predictions made about cities in specific regions, pseudo-κ values exhibited little variation, ranging from a high of .828 for cities in South Asia to a low of .684 for cities in the United States and Canada. This suggests that the model is not substantially more accurate at predicting firm location changes in some parts of the world than others.
These indices provide an overall assessment of the accuracy of predictions made by the oSDSM approach. Although this approach only makes predictions concerning whether a firm will expand, contract, or maintain its presence in a given location, we also know how much a firm’s presence in a given location changed between 2010 and 2016. Table 3 reports the predicted changes by the observed magnitude of the change, where the magnitude values indicate the number of units of change on the GaWC five-point scale. For example, a magnitude change of −4 occurs only when a firm maintained a global headquarters in a city in 2010 (i.e., Sfc = 4) but by 2016 maintained no presence in that city (i.e., Sfc = 0). The values in bold count the number of firm–location pairs for which predictions are accurate. These values are among the largest in the table, which reflects the model’s high predictive accuracy. The values in the shaded cells count the number of firm–location pairs for which the predictions are severely inaccurate. For example, in three cases, the model predicted that a firm would expand its presence in a given location, but in fact, the firm contracted its presence by two units on the GaWC scale. These “severe error” values are among the smallest in the table, reflecting that when the model’s predictions are wrong, they are usually not egregiously wrong. The remaining values in the table (i.e., not bolded or shaded) count the number of firm–location pairs for which the predictions are inaccurate but close. For example, in 3,753 cases, the model predicted expansion, and in 1,097 cases, it predicted contraction, when in fact the firms maintained their presence 2016 at the 2010 level.
Predicted Changes by Observed Change Magnitude.
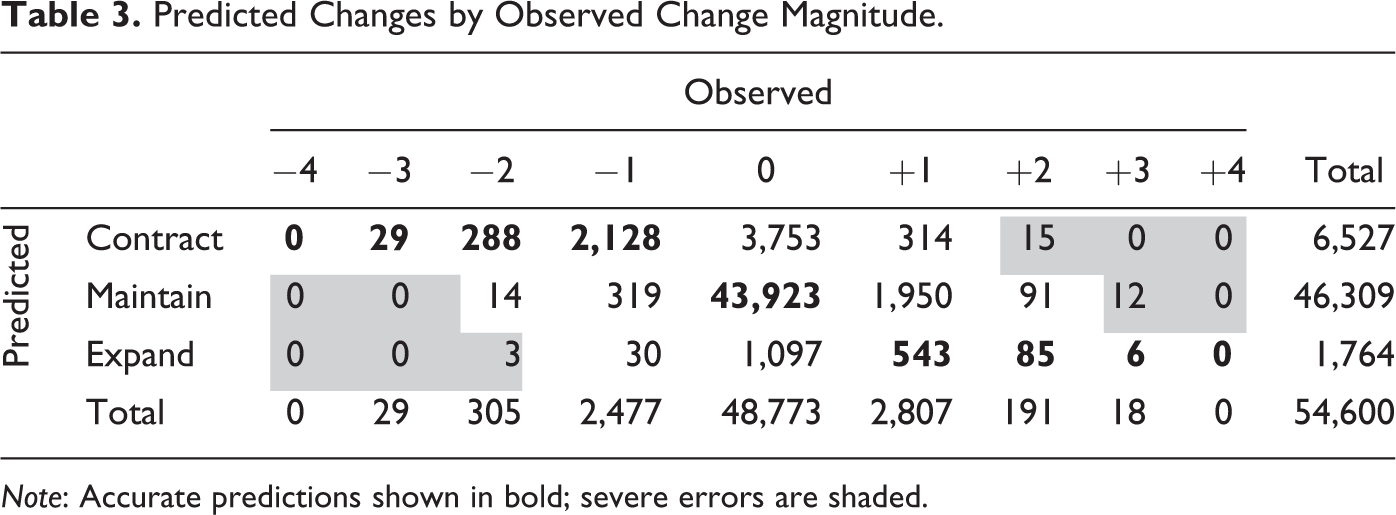
Note: Accurate predictions shown in bold; severe errors are shaded.
Discussion
The indices presented in Table 2 all suggest that the oSDSM approach to predicting when and where firms will expand, contract, or maintain their presence is quite accurate. This level of accuracy is particularly striking given the lack of exogenous independent variables used to make these predictions. That is, these predictions are derived solely using information about firms’ existing presences in locations and not using any information about the firms (e.g., size, age, and sector) or locations (e.g., tax policy, labor pool, and accessibility). The modest data requirements, combined with the high level of accuracy, suggest that the oSDSM approach can be a useful first approximation for what firms are likely to do in the future. These predictions can be useful in research on the development of urban economies and the evolution of the world city network but can also be useful in practice, for example, by city leaders seeking to identify firms either at risk of reducing their presence or poised to expand their presence.
Of course, these predictions are not always correct; there is room for improvement. Closer inspection of the results in Table 3 helps to identify some of the reasons that these predictions are sometimes inaccurate. In particular, it is helpful to examine two kinds of observed changes that the model most often gets wrong. First, the model made 4,850 (i.e., 3,753 + 1,097) inaccurate predictions about firms that maintained their presence in a given location between 2010 and 2016. This type of error likely occurs because the model does not explicitly incorporate the role of inertia in economic geography (Boschma and Lambooy 1999): although firms may plan to expand or contract their presence in a given location, they can be slow to act. Refinements of the model may address this omission by making a prediction of expansion or contraction only when the probability of this action exceeds the next most likely action by a minimum threshold. Returning to the examples in Figure 2 serves to illustrate how this might work. The model estimated the probability Praxity would maintain a small office in Amsterdam was 43 percent, and the probability it would expand its Amsterdam office was 49 percent. The prediction that Praxity would expand turned out to be correct in this case, but expansion was only slightly more probable than maintenance. Perhaps other firms, owing to inertia, require expansion (or contraction) to be substantially more attractive than simply maintaining the status quo before they will act on it.
Second, the model made accurate predictions about expansions in only about 21 percent (i.e., 634/3,016) of cases. This error in predicting expansion likely occurs because the model does not explicitly incorporate the role of general economic growth: ceteris paribus, profit-seeking firms aim to expand (Taylor, Catalano, and Gane 2003). Refinements of the model may address this omission by making a prediction of expansion even when the probability of this action does not exceed the probability of maintenance. Again, returning to the examples in Figure 2 serves to illustrate how this might work. The model estimated the probability HSBC would maintain a regional headquarters in Singapore was 40.98 percent, and the probability it would expand its Singapore office was 39.44 percent. The prediction that HSBC would maintain its existing presence in Singapore turned out to be correct in this case, but maintenance was only slightly more probable than expansion. Perhaps other firms, driven by a logic of continuous growth, are willing to expand even when it may exceed the firm’s and location’s current capacity.
These two types of prediction errors, seemingly driven by forces of inertia and growth, are important but were also minor. For example, in the 1,950 cases, the model incorrectly predicted firms would maintain their existing presence when they in fact expanded, the magnitude of their expansion was quite small. In contrast, severe prediction errors highlighted by the shaded cells in Table 3, although quite rare, offer a different kind of opportunity to understand this approach to prediction. Rather than identifying problems with the prediction model per se, these cases identify particularly noteworthy deviations where economic geographers can focus their attention and ask: what’s this firm trying to do here?
The case of accounting firm Kreston International’s (KI) presence in Kansas City, MO, offers one example. In 2010, the GaWC data indicate that KI maintained a relatively small office in Kansas City (i.e., in 2010, S KI,KC = 1), and the oSDSM predicted that it would further contract by eliminating its presence there. However, by 2016, it had in fact expanded its presence there to operate a significant regional headquarters providing extralocal services throughout the United States (i.e., in 2016, S KI,KC = 3). Closer inspection of this firm–city pair offers some insight into what is driving this severe prediction error. Unlike many advanced producer service firms, KI is not itself an accounting firm but instead is a coordinated network of independent accounting firms. Its US-based partner in this network is Meyer Hoffman McCann PC (MHM), an accounting firm founded in Kansas City in 1954. Thus, the expansion of KI in Kansas City is driven less by KI per se and more by the long-standing historical ties of MHM to the region. This example highlights that the model does not effectively capture the location strategies of firms like KI that have more complex, networked structures but also highlights that its predictions can be used to identify firms with such complex location strategies.
The evidence we have presented about the ability of the oSDSM to yield accurate predictions about firm location changes must be considered in light of several potential limitations. First, the oSDSM is rooted in a simple conceptual model of firm location selection and implies a fairly mechanistic process by which firms and locations are matched and optimized. However, such mechanical conceptions of the internationalization process that focus on firm-specific (and in our case, also location-specific) factors risk understating the role of such factors as social networks. Thus, it is important to clarify that our simple conceptual model, and its operationalization by the oSDSM, is not intended to explain firm location decisions but rather to predict their outcomes (Shmueli 2010). Second, this initial demonstration has focused only on advanced producer service firms, which play a critical role in coordinating global economic activity, but it is possible that other types of internationalizing firms follow different location strategies, the results of which the oSDSM may be able to predict better or worse. Thus, it will be necessary to replicate these findings using data on other types of firms. Third, we have excluded from our assessment of prediction accuracy any firms that merged, split, or otherwise changed during the study period. If firms that experienced these types of changes also engaged in systematically different location strategies, then their exclusion may introduce a kind of selection bias into our findings. This may be viewed as a scope condition of oSDSM predictions, which apply only to intact firms, or may be viewed as a challenge for future adaptations of the model to directly incorporate. Fourth, the model presented here makes predictions about what firms are likely to do in the future but does not explicitly identify when in the future (i.e., it does not have a specific temporal dimension). Although we have shown that these predictions are quite accurate for a six-year projection, from 2010 to 2016, further research might examine whether a shorter or longer lag may be more appropriate. Finally, as noted above, the oSDSM predictions do not explicitly incorporate general tendencies of inertia or growth, but future refinements of the model may explore ways to incorporate these tendencies, perhaps by calibrating the predictions using historical or training data.
In spite of these limitations, and the future directions they imply, we have demonstrated that the oSDSM can be adapted to provide highly accurate predictions (raw accuracy = 86 percent, pseudo-κ = .737) about when and where advanced producer service firms will expand, contract, or maintain their presence. The accuracy of these predictions is noteworthy because the oSDSM predictions are based solely on historical firm locations and do not require any exogenous data like van Dijk and Pellenbarg’s (2000) regression-based approach or empirical calibration like Longhi et al.’s (2005) neural network–based approach. As a result, it offers a low-cost (in terms of data and computational requirements) approach to making informed predictions about how the global economic landscape may look in the future. Moreover, in the specific case of advanced producer service firms and the type of GaWC data we have examined here, such predictions are important because they can shed light on how the world city network that structures the global economy may shift.
Footnotes
Declaration of Conflicting Interests
The author(s) declared no potential conflicts of interest with respect to the research, authorship, and/or publication of this article.
Funding
The author(s) received no financial support for the research, authorship, and/or publication of this article.