



Abstract
The aim of this article is to analyze inequality and inequality of opportunity (IOp) for the Spanish regions Autnomous Communities (CCAA), paying main attention to the situation of foreign immigrants. For this purpose, we use the European Social Survey of Income and Living Conditions database and some variables regarding individuals’ perceptions about immigration from the European Social Survey. We find that both income inequality and IOp increase between 2004 and 2010 for the great majority of the Spanish regions. Moreover, we observe convergence between regions in terms of IOp, while there is not convergence in terms of income inequality. In addition, the contribution of the different variables used as circumstances to estimate IOp varies greatly. The contribution to IOp of being an immigrant experienced a considerable and worrying increase, whereas the importance of family background characteristics is reduced to a great extent. Likewise, the analysis in deep of the situation of immigrants provides some interesting evidence. Firstly, we show that immigrant population experienced a downturn in their situation in terms of income; secondly, we find that, according to individuals’ perceptions about immigration, as the share of immigrants rises, there is an improvement in their impact in cultural life.
Introduction and Literature Review
The analysis of inequalities and, in particular, of inequality of opportunity (IOp) has become increasingly important in recent years. There are many scientific contributions that estimate IOp for different countries as well as theoretical papers which investigate different ways to measure IOp and analyze the contribution of the different variables in this sort of inequality.
The concept of IOp stems from the work of several philosophers (Arneson 1989; Cohen 1989; Dworkin 1981a, 1981b; Nozick 1974; Rawls 1971; Sen 1979), who incorporate the idea of equality of opportunity from different perspectives. 1 Roemer (1993, 1998) introduces the concept of equality of opportunity in economics. According to this widely accepted concept, there is equality of opportunity in an outcome when this outcome only depends on the degree of effort exerted by individuals and not on their circumstances.
Within this framework, the objective of this article is to contribute to the analysis of regional inequalities in Spain. More specifically, we analyze inequality and IOp within the seventeen Spanish Autonomous Communities (CCAA), which correspond to category II in the European Union Nomenclarture of Territorial Units for Statistics (EU NUTS II) regions.
Spanish regions differ widely from each other in many dimensions, for example, economic size, per capita gross domestic product, unemployment rate, and demography. Therefore, we find extremely interesting to analyze the fluctuations of inequality and IOp between regions, also identifying the main determinants of unequal opportunities for each region.
In addition, we focus on the situation of foreign immigrants in the different regions since we consider particularly interesting to know whether they are in a disadvantageous situation compared to individuals born in the Spanish territory. Furthermore, we are interested in knowing whether there are regional disparities in the integration of immigrants, that is to say, how is their performance in terms of income and finally how is immigration related to individuals’ perceptions about immigration in several dimensions.
There are many evidences in the literature about the contribution of foreign-born individuals to IOp. Suárez-Álvarez and López-Menéndez (2018a) find that the place of birth is one of the most important circumstances in Spain since it accounts for 20.67 percent of total IOp in 2004 and for 37.2 percent in 2010. This increase seems to be closely related to immigration since the share of immigrants in total population increases between these two years. The effect and extent of demographic characteristics in inequality has been previously studied by Pestieau (1989). However, it has never been analyzed in deep for IOp.
Other papers that analyze IOp in Europe (Brzezinski 2015; Marrero and Rodríguez 2012; Suárez-Álvarez and López-Menéndez 2018b) find that people born outside the country of residence are in a worse situation, and variables referred to immigrants have significant negative coefficients in their regressions to estimate IOp. Furthermore, Suárez-Álvarez and López-Menéndez (2018b) find that the importance of the place of birth in IOp rises in average from approximately 10 percent to 14 percent for the European countries.
Likewise, this demographic characteristic varies greatly between Spanish regions. The share of immigrants is higher in Madrid and in the Easter Mediterranean regions, while in the North Western regions, there is more aging population. In essence, in this article, we try to understand how demographic differences in terms of immigration affect inequality and IOp. Moreover, we analyze individuals’ perceptions with regard to immigrants in several dimensions and their relationship with the share of immigrants.
We find that both income inequality and IOp increase from 2004 to 2010 for the great majority of the Spanish regions. Moreover, we observe convergence between regions in terms of IOp, while there is not convergence in terms of income inequality. In addition, the contribution of the different variables used as circumstances to estimate IOp varies greatly. The importance of being an immigrant to IOp experienced a considerable and worrying increase, whereas the relative importance of family background characteristics is reduced to a great extent.
Moreover, the analysis in deep of immigration provides some interesting evidence. First, we find a positive relationship between the evolution of IOp and the contribution of immigrant. Second, regarding the perceptions about immigrants, it can be seen that as the share of immigrants increases, there is an improvement in individuals’ perception about the impact of immigration in cultural life.
The rest of this article is structured as follows. The second section presents the database used and a description of the variables. The third section analyzes the evolution of inequality and IOp for the different regions. The fourth section assesses the implications of the demographic variables in inequality, and the fifth section analyzes individuals’ perceptions with regard to immigration. Finally, the sixth section summarizes the conclusions of this article.
Database and Data Description
Our analysis mainly relies on the European Social Survey of Income and Living Conditions (EU-SILC), more specifically the surveys of 2005 and 2011, which contain data for 2004 and 2010, respectively. These two surveys are the only ones including an ad hoc module called “Intergenerational transmission of poverty,” which contains socioeconomic variables regarding the social background of individuals.
These variables are of great importance when analyzing IOp since parental background usually entails a great part of overall IOp (see Bourguignon, Ferreira, and Menéndez 2007; Marrero and Rodríguez 2011; Suárez-Álvarez and López-Menéndez 2018a); therefore, we cannot estimate IOp without this sort of variables. Likewise, the information referred to these two years allows us to compare the situation before and after the recession.
We measure inequality between individuals using as outcome variable the equivalized disposable income of households, 2 that is claimed to be a good indicator of well-being and a good proxy of the truly available income individuals benefit from. Most of the studies about IOp based on EU-SILC have used this variable for their analyses, such as Brzezinski (2015); Marrero and Rodríguez (2012); Palomino, Marrero, and Rodríguez (2019); Suárez-Álvarez and López-Menéndez (2018b, 2018a).
To estimate IOp, we use four variables as proxies to circumstances: parental education 3 and parental occupation, 4 which rely on three categories each; immigrant, a dichotomous variable which indicates whether individuals are born in Spain or in a foreign country and age which divides individuals into five age groups of six years each, 25–31, 32–38, 39–45, 46–52, and 53–59 years. We restrict the sample to individuals aged from 25 to 59 years since we only have data of parental education and occupation for individuals of this age and to individuals whose professional situation or last main job in case of unemployed is not self-employed, to ensure reliability of income data.
Table 1 shows the share of population within each category of circumstances and the average income of each region. For parental education most parents have a low level of education, it comprises between 70 percent to 93 percent of the population share. Nevertheless, we observe a decrease in the share of population with low educated parents between 2004 and 2010 except for Madrid and Murcia. The remaining categories of this variable have a similar weight although the share of population with medium educated parents is generally lower.
Average Income and Share of Population by Circumstances and Region.
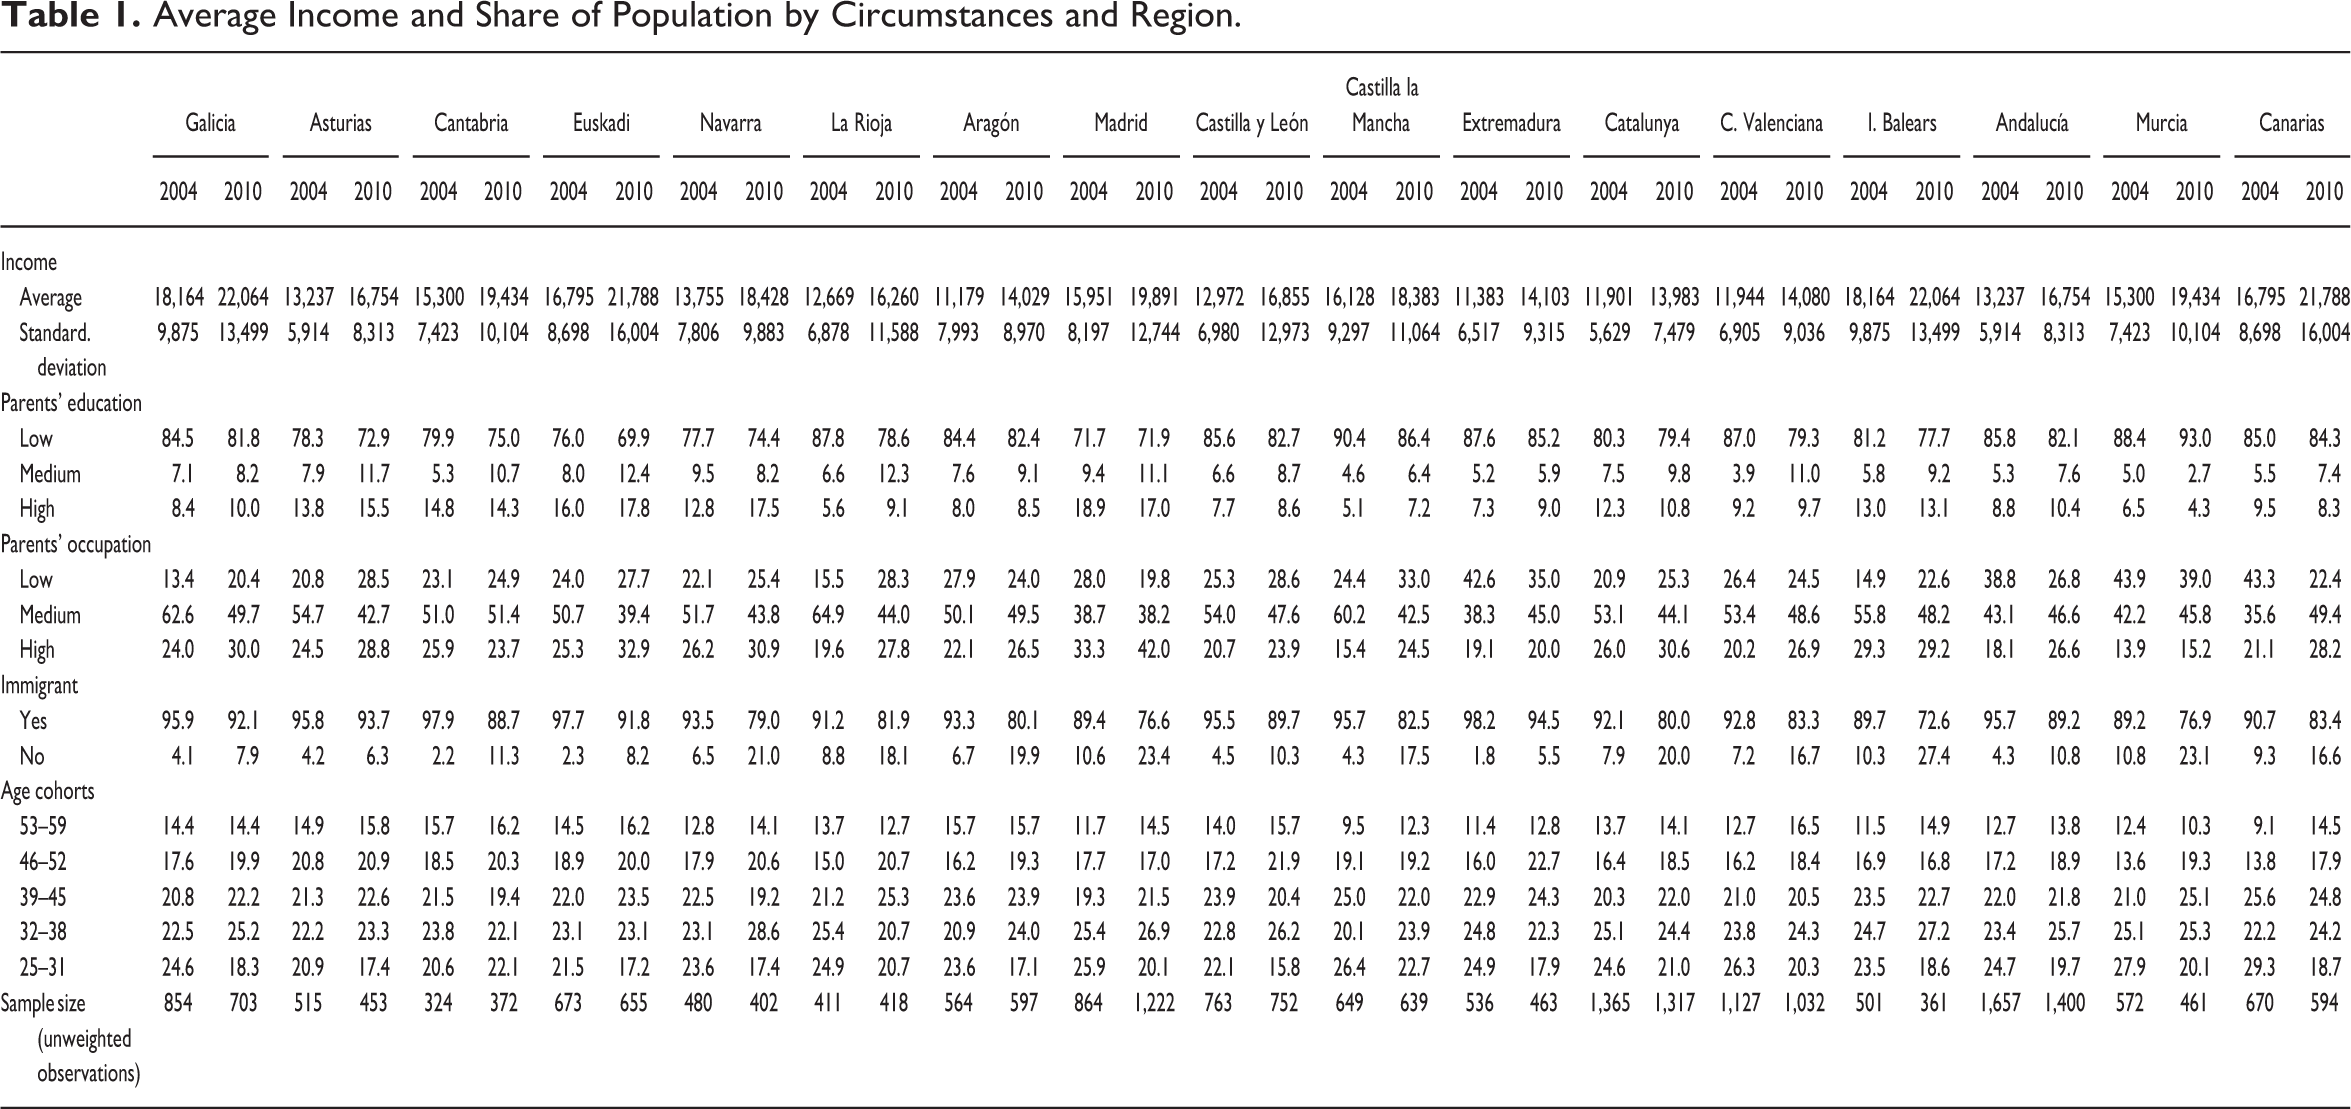
In the case of parental occupation, we observe that for the vast majority of the regions, the most important category is the one which corresponds to individuals whose parents work in medium skilled occupations. In general, the second most important category is high skilled, but in the southern regions (Andalucía, Canarias, Extremadura, and Murcia), there is a high share of individuals with low skilled parents.
For the variable immigrant, we observe a small share of immigrants in total population. However, this share increases overtime in all regions. It can be seen that the share of immigrants tends to be higher in western and southern regions as well as in Madrid. Finally, for age, we observe that younger age groups comprise more share of the population, without significant differences between the weights of the groups.
Moreover, in addition to the EU-SILC database, we incorporate in our analysis some data regarding perceptions toward immigration. These data are collected from the European Social Survey (ESS). Specifically, we use three variables regarding perceptions about immigration in three dimensions: economy, culture, and place of residence.
These variables are defined as follows: Immi_Economy, ask individuals whether they think immigration is bad or good for country’s economy; Immi_Culture, ask individuals whether country’s cultural life is undermined or enriched by immigrants; Immi_Place, ask individuals whether immigrants make the country a worse or a better place to live. All three are qualitative variables with eleven categories ranging from 0 to 10, where 0 means bad for the economy/cultural life undermined/worse place to live, respectively, and 10 means good for the economy/cultural life enriched/better place.
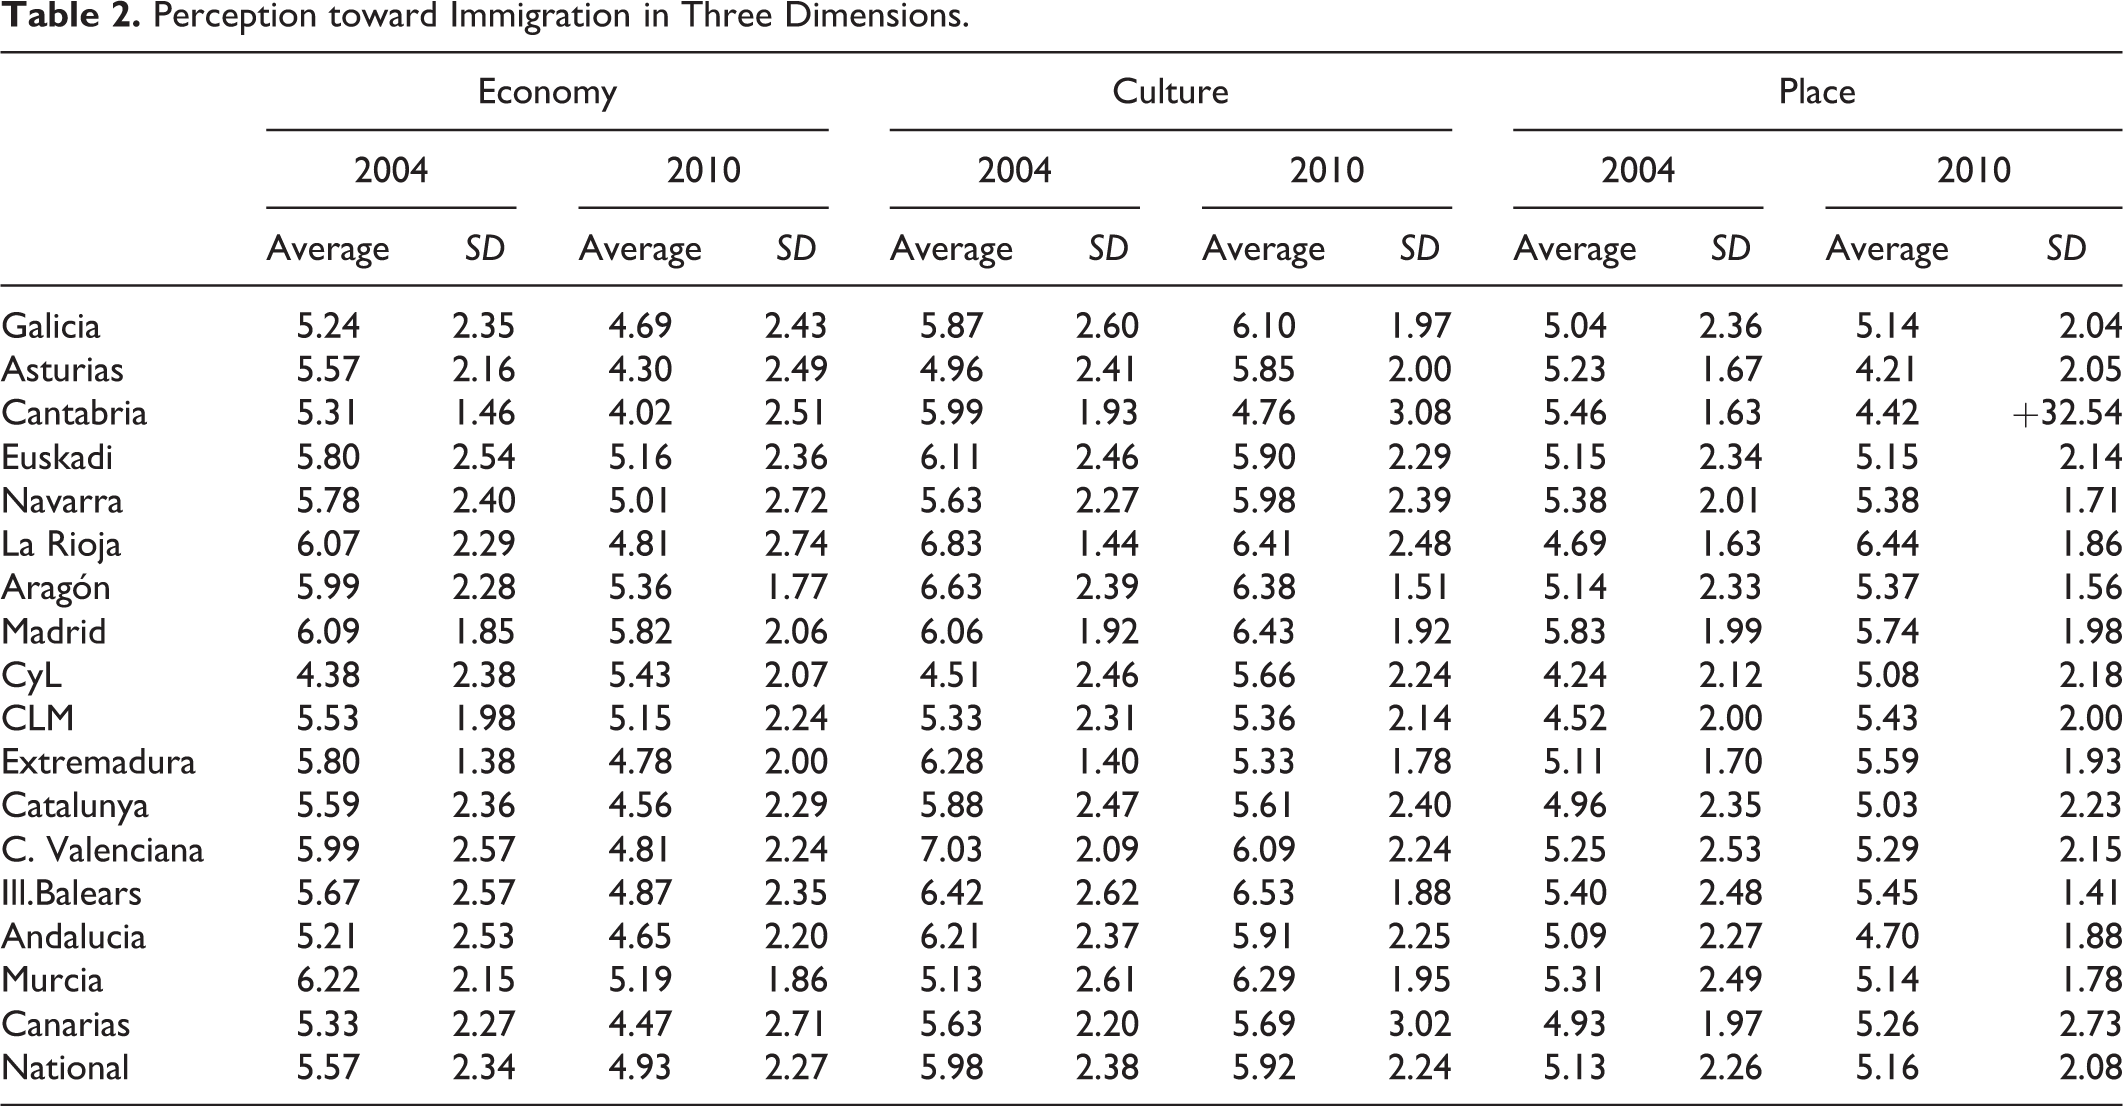
Table 2 shows the average perception for the three dimensions in each region and the standard deviation as well as the national outcomes for the two years analyzed. At a first sight, it does not seem to be many differences between regions nor overtime. In general, the average perception for all regions is around five points, which is the middle of the distribution of possible answers. However, the standard deviation is around 2, meaning that there is not a clear consensus in individuals’ opinion. Moreover, there are not significant differences between the three indicators. A more detailed analysis regarding perceptions is performed in the fifth section. For further illustration of the evolution of perceptions, Figures A1 –A3 in the Appendix show the overtime percentage change of these indicators.
Perception toward Immigration in Three Dimensions.
Evolution of Inequality and IOp
In this section, we estimate income inequality and IOp for the Spanish regions, and we assess their evolution and compute contribution of the different circumstances used to estimate IOp. Opportunities are understood as a set of options individuals can met to achieve their personal goals, and consequently, these opportunities are not always observed and their measurement entails some difficulties. There are many methodologies that can be applied to estimate IOp (see Ferreira and Peragine 2015; Ramos and Van de Gaer 2016 for a detailed discussion about different methods of measurement and their appropriateness).
To measure IOp, we use counterfactual distributions of income in which we isolate the part of inequality which can be attributed to circumstances, and we apply the ex ante parametric method (Ferreira and Gignoux 2011). Counterfactual measurement of IOp could be done ex ante or ex post. The ex ante approach implies measuring IOp between individuals without determining the level of effort they exert to achieve their goals, whereas the ex post option implies measuring IOp knowing the level of effort exerted by individuals. In the first case, using the ex ante approach, in the counterfactual distribution, we give each individual the same outcome if they share the same circumstances, whereas from the ex post perspective, to construct a counterfactual distribution, the same outcome should be given to individuals who exert the same degree of effort.
We decide to use the ex ante approach for several reasons. Firstly, it is not necessary to have information of the efforts; secondly, it is consistent with the normative basis of equality of opportunity (see Ramos and Van de Gaer 2016); and thirdly, it is widely used in the literature of IOp and therefore allows comparability of our results with other papers.
This procedure entails dividing individuals into T types according to the different categories each circumstance has. We denote each circumstance by k and the different categories by zk. Consequently, the number of types is given by the expression:

Moreover, we decided to use a parametric technique to perform the estimation instead of using a nonparametric method. This is due to the fact that the nonparametric estimation leads to inaccurate estimations when the number of types is large and/or the sample is small. In addition, using the parametric method collects the indirect effect of circumstances in the outcome variable.
The parametric procedure involves estimating by Ordinary Least Squares individuals’ income using the expression:
Following this method, we get the estimated values of the equation which are counterfactual distribution of income that only depends on circumstances:

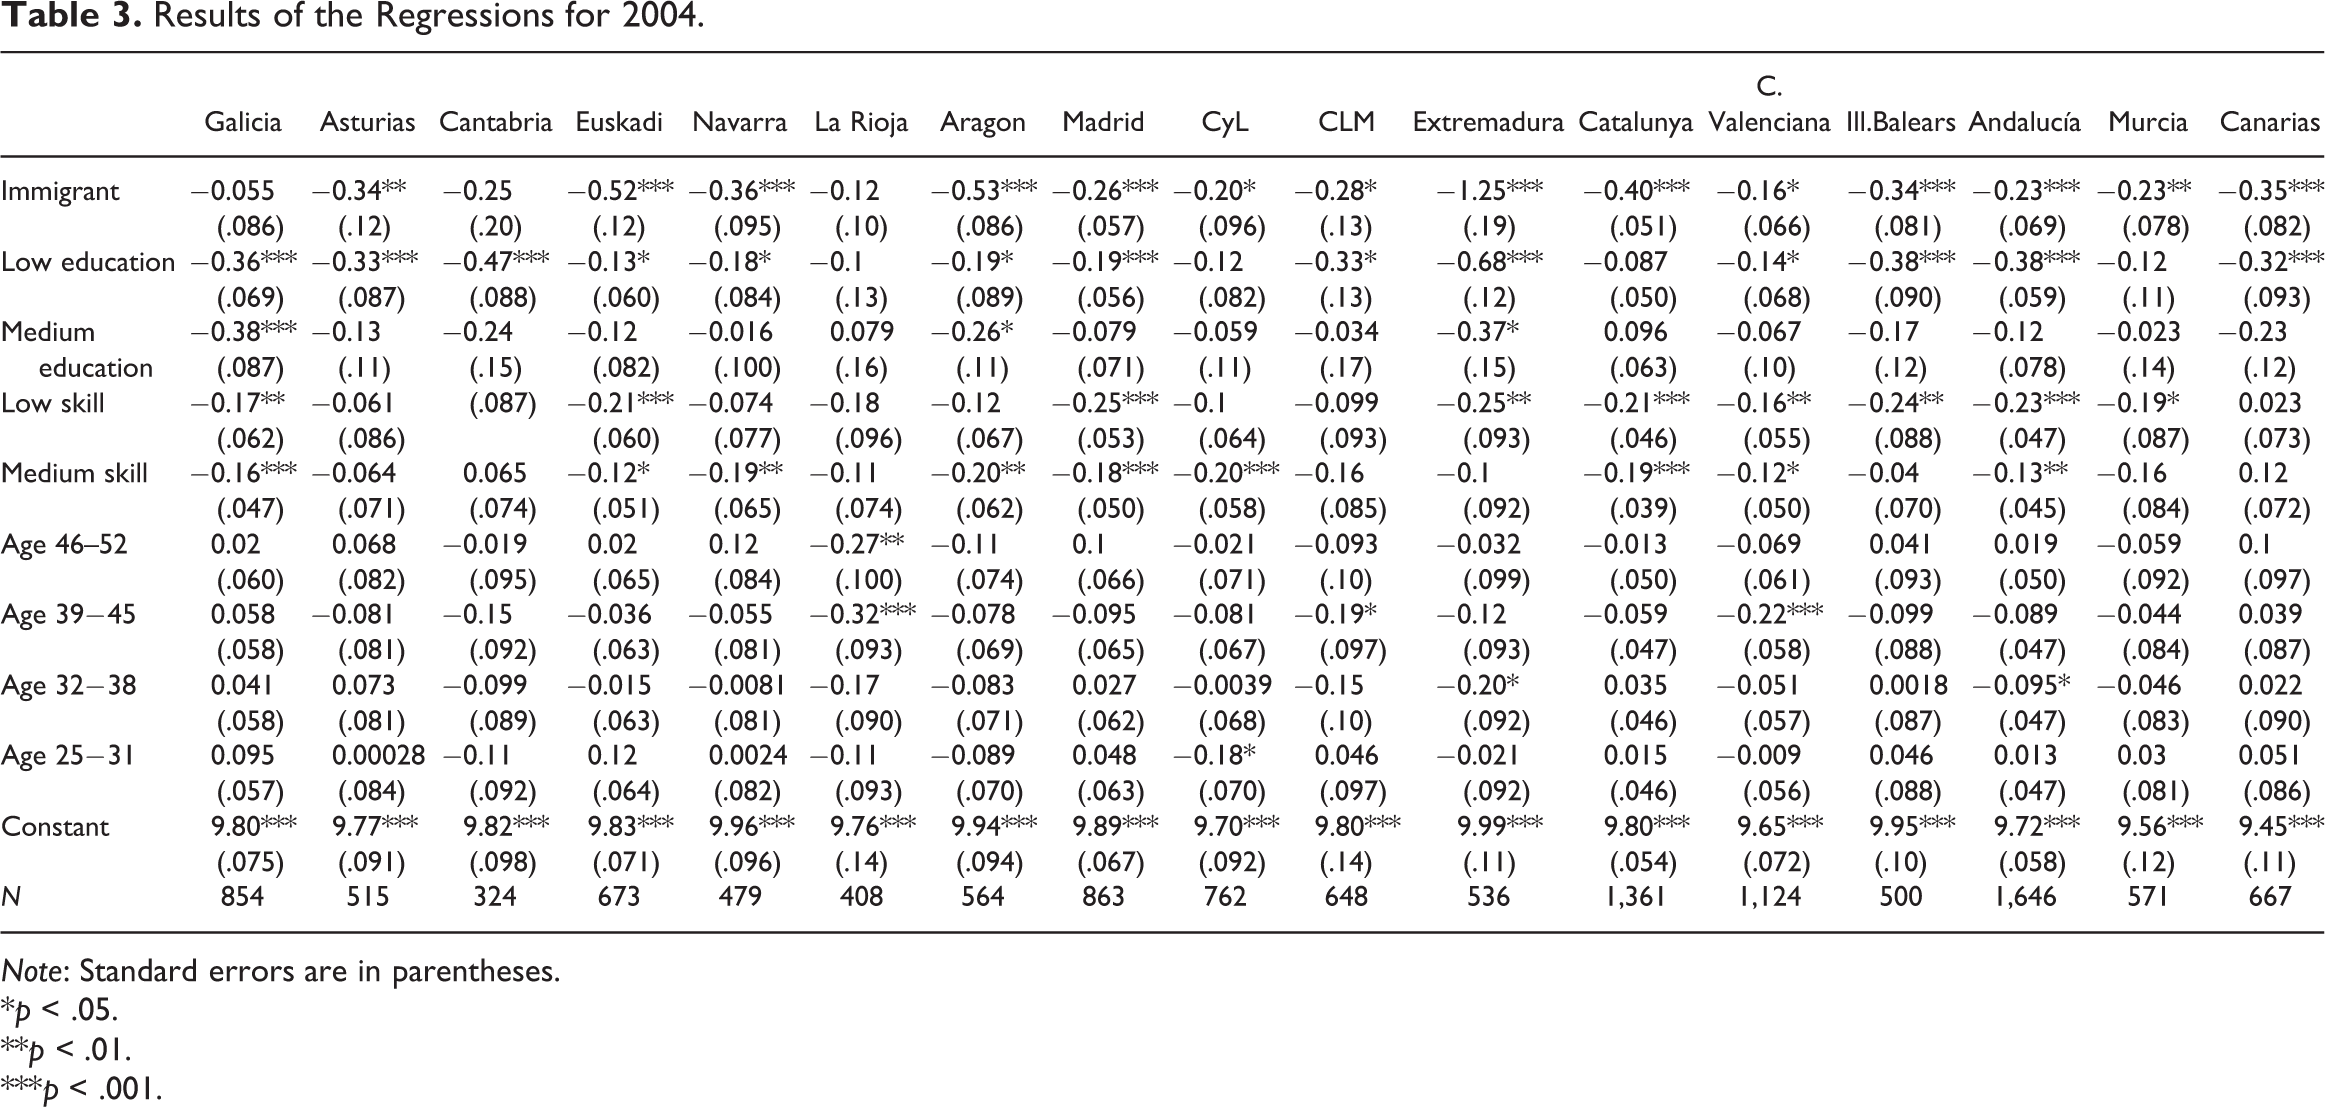
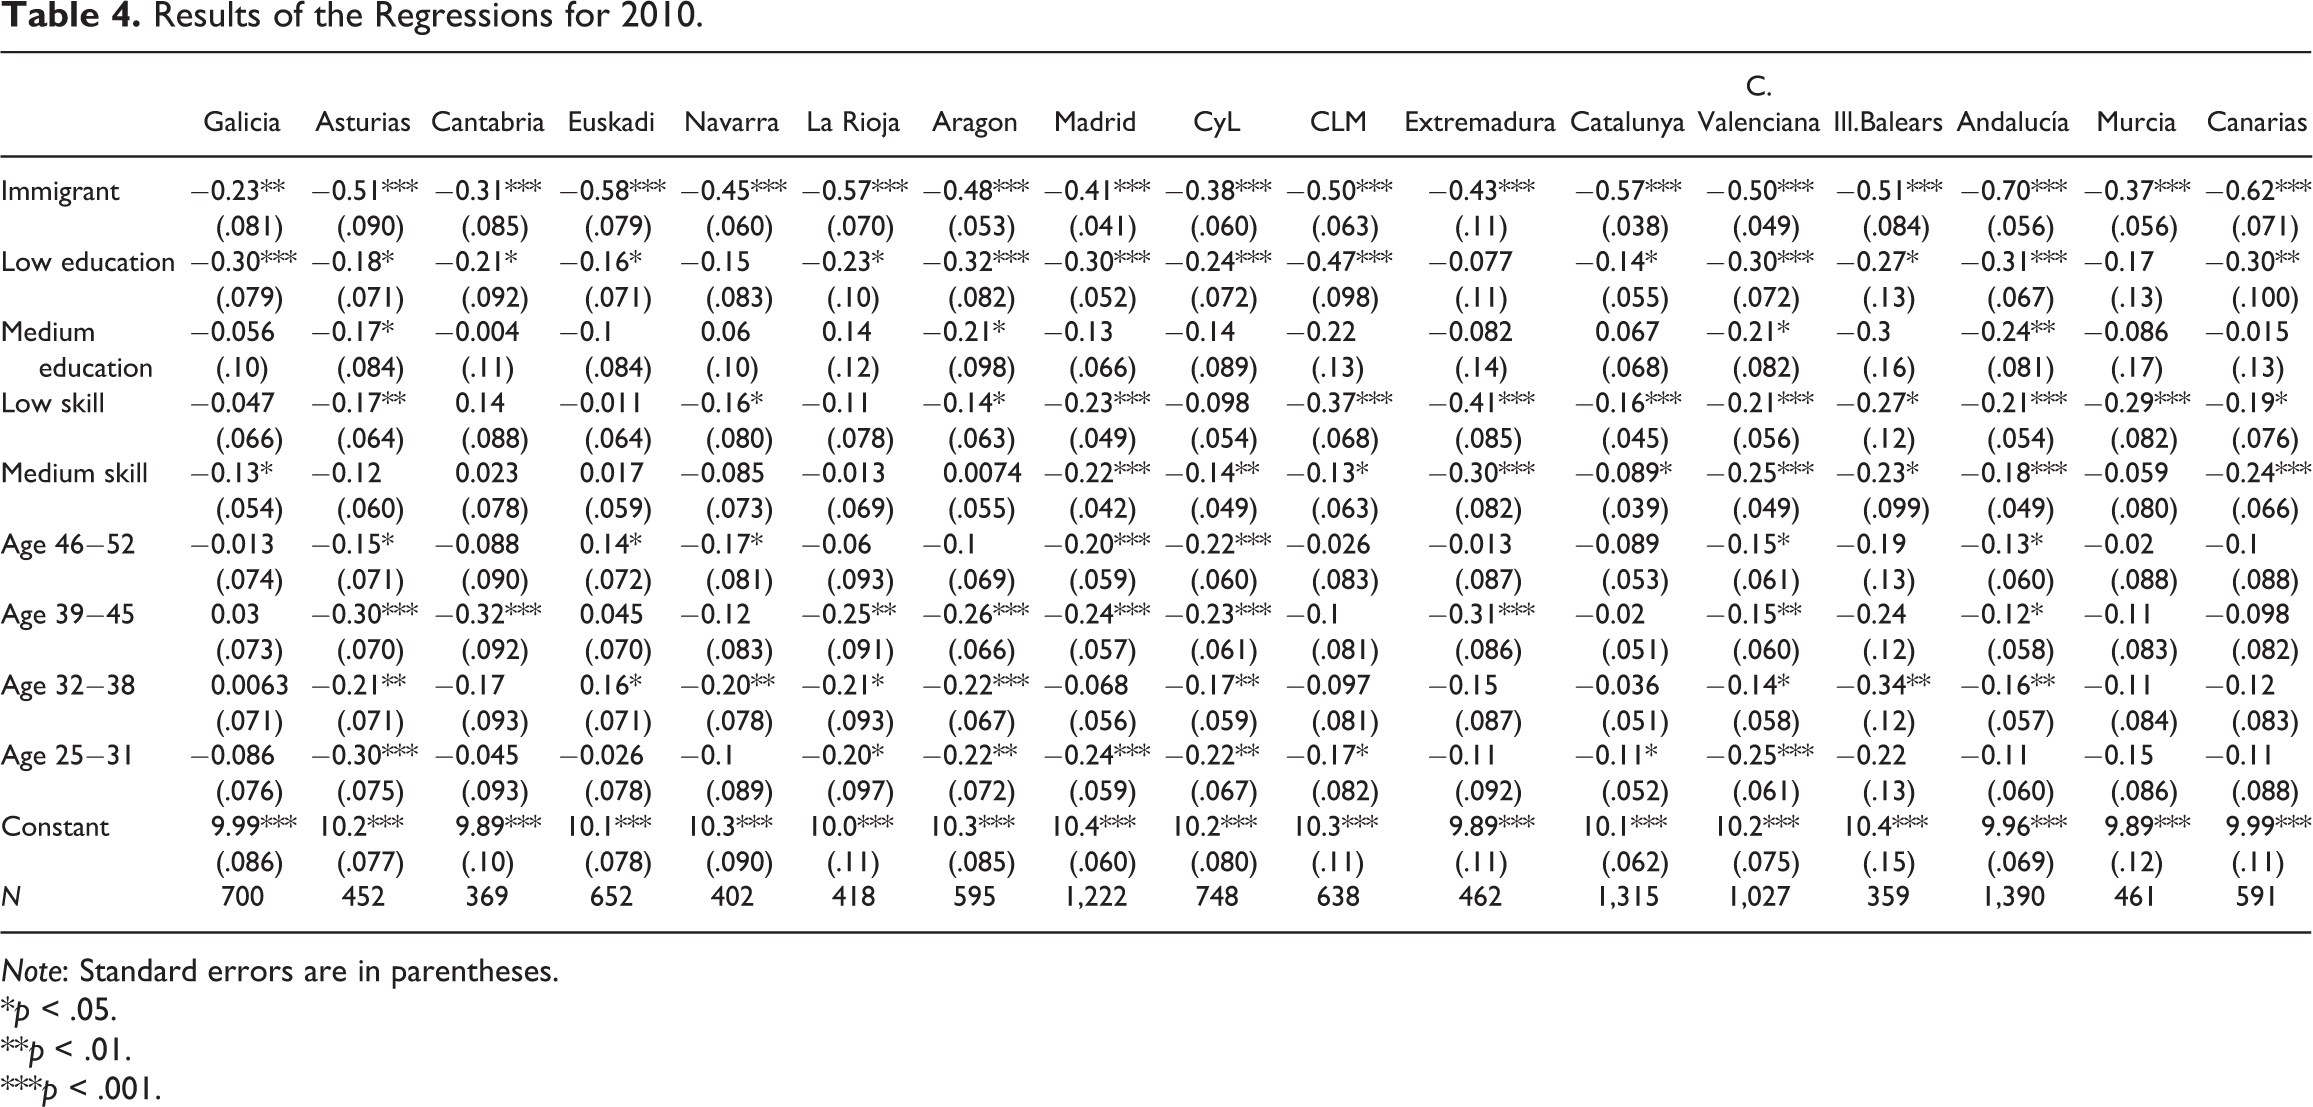
Tables 3 and 4 show the results of the regression for each region and year. We can observe that in general terms coefficients show the expected sign. Being an immigrant reduces the expected income in all regions and for both years. Variables regarding familiar background, parental education and parental occupation show negative sign in the coefficients for low and medium educational level/skill of the occupation, respectively, with regard to the category high, implying a reduction of income levels when the level of education/skills of the occupation of their parents is lower. Finally, variables of age-group do not show a uniform behavior since the sign differs from one region to another, and therefore, we cannot draw any general conclusion. Nevertheless, the estimated coefficients are found to be nonsignificant in most cases.
Results of the Regressions for 2004.
Note: Standard errors are in parentheses.
*p < .05.
**p < .01.
***p < .001.
Results of the Regressions for 2010.
Note: Standard errors are in parentheses.
*p < .05.
**p < .01.
***p < .001.
Table 5 provides the estimates of income inequality and IOp measured by the mean log deviation or entropy index of order 0 (GE(0)) and the Gini index. We use the GE(0) index for our analyzes since it satisfies the property of having a path independent decomposition (Foster and Shneyerov 2000); therefore, it can be decomposed into subgroups. We also provide the results for the Gini index as it is easy to interpret and allows more comparability with other studies.
Estimations of Income Inequality and IOp.
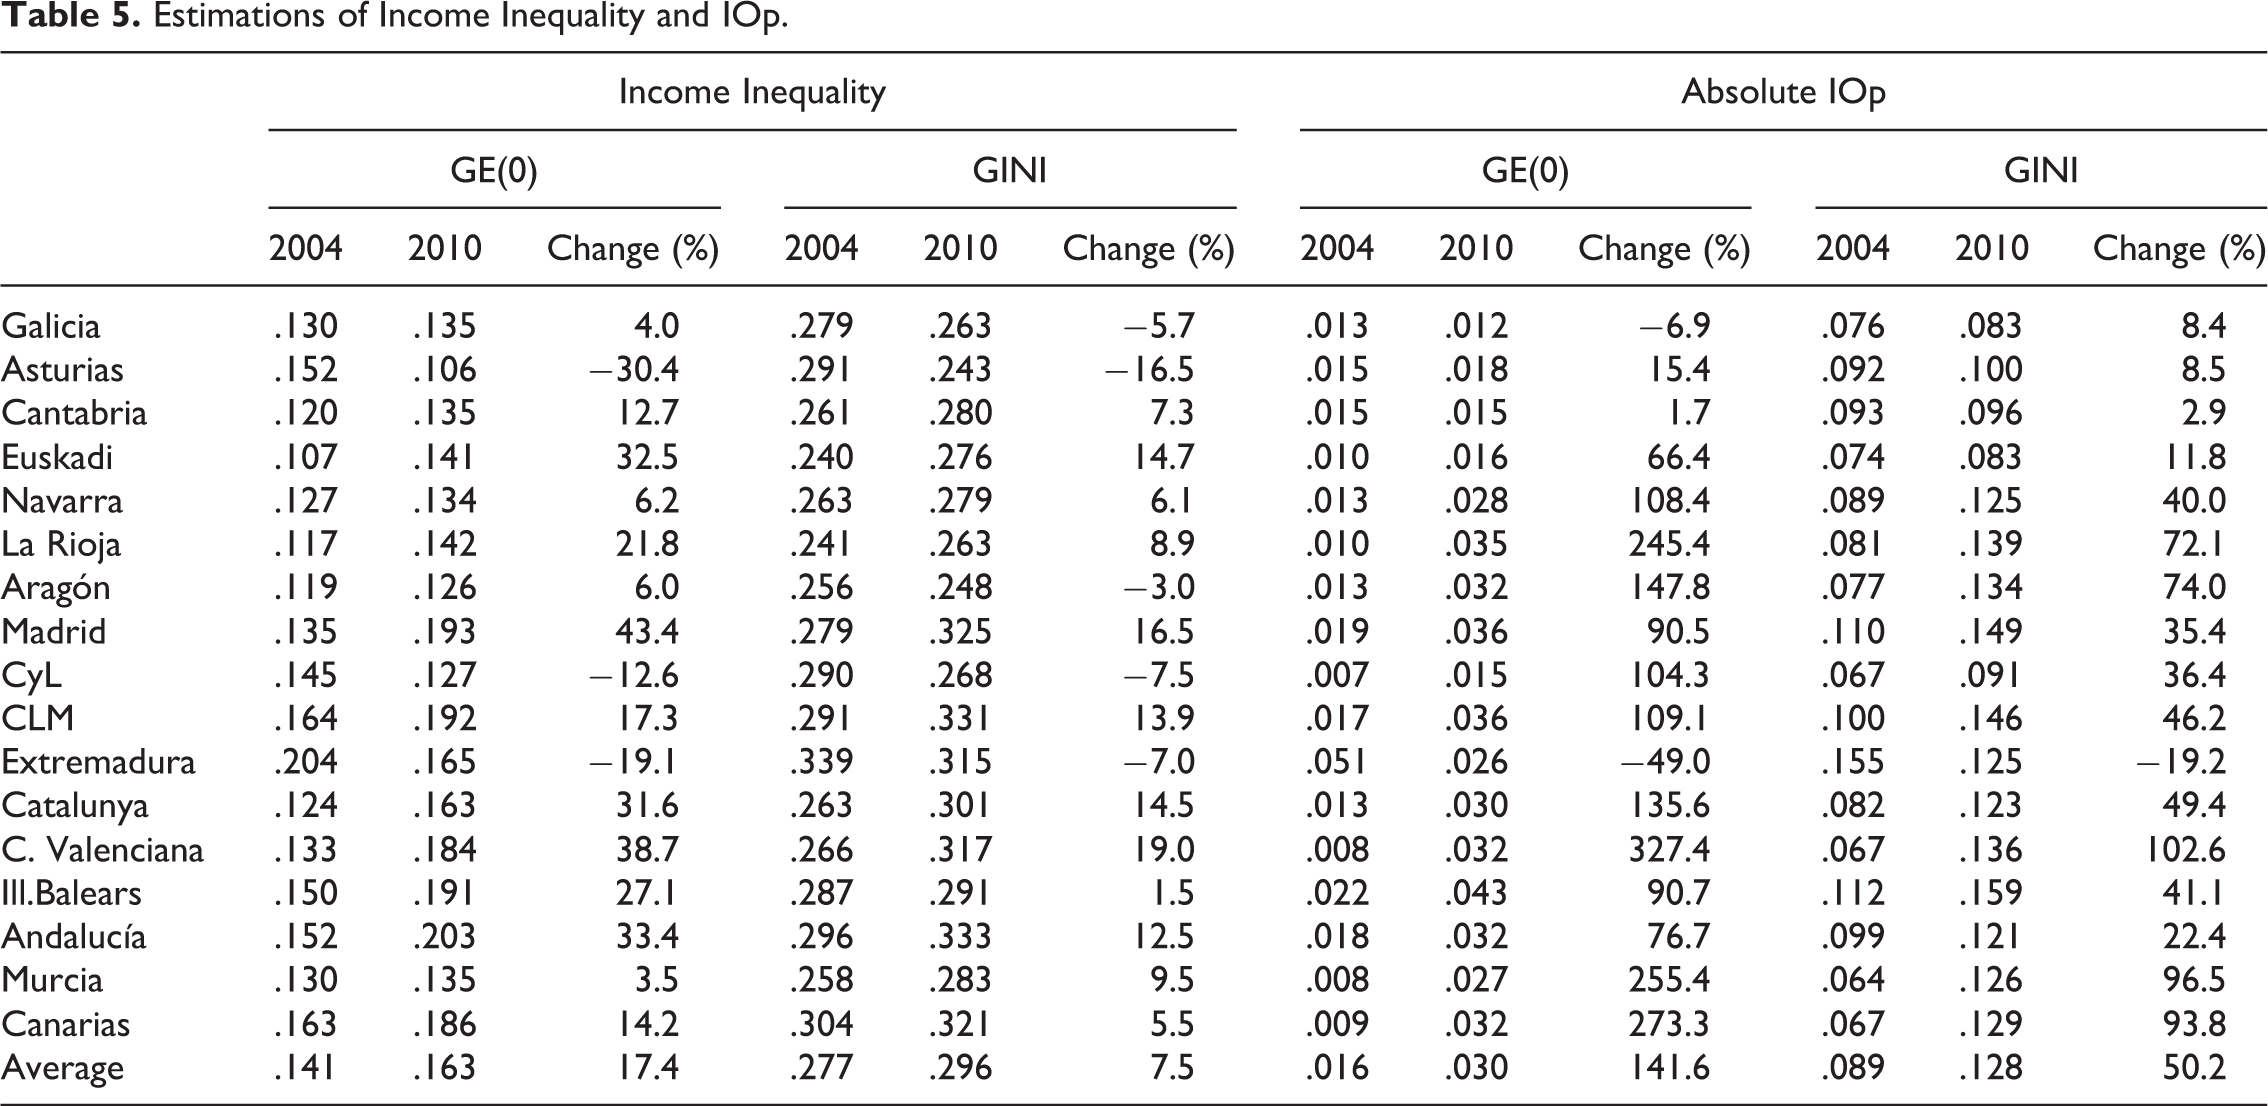
In Table 5, we can observe a generalized and significant increase in both income inequality and IOp in almost all regions. However, there are some exceptions, for Extremadura, we observe that both IOp and income inequality reduced their levels of 2004 that were really high, in fact above the national average. For Asturias and Castilla y León, we observe a decrease in income inequality. We can see that also for these two regions, the levels of income inequality were above the national average in 2004.
Lastly, for Galicia and Aragón, we obtain inconclusive results. In the case of Galicia, we observe a decrease in income inequality by the Gini index and a decrease in IOp by the GE(0) index, whereas for Aragón, we observe a decrease in income inequality when measured by the Gini index. For the remaining regions, thirteen of the seventeen, both inequalities experience a considerable increase. It can be seen that changes are greater for IOp than for overall inequality. We can also observe that the majority of the countries with levels of inequality and IOp above the national average are Mediterranean and Southern regions, in addition to Madrid. For further illustration of the results, Table A1 in the Appendix shows the seventeen regions ranked by their levels of income inequality and IOp.
In general, changes in IOp are greater than in overall inequality, meaning that the share of overall inequality that is considered IOp and which is caused by the variables used as circumstances is more relevant in 2010 than in 2004. This could suggest that the economic crisis had a more negative impact in individuals with unfavorable circumstances. Furthermore, it can be seen that changes measured by the GE(0) are greater than with the Gini index; this is because these indices have a different sensitivity: the Gini index is more sensitive to changes in the middle of the distribution, whereas the GE(0) is more sensitive to changes in the bottom of the distribution.
Using the estimates of Table 5, we perform a convergence analysis for the evolution of income inequality and IOp. On the one hand, Figures 1 and 2 show the evolution of income inequality using the GE(0) and the Gini indices, respectively. On the other hand, Figures 3 and 4 show the evolution of IOp.

Evolution of income inequality: GE(0).

Evolution of income inequality: Gini.
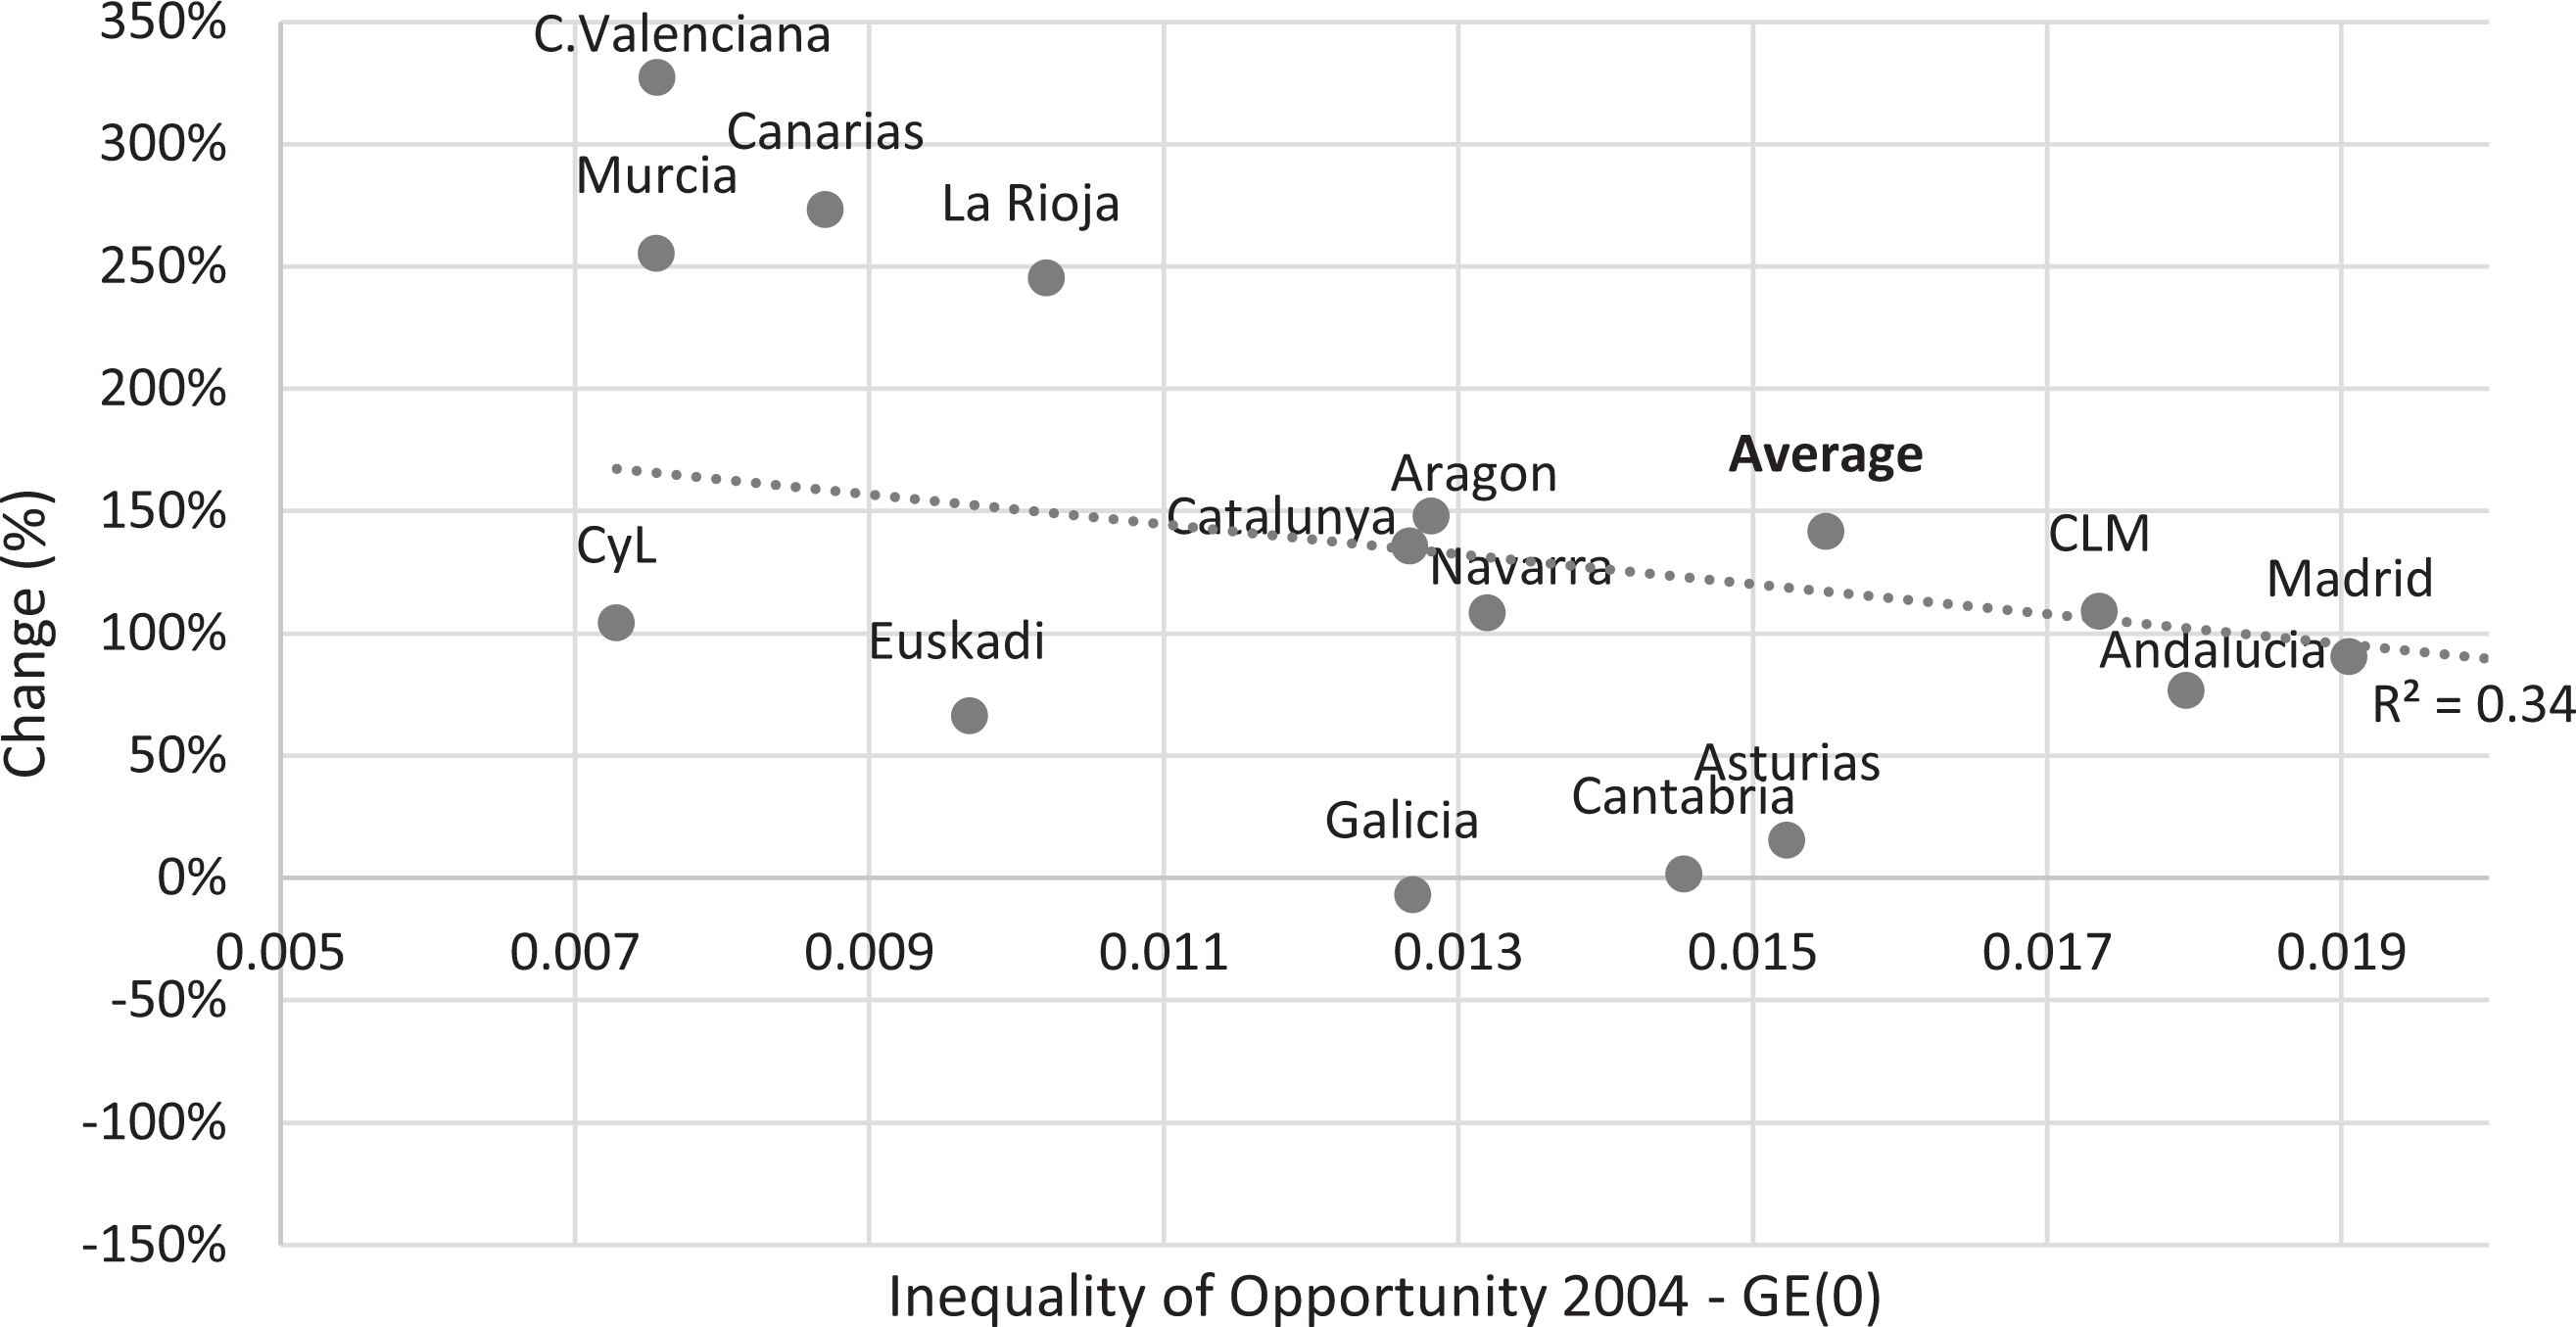
Evolution of inequality of opportunity: GE(0).

Evolution of inequality of opportunity: Gini.
For the first two figures, we can observe an inverse relationship between the initial level of income inequality in 2004 and the change between the two years analyzed. Although the correlation is stronger for the Gini index than for the GE(0), none of the obtained results are significant as the coefficient of determination is always lower than .20.
In the case of Figures 3 and 4, we can appreciate that the correlation between the initial level of IOp, and the change over time is higher than in previous figures. In this case, the indirect relationship between the indicators is clearer and again; the correlation is higher with the Gini index. These two figures show evidence of convergence between regions in terms of IOp.
To end this section, we compute the contribution of the circumstances in IOp. We use the decomposition based on the Shapley value (Shorrocks 2013) since this procedure measures the contribution of the circumstances in terms of the inequality index GE(0). The method entails estimating the marginal effects of each circumstance in all possible sets, and the weighted average of all marginal effects is taken as the contribution of the circumstance to IOp.
Figures 5 and 6 provide information about the contribution of the circumstances for the different regions for 2004 and 2010, respectively. In Figure 5, it can be seen that the most important circumstances in 2004 are referred to family background, parental education and parental occupation. With regard to the two remaining circumstances, immigrant only has a substantial weight in IOp in Aragón, Catalunya, and Canarias. In the case of age, this is only an important circumstance for La Rioja and C. Valenciana although its importance experiences a considerable reduction in 2010.

Contribution of circumstances to inequality of opportunity: 2004.
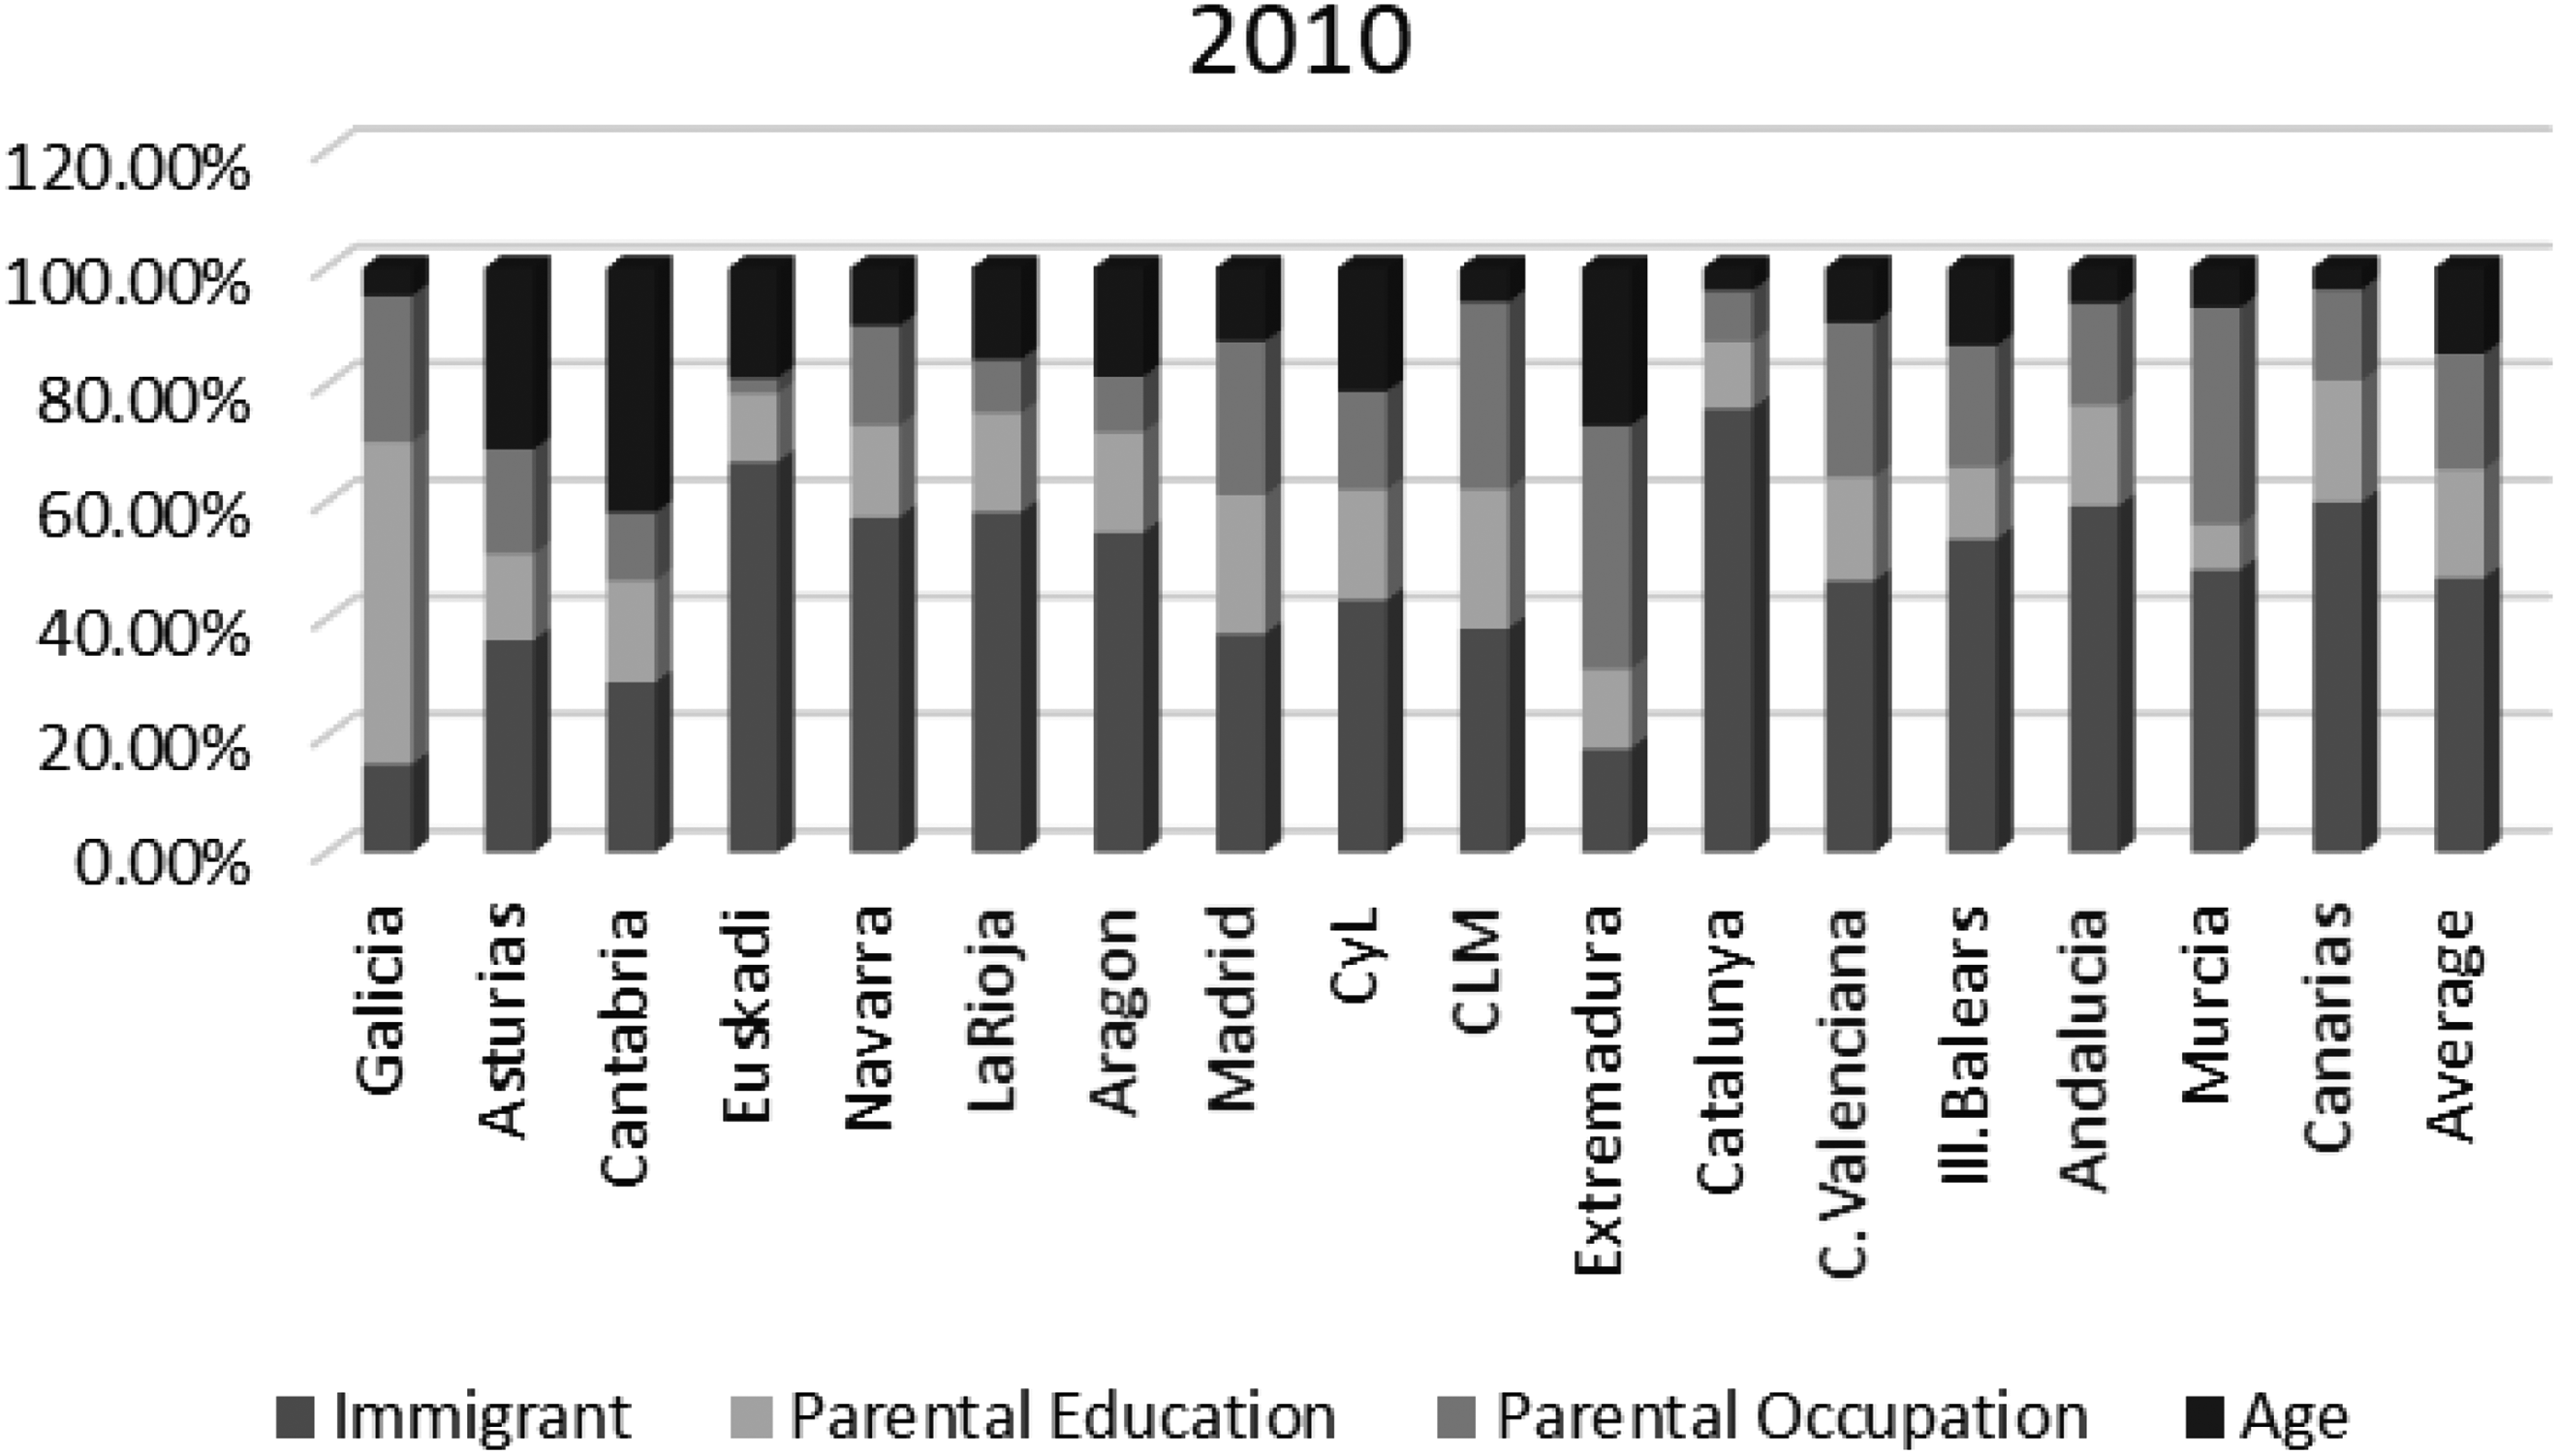
Contribution of circumstances to inequality of opportunity: 2010.
In Figure 6, we can observe a significant increase in the importance of immigrant in most regions. More specifically, in eight regions immigrant accounts for more than 50 percent of total IOp: Euskadi, Navarra, La Rioja, Aragón, Catalunya, Ill. Balears, Andalucía, and Canarias. Apart from them, it is the most important circumstance in six regions: Asturias, Madrid, Castilla y León, Castilla-La-Mancha, C. Valenciana, and Murcia. In the remaining three regions, it can be observed an increase in the contribution of immigrant as well, in the case of Galicia the increase is slight, and circumstances referred to family background are still the most important ones. For Cantabria, age experiences a high increase, and it becomes the most important circumstance; finally, for Extremadura, family background circumstances still being the most important ones in 2010 despite the rise of age and immigrant.
To sum up, these results evidence that inequality and IOp have increased during the period analyzed. This would suggest that the economic recession have had a negative impact in social inequalities. Moreover, we observe that there is not convergence between regions in terms of overall income inequality, but we find evidence of convergence with regard to IOp.
Likewise, the contribution of the different circumstances to IOp changed significantly over time, the importance of being an immigrant substantially increases, and according to the results of Tables 3 and 4, we can say that immigrant population experienced a downturn in their situation in terms of income.
The Importance of Being an Immigrant
We have seen in the previous section that being born in a foreign country puts individuals in a disadvantageous situation in terms of income compared to individuals who were born in Spain. It has been proven that being an immigrant is one of the most important circumstances shaping individuals’ opportunities.
Having this in mind, this section is devoted to analyzing the circumstance immigrant. Firstly, in the first part of this section, we examine the relationship between foreign immigrants’ situation with the evolution of both sort of inequalities and the contribution of the circumstance immigrant to IOp. Secondly, the latter part of the section analyzes whether the share of immigrants affects individuals’ perceptions toward immigrants.
How Is Foreign Immigration Related to the Increase in Inequality?
We analyze the evolution of the share of immigrants in total population by regions as well as the contribution of the circumstance immigrant to IOp with regard to income inequality and IOp to see whether an increase in the share of immigrants is a driver for the increase of inequalities. Table 6 presents the evolution of these indicators for the Spanish regions. It can be observed that except in the cases of Aragon and Extremadura, the share of immigrants in population increases, and, at the same time, the contribution of the circumstance immigrant becomes more important for IOp. We can also see that these changes are in the same direction than the evolution of IOp and overall income inequality for most regions. Thus, this could suggest that these indicators are related.
Contribution of Immigrant.
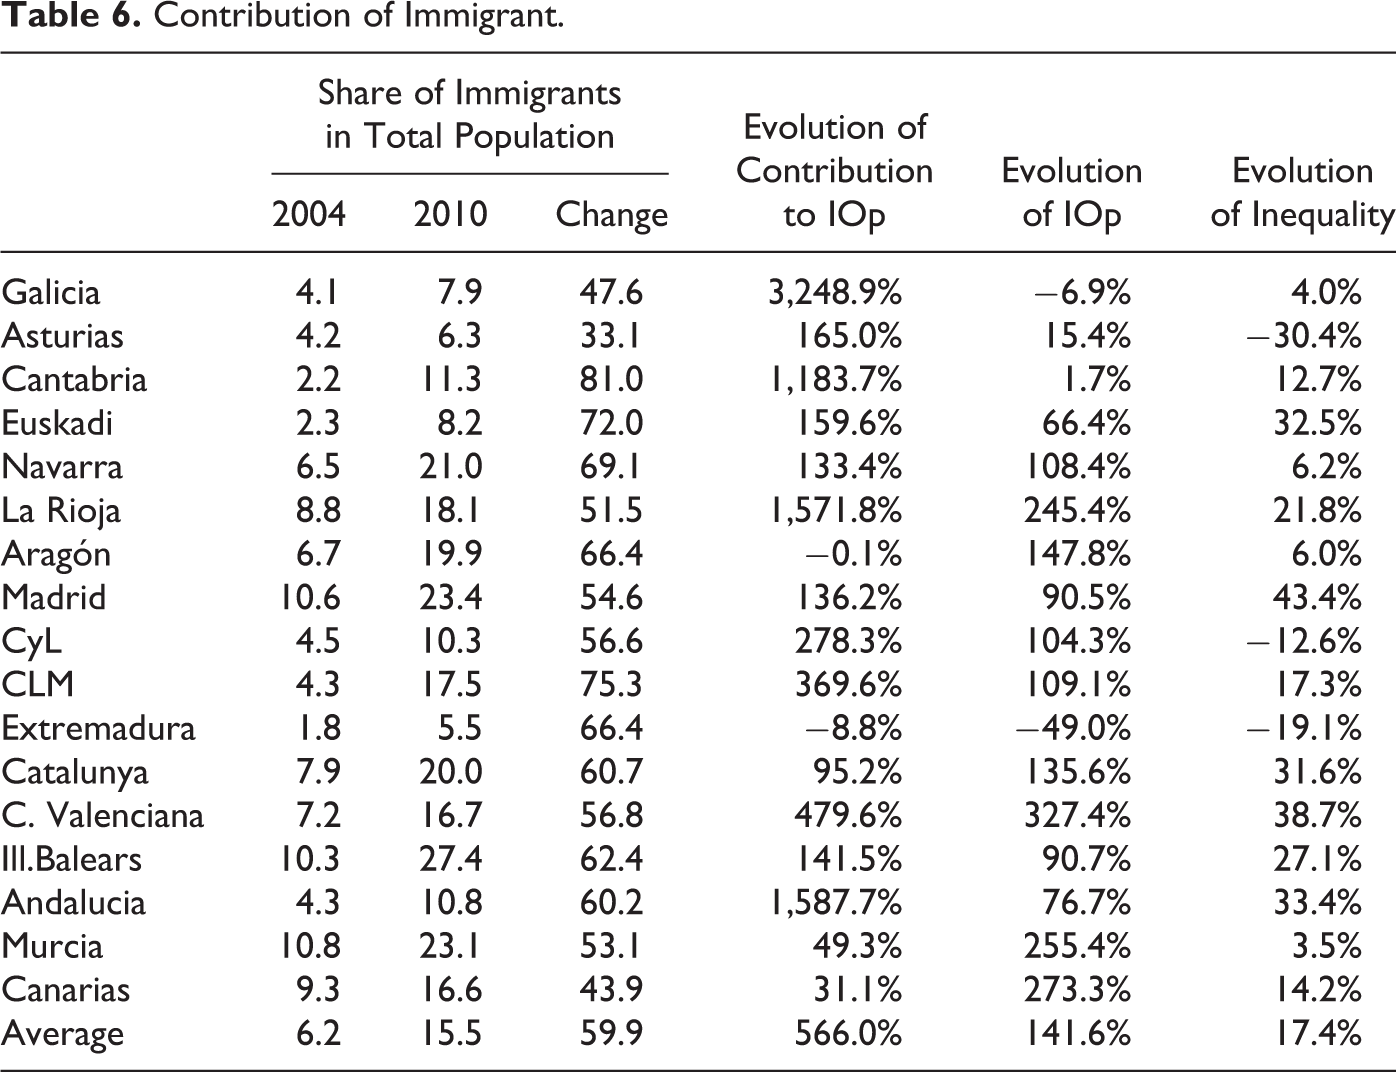
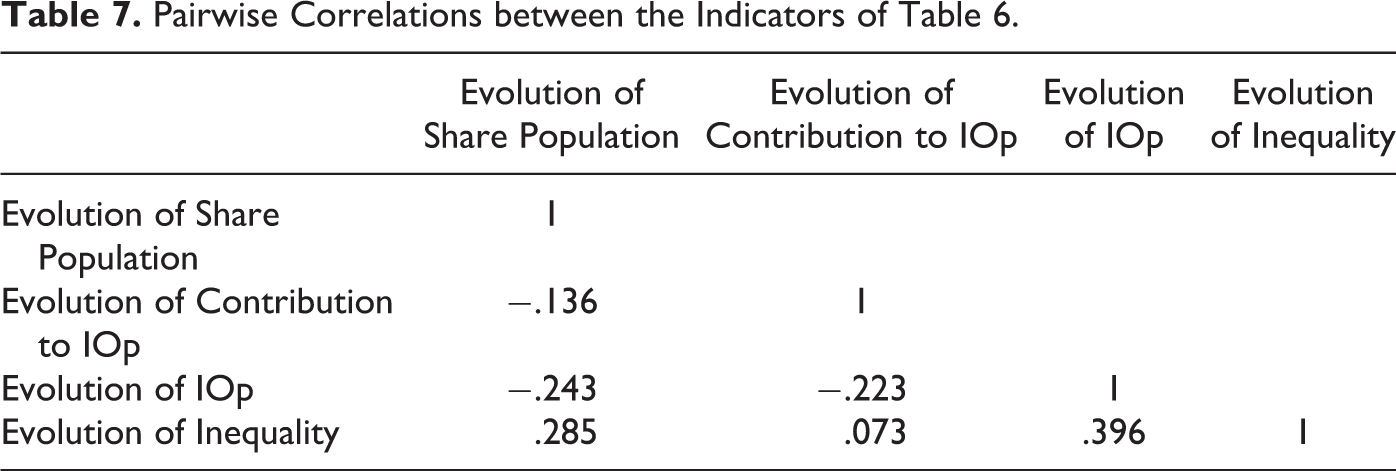
To test whether there is a relationship between them, we compute pairwise correlations between these variables. Table 7 shows the pairwise correlations between previous indicators of Table 6. For the majority of the regions, the evolution of the indices follows the same direction although the correlation coefficients between them are quite small, meaning that there is not a significant correlation between the variables analyzed. In addition, Figure 7 illustrates the relationship between the evolution of IOp and the share of the circumstance immigrant in total IOp. It can be seen that these two variables are uncorrelated, which corroborates the results of Table 7.
Pairwise Correlations between the Indicators of Table 6.

Relationship between the evolution of inequality of opportunity and the contribution of Immigrants.
This analysis shows that both the share of immigrant population and the contribution of the circumstance immigrant increase between 2004 and 2010. Changes are not related with the observed changes in inequality and IOp indicators although in general they follow the same direction.
This means that immigrants are worse in 2010 than in 2004. Nevertheless, this is not due to changes in income distribution, but it might be because their income is relatively lower than before. Results suggest that the increase of the contribution of being an immigrant in total IOp is only a matter of “intensity,” meaning that their income has been reduced during the period analyzed.
In order to see whether this is the reason of the downturn of immigrants’ situation, we compute two indicators: the share of immigrants which perceive an income below the regional median (disadvantaged individuals) and the share of immigrants with an income below the 60 percent of the regional mean, which is considered the relative poverty line (poor individuals). Table 8 shows the pairwise correlations between the evolution of these two indicators and the evolution of overall inequality and IOp.
Pairwise Correlations between the Evolution of Inequalities and Share of Immigrants below the Poverty Line and in a Disadvantaged Situation.

We can observe that the evolution of the share of disadvantaged individuals is positively correlated with the evolution of both income and IOp (.584 and .523), and the evolution of the share of individuals in situation of poverty is correlated with the evolution of the contribution of immigrants to IOp (.437).
Immigration Affects Individuals’ Perceptions Toward Immigration?
In this Section, we analyze the relationship between the individuals’ perception and the increase in the share of immigrants in total population. For this purpose, in Table 9, we provide the pairwise correlations between the variables of perception and the share of immigrants.
Pairwise Correlation between Overtime Changes in Perception Variables and in the Share of Immigrants.

If we look at the variables that measure perceptions into three different dimensions: economy, culture, and place of residence, it can be seen that the perception in economy is highly correlated with perceptions in culture and place (.52 and .44), whereas place and culture are almost uncorrelated (.092). Then, if we observe the correlations of these three variables with the evolution of the share of immigrants, we can see that the only significant correlation corresponds to the perception of culture (−.539). Figures 8–10 provide a more detailed illustration of the relationship of the perception variables with the share of immigrants.

Relationship between the share of immigrants and perception of its effect in the economy.
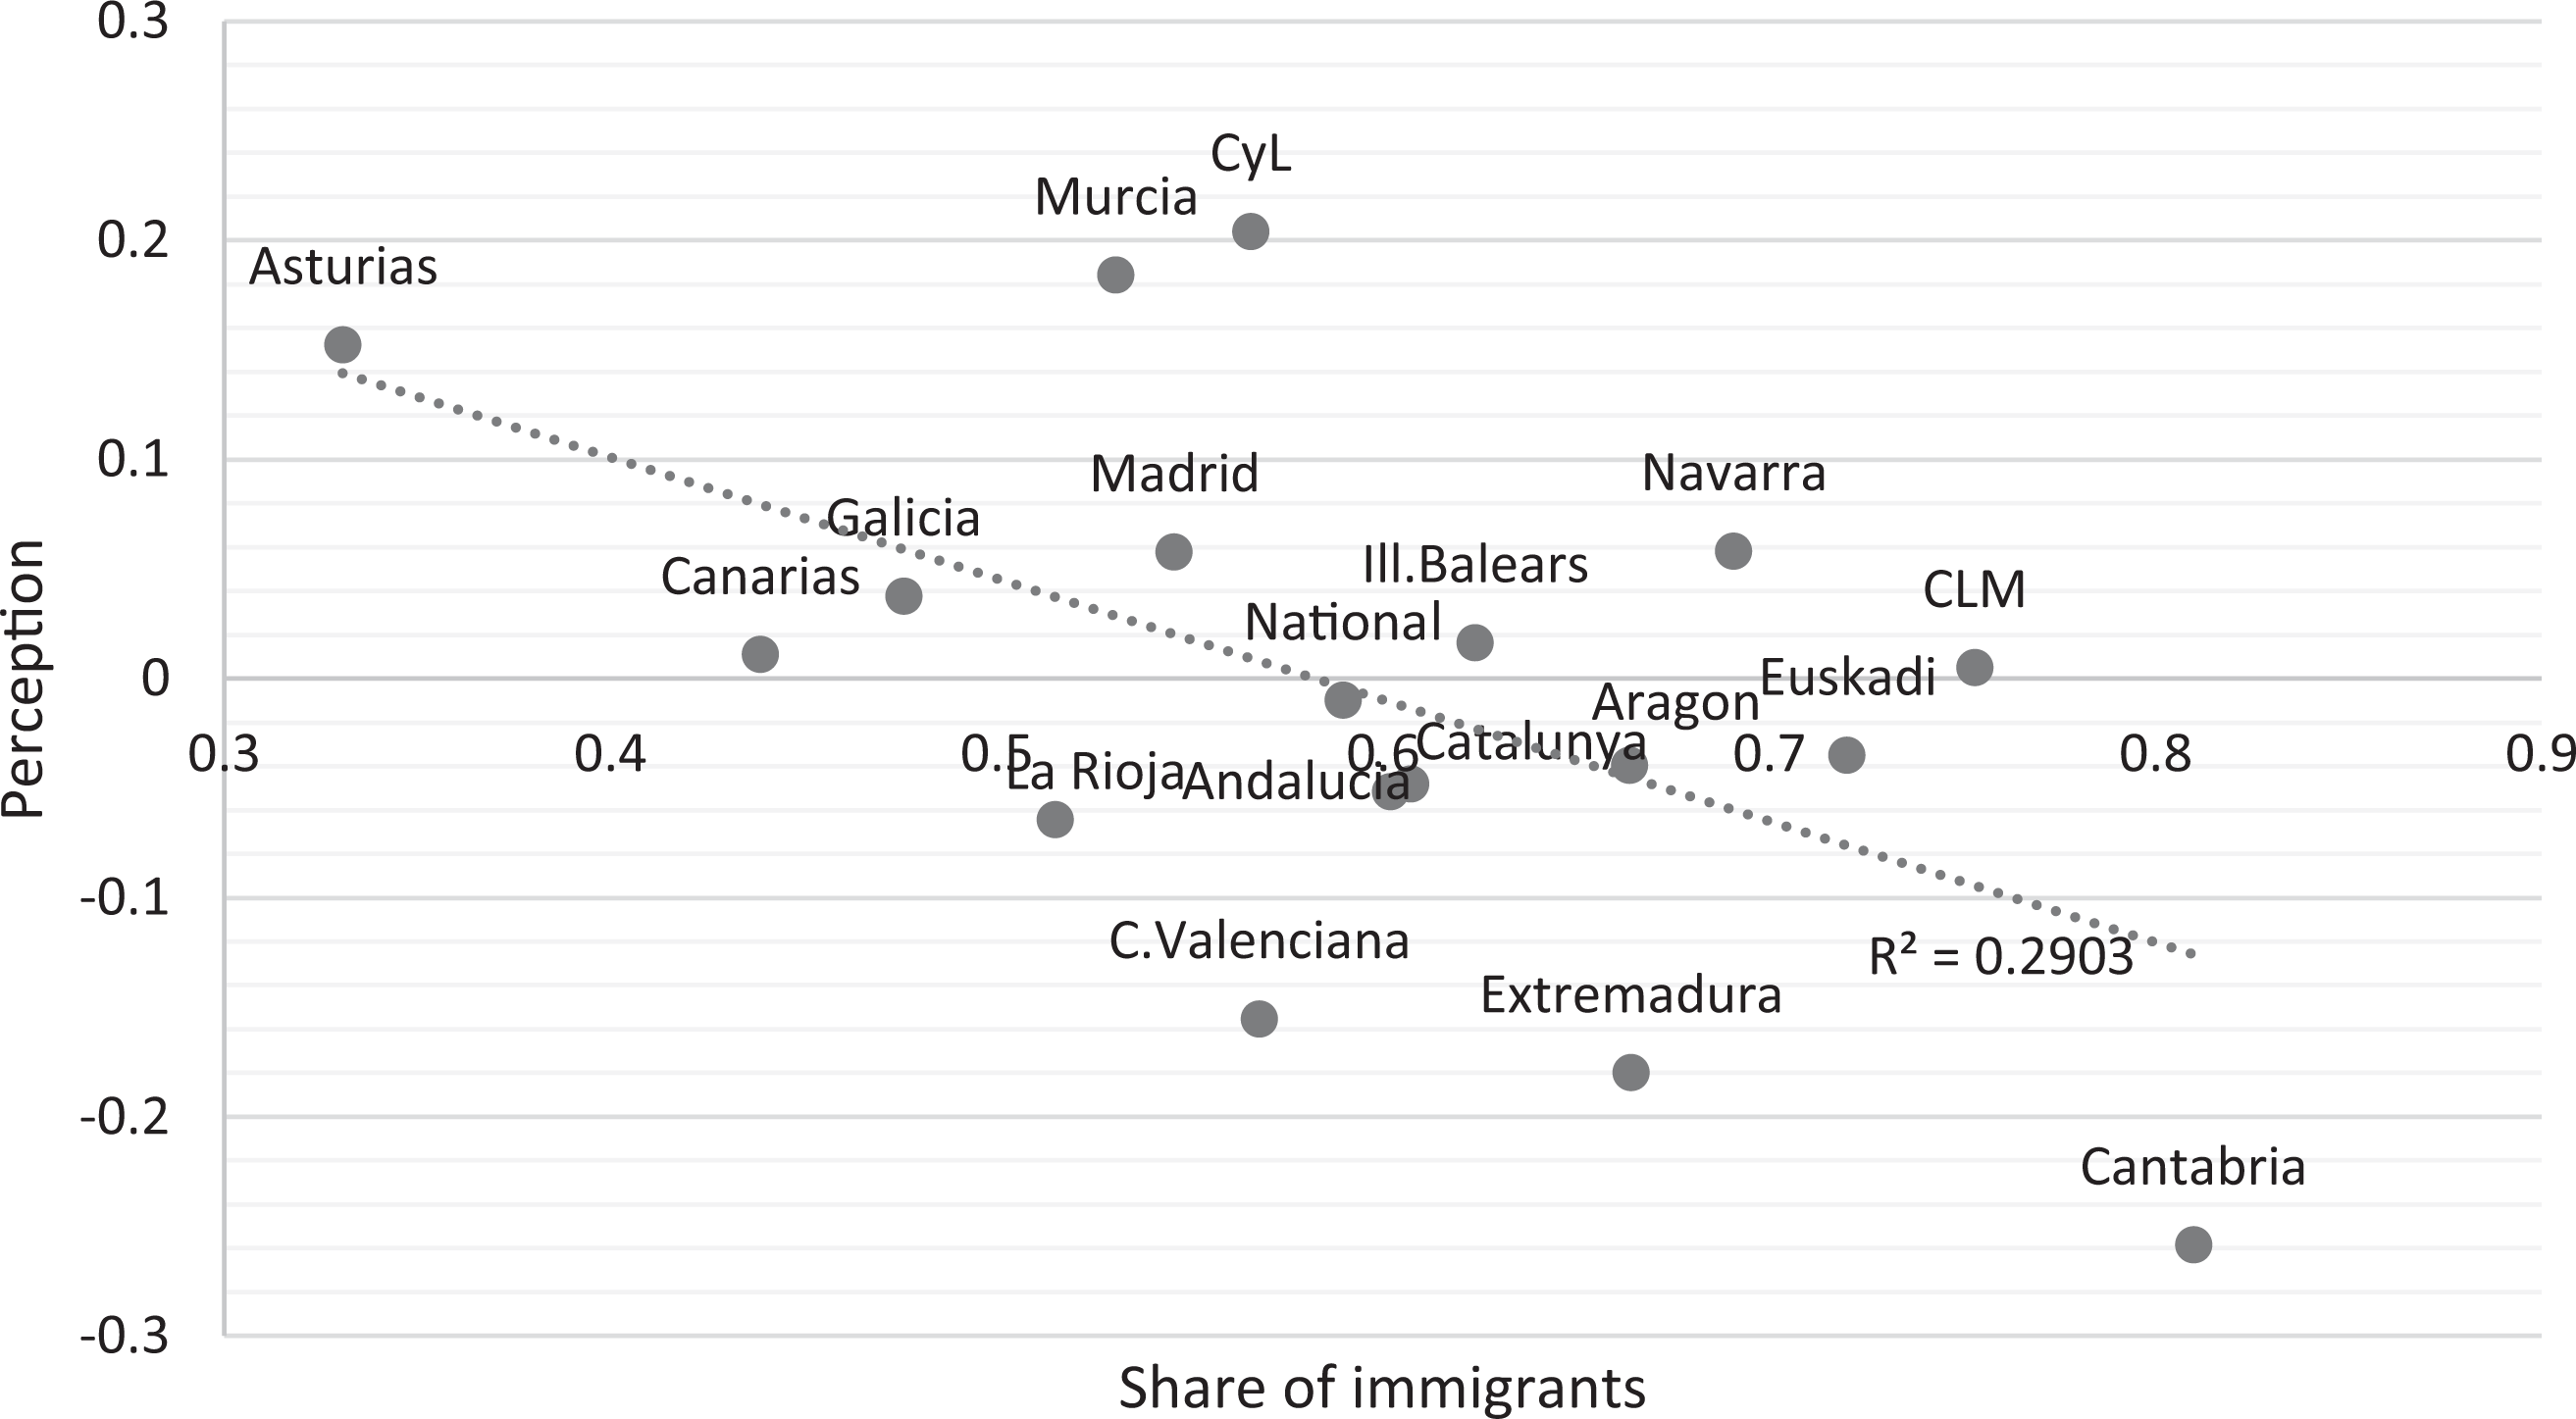
Relationship between the share of immigrants and the perception of its effect on culture.

Relationship between the share of immigrants and the perception of its effect on the place of living.
As it can be seen, only in Figure 9, we observe a significant relationship between the variables analyzed. The perception of the effect of immigrants on culture improves when the share of immigrants in the population increases. That is to say, when the share of immigrants in total population increases, individuals think immigrants enrich culture in the place of residence. For the remaining variables, we can conclude that differences in the perception inhabitants have about immigrants are not related with their share in total population, nor with the evolution or levels of inequality and IOp. 5
Summarizing, in this section, we have shown that the situation of foreign immigrants get worse from 2004 to 2010. This is not related with the increase in the share of immigrants, neither with individuals’ perceptions toward them. However, these results suggest that the increase of the contribution of being an immigrant in IOp and the increase in both inequalities are related with a decrease in immigrants’ relative income during the period.
Concluding Remarks
The vast majority of the empirical papers analyzing IOp does not pay much attention to the situation of foreign immigrants in terms of inequality and opportunities nor to the effect immigration have in individual perceptions. Despite the growing importance of migration flows, little attention has been paid to immigration in the literature of IOp even though this variable has an unquestionable nature as circumstance.
Indeed, as we have shown in this article, the place of birth of individuals plays a very important role defining their opportunities and determining the level of IOp in the Spanish regions, and our article evidences a lack of opportunities for immigrants in Spain.
Moreover, the empirical analysis of this article provides evidence of a significant increase in both income inequality and IOp between 2004 and 2010 in most of the Spanish regions. In addition, our analysis shows convergence between regions in terms of IOp, whereas we do not find evidence of convergence regarding income inequality.
With regard to the contribution of the different circumstances to IOp, we observe that, as expected, family background circumstances (parental education and parental occupation) play a decisive role in the amount of IOp in each region. Nevertheless, we cannot ignore the contribution of the variable referred to the place of birth (immigrant), which shows a significant increase in its contribution to total IOp, as shown at a national level by Suárez-Álvarez and López-Menéndez (2018a). Furthermore, in many cases, family background circumstances are less important than the place of birth.
Likewise, we analyze the perception individuals have about immigrants in three dimensions, and, although some results are not significant, we find a relationship between the share of immigrants and individuals’ perceptions about the effect of immigrants in the cultural life. We observe that as the share of immigrants in the regions increases, there is an improvement in the perception of their effect in cultural life. This finding suggests that becoming more familiar with immigrants enhances people’s opinions about their ideas and customs.
To sum up, we claim that migration flows, and foreign immigration in particular, should be taken more into account when computing IOp in a society. Our analysis shows a great importance of the place of birth in IOp, which cannot be overlooked, since the circumstance immigrant is a major driver in the worrying increase of IOp experienced by the Spanish regions between 2004 and 2010.
Footnotes
Appendix
Declaration of Conflicting Interests
The author(s) declared no potential conflicts of interest with respect to the research, authorship, and/or publication of this article.
Funding
The author(s) disclosed receipt of the following financial support for the research, authorship, and/or publication of this article: Ana Suárez Álvarez acknowledges the financial support of the Spanish Ministry of Science [FPU 16-01201].
