
Abstract
The spillover effect serves as the basis of regional collaborative innovation. Existing research on innovation spillover focuses on the overall impact of a region's innovation factors on local and other regions' innovation activities. However, re-spillover may occur since the flow of innovation factors between any two regions may influence the innovation in third-party regions. This study quantifies labor flow, capital flow, and institutional learning between regions in China using a gravity model and a social network analysis model, and then applies a spatial econometric model to investigate innovation spillover and re-spillover. The results show that re-spillover can better explain levels of regional innovation. Capital, government support, labour flow, capital flow, and institutional learning have a positive spillover effect on local innovation, while labour flow also has positive spillover effects to other regions.
Introduction
Innovation is the determinant of economic growth (Romer 1990) and an important engine of regional development (Wang et al. 2019). However, it is increasingly difficult for a single innovation subject to assume all innovation activities in the current complex economic environment characterized by burgeoning social systems. Interaction with productive individuals can produce better results (Buera and Oberfield 2020) because close ties can promote learning among those individuals (Howard et al. 2016). Therefore, interaction between innovation subjects has a profound impact on economic development (McCann and Simonen 2005). People hope to create synergy through competition, cooperation, and complementarity (An et al. 2014). Governments also seek collaborative innovation by directly subsidizing enterprises and indirectly supporting universities and research institutions (Ji and Miao 2020). Collaborative innovation is a development strategy to achieve synergy by optimizing organizational structures (Kodama 2015), which is not a new phenomenon (Ketchen, Ireland, and Snow 2007). For the innovation subject, collaborative innovation provides the opportunity to acquire knowledge and market information from external sources (Heil and Bornemann 2018), and the deeper and broader cooperation that may occur can further promote innovation when the collaboration effect is enhanced (Liu Ying and Wu 2017). Accordingly, if the innovation subject cannot obtain knowledge and market information externally, that subject may be eliminated (Rowley, Behrens, and Krackhardt 2000; Emden, Calantone, and Droge 2006). For the innovation system, collaboration can improve the frequency of knowledge collision and integration (Sternberg 1996), enlarge the innovation effect (Xu, Yan, and Xiong 2019), improve innovation efficiency (Fan, Lian, and Wang 2020), and create public value (Neumann et al. 2019). The challenge of studying innovation which existing research have to face is that the knowledge mobility and the complexity of technology make doing so difficult (Scuotto et al. 2020), and the influencing factors on innovation even involve third-party governance (Bai et al. 2020), culture (Barboza and Pede 2012), and reputation (Wang et al. 2020). However, the basic logic of collaborative innovation remains the spillover effect of innovation, whether it is knowledge spillover or technology spillover.
Spillover effect refers to a subject that obtains (Li et al. 2019) and uses (Amir 2000; Gama, Maret, and Masson 2018) innovation from another subject at low cost to reduce local innovation cost (Klette and Kortum 2004). Innovation is not evenly distributed in space, and it is concentrated in some places (Paci and Usai 2000). With the accumulation of innovation (Lööf and Nabavi 2015) and quality ladder structures (Acemoglu et al. 2013), innovation will produce spillover effect. The work of Scott (1988), Porter (1990), and Krugman (1991) drew attention to innovation spillover. Because of innovation spillover, the surrounding areas with strong innovation capability can obtain the space discount version of innovation (Desmet and Hansberg 2014). Sometimes, the innovation spillover obtained externally can replace the internal innovation efforts of an entity (Audretsch and Feldman 1996). Therefore, the innovation capacity of a region depends on the region itself, but also on other regions (Asheim, Smith, and Oughton 2011). According to the theory of spatial correlation and spatial spillover, innovation between two regions are interrelated and realized through spatial spillover. However, the existing research considers this type of spillover to be point to point, so does the ‘line’ of innovation connection between the two regions also have spillover? If there are only seven cities in a closed country (as shown in Figure 1(a)), the innovation spillover from city A to city B can be expressed as a solid blue line, that is, the spillover line. In the process of innovation, the blue solid line will pass through city C and may also affect other cities adjacent to city C, even those cities not adjacent to city C. Existing studies only focus on the spillover of cities (points) to cities (points) and do not consider that the spillover line between two cities (points) may also produce spillover. (a) The spillover line between cities. (b) Network innovation spillover between cities.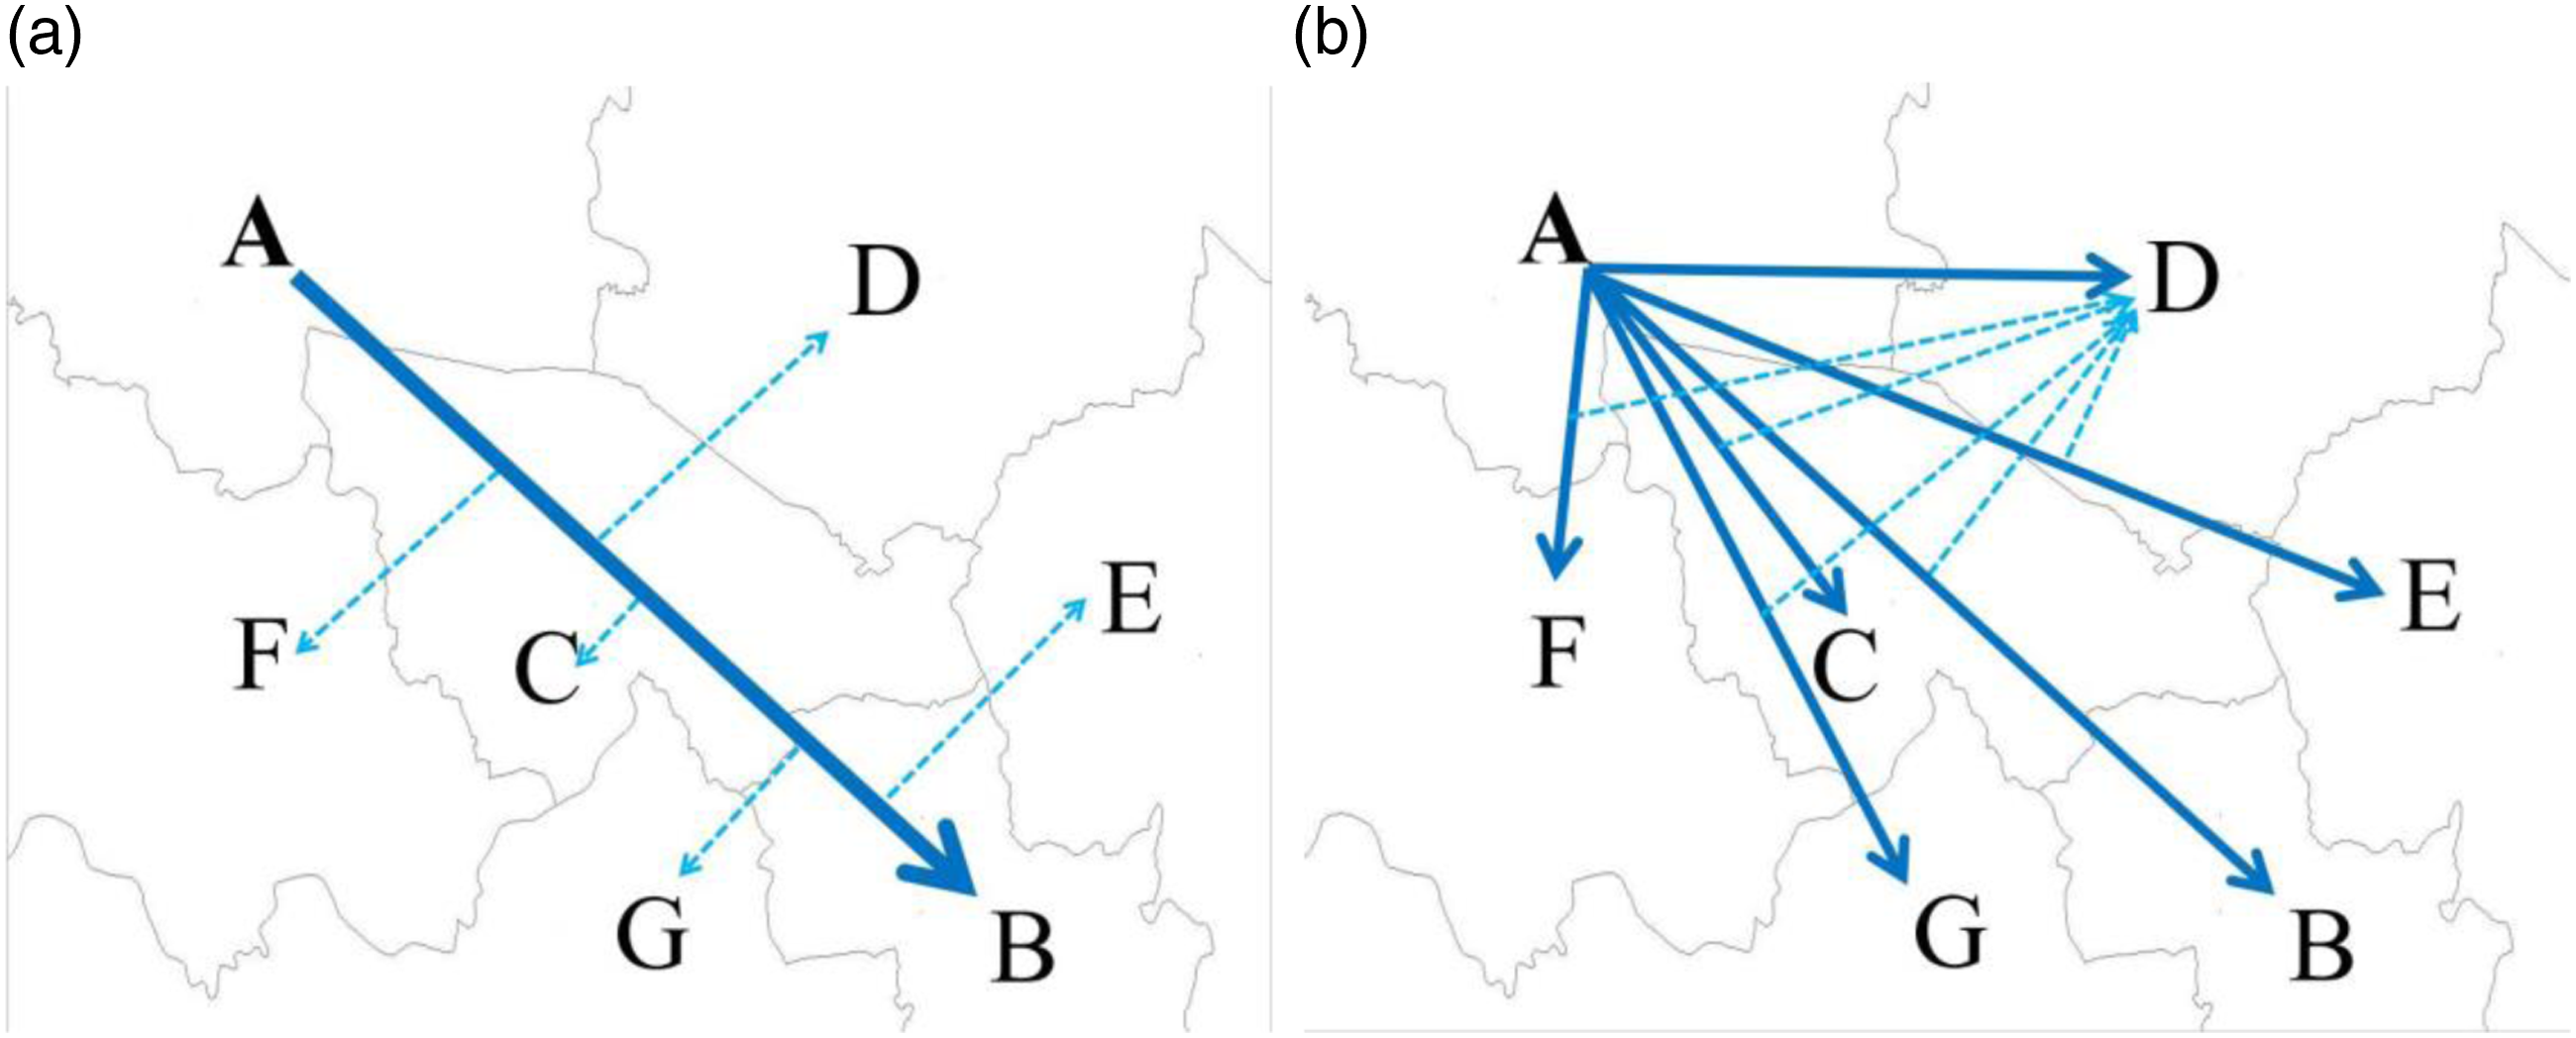
If the cities themselves produce innovation spillover, and the innovation links between cities produce innovation spillover also, the external innovation impact of a city originates directly from the innovation spillover of other cities and from the secondary innovation spillover of the spillover line in the innovation network. Taking cities A and D in Figure 1b as examples, the innovation spillover of city D is directly affected by city A and is expressed as AD. At the same time, city A overflows to other cities, such as city B, city C, city E, city F, and city G, which may further affect city D, as shown in the dotted line in Figure 1. Therefore, the innovation spillover of city A to city D includes two parts, direct innovation spillover and secondary innovation spillover of the spillover line through the innovation network. To verify the existence of linear innovation spillover (the solid line in Figure 1b) and the spillover line in the innovation network spillover (the dotted line in Figure 1b), this study conducts an empirical analysis.
Literature Review
Spillover From Points
Although spillover of innovation is closely related to spatial location, growth theory does not take space into account (Lucas 1989), and Jaffe (1989)’s pioneering achievements have attracted researcher attention to the spatial dimension of innovation externality. The spatial dimension of early innovation spillover mainly uses the knowledge production function and patent cooperation data (Autant-Bernard, Fadairo, and Massard 2013). Based on the first law of geography that all things are related to other things, but closer things are more related to farther things (Tobler 1970), spatial econometrics emerged in the 1970’s to study the treatment of spatial data. Since then, with the application of spatial econometric models in many fields (Kelejian and Piras 2017), these models have been widely applied in the research on innovation spillover (Autant-Bernard 2012). Spatial econometric models explain regional economic growth from two aspects, local innovation and external innovation (Furková 2019), which leads to the testing of a large number of innovation spillover characteristics and the analysis of the results using spatial econometric models. For example, for developed economies, Hammadou, Paty, and Savona (2014) and Furková (2019) used spatial econometric models to analyse innovation spillovers in the EU. Recognizing that regional spillovers are limited by national boundaries (Moreno-Serrano, Paci, and Usai 2005), some studies pay more attention to the domestic characteristics of innovation spillovers (Acs, Audretsch, and Feldman 1994). In Europe, spatial econometric models have explored innovation spillover in countries such as France (Autant-Bernard and Lesage 2011), Italy (Cardamone 2018; Benedetti, Palma, and Postiglione 2019), Spain (Cabrer-Borrás and Serrano-Domingo 2007), and Hungary (Varga 2007). In emerging countries, China’s innovation spillover studies at the provincial level (Wang et al. 2016b), the urban agglomeration level (Sheng et al. 2019), and the urban level (Ning, Wang, and Li 2016) also adopt spatial econometric models. At present, the research on innovation spillover focuses on two aspects: one is analysing the influencing factors of innovation spillover through spatial econometric models, including environmental regulation and foreign direct investment (FDI) (Feng et al. 2019). On the other hand, research analyses the explanation of innovation spillover according to other phenomena, including social development (Moralles, Silveria, and Rabelatto 2018), ecological environment (Liu 2018; Benedetti, Palma, and Postiglione 2019), and tourism (Romão and Nijkamp 2019). However, spatial econometric models abstract the enterprise or region as a point, explore the externality of this point to the whole system, and ignore the connection between points.
Connection Between Lines
Spatial econometric models focus on the analysis of the spillover effect of innovation subjects, but does not quantify the innovation relationship between the subjects. Spillover is not unintentional, but a large component is the result of the interaction between innovation subjects (Zucker, Darby, and Brewer 1998; Breschi and Lissoni 2001; Ott and Rondé 2019). With the development of technology, innovation has changed in spatial form (Cao, Zeng, and Ye 2018), from ‘local space’ to ‘flowing space’ (Castells 1996; Ai and Miao 2010). Because knowledge is invisible, and its movement is difficult to observe (Keller and Yeaple 2013), quantifying the innovative connection between subjects is complex. However, the gravity model offers a new perspective. The gravity model originated from Newton’s law of universal gravitation and has been gradually applied to the field of social science to explain various behaviours in spatial interaction (Chen and Huang 2018). In economic research, the gravitation model is widely used to analyse the flow of goods (Cantore and Cheng 2018), services (Shepherd 2019), and trade (Carrère 2006; Kabir, Salim, and Al-Mawali 2017) in international trade. International trade is also accompanied by the flow of innovation factors, so relevant studies (Márquez-Ramos and Martínez-Zarzoso 2010; Kandilov and Grennes 2012; Cipollina, Demaria, and Pietrovito 2016) include innovation in the gravity model to analyse international trade issues. In the study of innovation, interregional cooperation is affected by distance attenuation (Boschma 2005), and knowledge flow among subjects is limited by geographical factors (Scherngell and Hu 2011). Correspondingly, spatial proximity has a significant impact on the intensity of cooperation between subjects (Katz and Martin 1997). On the one hand, regional resource endowments and gravitational factors formed by endowments can explain regional innovation connections (Hjaltadóttir, Makkonen, and Mitze 2020). On the other hand, because the gravity model is not limited by the number of observations, it is more suitable for static comparative innovation cooperation (Hardeman et al. 2014). Therefore, the gravity model is gradually applied to innovation cooperation (Bröcker and Mitze 2019). The research on North America (Hardeman et al. 2014), the European Union (Hjaltadóttir et al. 2020), and China’s provincial (Scherngell and Hu 2011) and municipal levels (Wang Yang and Qin 2020) also reflect the general applicability of the gravity model to innovation connection.
Construction of the Area
Research on innovation has been criticized for neglecting the impact of innovation networks by focusing on the functional level exclusively (Capello and Lenzi 2018a, 2018b). The functional level has been the focus because the economic and social value of innovation depends on its internal benefits and the benefits to the network (Arieli et al. 2020). The cooperation of multiple agents is a dynamic complex network (Yström and Agogué 2020), and an innovation network is the carrier of innovation flow (Hua and Wang 2015). Regarding innovation networks as social networks (Min, Kim, and Swang 2020) can explain the regional differences in innovation capability (Lawson and Lorenz 1999; Quatraro 2009). For innovation subjects, a large number of partners with strong innovation ability provide a better innovation environment for themselves (Davis and Dingel 2019), and integrating into innovation networks can help innovation subjects obtain more resources (Sternberg 2000; Borgatti and Foster 2003). Innovation networks promote information exchange, technology transfer (Gardet and Mothe 2011) and knowledge creation (Nieves and Osorio 2013), and innovation is spread through networks (Folke et al. 2005; Aswegen and Retief 2020) and integrated by networks (Harrisson and Laberge 2002). Therefore, innovation networks direct future innovation research (Rothwell 1992). The main methods used to study innovation networks are simulation and social network analysis. Simulation is an agent-based system dynamics model (Hua and Wang 2015; Mao et al. 2020) that sets many rules to ensure that the results resemble the facts. Social network analysis is based on the dual characteristics of innovation space (Caccamo 2020). For innovation social network analysis, one type of research uses patent cooperation to describe the structural characteristics of the innovation network, whose objects cover the United States (Mukherji and Silberman 2013), China (Wang et al. 2016a), and the world (Liu et al. 2017). However, due to the protections of patent intellectual rights (Cao, Zeng, and Ye 2019), other informal network cooperation (Brown and Duguid 1991), and tacit knowledge (Howells 2002; Gertler 2003), patent cooperation cannot reflect the overall innovation network dynamic (Cohen and Kozak 2002). The other type of research is relational data constructed by gravity models (Wang Yang and Qin 2020) to analyse the network location of innovation subjects. The network location reflects the connection between one innovation subject and other innovation subjects (Fang et al. 2014). The higher the innovation subject’s central position in the innovation network, the more benefits the subject has (Leenders and Dolfsma 2016), and the more innovation it can generate (Powell, Koput, and Smith-Doerr 1996; Tsai 2001).
Summary
From the existing research, we find that the spatial characteristics of innovation have been analysed from the perspective of three dimensions: point, line, and area, and through the research of innovation spillover of spatial regression, innovation connection of gravity models, and social innovation network analysis. However, the focus of all types of analysis is not the same. The innovation spillover research focuses on the effect of a point on itself and the total effect on other points (as shown in Figure 2(a)) but ignores the linear influence between points. Innovation connection research focuses on quantifying the connection between these points (as shown in Figure 2(b)) although the connection has not actually occurred but has the potential to do so. The research on innovation networks only focuses on the network influence created by points and lines on another point (as shown in Figure 2(c)). However, connection between points occurs through the lines that join those points, and the network formed between lines will also act on those points. Therefore, all the spatial characteristics of innovation must be considered when analysing the spatial effect of innovation. Spatial characteristics of innovation.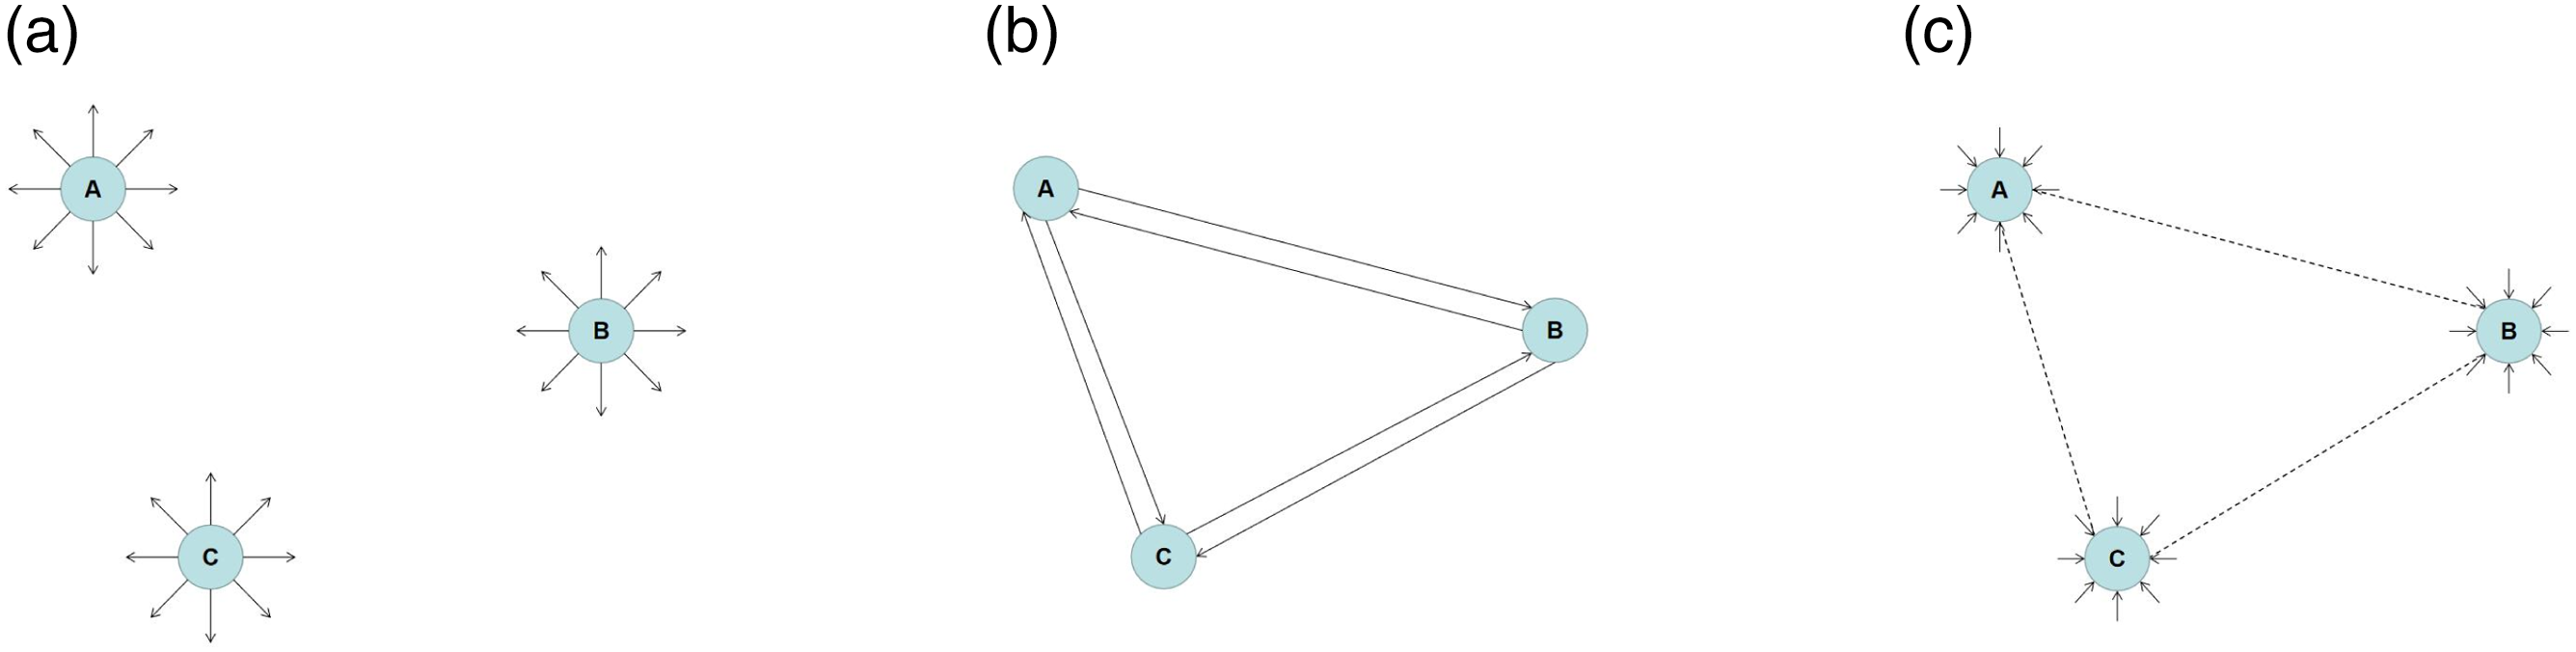
Models and Data
The Spatial Econometric Model
The spatial econometric model is the main tool used to analyse spatial spillover. Spatial econometric models can include geographical location information of elements in the model by setting a spatial weight matrix. The basic spatial econometric models include spatial auto regression (SAR), the spatial errors model (SEM), and the spatial Durbin model (SDM) (Anselin, Le Gallo, Jayet 2008), as shown in formulas (1), (2), (3).


Here, y is the dependent variable. In terms of measuring regional innovation, patents and innovation have a strong positive correlation (Guo 2015), which is an important factor of innovation diffusion (Keller 2004). Although patents have limitations (Forman, Goldfarb, and Greenstein 2016), they are still the best tool to measure intangible knowledge (Hall, Adam, and Manuel 2005), and many studies have chosen patents as an alternative indicator of innovation (Anselin, Varga, and Acs 1997; Bottazzi and Peri 2003). Therefore, the number of patents is chosen as the explanatory variable to reflect regional innovation ability.
X represents the independent variables and control variables, and β is the influence coefficient. There is no unified theory for organizational elements in collaborative innovation research (Ollila and Yström 2016), but considering that the flow of labour and capital provides convenient conditions for innovation flow around the world (Kaygalak and Reid 2016), this study selects capital and labour as core explanatory variables. Accordingly, labour flow promotes the creation of new knowledge and the spread of innovation (Almeida and Kogut 1999) while capital flow also promotes the spillover of knowledge and the transfer of technology (Blomström and Kokko 1998). Therefore, labour and capital flows are the core explanatory variables of this study. In addition, government intervention is considered key to innovation in developing countries (Dunning, Kim, and Park 2007), and institutional proximity has a positive impact on the flow of innovation (Capello 1999; Knoben and Oerlemans 2006). This study also selects institution and institutional learning (i.e. institutional flow) as core explanatory variables. Labour force, capital, and government support are respectively represented by the number of people engaged in scientific and technological innovation, the stock of fixed assets, and the scientific and technological expenditure in the government’s financial expenditure. Labour flow, capital flow, and institutional learning are represented by the flow of the number of people engaged in scientific and technological innovation, the stock of fixed assets, and the scientific and technological expenditure in the government’s financial expenditure. Talent education, industrial structure, infrastructure, and the level of opening-up are selected as control variables, which are respectively expressed by education expenditure in local general public budget expenditure, the proportion of secondary industry in GDP, the number of Internet broadband access users, and the total amount of FDI.
W is the spatial weight matrix, and ρ is the spatial autoregressive parameter, which measures the influence of Wy on y. Wxγ is the influence of adjacent variables, and γ is the corresponding coefficient. ε is the disturbance term, and μ is the spatial disturbance term while λ is its spatial influence coefficient.
To solve the difficult problem of explaining the coefficients of spatial econometric models, Lesage and Pace (2009) proposed direct effects, indirect effects, and total effects. For the spatial Durbin model, the model can be rewritten as

I
n
is the unit matrix. If

The indirect effect is the average of the non-diagonal elements of the matrix. If

The total effect is the sum of the direct effect and the indirect effect, which can be expressed as follows:

The Gravity Model
Before using the spatial econometric model to analyse the spillover of innovation, we first quantify the spillover line between cities by the flow of the number of people engaged in scientific and technological innovation, the stock of fixed assets, and the scientific and technological expenditure in the government’s financial expenditure. The gravity model quantifies the strength of the connection between two points. Although the connection strength is not the actual spillover, it reflects the potential spillover level to a certain extent. Therefore, this study chooses the connection strength to roughly reflect the bandwidth of the spillover line.
Gravity model is used to construct the spillover line’s characteristics of talent, capital, and institution. The basic gravity model can be expressed as follows:
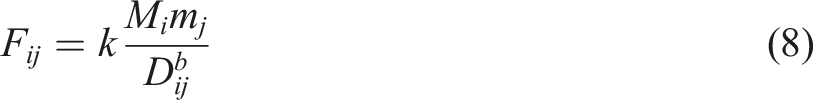
In formula (8), F ij is the innovative connection strength, the bandwidth of the spillover line, between city i and city j; M i and m j, respectively, represent the variables selected by city i and city j according to different measurement dimensions; D ij represents the distance between city i and city j; b is the distance attenuation coefficient, which generally takes 2; and k is the empirical constant, which generally takes 1.
The spillover of innovation includes many elements of innovation, among which labour, capital, and the government system are the input elements of scientific and technological innovation and the most representative variables of the dynamic flow of innovation elements between cities, which are most likely to have an impact on the innovation links between cities. Therefore, this study measures the bandwidth of the spillover line among cities for the three dimensions of labour flow, capital flow, and institutional learning, which correspond to the three input factors of scientific and technological innovation. The formula is as follows:
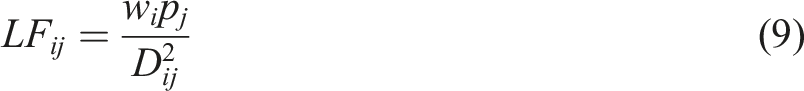
In formula (9), w
i
is the wage level of city i, which is represented by the average wage of on-the-job employees. Chen et al. (2020) found that people with the highest incomes in China are more than four times more likely to innovate than others. p
j
is the number of innovative talents of city j, which is represented by the number of employees engaged in science and technology; and LF
ij
is the attraction intensity of city i’s wage level to city j’s labour flow. This formula expresses the flow of labour to the cities with higher wages; that is, the approximate bandwidth of the labour spillover line.
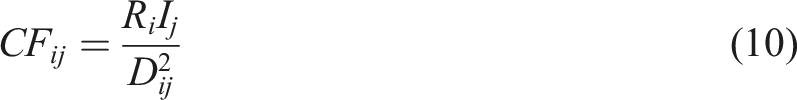
In formula (10), R
i
is the market activity of city i, which is represented by the total retail sales of social consumer goods; I
j
is the capital strength of city j, which is represented by the total fixed asset investment of the whole society; and CF
ij
is the attraction intensity of city i’s market activity to city j’s capital flow. This formula expresses the flow of capital to the cities with an active market environment; that is, the approximate bandwidth of the capital spillover line.
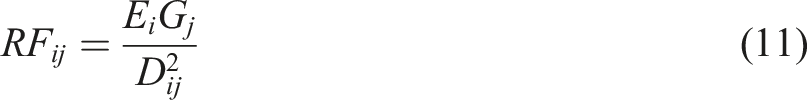
In formula (11), E i is the innovation expenditure of city i, which is represented by the science and technology expenditure in the public finance expenditure; G j is the economic benefit of city j, which is represented by the gross regional product; and RF ij is the institutional learning attraction intensity of city i to city j. This formula expresses that institutions provide learning opportunities to the cities with a higher economic level; that is, the approximate bandwidth of the institutional learning spillover line.
The interaction between innovation subjects is influenced by proximity, which is emphasized by economic geography and related disciplines (Hansen 2014). Relevant studies have been analysed from the perspective of geographical proximity, economic proximity (Conley and Ligon 2002), and technical proximity (Fischer and Lesage 2008). Geographical proximity can promote the flow of innovation (Ter wal and Anne 2014), which is the precondition of innovation spillover (Autant-Bernard and Massard 2009), and the best method of communication (Desrochers 2001). Adjacent subjects are more likely to have innovation cooperation (Hoekman Franken, and Tijssen 2010), so D in this paper reflects geographical distance.
Social Network Analysis
Although the gravity model can reflect the strength of the relationship between cities, the quantitative results are in the form of a matrix whereby each city corresponds to n-1 connections, which cannot be calculated by the spatial econometric model. If we sum the bandwidth of each city’s corresponding spillover line simply, the results will have strong endogeneity with the original input index. Because attribute data are used in urban research and relational data are used in social network analysis, attribute data can be transformed into relational data using a modified gravity model. Then, the spatial connection intensity data can be integrated through network analysis. Attribute data are used in urban research while relational data are used in social network analysis. Therefore, attribute data can be transformed into relational data with the help of a modified gravity model, and the data of the approximate bandwidth of the spillover line can be integrated through network analysis.
The urban innovation network is defined as the explicit or implicit scientific and technological knowledge network formed by formal or informal cooperation (government, research institutions, and companies) within or between cities, which represent crucial support to enhance regional innovation capability. A social network is a geometric shape composed of multiple points and connecting lines, which is consistent with the analysis of an innovation network. The social network analysis method was first proposed by Brown in 1930. The method uses quantitative indicators to describe the interactive structural relationship and development changes between individuals to reflect the overall characteristics of the network structure and reveals the status of individuals in the network structure. Social network analysis provides a series of indicators to explain the innovation network. This study selects centrality to study the spatial structure and evolution characteristics of the spillover line among urban innovation networks.
Reflecting the importance (Wang et al. 2015) and status (Ibarra 1993) of the subject in the network, centrality is a quantitative analysis of individual power, which is used to measure the position of a node in the network mainly including degree centrality, intermediate centrality, and proximity centrality. In this study, degree centrality is selected to measure the central position of each city in the innovation network to simplify the form of the spillover line. If a city has innovation spillover with multiple cities, this indicates that the city is in a central position within the innovation network. The formula is as follows:

In the formula, DC i is the relative degree centrality of city i, which refers to the ratio of the absolute degree centrality of city i to the maximum possible degree of points in the network. r ij represents the number of spillover lines between city i and other cities; that is, the absolute degree centrality of city I, and n is the number of innovation cities.
Data and Samples
Macro level innovation is abstract, and micro level research focuses more on fitting the technology diffusion curve (Comin and Hobijn 2010) while cities lie between the macro and micro level. Cities are the main driving force of space (Baycan, Nijkamp, and Stough 2017), but the understanding of urban spillovers are a much less significant driver (Fujita and Krugman 2004). The research of Audretsch and Feldman (1996) showed that it is more appropriate to select cities to study the spillover effect of innovation. Therefore, city level data are more suitable for this study.
In 2008, Shenzhen was determined to be the first national innovative city in China. By 2020, 78 innovative cities were approved. These cities have absolute advantages in both the level of economic development and innovative resources. Due to the availability of data and the late establishment of some innovative cities, this study selects 75 innovative cities in mainland China (excluding Shihezi, Changji and Lhasa). From 2003 to 2017, there were 285 cities in mainland China with long-term and comprehensive statistical data while there were 210 non-innovative cities. Taking 2017 as an example, 75 innovative cities have higher levels of economic development and larger urban areas than 210 non-innovative cities, and the labour and financial expenditures of innovative input and patents for innovative output were far higher than those of non-innovative cities (as shown in Figure 3). Comparison between innovative city and non innovative city in 2017.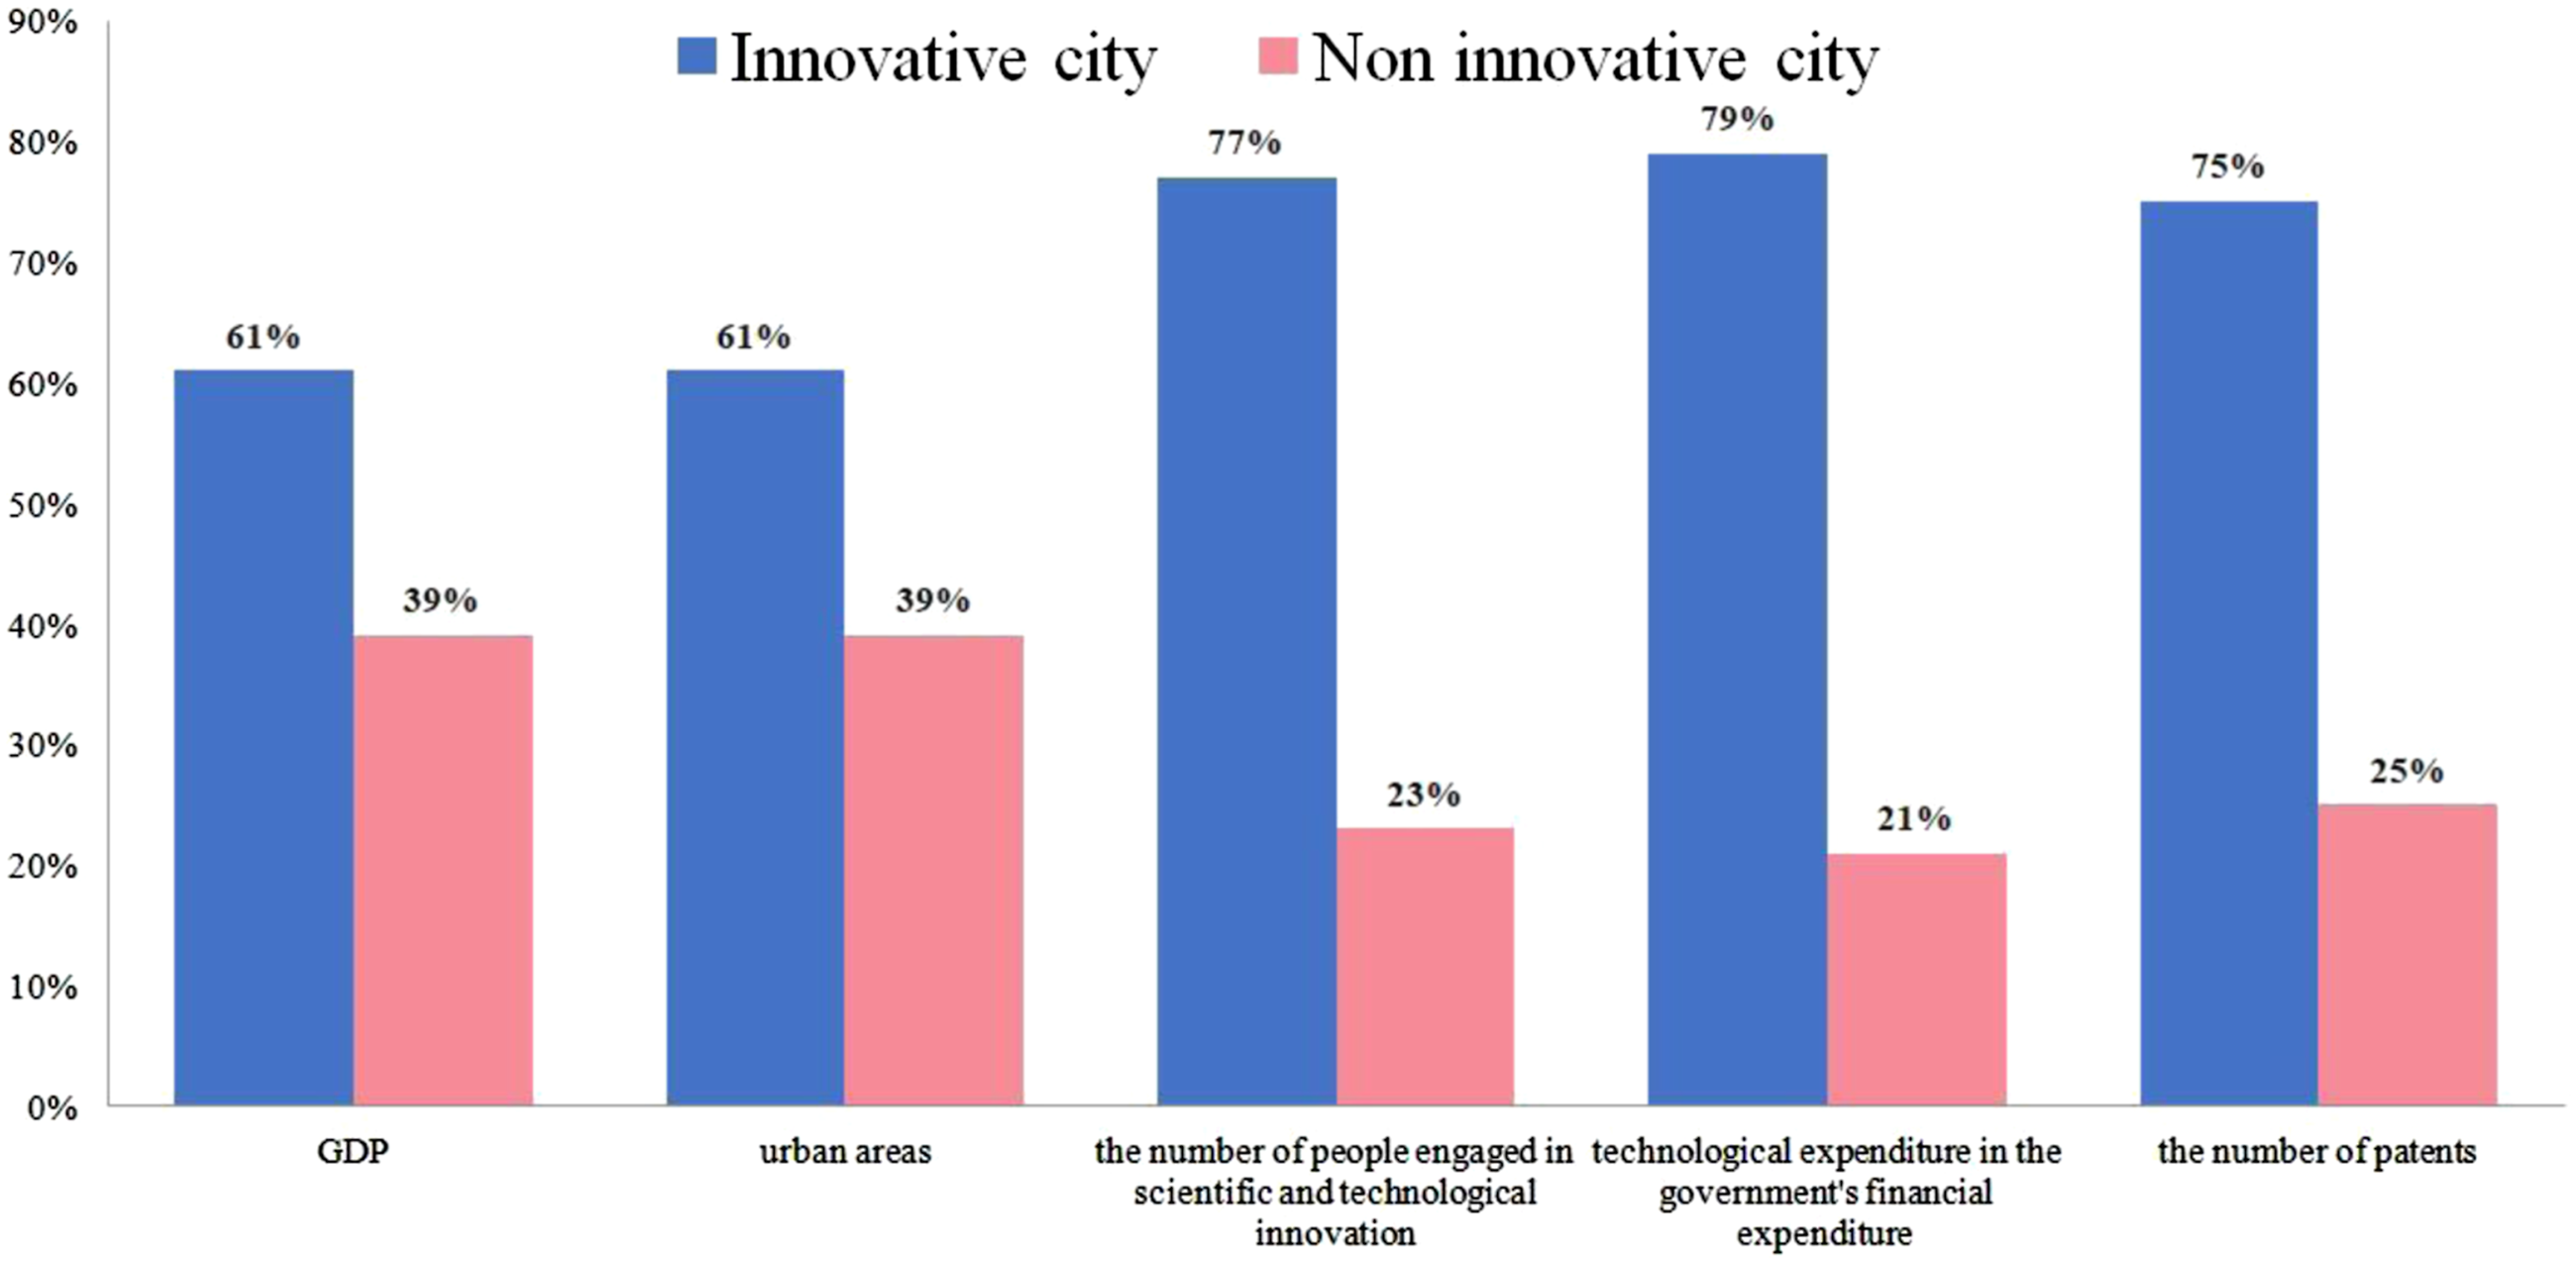
The original data of each index in this study mainly come from the China Urban Statistical Yearbook and relevant statistical yearbook and bulletins for each city. The missing data are Supplemental Material by the exponential smoothing method. In addition, the geographic longitude and latitude coordinate data in the spatial econometric regression model are from the longitude and latitude query network of urban areas, and the inter-city distance data in the innovative connection degree calculation are from the national urban mileage query network.
Empirical Analysis
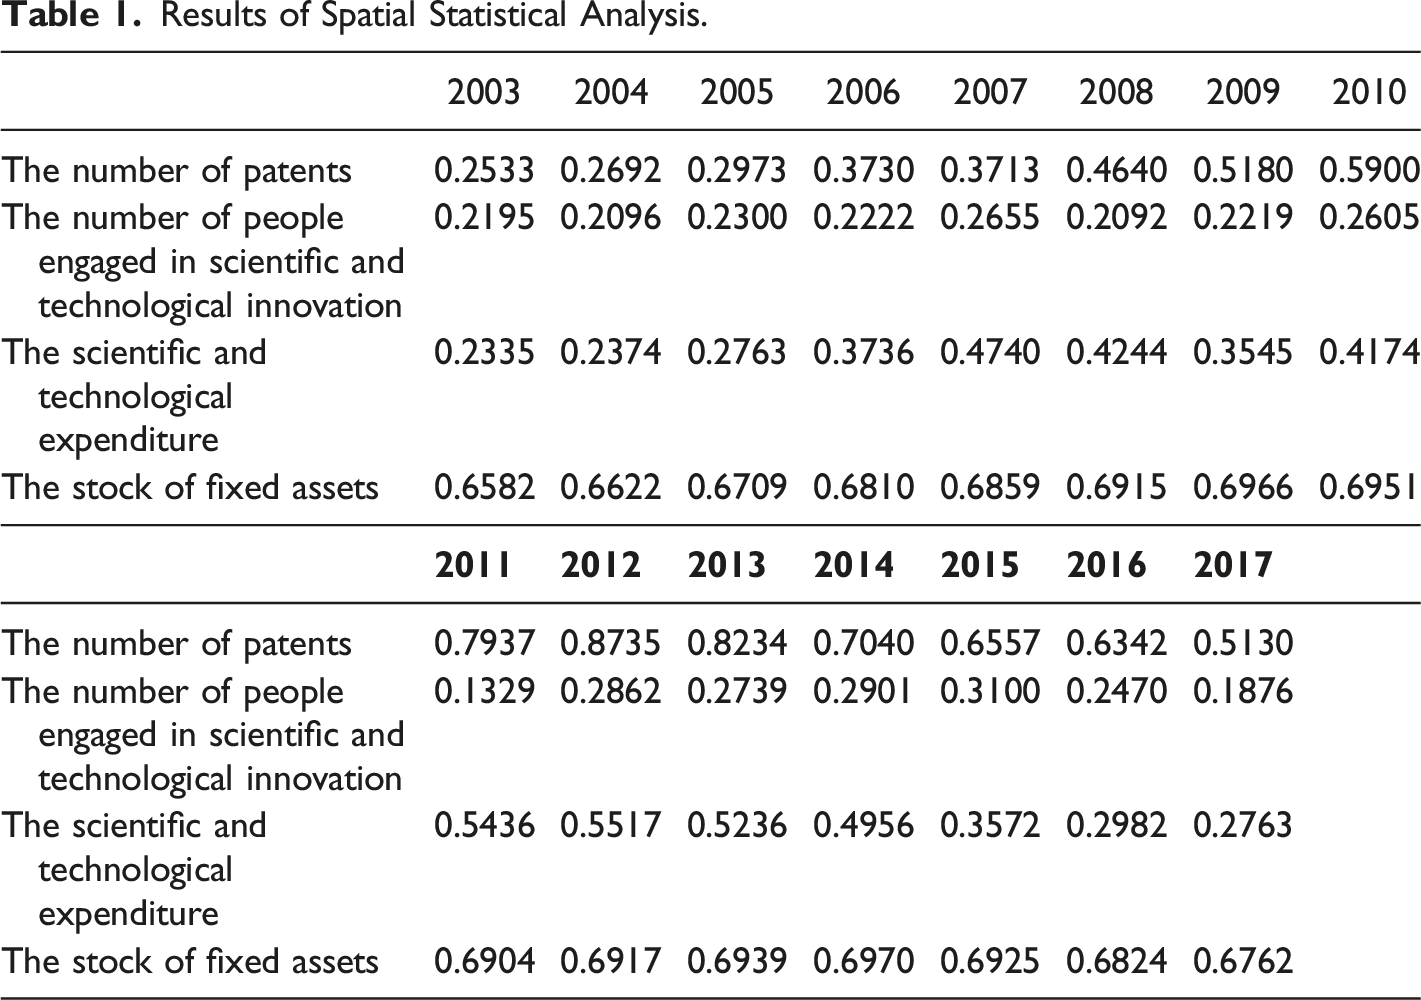
Spatial Statistical Analysis
When the fixed-effect model for benchmark regression is used before the spatial econometric analysis, labour flows and capital flows are found to have no significant impact on innovation output. This may be due to the lack of consideration of spatial spillovers. If the identification problem is not resolved, biased estimates may be generated (Stephen and Overman 2012). Therefore, instrumental variables are used to ensure the robustness of the results and exclude the reverse causality between labour flows, capital flows, and innovation output. Here, the cross-term of the number of regional dialects and time trend is used as the instrumental variable. Regional dialects may affect the flow of labour among different regions (Liu, Jiao, and Xu 2020; Chiswick and Miller 2015). Meanwhile, as a cultural factor formed in history, regional dialects will not directly affect the current innovation output. The logarithm of the urban green area is selected as the instrumental variable of capital flow. The urban green area is a manifestation of liveability and more liveable cities may attract more foreign capital for investment. At the same time, the urban green area will not directly affect innovation output. The 2SLS (two-stage least square) regression is carried out using instrumental variables. The data of the two instrumental variables, i.e., the number of regional dialects and the urban green area, come from the Dictionary of Chinese Dialects and the China Urban Statistical Yearbook, respectively. It is found that labour flows and capital flows still have no significant impact on innovation output, which is the same as the benchmark regression. This implies that the endogenous problem is not apparent. Additionally, the results of benchmark regression also show that the results without considering spatial factors deviate from reality.
Results of Spatial Statistical Analysis.
Network Association Analysis
In this study, degree centrality is selected to describe the importance of different cities in the network to integrate all the spillover lines corresponding to each city. To render the innovation network centrality of different time points comparable, the degree centrality index selected in this study is relative degree centrality. The network/centrality function of UCINET software is used to calculate the centrality value of degree centrality for the three dimensions of labour flow, capital flow, and institutional learning of each city from 2003 to 2017 (as shown in Figure 4). These calculations will preliminarily reveal the basic law of the bandwidth variation of the innovative urban spillover line. Innovation network degree centrality.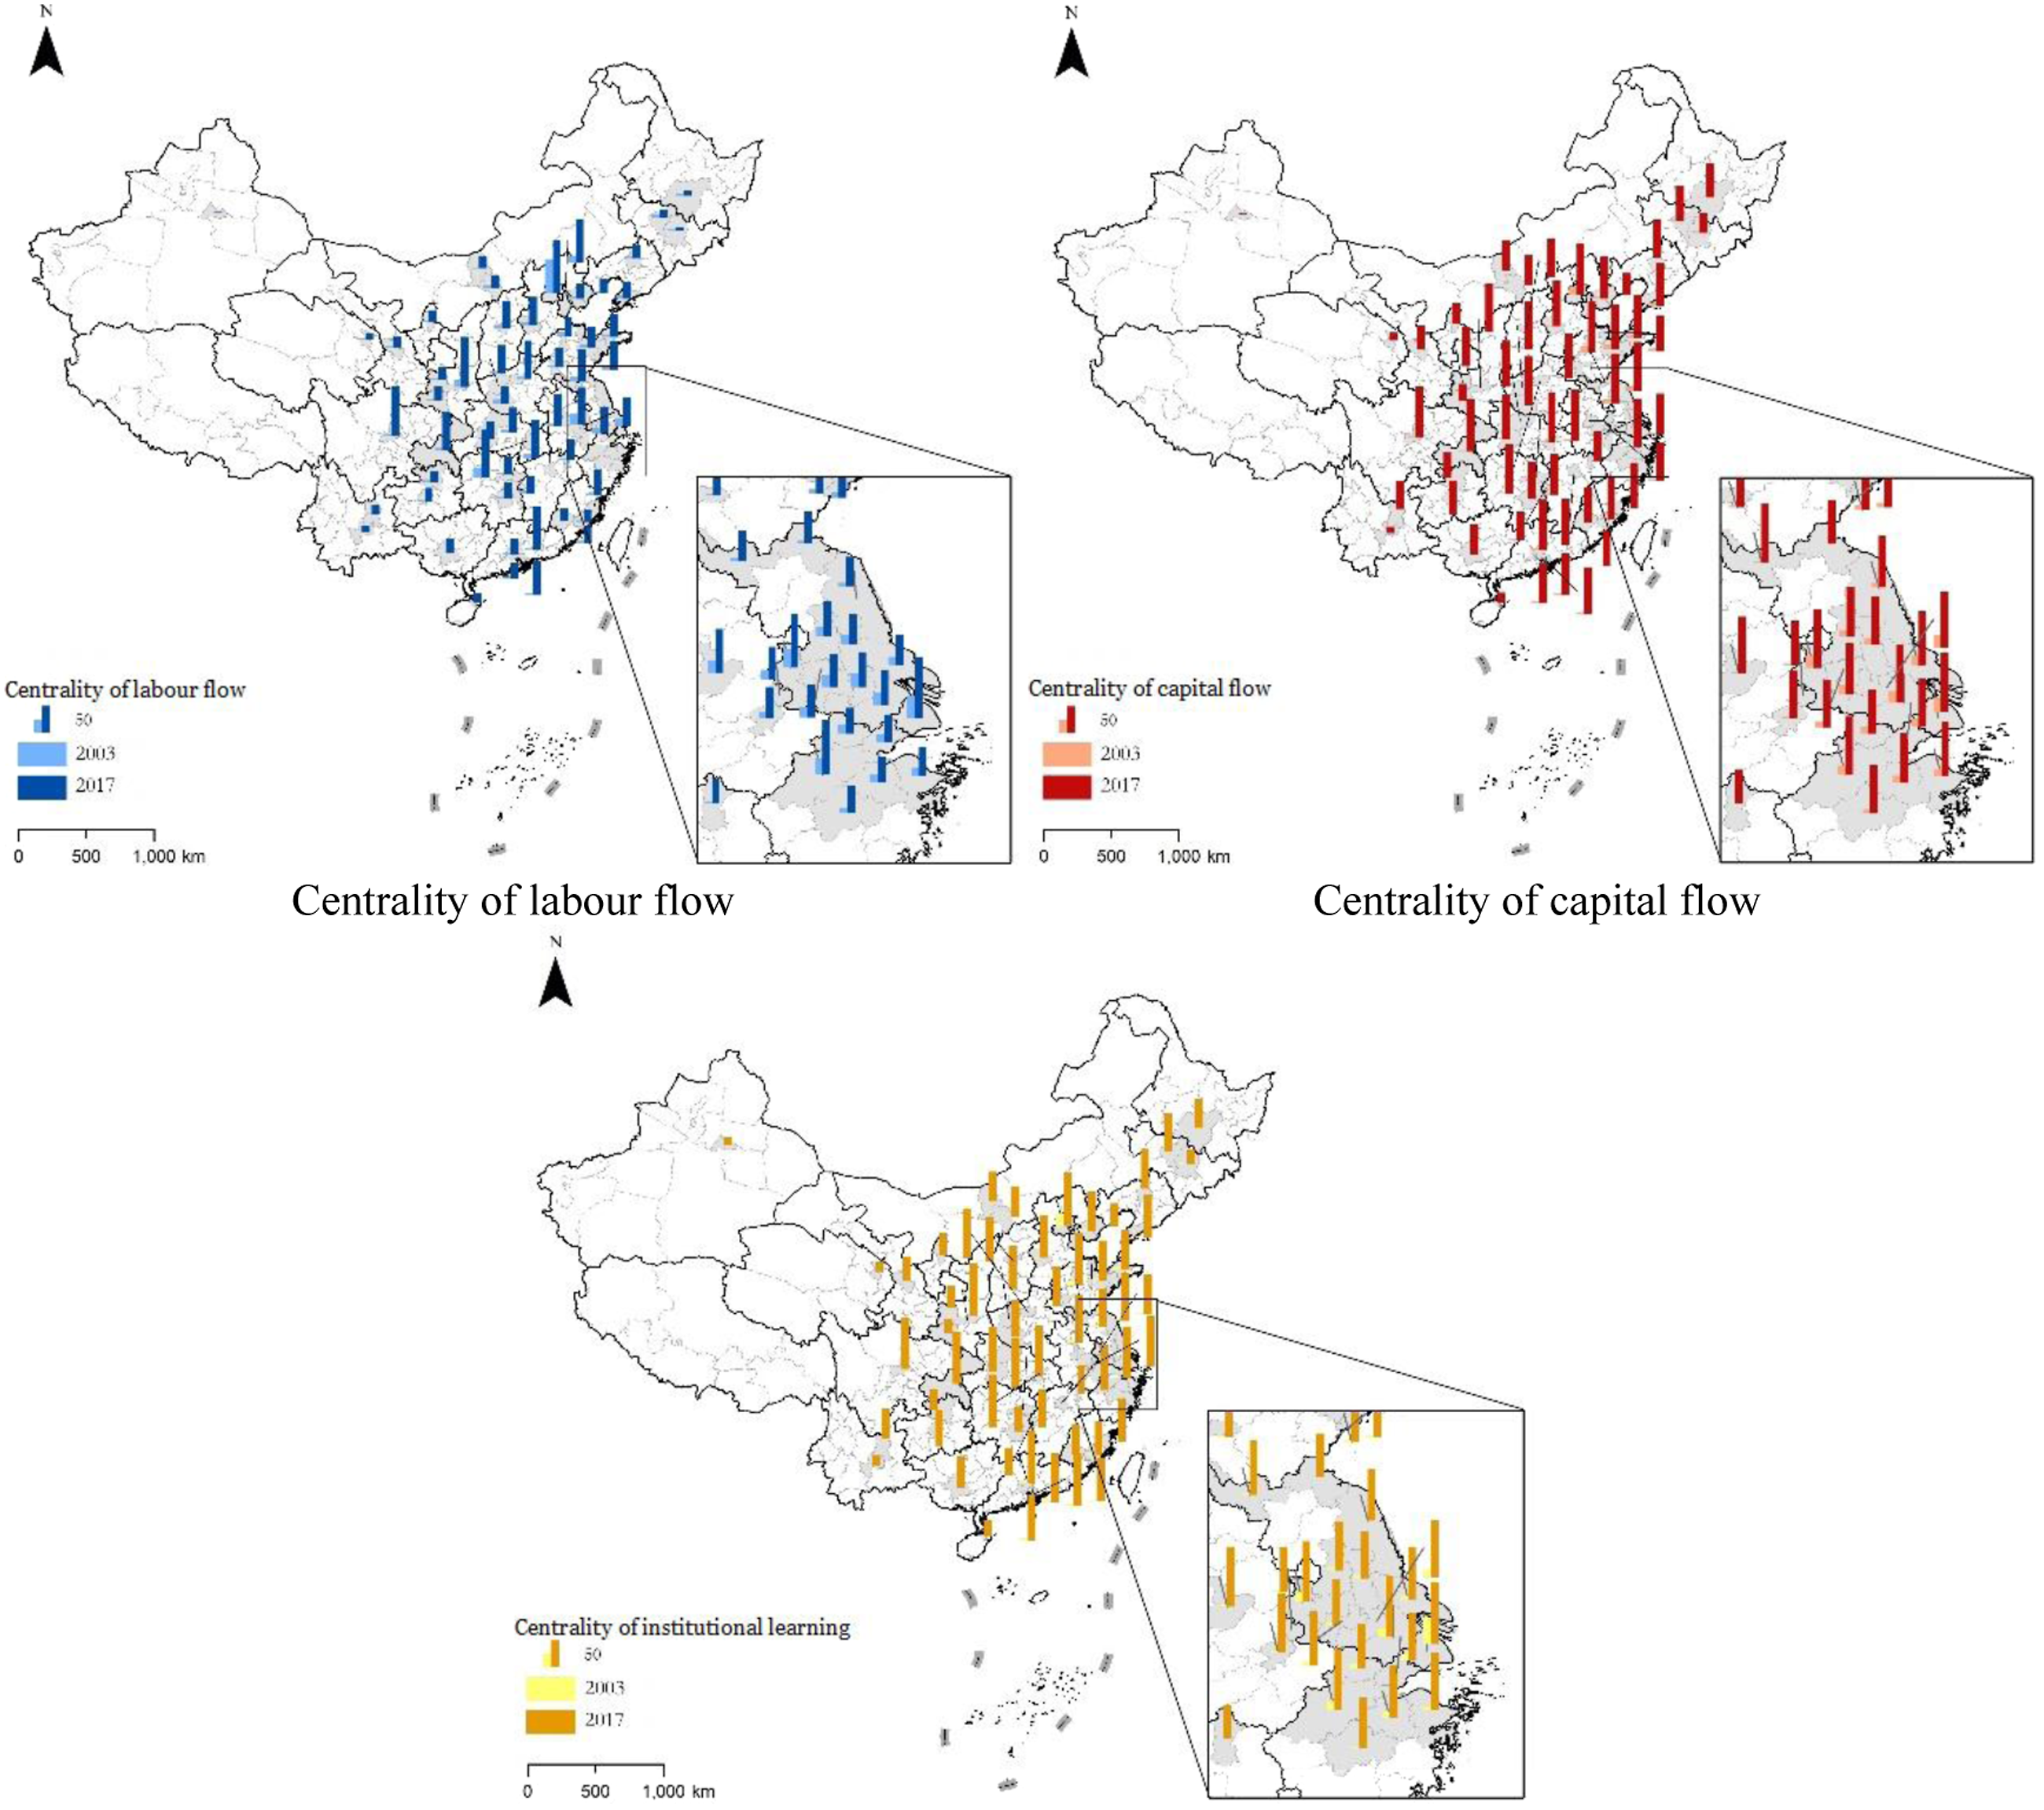
In terms of the spillover line for labour flow in the innovation network, except Beijing, Shanghai, and Nanjing in 2003, the degree centrality for each city is generally low, the spatial difference is significant, and the degree centrality of cities in the western region is extremely low. Among them, the degree centrality of Nanning, Haikou, and Urumqi is zero, and the high-value areas are mainly concentrated in Beijing-Tianjin-Hebei, Yangtze River Delta, and some provincial capitals of other regions. These findings show that the core node cities of labour flow in 2003 have weak centrality, limited radiation effect and driving ability, and there is significant disparity in status between each node city in the network with significant polarization. During the measurement period, all cities show a trend of rising fluctuation. After Beijing, the regions of Shanghai, Tianjin, Xi’an, Chengdu, Wuhan, Guangzhou, Hangzhou, and other provincial capitals stand out and drive the growth of the surrounding cities. These findings show that the degree centrality of labour flow tends to spread from the eastern region to the central and western regions, the main core node cities have significant spillover effects, and the overall development of the network tends to be balanced. However, the highest value of Urumqi, Jilin, and Harbin is less than 10 in the whole measurement period, which represents an important crux of restricting the development of labour flow in innovation networks.
In terms of the spillover line of capital flows in the innovation network, in 2003, the starting point of degree centrality of all sample cities is generally low, only Shanghai, Nanjing, and Suzhou in the eastern region have a value of more than 20, of which Shanghai has a maximum value of 24.32. The value of some non-capital cities in Central China, such as Inner Mongolia, Shanxi, Henan, Jiangxi, and Hubei, and all sample cities in Western China, such as Guizhou, Yunnan, Shaanxi, Gansu, Qinghai, Ningxia, and Xinjiang, is zero. These findings show that in 2003, the centrality of cities in terms of capital flow of innovation networks was weak, and their status in the network was almost the same. During the measurement period, Shanghai, Beijing, Tianjin, and cities in Jiangsu, Zhejiang, Shandong, and other eastern regions form high-value areas, which creates a gap with other cities. In a later period, the growth rate of cities in high-value areas gradually flattens, and the centrality value tends to be concentrated between 75 to 100 while the values of other cities are scattered between 0 to 60, indicating that the centrality of core nodes in the network has increased but the polarization phenomenon is significant. In 2017, the growth rate of cities previously in high-value areas gradually flattened while some central and western cities, such as Hengyang, Baoji, and Guiyang, experienced significant growth and are expected to enter high-value areas in the coming period. These findings imply that the capital flow centre of the innovation network is in the process of spreading to the central and western regions, the polarization situation has eased, and the overall development of the network is more balanced. The capital flow degree centrality of Jilin and Harbin is at a relatively high level in the whole measurement period, which is different from the lagged state of talent flow degree centrality.
In terms of the spillover line for institutional learning flow in the innovation network, the degree centrality of each city in 2003 is low. Except for Shanghai (41.89) and Beijing (24.32), other cities with relatively high degree centrality are concentrated in Suzhou and Hangzhou, but the degree centrality is not more than 20, and approximately 90% of the cities have degree centrality less than 10, which indicates that the core nodes of the network in 2003 are Shanghai and Beijing, and the spatial difference between cities is not obvious. During the measurement period, the degree centrality of most cities increased rapidly except for some cities in the western region. The reason is that each city increased its expenditure on science and technology, which has vastly improved the degree centrality of institutional learning in the innovative network as a whole. At the same time, the network as a whole began to differentiate into high value areas (including Beijing, Shanghai, Tianjin, and eastern cities) and low value areas (including most cities in the western region), and the western region gradually separated from the central and eastern regions. In 2017, the growth of cities in high value areas slowed while the degree centrality of cities in low value areas was still lower than that in high value areas, but the growth rate was relatively high. This finding shows that cities in the western region are accelerating their innovation spillover and moving closer to the core nodes in the central and eastern regions. The main core nodes have significant urban spillover effect, which benefits the surrounding areas and develops in a group way. The overall development of the network is more mature than before.
As a whole, the degree centrality of each city improved to a certain extent from 2003 to 2017 and maintained an overall upward trend, indicating that the degree of innovation connection between cities is constantly improving. The average degree centrality also shows that the internal connection of innovation networks of innovative cities is constantly expanding. From a comparison of cities, the average degree centrality of the three dimensions of talent flow, capital flow, and institutional learning in Beijing, Shanghai, and Nanjing for the whole measurement period is at a high level, which shows that these three cities are always at the core of the innovation network. In the spatial dimension, the core status of the eastern region is better than that of the central and western regions.
Spatial Regression Analysis
Using the quantitative spillover line and spatial econometric model, we can analyse the spillover between cities and the secondary spillover of the spillover line among cities. In this study, we calculate three cases, which include only the spillover among cities (case 1), only the spillover of the spillover line among cities (case 2), and both of these (case 3). For these indicators, because the spillover lines of labour flow, capital flow, and institutional learning after integration are non-normal, they are treated with logarithm.
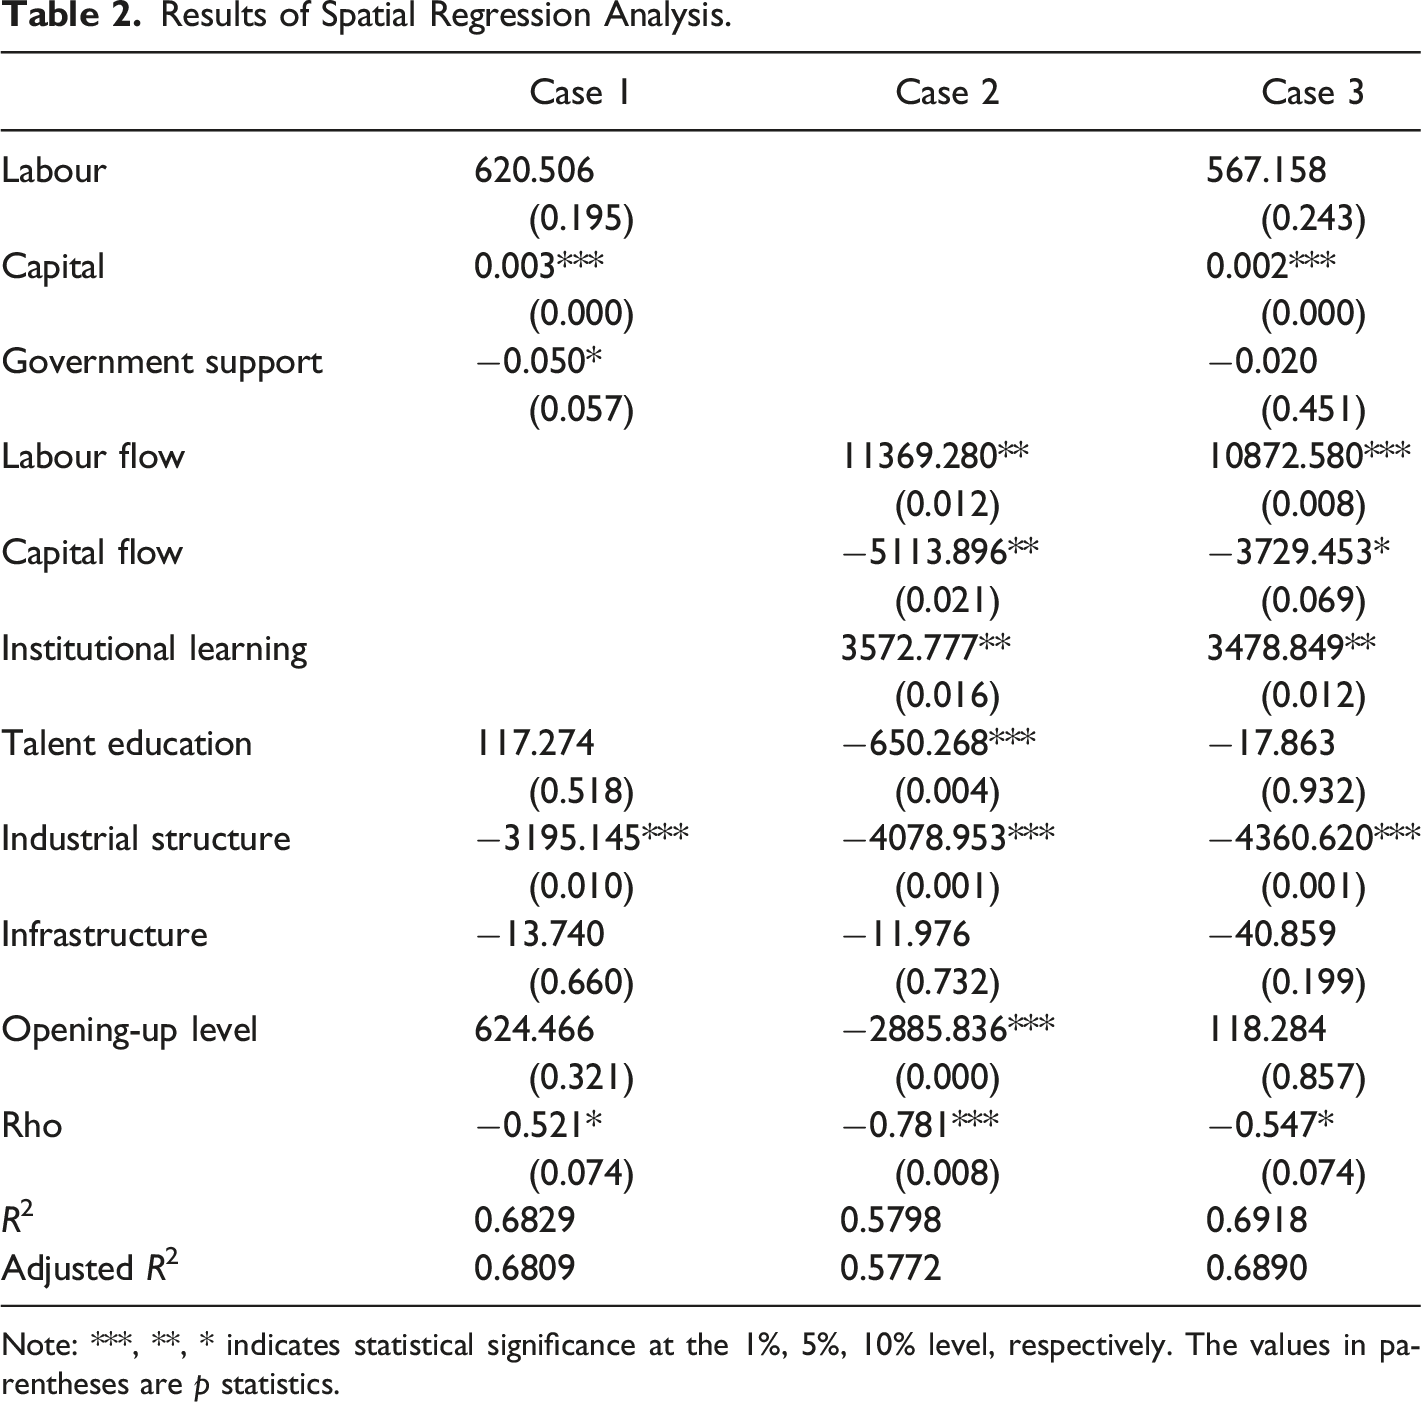
Results of Spatial Regression Analysis.
Note: ***, **, * indicates statistical significance at the 1%, 5%, 10% level, respectively. The values in parentheses are p statistics.
In case 1, capital and government support have a significant impact on innovation without considering the spillover of spillover lines among cities. The impact coefficient of capital is 0.003, and the 1% significance test shows that capital has a positive role in promoting innovation. The influence coefficient of government support is −0.050, and it has passed the 10% significance test. This indicates that government support has a restraining effect on innovation, which may be due to the crowding out effect of government support on enterprise innovation. Labour force did not pass the significance test. Among the control variables, only industrial structure has a significant negative impact on innovation.
In case 2, labour flow, capital flow, and institutional learning have a significant impact on innovation without considering spillover among cities. Labour flow and institutional learning can promote innovation, and they passed the 5% significance test. Capital flow has a restraining effect on innovation and passed the 5% significance test, which may be due to the siphon effect of capital in the process of capital flow resulting in capital flows to the most innovative cities, thus reducing the innovation level of the whole innovation network. Among the control variables, talent education, industrial structure, and the level of opening-up all have a significant negative impact on innovation.
In case 3, considering both the spillover between cities and the second spillover of the spillover line between cities, capital has played a role in promoting innovation and passed the 1% significance test. Labour and government support, however, have no significant impact on innovation. Labour flow, capital flow, and institutional learning have a significant impact on innovation. Labour flow and institutional learning promote innovation, and they passed the 1% and 5% significance test, respectively. Capital flow has an inhibitory effect on innovation and passed the 10% significance test. Among the control variables, only industrial structure has a significant negative impact on innovation.
In all cases, capital plays a significant role in promoting innovation. Similarly, the promotion of labour flow and institutional learning with respect to innovation and the restraint of capital flow on innovation are significant. At the same time, we find that when considering all factors, the influence coefficients of capital, labour flow, capital flow, and institutional learning are smaller than those of case 1 and case 2, indicating that previous studies may exaggerate the influence of some factors. The significant inhibitory effect of government support in case 1 no longer has a significant impact on innovation after labour flow, capital flow, and institutional learning are added, indicating that the dependence and mobility between factors have a more direct impact on innovation. The reason for this phenomenon may be that the crowding out effect of government support may inhibit innovation when factor flow is not considered. However, in the case of factor flow, the crowded out elements and resources can flow through innovation networks without restraining innovation.
From a comparison of the spillover among cities and the second spillover of the spillover line among cities in case 3, we found that the labour force in cities does not have a spatial impact on innovation, but labour flow can promote innovation. Similar to the labour force, government support has no spatial impact on innovation, but institutional learning between cities can promote innovation. Capital can promote innovation, but capital flow restrains innovation because of the siphon effect. From a comparison of case 3 with other cases, and a comparison of the element itself and the element flow in case 3 when analysing innovation spillover, we should consider the point-to-point spillover characteristics of the element itself and the spillover characteristics of the spillover line generated by element flow.
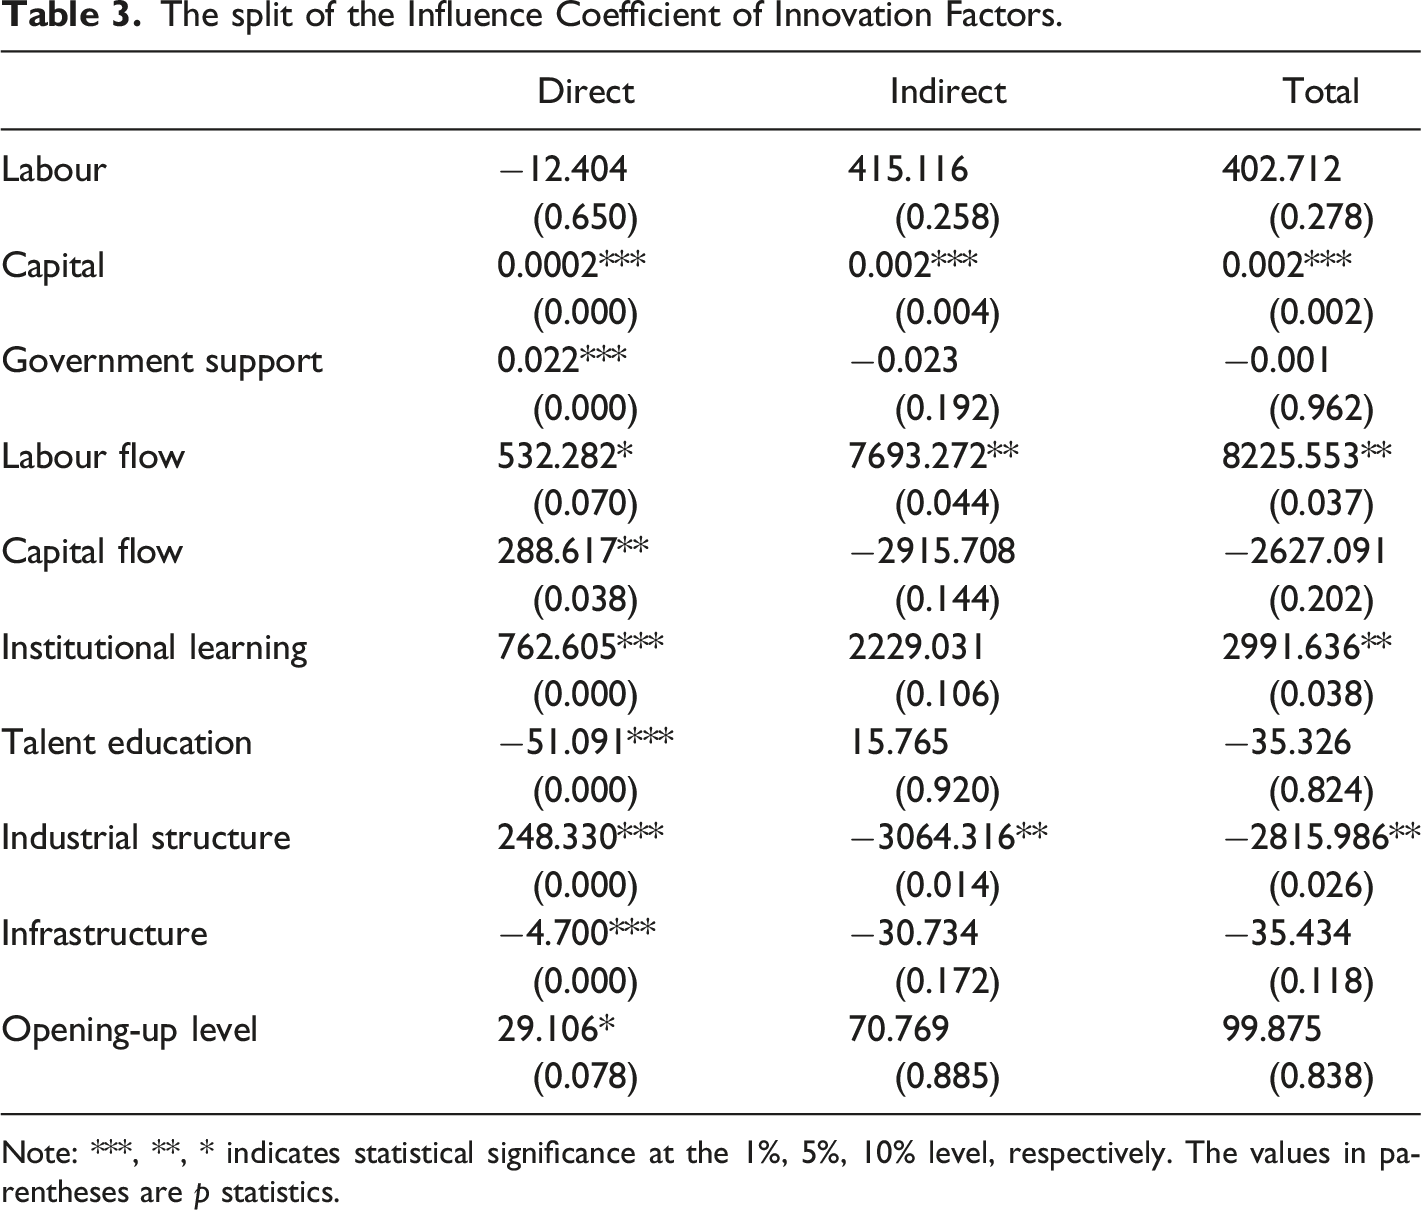
The split of the Influence Coefficient of Innovation Factors.
Note: ***, **, * indicates statistical significance at the 1%, 5%, 10% level, respectively. The values in parentheses are p statistics.
Labour force has no significant spatial impact on innovation, which may be because innovation is a long-term process leading to a lag in the labour force’s impact on innovation. Capital plays a significant role in promoting innovation in local and other cities, so the total effect of capital is also positive, indicating that capital plays an important role in innovation. Government support only promotes local innovation, but does not affect innovation in other cities, so its total effect is not significant. Therefore, for the elements themselves, only capital spillover can promote innovation while government support can only promote local innovation, and the conclusion is consistent with the actual situation.
Labour flow has a significant role in promoting innovation in local and other cities, so the total effect of labour flow is positive, indicating that labour flow plays an important role in innovation. Capital flow can promote local innovation, but its effect on other cities is not obvious, so the overall effect on innovation is not significant as well. Institutional learning can promote local innovation but has no significant impact on other cities, so its total effect is to promote innovation. Therefore, for the mobile elements, labour flow can produce a positive spillover effect and promote innovation in other cities. Capital flow and institutional learning only affects the local area, but does not disturb other cities, which is consistent with the actual situation.
For the control variables, talent education inhibits local innovation because education is a long-term project. In the short term, investing capital and labour in education rather than innovation will inhibit innovation. However, in the long term, education can promote innovation by cultivating talents. The proportion of the secondary industry promotes local innovation because innovation mainly occurs in the secondary industry. When the proportion of the secondary industry of a city increases, it creates a crowding out effect on other cities reducing the proportion of the secondary industry of other cities and thus inhibiting the innovation of other cities. Infrastructure inhibits local innovation, while the level of opening-up promote local innovation, but they do not have a spillover effect.
Robustness Test
In order to test the reliability of the results, the robustness test is carried out from the following three aspects: (1) Addition of a new control variable. With the increasing pressure brought by the environment, the world pays more attention to environmental protection. China takes the construction of ecological civilization as one of the main directions of development, and cities have accordingly issued a series of policies and paid more attention to environmental protection. Therefore, this paper adds environmental regulation as a new control variable to the spatial regression which expressed by SO2 emission. The spatial regression result with the new control variable is generally consistent with the original result, indicating that the original result is robust. (2) Replacement of spatial matrix. The original result uses the geographic distance matrix. However, in addition to geographical distance matrix, economic distance matrix and technical distance matrix are often used to analyze spatial problems. The technology distance matrix is generally constructed by the different types of patents in different cities, and the explanatory variable in this paper is the number of patents, which may lead to the deviation of the results. Therefore, this paper uses the economic distance matrix to replace the geographical distance matrix for robustness test, and uses the absolute value of per capita GDP between cities to construct the economic distance matrix. The spatial regression result of the replacement spatial matrix are generally consistent with the original result, indicating that the original result is robust. (3) Replacement of spatial regression model. The static spatial model (including SAR, SEM ,and SDM models) only contains the spatial lag term. In contrast, the dynamic SDM model takes the time lag term of the explained variables into account. Here, the dynamic SDM model is used for spatial regression, and the function form is as follows. Compared with the SDM model, the dynamic SDM model takes into account the time lag term y’ and space-time lag term Wy’ of the explained variables, τ and μ are the corresponding coefficients. Considering that the completion of the patent takes a long time, we set the lag to 2. The result of the dynamic SDM model is generally consistent with the original result, indicating that the original result is robust.

Discussion and Conclusions
Discussion
The spillover of innovation may not only represent the point-to-point relationship between cities but also secondary spillover on the spillover line among cities. The spillover between points is realized by a linear relationship while the spillover of the spillover line is realized by the innovation network and a spatial relationship. First, this study finds that the input and output of innovation have strong spatial correlation by conducting a spatial statistical analysis. Then, this study quantifies the linear relationship between cities through the gravity model and social network model. The results show that: (1) the centrality of labour flow shows a trend of rising volatility, the main core node city spillover effect is significant, and the overall development of the network tends to be balanced. (2) During the measurement period, the polarization trend of capital flow centrality has eased, and the overall development of the network has become more balanced. (3) The centrality of institutional learning has increased significantly, and the main core node cities can benefit the surrounding areas and develop together.
Finally, this study quantifies the linear relationship between cities using the gravity model and the social network model. The models take the labour force, capital, government support, and the corresponding labour flow, capital flow, and institutional learning as explanatory variables, the number of patents as explanatory variables, and analyses the spatial impact of the factors themselves and the factor flows using a spatial econometric model. The results show that (1) there are secondary spillovers in the spillover lines of labour flow, capital flow, and institutional learning. (2) Capital, government support, labour flow, capital flow, and institutional learning promote local innovation. (3) Labour flow promote innovation in other cities, while capital flow and institutional learning have no significant impact on other cities. (4) The total effect of capital, labour flow, and institutional learning is positive, while the total effect of capital flow is not significant.
Based on the empirical analysis, we believe that considering both the spillover among points and re-spillover among lines may better explain the spillover effect of innovation. Firstly, by comparing case 3 with other cases, we found that case 3’s explanation of innovation reaches 69.18%, which is higher than case 1 (68.29%) and case 2 (57.98%), indicating that case 3’s model fitting is more in line with the actual situation. Secondly, if more variables are added, R2 will be higher but consume more degrees of freedom, which is not necessarily a better choice. Therefore, we also report the adjusted R2 in Table 2, also proving that case 3 is the best and not due to the addition of more variables. Thirdly, in case 1, government support inhibits innovation, which is far from people’s general cognition, while the result of case 3 is more in line with people’s general cognition. Finally, the coefficients of each core variable in case 3 are less than both of cases 1 and 2, which may mean that the spillover effect of innovation is the sum of the spillover among points and the re-spillover among lines.
Managerial and Policy Implications
Labour flow among cities is conducive to the traditional allocation of innovative resources and the dissemination of knowledge. In view of the positive impact of labour flow on innovation, cities should focus on talent cultivation and talent exchange. The labour flow among the western region of China and other regions is slow, which is not conducive to the western region transforming its current low level of innovation. To increase the knowledge spillover and innovation interaction among cities, cities should improve the talent exchange mechanism among cities or deepen household registration system reform, develop a new mode of collaborative innovation among cities, and break the barriers of inter-city talent flow.
Capital plays a significant role in promoting local innovation. Cities should form their own capital accumulation, particularly in the western regions whose capital organic composition has not reached the saturation state. In a short period, capital accumulation can still be used to develop capital biased innovation. The siphon effect of capital flow will reduce the innovation level of the network, and aggressive capital competition should be avoided between cities. In particular, the eastern region should avoid plundering the capital of the central and western regions.
In view of the role of institutional learning in promoting urban innovation, cities should follow a factor endowment structure, find their own advantages, assume the best position in the national innovation and development network, learn from the advanced experience of other cities' innovation and development, further improve on the basis of existing systems, and form an effective innovation policy system and governance structure.
Theoretical Contributions
From the results of spatial regression in different cases, the following general conclusions can be drawn: (1) Considering the factors and their secondary effects together may be possible and would fit the regression equation better and improve interpretation. In this study, when considering labour, capital, and government support, we also consider labour flow, capital flow, and institutional learning so that the degree of fit for the spatial econometric regression equation is higher. (2) Some factors may have a significant spatial impact on the results without considering the secondary impact, but they may not have a significant spatial impact when considering the secondary impact. In this study, government support can have a significant negative impact on innovation because of the crowding out effect, but when considering the flow of factors, the crowding out effect is diluted in the innovation network, and there is no significant spatial impact on innovation from government support. (3) If we only consider the spatial effect of the factors themselves, or only consider the secondary effect of the flow of factors, the result may exaggerate the spatial effect of the factors themselves or the flow of factors. In this study, the coefficients of capital, labour flow, capital flow, and institutional learning are smaller when considering the spatial effects of all factors. (4) The factors themselves may not have a significant spatial impact on the results, but the flow of factors may have a significant impact on the results. In this study, labour has no significant impact on innovation, but labour mobility has a significant role in promoting innovation. (5) The factors themselves have significant spatial impacts on the results, but the spatial impacts of the flow of factors on the results may be not significant. In this study, capital only has a significant role in promoting innovation in local.
Limitations and Future Research Directions
We believe that considering both the spillover among points and the re-spillover among lines simultaneously may better explain the spillover effect of innovation and list some reasons. But these reasons are slightly insufficient to prove our point of view. Firstly, various scholars have various opinions on whether the value of R2 or adjusted R2 can prove the rationality of the model. We also agree that both the values of R2 and adjusted R2 have defects, but we have no better proof method at present. Similarly, the significance and coefficient of variables are also difficult to provide sufficient support for the model’s applicability. Through several apparent phenomena, we can only infer that the spillover effect of innovation should include the spillover among points and the re-spillover among lines. But more scientific and accurate proof needs further discussion.
Because of the universal spatial relationship, spillover occurs in other fields. In addition, innovation is a macro concept, which involves labour flow, capital flow, institutional learning, and the flow of other factors, which may also generate spillover. Therefore, the conclusion of this study may be more general, and the study of spillover should pay more attention to second spillover caused by the flow of factors.
Supplemental Material
Supplemental Material - Spillover and Re-Spillover in China’s Collaborative Innovation
Supplementary Material for Spillover and Re-Spillover in China’s Collaborative Innovation by Song Wang, Jiexin Wang, Yixiao Wang and Xueli Wang in International Regional Science Review
Footnotes
Declaration of Conflicting Interest
The author(s) declared no potential conflicts of interest with respect to the research, authorship, and/or publication of this article.
Funding
The author(s) disclosed receipt of the following financial support for the research, authorship, and/or publication of this article: The authors are thankful for the financial support from the National Natural Science Foundation of China (42071154), China Postdoctoral Science Foundation (2020M680960), Project of the Fundamental Research Funds for the Central Universities (N2206011), Postdoctoral foundation of Northeastern University (20210201), Major Program of National Fund of Philosophy and Social Science of China (21ZDA011), Youth project of high-end science and technology innovation think tank of China Association for science and technology (2021ZZZLFZB1207138), Humanities and Social Science Fund of Ministry of Education of the People’s Republic of China (20YJA790010).
Supplemental Material
Supplemental material for this article is available online.
References
Supplementary Material
Please find the following supplemental material available below.
For Open Access articles published under a Creative Commons License, all supplemental material carries the same license as the article it is associated with.
For non-Open Access articles published, all supplemental material carries a non-exclusive license, and permission requests for re-use of supplemental material or any part of supplemental material shall be sent directly to the copyright owner as specified in the copyright notice associated with the article.