
Abstract
The COVID-19 pandemic changed behaviors, at least temporarily, and possibly more permanently, with implications for both work and leisure activities. Some of those behavioral changes, such as dining in restaurants, have significant ripple effects on businesses and employment. We investigate the response to health risks in China with a study of decisions about eating out during the pandemic. We find that compared to a traditional measure of financial risk attitude, dining out behavior better captures individuals’ attitude toward the health risk posed by the pandemic and is more significant in predicting their expected total consumption during the recovery phase of the pandemic. In addition, we find that the effect of domestic in-migration is positive with respect to dining out, a signifier of confidence in the government response to the safety of internal flows. In contrast, international migration and port city of entry status are strongly negative with respect to dining out. The risk from the virus is perceived to be much stronger in such contexts. From a policy perspective establishing border controls was critical in re-creating a robust economy. Additional city and household level characteristics that affect dining-out behavior are also identified.
Introduction and Context
There is continuing interest in understanding behavioral responses to the current health crisis created by the ongoing spread of COVID-19. In the past year and a half several hundred papers have evaluated various aspects of the nature, role and implications of the COVID-19 pandemic. Overall, the meta-analysis of current research has focused, in the main, on disease pattern detection and to a lesser extent the economic and social implications of COVID-19 incidence (Fatima et al. 2021). In contrast, in this paper we extend that focus by studying the behavioral impact of the pandemic, which has had, and continues to have, major implications for individual behaviors and business and industry decisions. Unlike the processes in Europe and the US, China has largely controlled the spread of COVID within the country by May 2020, and there is evidence of economic recovery. 1 We explore households’ variation in risk attitude towards the infection over time during this recovery period in China and provide some thoughts on the implications for other national contexts.
Responses to risk, in particular the associated behaviors in response to health risks, lead us to focus our attention on how certain environmental factors have affected our willingness to assume risks in our daily living during the pandemic. Perceived risk is an important construct in theories of health behaviors. The basic measurement in the current context is the response to a question of how likely you feel you will be susceptible to getting the COVID virus. Clearly, the degree to which you feel you could contract the virus will influence your willingness to engage in behaviors that would result in catching the virus. This implies a positive relation between perceived risk and subsequent protective behavior (Brewer et al. 2004).
Because perceptions of high personal risk lead people to adopt precautionary behavior (the “motivational hypothesis”), an analysis can be used when a significant change in behavior is occurring and when there is a specific risk which is identified (Weinstein et al. 1998). This is exactly the context in which the present study is conducted. The risk of contracting COVID during the early weeks of the pandemic was real, and the interventional response by the government influenced behavior, some of it enforced but much of the behavioral response at the local level reflecting individual decisions to change behaviors. Thus, instead of simply asking individuals to rate, on a scale from 1 to 10 for example, how safe they think the public space is, we designed a survey, on which this study is based, to assess the actual changes in their behaviors that reflect their perception of the potential health risk in a public space, namely the decision to defer the behavior of dining out. Given the motivation to change behaviors is strong, and we have correctly assessed the behavioral outcomes, this approach helps to overcome the methodological problems of using correlational approaches (Weinstein et al. 1998). It also avoids other confounding factors, such as self-serving biases noted in Camerer and Hogarth (1999), regarding risk attitude questions during a survey.
In addition to documenting the behavioral changes in the dining behavior through a national survey, we investigate their implications on the wider economy. If health precaution is the main motivation for changing dining behavior, then changes in dining behavior should be significant in predicting other important behavioral changes that are driven by the same motivation. Indeed, we find that households that defer dining out also expect to significantly decrease their overall consumption. Thus, we also examine whether risk attitude from different domains affect behavior to the same degree by performing the same analysis using households’ revealed attitude toward financial risk and find a limited and modest effect. Having established that dining behavior reflects health-specific risk attitude, and can predict expected consumption, we then study the possible channels through which the risk attitude, which is reflected through dining behavior, changes.
We believe that one of the important signals of economic recovery is population flow. Because higher migration raises the potential for viral contagion, and in reverse, lower migration reduces the potential for infection (Jia et al. 2020; Kraemer et al. 2020), a higher domestic migration flow must reflect higher confidence in a viral free domestic environment of the local government and their citizens. Therefore, we hypothesize that an individual’s perception of the health risk they face in a public space can be shaped by the changes in migration flows and they perceive lower health risk when observing a higher migration flow. On the contrary, the migration flow over the border does not reflect confidence of the authorities or the travelers of the Covid situation abroad. International travel that happens during the pandemic period are mostly out of necessary reasons and a completely closed border is not implausible for any government to implement. Because of this, a potential exposure to migration from outside of China would increase people’s alert towards possible transmission of the virus and should increase their risk averseness towards the public environment. Therefore, we also hypothesize that the effect of international migration works opposite from domestic migration and increases households’ perceived risk of potential exposure to the virus, which will be reflected by decreasing the frequency of dining out.
In addition to reflecting the growing interest in the role of the built environment in health outcomes (Frank and Engelke 2005) our paper contributes to the current literature in three ways. First, unlike research that has focused on measuring the geographic spread of the disease and the implications for society (Bonaccorsi et al. 2020; Kamel-Boulos and Geraghty 2020; Jia et al. 2020; Zhu et al. 2020), we focused on people’s perceived risk of possible exposure to the disease and show its implication on economical behaviors. In addition, we highlight that there is a tradeoff between spreading of the virus and reducing people’s perceived risk through variation in migration flow. Second, research such as Palacios et al. (2022) that conducts a field experiment to observe how people’s willingness to dine out increases after being given the information of percentage of their neighborhood that were dining out, is similar to our approach. That is, that the willingness to dine out significantly reflects people’s attitude towards how much health risk they are exposed in the restaurants or public environment in general. However, in these field experiment research, it is difficult to further investigate what are the variables which affect the dining out behavior, hence the risk attitude. Without details of the context of attitude formation helps very little in making valid policy suggestions. Third, we implicitly provide evidence to support the theory that risk attitude are over different domains, that a financially risk-averse person may not be risk-averse when facing a health issue (Weber et al. 2002).
Data and Methods
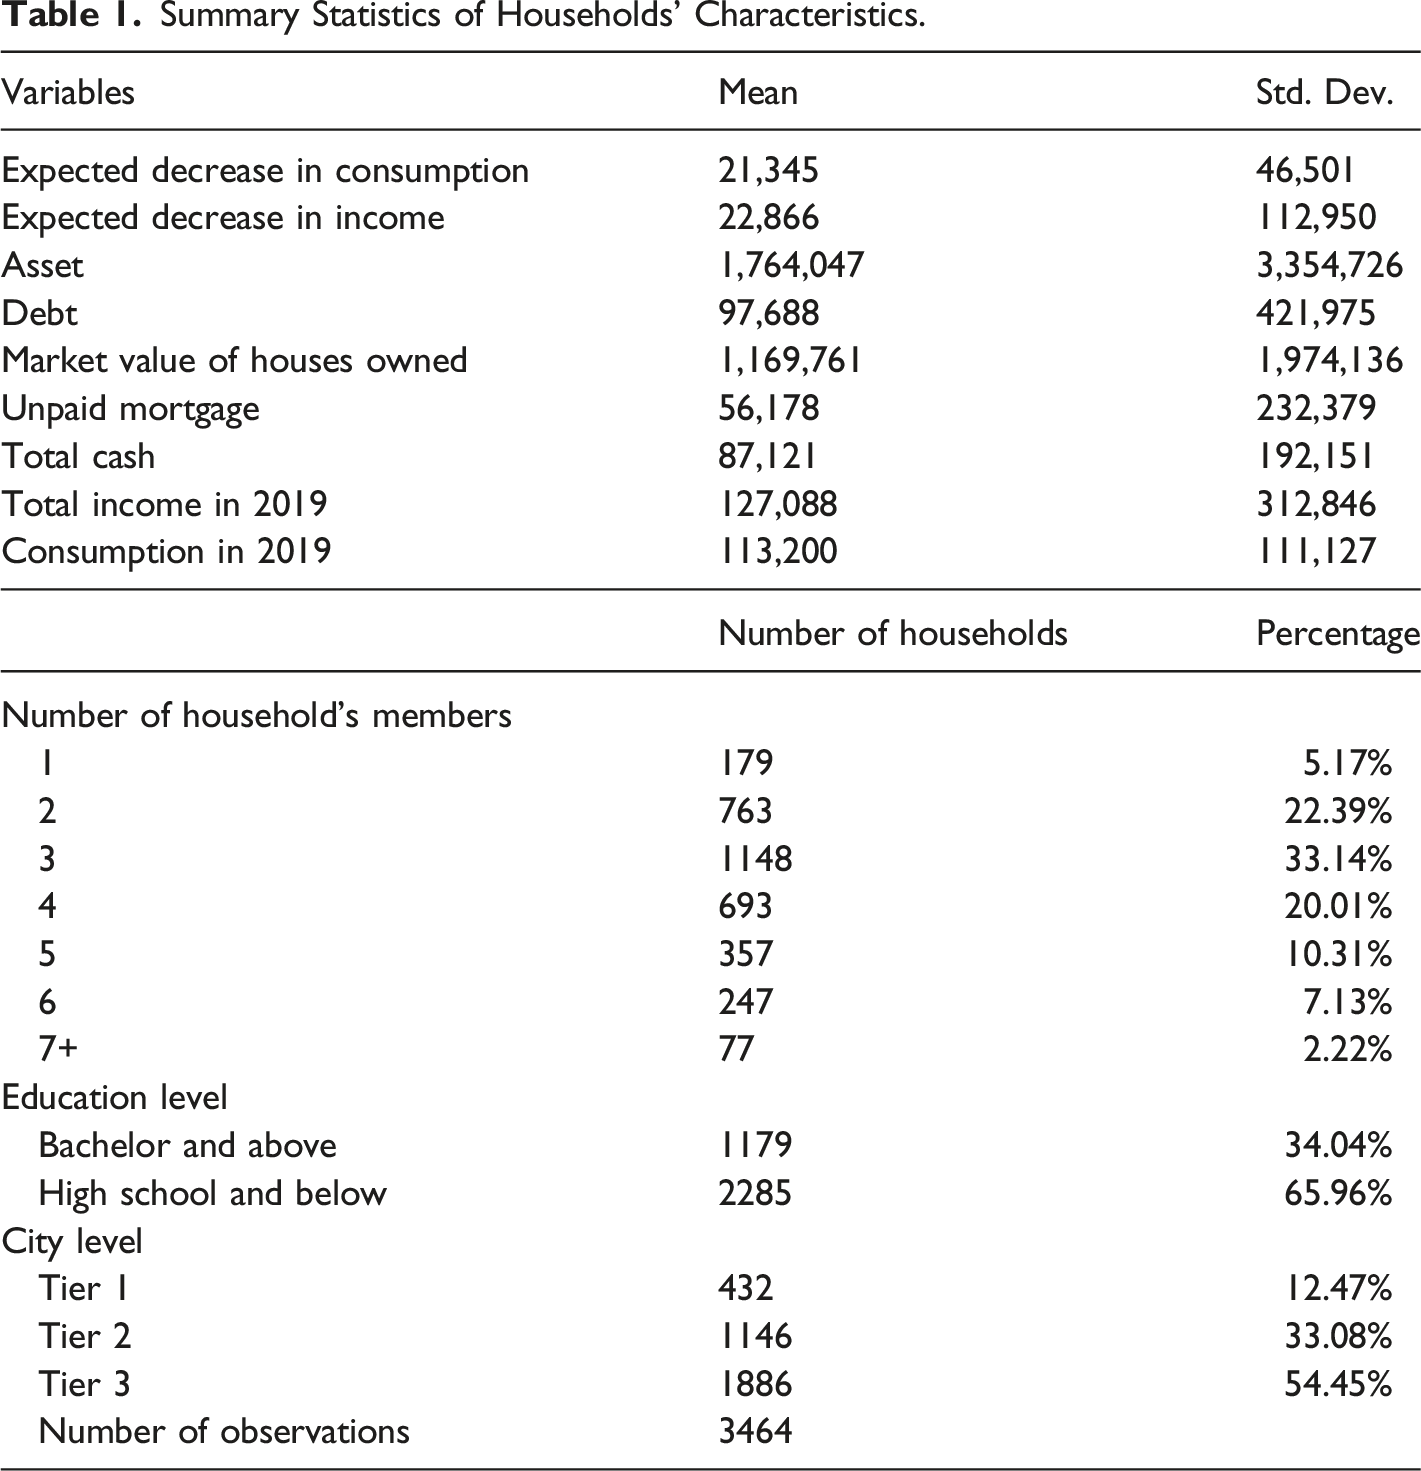
Our principal interest is in understanding how households’ attitude towards the health risk posed by the COVID-19 pandemic affect their post-pandemic consumption. However, since such consumption data are not yet available even for China, where pandemic recovery is largely in place, we investigate the effects on households’ consumption expectations instead. In May 2020, the China Household Finance Survey (CHFS) COVID-19 survey asked the households to report how they expected their consumption level to change in 2020 in comparison to 2019 by selecting one of the following categories: no change, decrease by less than 10%, 10–30%, 30–50%, 50–70%, or more than 70%, or increase by less than 10%, 10–30%, 30–50%, 50–70%, or more than 70%. To convert these categorical values to yuan (RMB), the midpoint of the selected category was multiplied by the household’s consumption level reported in the CHFS 2019 survey.
Summary Statistics of Households’ Characteristics.
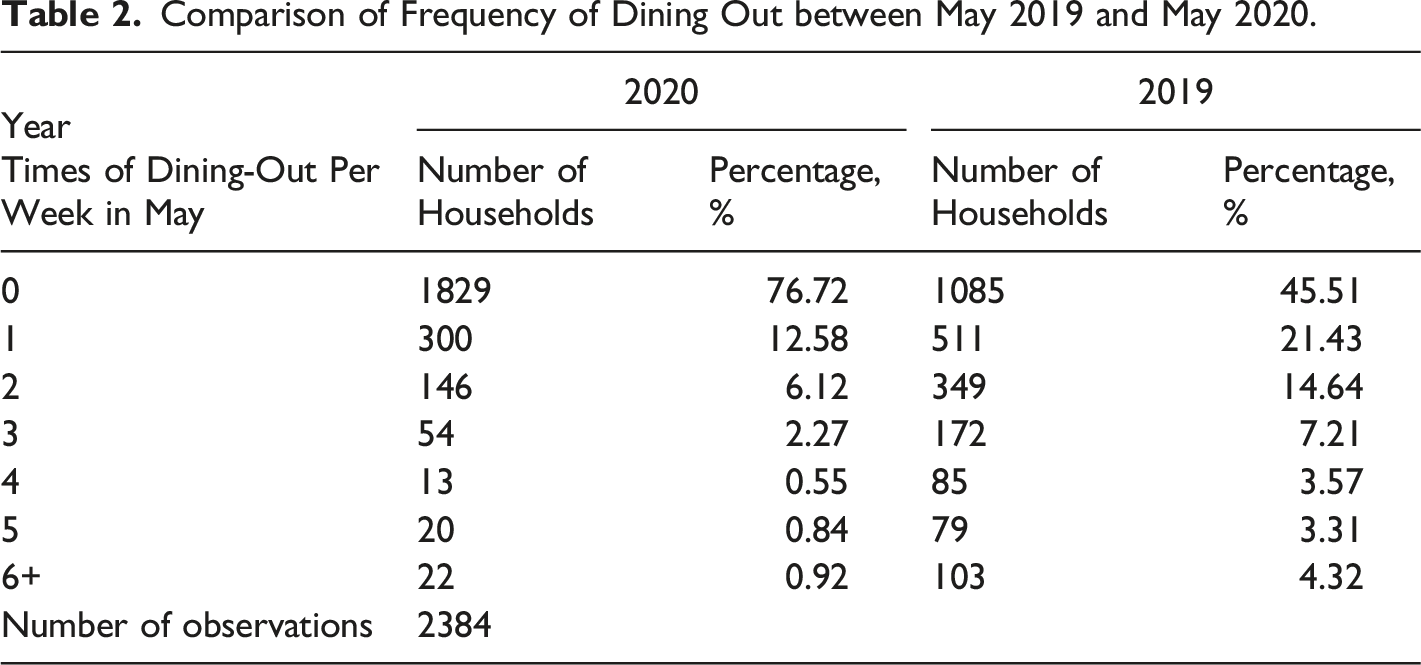
Comparison of Frequency of Dining Out between May 2019 and May 2020.
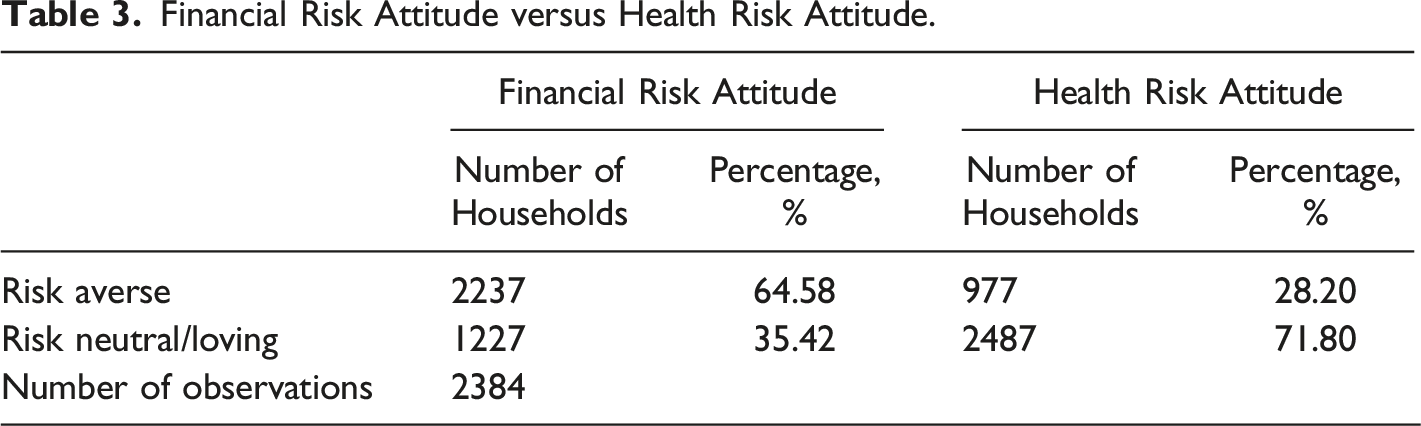
Financial Risk Attitude versus Health Risk Attitude.
The domestic and international migration inflows are the two key elements we hypothesize that affect the formation of this health risk attitude. Domestic migration data is collected from China’s Gaode Map, provided by AutoNavi, which is one of the two biggest navigation service providers in China. By monitoring actual movement signals of users with cellphone that use Android system who also subscribe to Gaode Map service, it estimates the overall migration movement volume between cities and reports a daily in-migration index of a city as an indicator of the intensity of the domestic migration inflow 2 . It is widely used by news reports on China’s migration or mobility trend, and has been shown to be consistent across cities and over time (Wu et al. 2019). Gaode Map started to provide the index from June 2018. Regularly, only data from the past month is publicly available. However, during the pandemic, Gaode Map made its migration index data publicly available starting 2019, which enabled us to use a Python program to collect this data in 2019 and 2020.
Figure 1 shows that domestic migration flow index closely reflects the common perception of how severe the Covid situation is in China. In the early weeks of the spread of Covid there was little widespread knowledge of the virus. Figure 1 shows relatively high rates of inter-provincial flows in the first weeks of January because of the Chinese spring festive that was coming up. However, without the Covid breakout, migration flow should be much higher towards the festive day, which was January 23rd in 20,202. But by the end of January and through February, migration was well below the rates of early January. Migration started to reboot in mid-February, as most of the provinces in China were allowing factories and companies to resume regular working hours. There was more increase in migration in April, with Wuhan’s lockdown ended on April 8th. And in later April and by the beginning of May 2020, new infections in China dropped below 10 cases per day and were mainly concentrated in a small outbreak in Heilongjiang Province in Northeast China. Most regions of China were no longer facing a serious COVID risk at the time of the survey. The response to the decline in COVID cases is reflected in the recovery in migration flows even though it varies considerably by city. Figure 1 provides a descriptive background to the rise and fall of the number of Covid cases in China reflected by the migration movement, which also reveals the change in people’s perceived risk level of exposing to virus the public atmosphere. We use this data as part of the modelling process of risk behavior. Domestic migration inflow. Daily domestic migration index obtained from Gaode is aggregated to compute weekly migration index over the period January – March 2020.
Empirical Model
Using a simple OLS regression model, we first investigate the correlation between the health specific risk attitude of the households during the pandemic period with their expected financial behaviors, such as consumption. As a comparison, we also evaluate the same correlation using a financial specific risk attitude. The OLS regressions are given as following


Condition on that the correlation between health specific risk attitude and expected consumption exists, we then investigate what household and city level characteristics affect the formation of the health specific attitude. One thing to notice is that although the CHFS COVID-19 surveyed the same households in 2019 and 2020, only a very small subset of the questions from 2019 addition to pandemic related questions were asked in 2020, many important households characteristics we need to use as controls were only available in 2019. This unfortunately means that we cannot use the panel structure of the data and also control for household fixed effects.
In addition, the times of dining out in a week are count data with excess zeros. Poisson regression is widely used to model count data; however, when there are too many zeros, the count data exhibits over-dispersion relative to the Poisson distribution, which is beyond the estimate ability of Poisson regression. Count data with excess zeros is referred as zero-inflation, and the zero-inflated model (ZIP model) is suggested to be employed (Lambert 1992; Greene 1994; Hall 2000; Agarwal et al. 2002; Simonoff 2003). The ZIP model assumes that the zero-inflated count data is generated by two independent processes, which should be modeled and estimated independently. The first process generates zeros, and the second process is governed by a Poisson distribution that generates counts, which could be zero. To be more specific, the two processes of ZIP model can be shown as below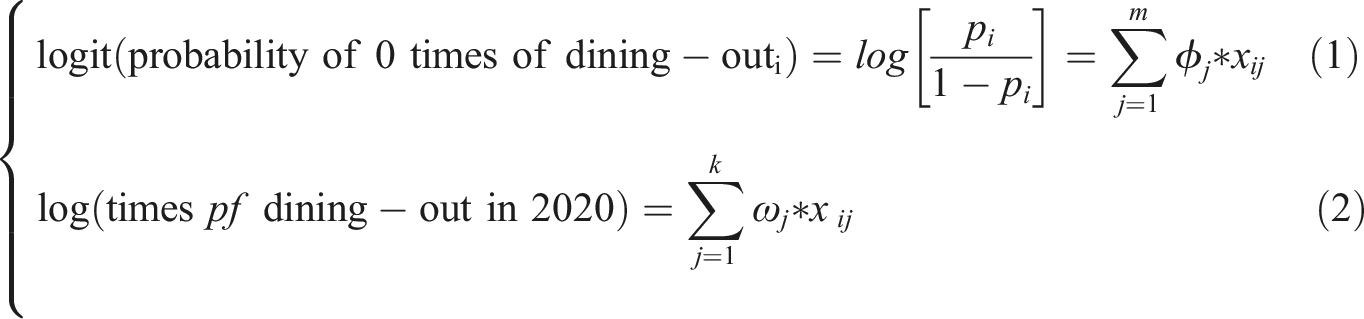
Equation (1) implies that the first process, which determines the probability of the occurrence of excess zeros, can be estimated by a logit model. The parameters φ’s in equation (1) represent how the independent variables x’s affect the probabilities that excess zeros occur. The equation (2) shows that conditional on the first process, the times of dining-out was assumed following a Poisson distribution, and the parameters ω’s show the effects of the independent variables on times of dining-out. The model parameters, φ’s and ω’s are estimated by the method of maximum likelihood.
Results
Response to Risk: Anticipated Consumption
OLS Estimated Effect of Risk Attitude on Expected Consumption Decrease in 2020 (Risk Attitude in Financial Domain vs. Health Domain).
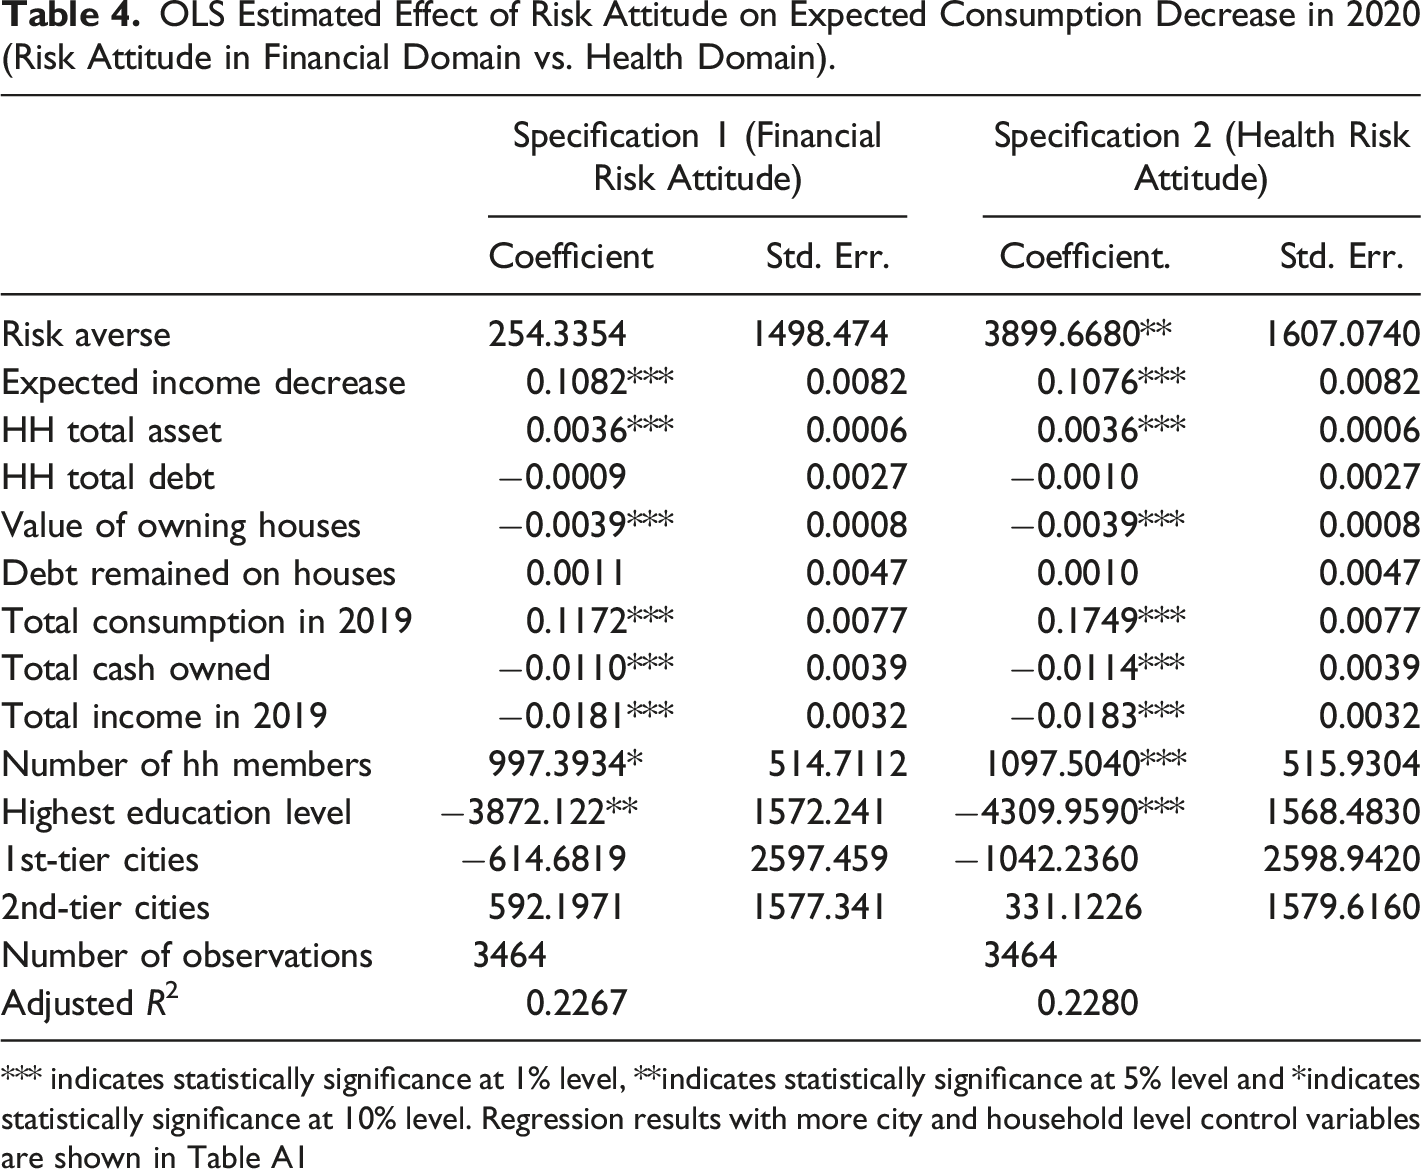
*** indicates statistically significance at 1% level, **indicates statistically significance at 5% level and *indicates statistically significance at 10% level. Regression results with more city and household level control variables are shown in Table A1
The result suggests that the individual’s attitude toward the uncertainty posed by the pandemic is an important factor; however, the domain over which the risk attitude operates also matters. In particular, being financially risk averse does not have a significant effect on consumption while more pandemic-specific risk averseness, namely dining-out less often, does have a significant negative effect. This finding supports the theory that risk attitude is domain specific (Weber et al. 2002). We also graph the coefficients to provide a visual interpretation of the log odds.
The original 2019 CHFS survey, from which the households’ consumption levels were obtained, also included a standard survey question eliciting respondents’ attitude toward financial risk. If a household is risk averse according to that question, we identify them as “financially risk averse.” We also tested whether financially risk averse households report any decline in their anticipated consumption by running the same regression as before but with the indicator variable for financially risk averse replacing the pandemically risk averse. Panel B of Figure 2 presents the results graphically. Although being financially risk averse has a negative effect as expected, it is an order of magnitude smaller and not statistically significant when controlling for the confounding factors. This suggests that an individual’s attitude toward risk posed by the pandemic affects his/her consumption plan through a channel other than mere aversion to financial uncertainty. The remaining factors have qualitatively the same effect as in the original regression. Determinants of expected consumption change. Panel A presents the coefficient estimates from regressing the expected consumption change on the indicator variable for pandemically risk averse and other control variables. Panel B presents the results from the same regression but with financially risk averse replacing pandemically risk averse. Colored bars indicate point estimates while whiskers show 95% confidence bands. For ease of illustration, coefficient estimates for variables below ‘Second-tier city’ are multiplied by 10,000.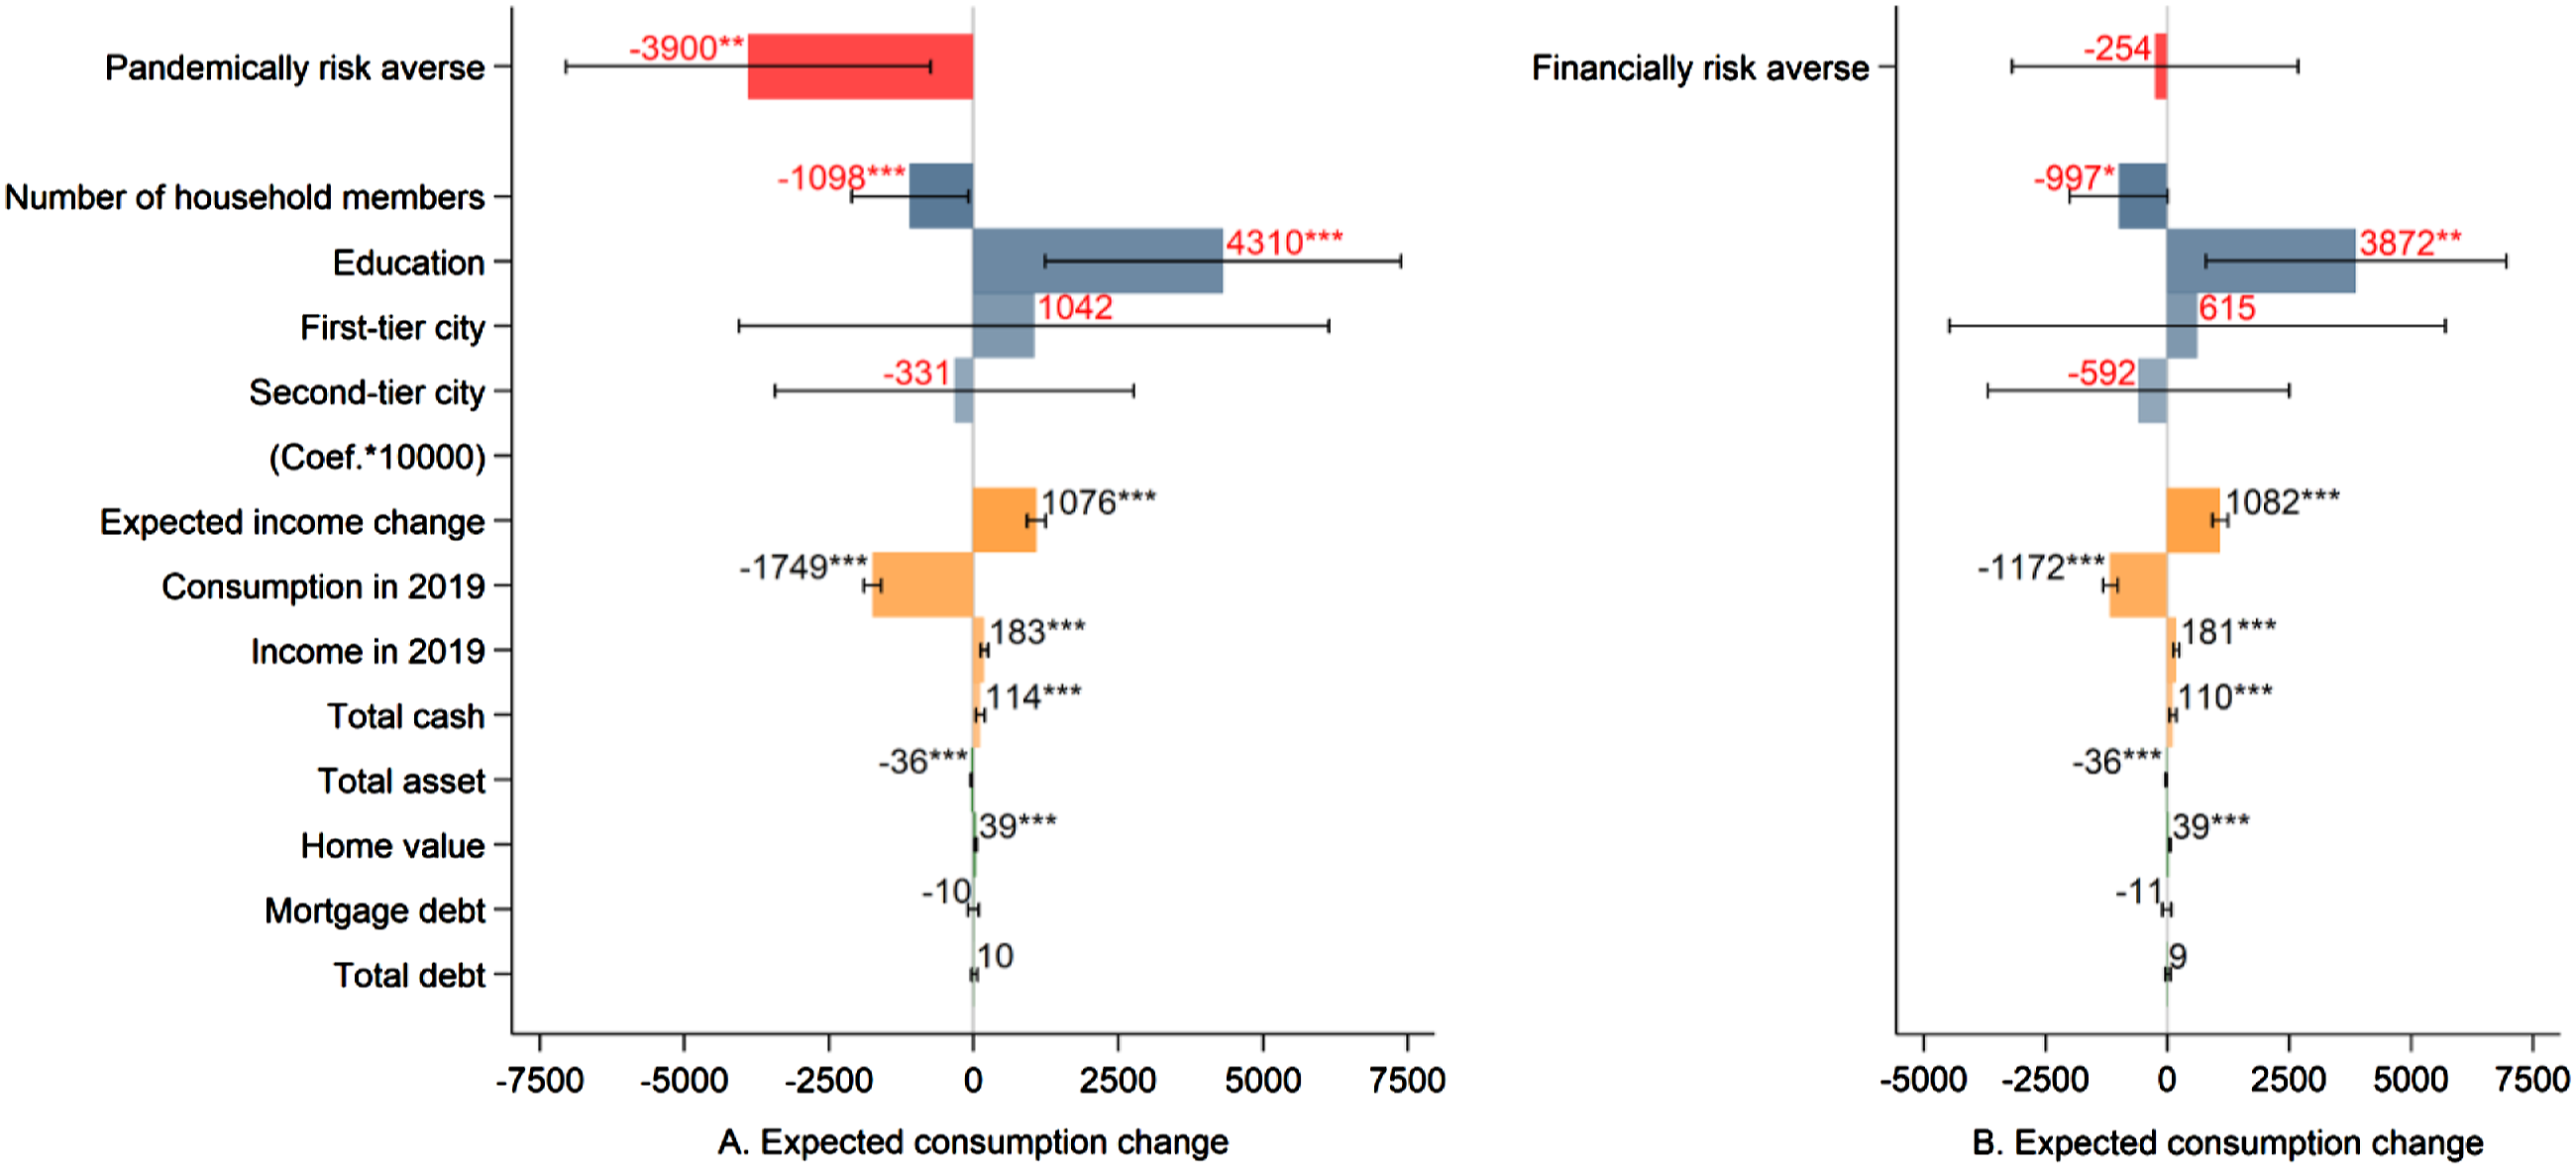
In addition to risk attitude, consumption behaviors during the pandemic are also affected by households’ financial and demographic characteristics. Panel A shows that education has a substantial effect on expected consumption. Households that have at least one member with a bachelor’s degree or above are expected to spend 4310 RMB more, which is larger than the effect of the risk attitude. Moreover, comparing the results in Panel A with those in Panel B, changing the domain of risk attitude from a financial one to a pandemic-specific one increases the estimated effect of education by more than 10% and also raises its significance level. This finding is consistent with the theory that individuals with higher education judge health risks more rationally (Chauvin 2018; Lai and Tao 2003).
There is no significant difference in anticipated consumption across city size (Chinese City Tier) 3 that the households reside in. However, the direction of the effect suggests that those living in larger cities or having higher education are more likely to behave as if they are living in a “COVID-free” environment during the recovery period. Being in a higher-tier city and more educated may give the individual access to better information as well as better analysis of such information. Therefore, timely and accurate information and education on the virus situation, such as infection probability, may help the public behave more rationally.
Other factors that have a sizeable effect on expected consumption correlate with consumption in an intuitive way: positively for expected changes in income and negatively for household size and the consumption level in 2019. We estimate that an average household plans to reduce their consumption by 1076 RMB for each 10,000 RMB reduction in expected income. On average, a household expects to reduce its consumption by 1098 RMB for each member who lives in the household and reduce it by 1749 RMB for every 10,000 RMB consumed in 2019. This may be because households with relatively high consumption level are more likely to be consuming discretionary items such as entertainment and recreation, including travel, which continue to be restricted during the recovery period.
We had expected the household’s debt level to decrease expected consumption because households with higher debt are likely to be more vulnerable when facing adverse shocks. However, both total household debt and mortgage debt turned out to have insignificant effects on consumption. This could indicate that households’ debt-to-income and debt-to-wealth ratios are still at a low level in China (Chan 2020), so the debt level does not play a significant role when households make consumption decisions.
Health Specific Risk Attitude
To understand further the pandemic risk attitude, we add measures of potential communicability of the COVID-19 virus. Specifically, given the communicable nature of COVID-19, of particular interest is the role of migration flow, both domestic and international, into a city. We use the percentage change in the city’s in-migration index from April 2019 to April 2020 to represent the magnitude of the population inflow relative to the city’s pre-COVID-19 inflow. By May 2020, the Chinese government had restricted international arrivals to only 15 designated cities 4 , and all arrivals from abroad were required to quarantine for 14 days in their initial arrival city before continuing on to their final destination. Therefore, it is reasonable to assume that only the residents in these point of entry cities would have possible exposures to COVID-19 from international migration. Thus, we construct an indicator variable that takes value 1 if a household’s city is designated as the first point of entry to capture the effect of international migration.
Even after the initial identification of COVID in Wuhan in early January 2020, domestic migration in China continued relatively unabated until mid-January, as the first three panels of Figure 1 illustrated. To reiterate, beginning in late January, interprovincial migration declined week-on-week and did not start to recover until around mid-March, with more substantial recovery occurring in April. This migration trend matches the pattern of dramatic rise and fall of the number of COVID cases in China during the period. The survey for our study was initiated during May 17–19, 2020, and the responses were received electronically in the following week, coinciding with the period in which China’s economic activities and migration movements began to steady.
The coefficients we report here are from the ZIP regression described in equations (1) and (2), and estimate by what percentage the odds ratio changes when the independent variables increase one unit from their mean. In addition, because the log of odds ratio is a positive monotonic transformation of the probability that a household’s dining out behavior is generated from the Poisson distribution, the sign of an estimated coefficient is equal to the sign of the independent variable’s marginal effect on the probability of willing to dine out.
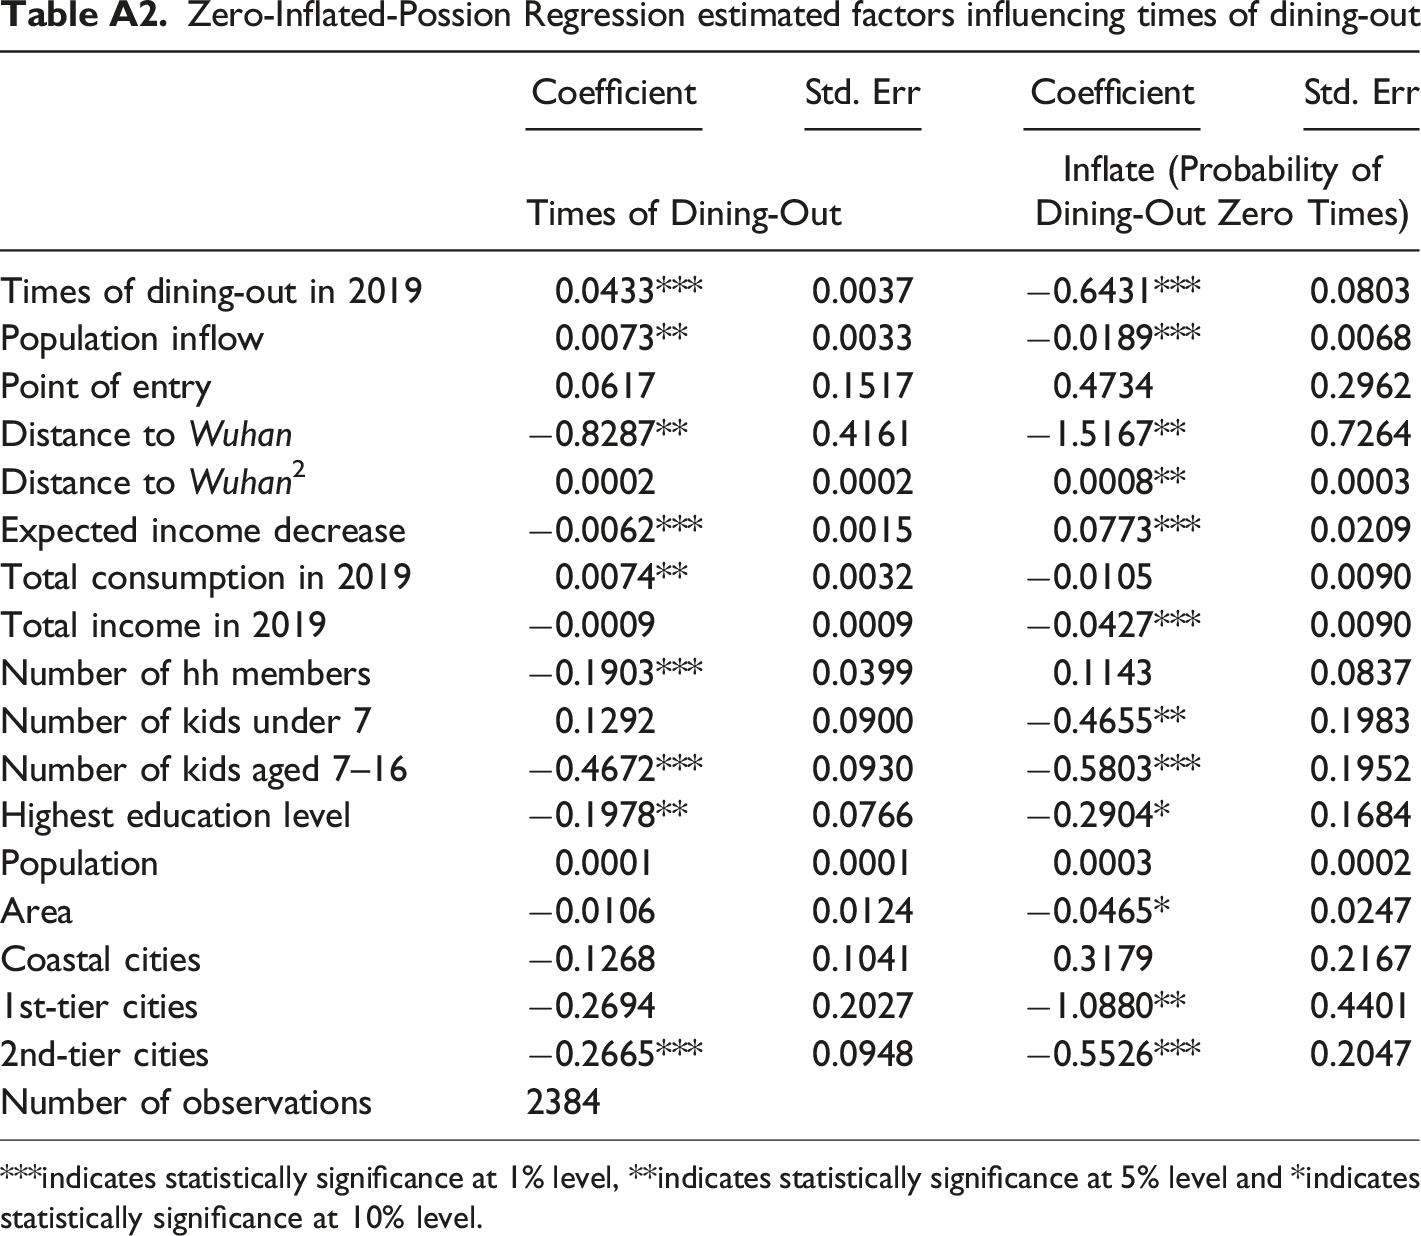
Zero-Inflated-Possion Regression Estimated Factors Influencing Times of Dining-Out.

***indicates statistically significance at 1% level, **indicates statistically significance at 5% level and *indicates statistically significance at 10% level. Regression results with more city and household level control variables are shown in Table A2
By May 2020, it appeared as if China had successfully controlled the spread of COVID-19 within its borders, with more than 90% of the provinces not reporting any local infection for more than a month. It was commonly believed by the public then that the only source of possible infection would come from foreign in migration, which explains the negative effect international migration has on dining-out decisions. Although, as suggested by Merchant (2021) there may be negative consequences to international migration if countries implement strict border controls, our result shows that such policy can also help residents to gain normal behavior through perceived safety of the environment, at least during the recovery period. In contrast, because domestic migration inflows no longer impose danger, domestic migration signals more social activities in the city and gives the public a higher confidence that their city is likely to be COVID-safe. The estimated effect of residing in the point of entry city suggests that even a potential of being exposed to international migration changes how individuals evaluate the health risk they face. However, the signal sent by domestic migration appears to be very different. Results suggest that the public may view domestic migration (or the attitudes of city administration as a proxy for tight or loose domestic migration) as a signal of the local government’s confidence that COVID-19 threats are under control. The willingness of the people from elsewhere in China to travel to their city may even help the public further believe that their city is COVID-safe.
In addition to migration inflow, a city’s size (tier level) also plays a role in dining-out behavior. Compared to small cities (third or lower-tier), residing in a first or a second-tier city increases the probability of being willing to dine out. At the household level, having a bachelor’s degree increases the probability while household size decreases it, though not significantly.
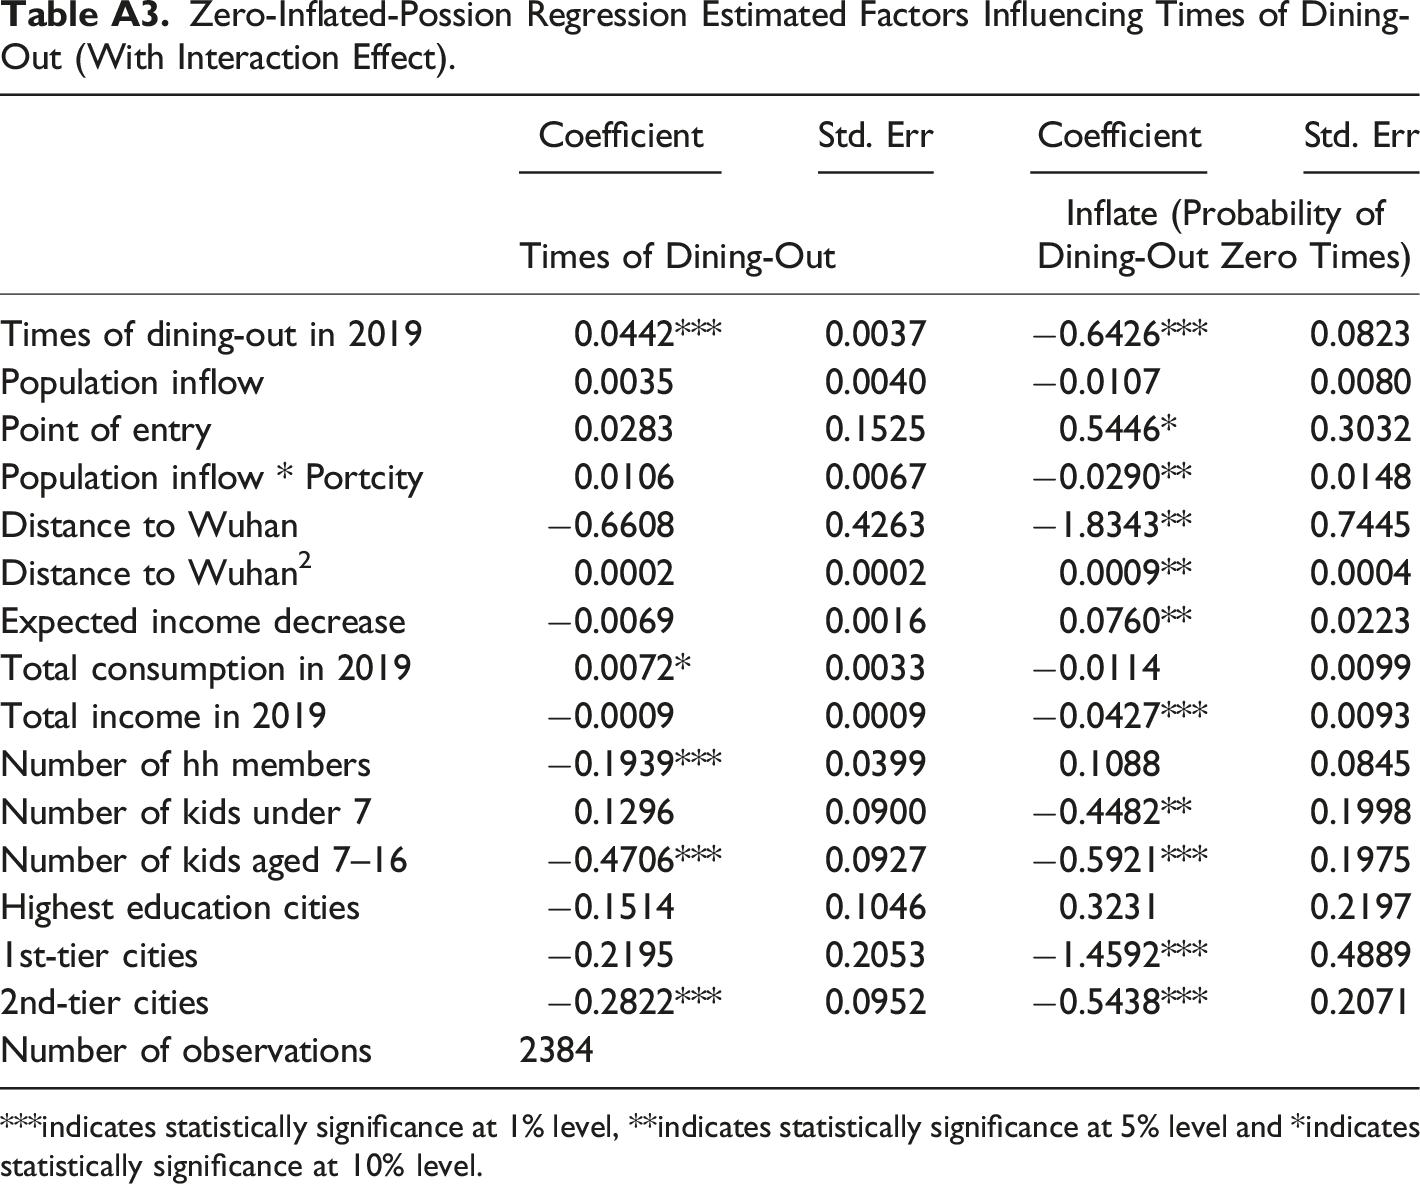
Zero-Inflated-Possion Regression Estimated Factors Influencing Times of Dining-Out (with Interaction Effect).
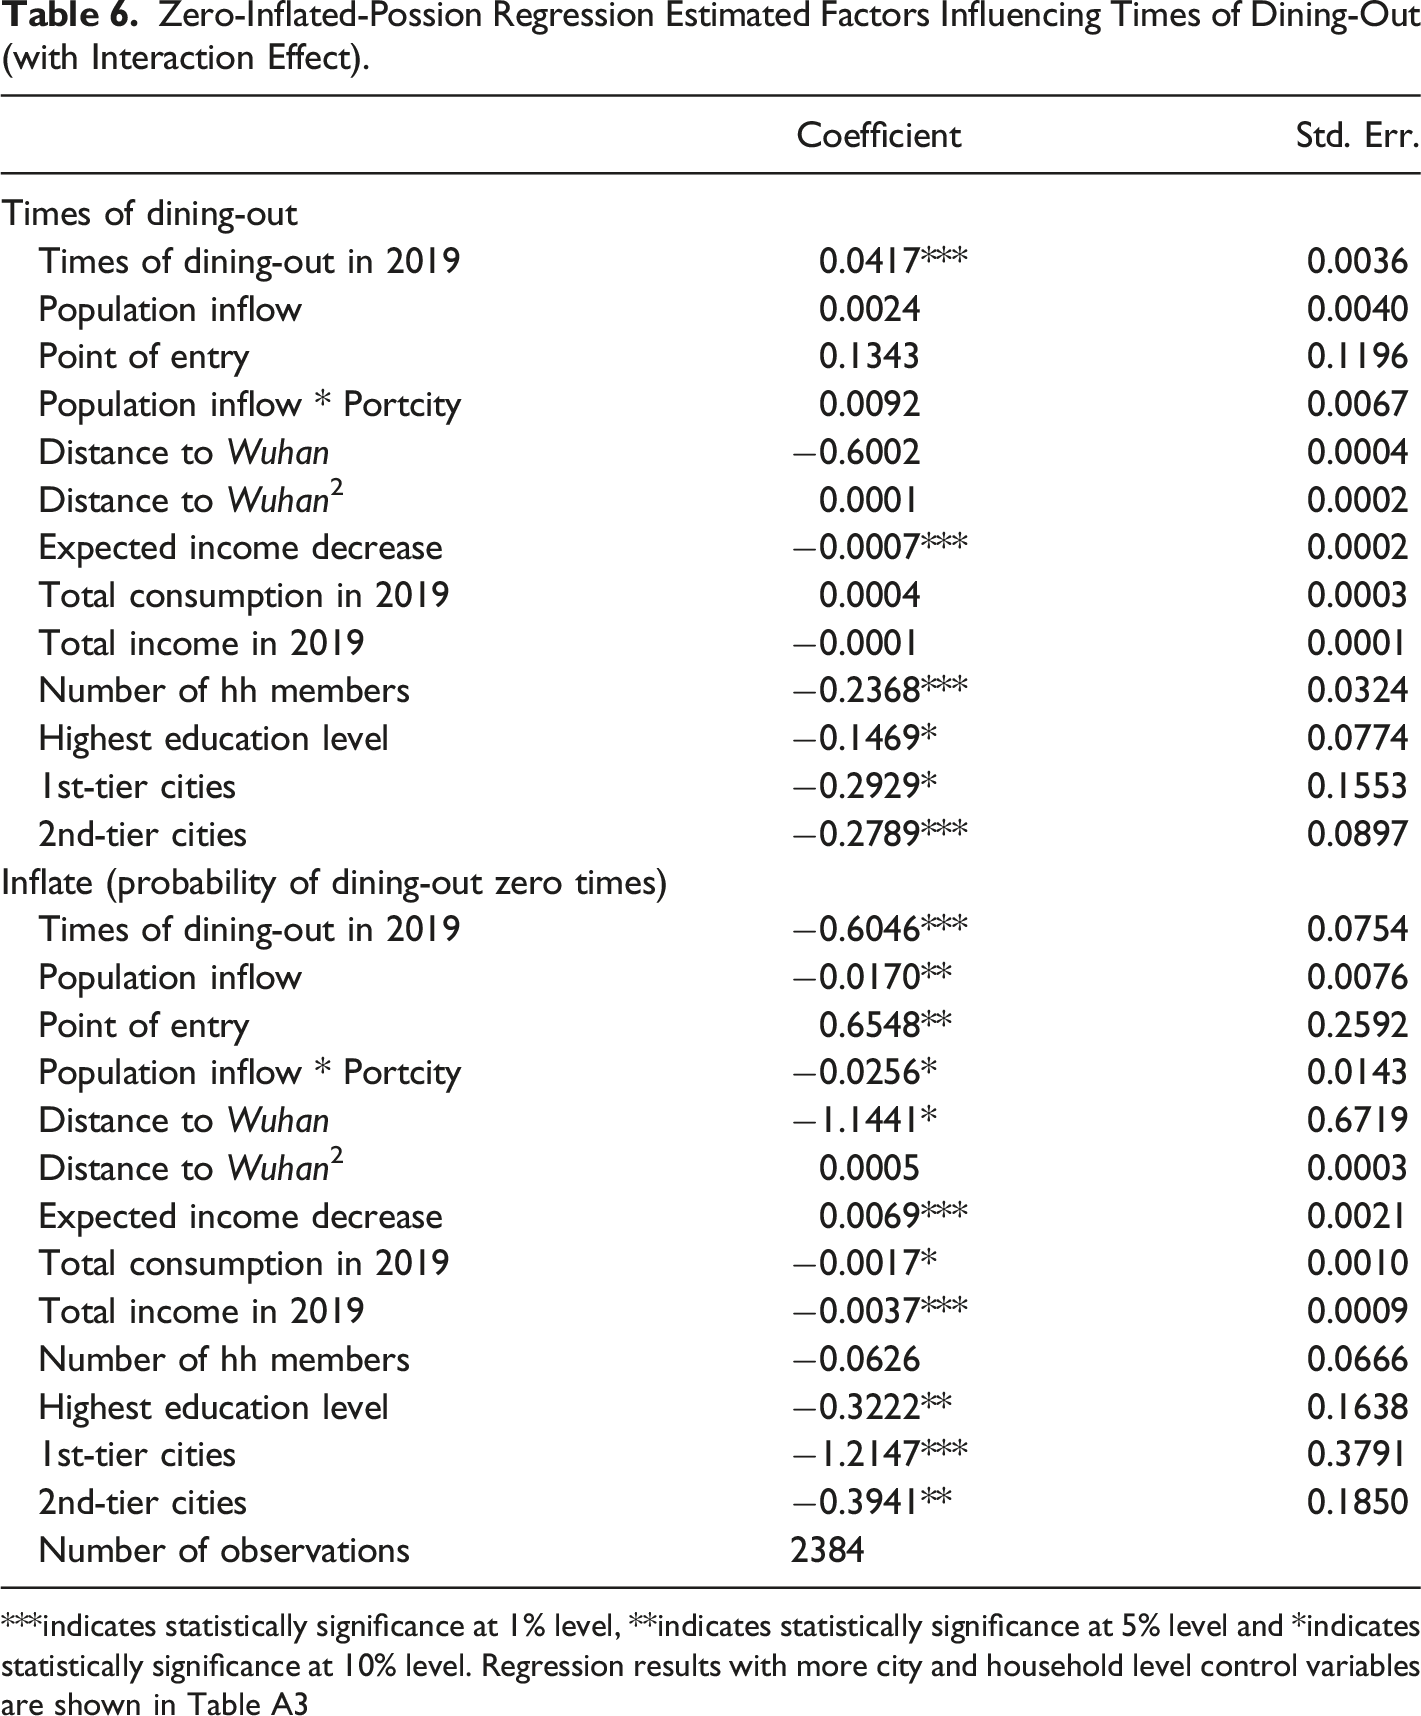
***indicates statistically significance at 1% level, **indicates statistically significance at 5% level and *indicates statistically significance at 10% level. Regression results with more city and household level control variables are shown in Table A3
We summarize our results visually in Figure 3 which documents the role of education and city size in the response to question about the frequency of dinning out. Determinants of dining-out behaviors (health specific risk averse attitude). In the first part of the two-part ZIP regression, the dependent variable is the log of the odds ratio that a household’s dining out behavior is generated by the Poisson distribution. That is, the log odds ratio that the household is willing to dine out (even though their actual observed frequency may be zero). The second panel shows the interactive effect of international and domestic migration by interacting the two terms in the ZIP regression. Colored bars indicate point estimates, while whiskers show 95% confidence bands.
Because COVID-19 is transmitted primarily from person to person, circulation of people is one of the most important determinants of the hazard posed by the current pandemic. Moreover, to the extent that travelers to a city are likely to visit the same entertainment and recreational areas that are popular with the locals, their presence is likely to be easily noticed. Thus, migration inflow is likely to be salient in the public’s perception of risk involved in their activities. There are two types of inflows though, domestic and international, and our results show that the public’s perceptions of the two are strikingly different in China despite both being a potential source of infections. Because China has been relatively successful in controlling the virus within its borders the public’s assessment of risk rises with international inflow but falls with domestic inflow. In fact, compared to other city-level characteristics, the domestic travel appears to send the strongest signal that the city is COVID-safe.
Since the world is unlikely to recover at the same pace, and complete border closure is neither practical nor possible, international migration inflows will continue to impose potential danger to countries that are in the process of recovery. Our study of the Chinese recovery experience shows that border controls have been important in controlling the entry of the virus and provided a preliminary strategy for recovery. In the Chinese case it largely prevented the import of viral infections but also for preventing the loss of public’s confidence gained by observing domestic inflow. For the public to believe that higher domestic travel is a signal of economic recovery and not an elevated risk for COVID to spread, effective border control worked. Now, with the most recent more contagious varieties it will be a test of the ability to control the spread of the virus solely with border controls.
Conclusions
This paper studies the role of individuals’ perception of health risk in their consumption behavior and the determinants of that perception during China’s pandemic recovery period and is situated in the context of spatially integrated social science which brings together social and economic approaches to spatial problems (Goodchild et al. 2000). As Mckee and Stuckler (2020) emphasize, the pandemic is both a health and an economic crisis and this paper provides a way to think about the issues they raise. We first show that changes in a household’s dining behavior better reveal the household’s perception of the pandemic risk than the traditional survey-based measure of financial risk attitude. We then show that the perception of safety increases with domestic population flows, but decreases strongly with international in-flows. By linking consumption behavior and domestic and international migration through the dining behavior, we show that once the pandemic has been controlled, a higher internal population flow can raise individuals’ confidence about the health risk in the public space and help mitigate the contraction in consumption. These results highlight the importance of individuals’ risk perception and the public’s movement that will be central in the economic recovery.
During a pandemic consumption behavior changes. The research reported in this paper advances our understanding of those changes, and how the response is linked to the perception of risk. The findings show that the change in a household’s dining behavior can be used as an indicator that captures the household’s perception of the risk posed by the pandemic and strongly correlates with their overall consumption expectations. COVID transmission is strongly linked to population flows, and changes in population flows, which are basic to economic recovery and appear to be potential signifiers of pandemic risk. When the viral transmission has been effectively controlled within national borders, the increase in internal flows is viewed by the public as a signifier of a safe environment.
There are of course limitations to our research. First, given the structure of the data, we can only established a correlation between expected consumption and households’ dinning behavior. Causative behavior is beyond the data we can use. Second, as we mentioned above, a higher population movement increases the spread of the virus but at the same time is necessary for economic recovery. In this paper, we focused specifically on how population flow helps the economic recovery but we are unable to analyze what is the optimal tradeoff, or could be a rule of thumb when balancing between controlling the COVID transmission and boosting the economy. We believe this will require contributions from scholars from multiple disciplines including public health, economics, demography and geographical spatial systems.
Footnotes
Author Contributions
X.C., W.A.V.C., J.S., and B.X. designed research, performed research, analyzed data, and wrote the paper. X.C., W.A.V.C., J.S., and B.X. jointly share the first authorship.
Declaration of Conflicting Interests
The author(s) declared no potential conflicts of interest with respect to the research, authorship, and/or publication of this article.
Funding
The author(s) received no financial support for the research, authorship, and/or publication of this article.
Notes
Appendix
OLS Estimated Effect of Risk Attitude on Expected Consumption Decrease in 2020 (Risk Attitude in Financial Domain vs. Health Domain). ***indicates statistically significance at 1% level, **indicates statistically significance at 5% level and *indicates statistically significance at 10% level. Zero-Inflated-Possion Regression estimated factors influencing times of dining-out ***indicates statistically significance at 1% level, **indicates statistically significance at 5% level and *indicates statistically significance at 10% level. Zero-Inflated-Possion Regression Estimated Factors Influencing Times of Dining-Out (With Interaction Effect). ***indicates statistically significance at 1% level, **indicates statistically significance at 5% level and *indicates statistically significance at 10% level.
Specification 1 (Financial Risk Attitude)
Specification 2 (Health Risk Attitude)
Coefficient
Std. Err.
Coefficient.
Std. Err.
Risk averse
151.4081
1509.1320
3899.9540**
1613.9610
Expected income decrease
0.1082***
0.0082
0.1075***
0.0081
HH total asset
0.0036***
0.0006
0.0036***
0.0006
HH total debt
−0.0009
0.0027
−0.0010
0.0027
Value of owning houses
−0.0039***
0.0008
−0.0040***
0.0008
Debt remained on houses
0.0010
0.0047
0.0009
0.0047
Total consumption in 2019
0.1757***
0.0078
0.1738***
0.0078
Total cash owned
−0.0104***
0.0039
−0.0109***
0.0039
Total income in 2019
−0.0180***
0.0032
−0.0182***
0.0032
Number of hh members
786.1733
641.8948
950.2041
644.9245
Number of kids under 7
−1871.2520
1686.8660
−2066.9070
1686.8900
Number of kids aged 7–16
2562.0360*
1369.3360
2342.7840*
1370.8030
Highest education level
−3643.2220**
1582.7980
−4104.9390***
1580.3040
Population
−1.9486
1.8401
−1.9074
1.8376
Area
−132.4881
173.6610
−143.6203
172.7150
Coastal cities
−821.0683
1868.1410
−923.5732
1864.8740
1st-tier cities
2436.4100
3879.4050
1907.9510
3874.0990
2nd-tier cities
1699.0650
1886.8660
1381.1670
1888.3500
Number of observations
3464
3464
Adjusted R2
0.2271
0.2284
Coefficient
Std. Err
Coefficient
Std. Err
Times of Dining-Out
Inflate (Probability of Dining-Out Zero Times)
Times of dining-out in 2019
0.0433***
0.0037
−0.6431***
0.0803
Population inflow
0.0073**
0.0033
−0.0189***
0.0068
Point of entry
0.0617
0.1517
0.4734
0.2962
Distance to Wuhan
−0.8287**
0.4161
−1.5167**
0.7264
Distance to Wuhan2
0.0002
0.0002
0.0008**
0.0003
Expected income decrease
−0.0062***
0.0015
0.0773***
0.0209
Total consumption in 2019
0.0074**
0.0032
−0.0105
0.0090
Total income in 2019
−0.0009
0.0009
−0.0427***
0.0090
Number of hh members
−0.1903***
0.0399
0.1143
0.0837
Number of kids under 7
0.1292
0.0900
−0.4655**
0.1983
Number of kids aged 7–16
−0.4672***
0.0930
−0.5803***
0.1952
Highest education level
−0.1978**
0.0766
−0.2904*
0.1684
Population
0.0001
0.0001
0.0003
0.0002
Area
−0.0106
0.0124
−0.0465*
0.0247
Coastal cities
−0.1268
0.1041
0.3179
0.2167
1st-tier cities
−0.2694
0.2027
−1.0880**
0.4401
2nd-tier cities
−0.2665***
0.0948
−0.5526***
0.2047
Number of observations
2384
Coefficient
Std. Err
Coefficient
Std. Err
Times of Dining-Out
Inflate (Probability of Dining-Out Zero Times)
Times of dining-out in 2019
0.0442***
0.0037
−0.6426***
0.0823
Population inflow
0.0035
0.0040
−0.0107
0.0080
Point of entry
0.0283
0.1525
0.5446*
0.3032
Population inflow * Portcity
0.0106
0.0067
−0.0290**
0.0148
Distance to Wuhan
−0.6608
0.4263
−1.8343**
0.7445
Distance to Wuhan2
0.0002
0.0002
0.0009**
0.0004
Expected income decrease
−0.0069
0.0016
0.0760**
0.0223
Total consumption in 2019
0.0072*
0.0033
−0.0114
0.0099
Total income in 2019
−0.0009
0.0009
−0.0427***
0.0093
Number of hh members
−0.1939***
0.0399
0.1088
0.0845
Number of kids under 7
0.1296
0.0900
−0.4482**
0.1998
Number of kids aged 7–16
−0.4706***
0.0927
−0.5921***
0.1975
Highest education cities
−0.1514
0.1046
0.3231
0.2197
1st-tier cities
−0.2195
0.2053
−1.4592***
0.4889
2nd-tier cities
−0.2822***
0.0952
−0.5438***
0.2071
Number of observations
2384