



Abstract
The vast majority of local governments in the United States have populations with less 5,000. Local government research, particular in the area of e-government, has focused on larger cities. This article addresses the gap in the research but examining empirically the factors that influence the adoption and development of Web sites by smaller local governments.
Introduction
Scholars interested in e-government often focus on larger government entities whose size and capacity enable them to develop sophisticated Web sites. This is particularly true of studies that examine local governments where larger cities and counties capture the bulk of attention (Holzer et al. 2008; West 2001). Yet, the majority of governments in the United States are small, with fewer than 10,000 residents. The focus on large cities thus misses most of what we call local government in the United States. By concentrating on large cities, we can also miss the fact that smaller governments are more likely to be in the early stages of Web site development or to have chosen deliberately not to develop a Web site. The virtual inequality described by Mossberger, Tolbert, and Stansbury (2003) is a reality smaller governments confront. The question is: why?
This article begins to address that disparity by examining a subset of local governments with relatively small populations. Drawing on data collected from 428 local governments in northeast (NE) Ohio, we consider two basic questions: first, why do some local governments develop Web sites when others do not? Second, why do some local governments include many features on their Web site and others include only a few?
NE Ohio, which includes thirteen counties with a total population of 4 million citizens, offers a useful target population for examining local government technology. There are a lot of local governments in NE Ohio (Ohio ranks sixth in the number of local governments in the country, and NE Ohio is well represented among these local governments). The region also includes the four major forms of general-purpose local governments in the United States: counties, cities, villages, and townships. In addition, the region’s mix of urban and rural areas, its socioeconomic variation, and its racial diversity make it a useful prism through which to understand public sector information technology (IT) practices elsewhere.
The remainder of the article is organized as follows. In the section on Literature Review and Hypotheses, we discuss the literature and describe our hypotheses. The next section describes data and methodology followed by the section on results. And the final section is on conclusion.
Literature Review and Hypotheses
Why do local governments adopt a Web site? And, what factors account for the sophistication of local government’s Web site? Numerous studies explain public sector Web sites and a comprehensive review of the entire literature is beyond the scope of this article. However, broadly speaking, three distinct approaches are typically used to explain public sector Web site development.
One common approach views Web site development as evolutionary; driven less by a particular actor or group than by a kind of survival-of-the-fittest logic that drives out old, less efficient technologies to make way for newer more productive ones. As governments and citizens realize the benefits of new technology, the public sector naturally follows an upward trajectory, adopting newer and more sophisticated stages of Web development (Moon 2002; Layne and Lee 2001; Hiller and Bélanger 2001).
A second argues that public sector Web development is driven by political, business, or administrative elites. There are several variations on this approach. Diffusion theory suggests that Web site innovation in one community spreads to neighboring communities as a result of local elites learning from each other (Shipan and Volden 2008; Baybeck, Berry, and Siegel 2011). Growth theory suggests that policy and societal elites adopt more sophisticated technology in order to compete with neighboring committees (Jonas and Wilson 1999). Others like Chris Reddick (2004) focus on administrators and bureaucratic structures. Reddick finds that having a professional city manager and a separate IT department leads a city to develop more advanced Web technology. While these top-down approaches differ in how they understand the e-government process, they share an emphasis on elites as the driving force behind Web site development.
A third approach views the development of public sector IT as a function of population demographics, that is, the size, wealth, health, and intellect of the population. Studies by the Municipal e-Government Assessment Project and Wohlers (2008), for example, reveal that smaller and less populated cities have a less-sophisticated Web presence. A larger literature on the digital divide identifies growing gap in the adoption of technology between poor and wealthy localities (Mossberger, Tolbert, and Stansbury 2003; Kaylor 2005). A variation on the theme of development-from-below is human capital theory (HCT). HCT stresses the importance of education, knowledge, health, skills, and income to explain a locality’s administrative development. Gains in productivity and efficiency are a function of investments in health, education, and skill (human capital) as well as investment in physical capital like modern plants and new machinery (Schultz 1959, 1961). A range of economists from Gary Becker (1975) to Kenneth Arrow (1962) to Greg Mankiw, Romer, and Weil (1992) developed the theory further, focusing on the connection between human capital and efficiencies in private markets.
More recently, Siau and Long (2004) use human capital theory to explain the development of the public sector and, in particular, government’s adoption and implementation of e-government technologies cross-nationally. Using the United Nations Human Development Index (HDI) 1 across 160 countries, Siau and Long find that the higher the level of human capital development, the more advanced the level of e-government development. Siau and Long compare national governments and use a broad measure of human capital development. They argue that efficiency drives the process: higher levels of human capital lead to greater productivity gains from technology thus prompting government to make investments. A related political argument says that as a human capital grows, citizen comes to expect more from government regardless of whether it increases efficiency or not. Norris, Fletcher, and Holden (2001), for example, find that the more educated and wealthier citizens are, the more pressure they put on their government to develop sophisticated Web sites.
Evolutionary, top-down or bottom-up approaches to explain Web site development are distinct but not mutually exclusive. Governments may develop Web technology to compete with other cities, to meet the demands of a more educated population, and because they recognize the advantages of new technologies. Each of these explanations may be in play at the same time. This research does not weigh in on which approach is superior since our view is that each approach has value. Instead, we build on the bottom-up approach, to focus on how population and societal factors contribute to Web technology in a relatively understudied subset of smaller villages, townships, and cities.
With an eye toward population and societal factors, the article considers several hypotheses:
Education Hypothesis: The more educated the population, the more likely the citizens will be able to take advantage of sophisticated Web sites that facilitate, for example, two-way communication between government and citizens or government and business. More educated populations will also be aware of Web features in other communities and, thus, pressure their own governments to do more with their Web site. In short, we expect that the more educated a community, the more likely a locality is to have a Web site and have more features.
Income Hypothesis: Wealthier citizens and businesses are more likely to take advantage of newer Web site technology. Bill and tax payment tools, for example, are particularly suited to higher-income earners and businesses who pay taxes and have accounting systems to take advantage of the software. Wealthier citizens and businesses are also likely to press government for advanced technology. And wealthier communities are likely to generate the tax revenue necessary to make investments in new technology. We thus hypothesize that the wealthier the community, the more likely a community is to have a Web site and more features on their Web site.
Age Hypothesis: Younger people are more comfortable, more experienced, and more knowledgeable about technology than older citizens. A younger population is thus more likely to take advantage of new Web technology. A number of cities have made use of social networking Web sites to connect with citizens. Such Web sites are more likely to be used by younger residents than older ones. At the same time, as younger residents become engaged in local politics, they are likely to press government to adopt more advanced Web technology in order to connect to younger residents. We thus hypothesize that the younger the population, the more likely a local is to have a Web site and to have a more advanced Web site with more features.
Urban/Rural Hypothesis: Citizens in urban areas are able to make greater use of government Web site features than citizens in rural areas. Broadband connectivity is higher in urban areas. And urban residents are more likely than their rural counterparts to engage with local governments through recreational and social services, regulation and zoning, and health and safety. We thus hypothesize that the more urban a locality, the more likely it is to have government Web sites as well as a larger number of Web features.
Population Hypothesis: More densely populated areas require higher levels of public service from local governments. The potential benefits from a government Web site are, thus, higher in more densely populated areas. We hypothesize that the higher the population density, the more likely the locale is to have a Web site as well as more features on its Web site.
Housing Age Hypothesis: In our discussions with IT professionals in cities around Ohio, we heard that the age of the housing stock can have an impact on a local government’s technology policy. Newer neighborhoods are more likely to have access to broadband technology than older neighborhoods. Although this is likely to diminish as broadband technology becomes widely available, it remains an issue in smaller localities. We thus hypothesize that the older the housing stock is, the less likely a community is to have a Web site or advanced Web features.
Data, Measurement, and Methodology
The data used here come from a variety of sources. The primary data were compiled through searches of local government Web sites in NE Ohio during a four-month period, from October 2008 to January 2009 and then updated in February 2011. The area consists of thirteen counties, which comprises the majority of NE Ohio. To compile the data, we enlisted the professional help of a government IT specialist in NE Ohio, who is knowledgeable regarding both the management of local government Web sites and the e-government practices among NE Ohio local governments. 2
Using an annual report published regularly by the Ohio Secretary of State’s office (Brunner n.d.), we identified a total of 428 general-purpose governments: 13 counties, 102 cities, 112 villages, and 201 townships. This annual report, along with numerous Internet Web queries and links from NE Ohio county Web sites, enabled us to identify and locate Web addresses for local government jurisdictions in our sample. 3 This effort identified a total of 285 local government jurisdictions with Web sites.
The dependent variables correspond to our three main questions and include (1) existence of a government Web site; (2) number of features; and (3) page rank. The search of government Web sites generated data coded “1” if a Web site exists and “0” if it does not. Drawing on surveys conducted by the International City/County Managers Association and others (Holzer et al. 2008), thirty-three evaluative criteria were used to code Web attributes. Each criteria was coded as “1” if the attribute existed and “0” if it did not.4
Several steps were taken to increase the validity of the coding. First, our IT specialist developed a coding guidebook and trained Web site coders on how to use it. Each Web site was coded separately by two individuals, and the results of these coding processes were then compared to identify discrepancies. In cases of discrepancies, a third reviewer was used. And finally, these resolved discrepancies were then spot-checked using a fourth review conducted by our IT specialist to identify any idiosyncratic or systematic sources of error on the part of the third coder. The coding designations that resulted after this final review are presented in this article.
Our independent variables, taken from the United States’ Census, include the percentage of college graduates, median family income, median age, percentage of the population in rural areas, population density (population/land area), and the median age of the housing stock.5 Variables that are percentages are ratio-level measurements ranging from 0 to 1. All other variables are raw numbers. In several of our models, we excluded the thirteen counties because they were outliers and because current demographic data for counties were unavailable.
Results
Our research tests a number of hypotheses to explain three separate but related questions: (1) why do some local governments develop a Web site and others do not? (2) among those communities that have Web sites, what explains the number of attributes on the Web site? and (3) among communities that have Web sites, what explains the Web site’s level of popularity? Each question is taken up separately below.
Web Site Adoption
In our analysis of Web sites, we found all 102 cities and 13 counties in NE Ohio have Web sites. Among smaller governments, Web presence is more uneven. Just under half of townships (49 percent) and nearly two-thirds of villages (63 percent) in our study have government Web sites. Overall, two-thirds of the local governments had Web sites. These findings are in line with the e-government literature that finds smaller governments are less likely to use the Web than larger governments. At the same time, we find that local governments with fewer than 5,000 residents are making significant in-roads in use of the Web. This finding is particularly interesting, given their lack of resources.
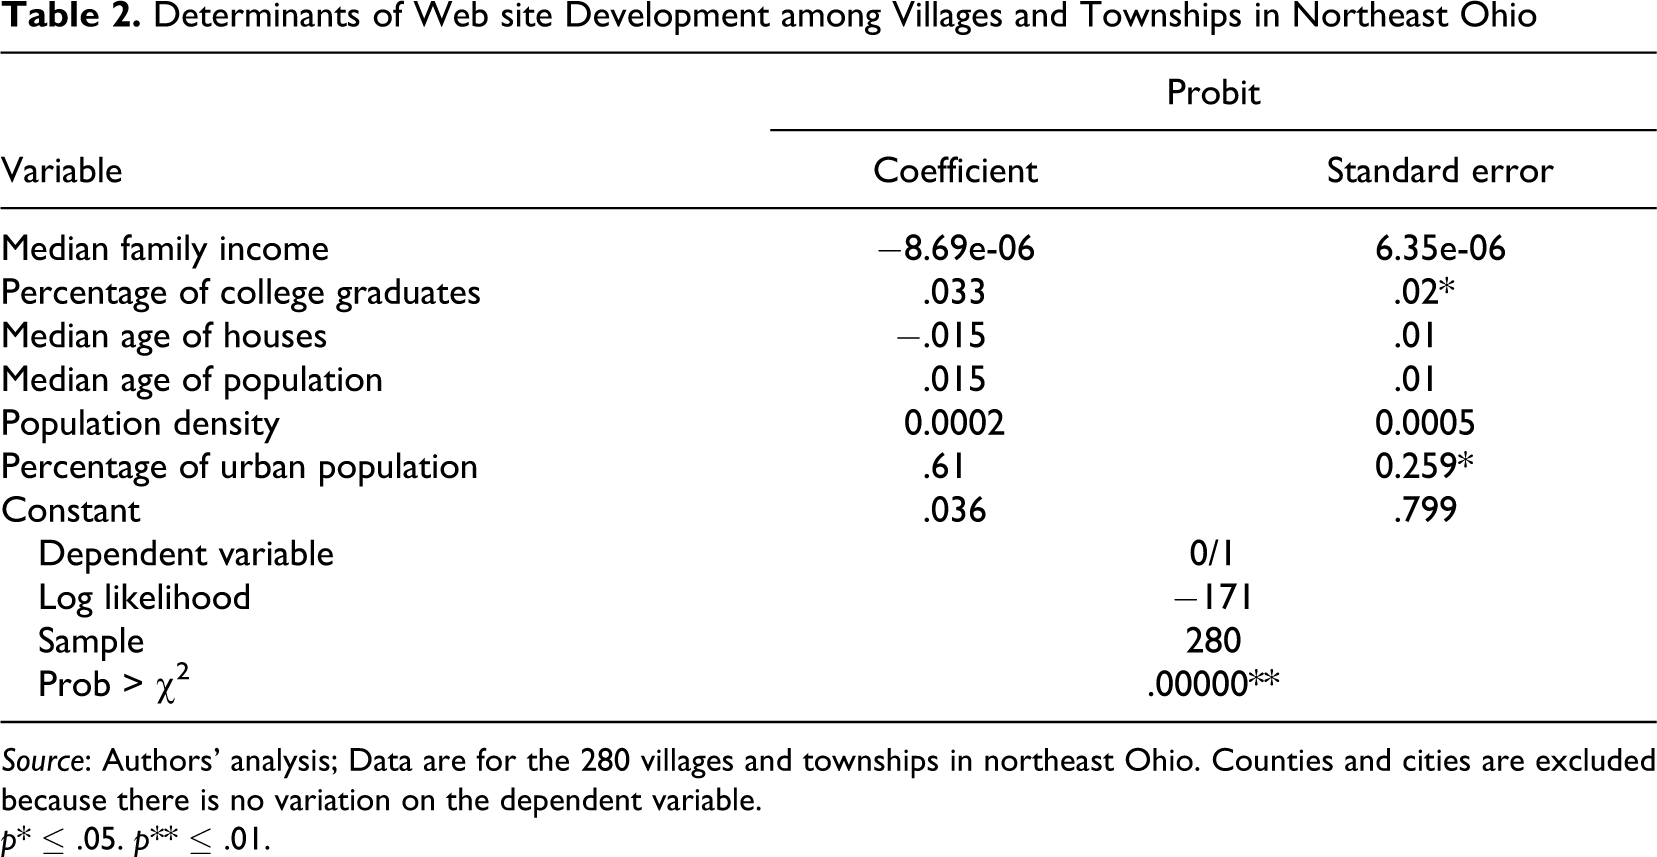
Since nearly all cities and counties in our data set have a Web site, we examine villages and townships as a group to determine why some have a Web site and other do not. Because the dependent variable is binary, we use a probit regression model. In order to fit the model, a maximum likelihood estimate is used. Table 2 describes the results of the analysis.
Web site Presence among Northeast Ohio Local Governments, by Local Government Type

Source: Authors’ analysis of local government Web sites in NE Ohio.
Determinants of Web site Development among Villages and Townships in Northeast Ohio
Source: Authors’ analysis; Data are for the 280 villages and townships in northeast Ohio. Counties and cities are excluded because there is no variation on the dependent variable.
p* ≤ .05. p** ≤ .01.
Across smaller local governments in NE Ohio, we found that two factors play a role in determining whether a locality adopts a Web site. First, the level of education in the community is a positive and statistically significant influence on Web site development. The more college graduates in the community, the more likely a community is to have a Web site. Second, urban communities are more likely to have Web sites than rural communities. The percentage of urban population is positive and statistically significant. Surprisingly, we did not find support for our income, age, and population density hypotheses. Even when we removed the education variable, we did not find per capita income to be statistically significant. The findings suggest that in terms of local government Web sites, the virtual inequality identified by Mossberger, Tolbert, and Stansbury (2003) may be a rural/urban and education schism, rather than one defined by age or income. Next, we turn to the content of local government Web sites.
Web Site Content
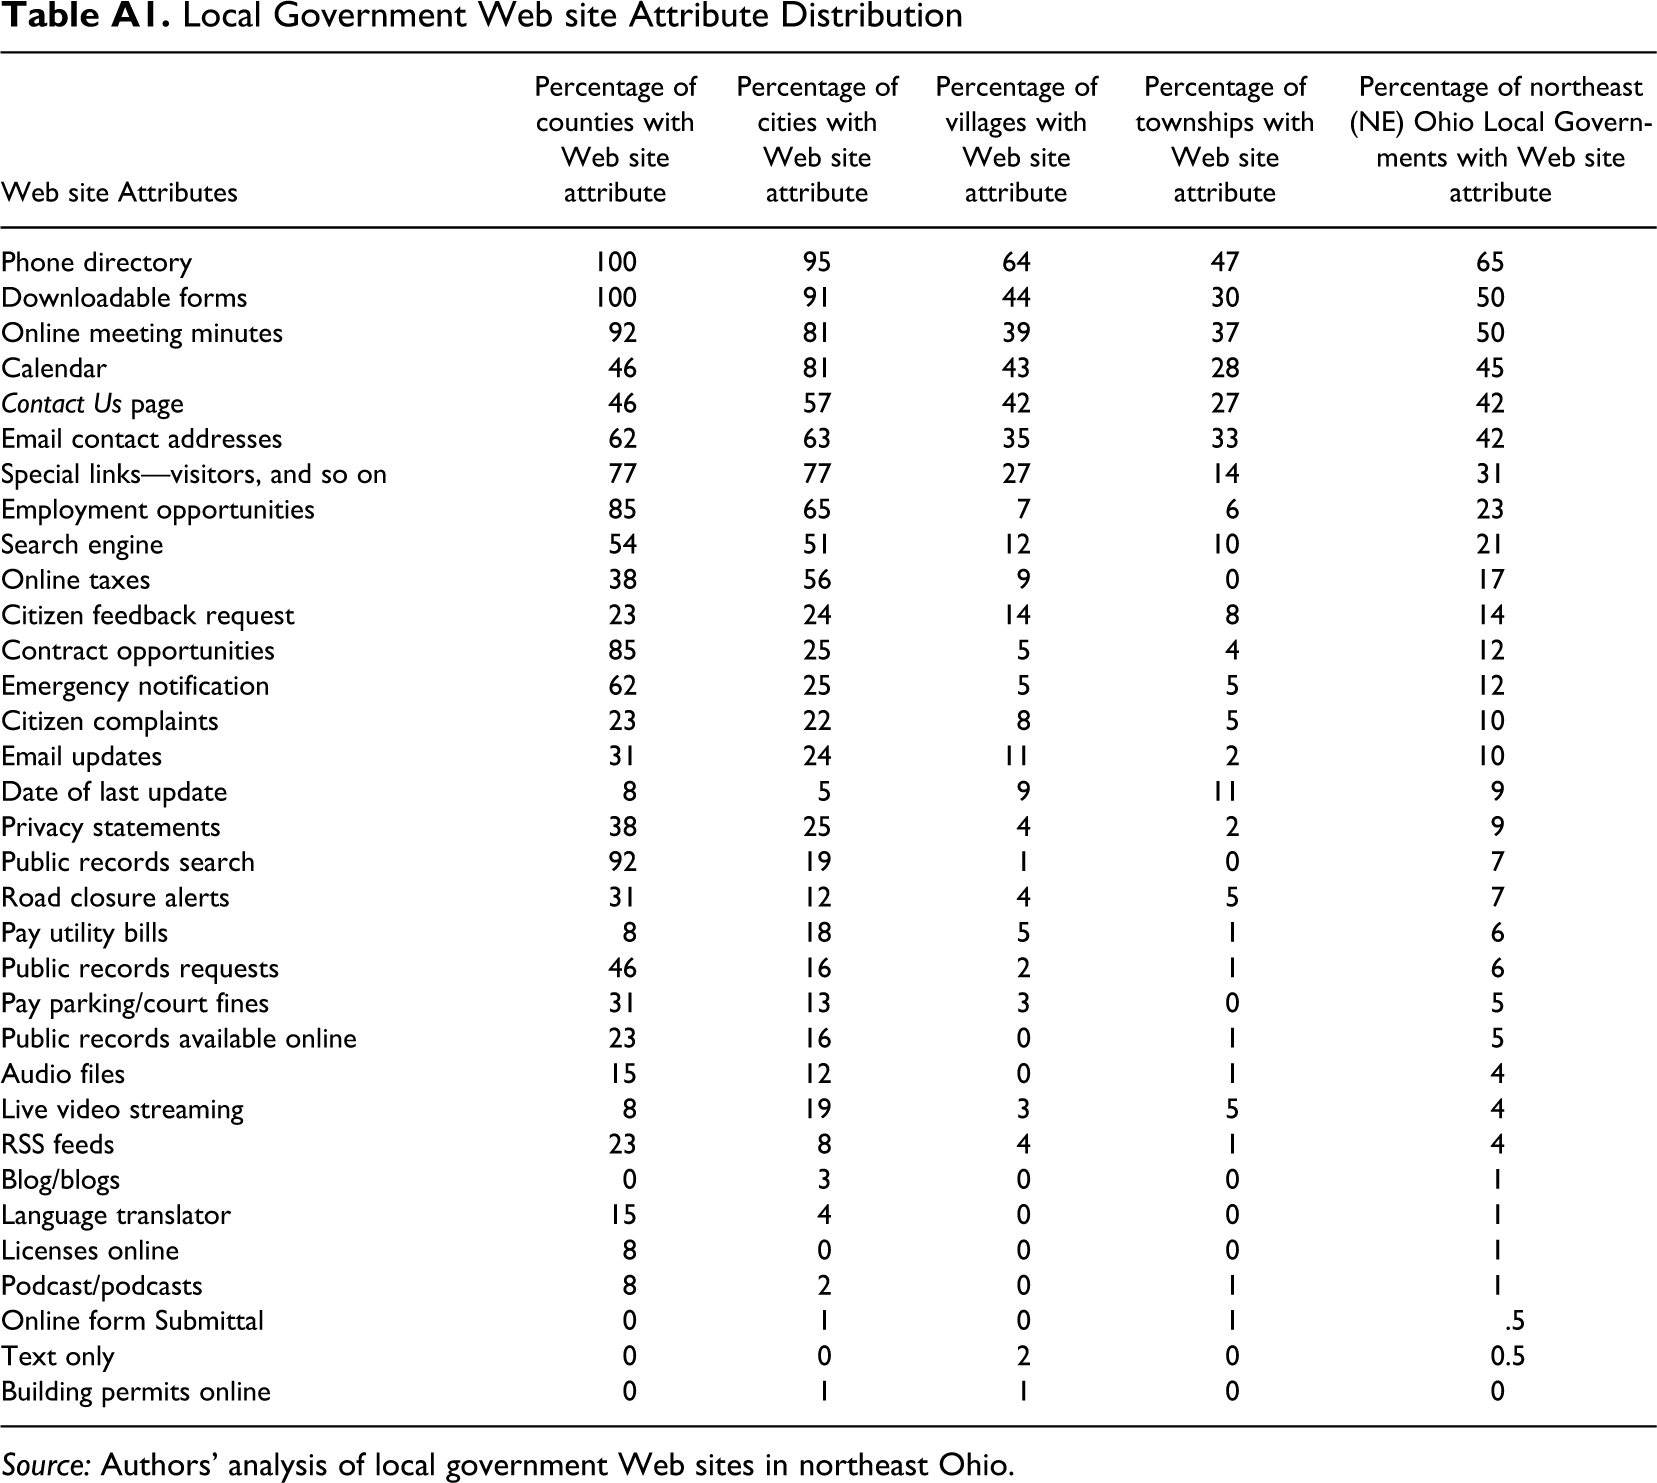
In our analysis, we found significant variation in content of local government Web sites. Appendix A breaks down the features by local government type. The question we take up here is: what are the determinants of a Web site’s content, as measured by number of features? Before presenting the results of our hypothesis testing, two methodological points are in order.
First, our dependent variable is the number of features located on a government’s Web site. The average number of attributes is 7.6 and the attributes are normally distributed. Our selection of attributes is based on the work of the International City/Country Management Association (ICMA) as well as others. However, we recognize that the list of features is subjective and could be done differently by another researcher. In addition, we weight each feature the same (1) which may not be justified, given that someone might reasonably value one feature, online fee payment for example, as more important than an e-mail directory.
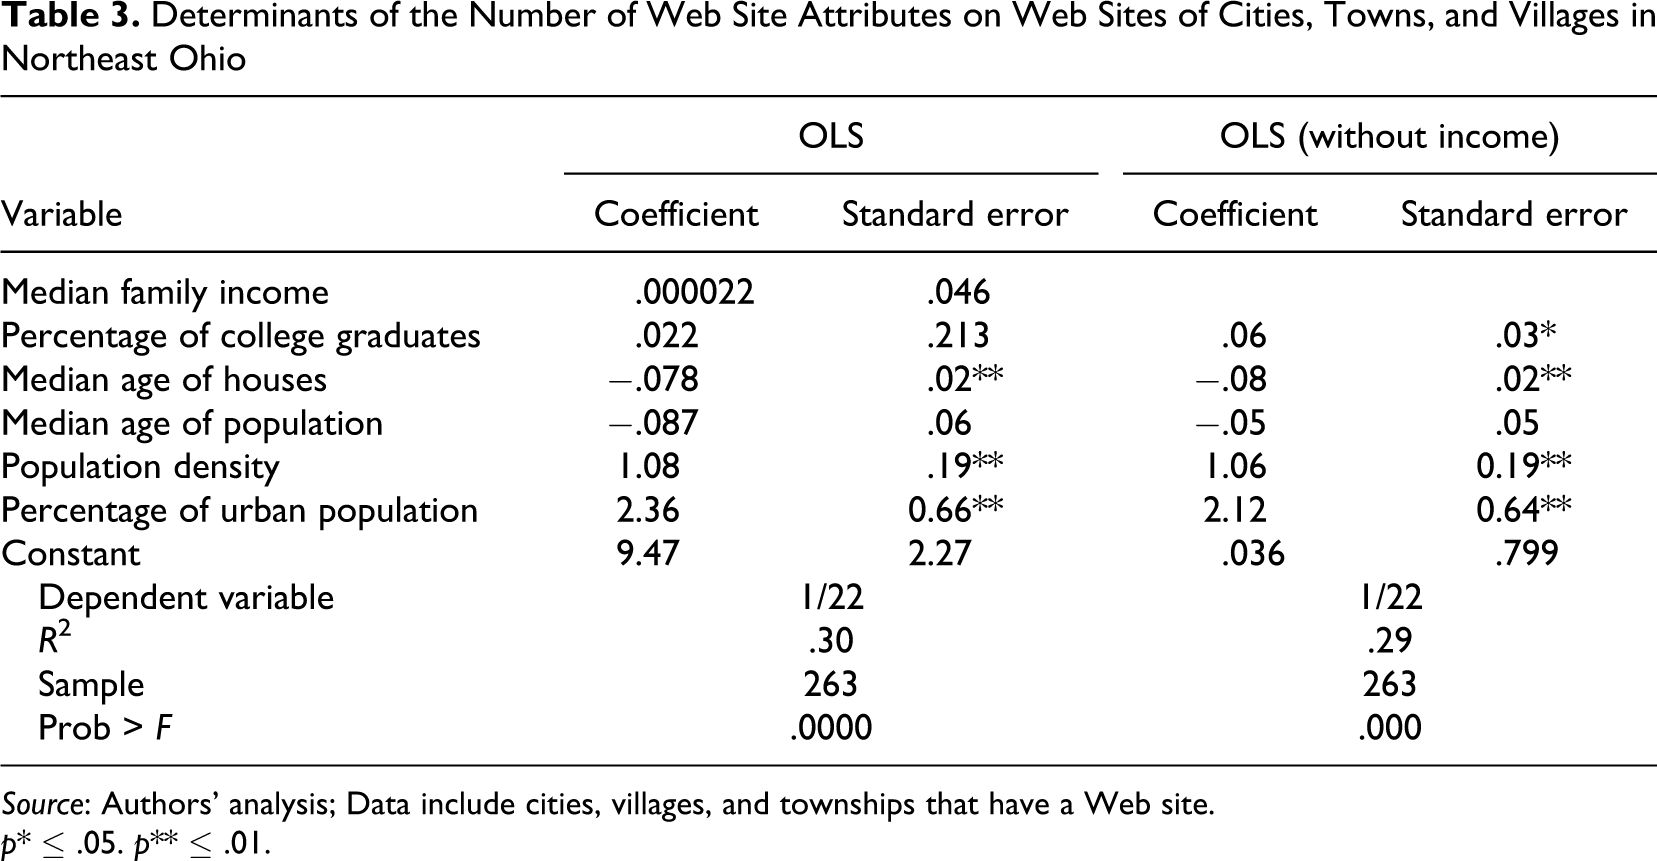
A second methodological problem is censoring. In the analysis below, we test our hypotheses on localities that have a Web site. We thus omit localities that do not have Web sites and it is reasonable to assume that the factors that keep a community from developing a Web site might also affect the number of features included on the Web site. A Heckman Probit model was used on the entire data set to correct for the problem; however, it was difficult to identify a variable that would influence whether a locality has a Web site but not the number of features included. Nevertheless running the Heckman Probit, we found that the results were similar to running a standard ordinary least squares regression on localities that have Web sites. In addition, we felt that examining localities with Web sites provided interesting information on local Web development. Finally, we omit data on the thirteen counties for two reasons. One, their size and responsibilities set them apart from cities, villages, and towns. And second, a number of our independent variables were unavailable for counties. Table 3 describes the results of the analysis.
Determinants of the Number of Web Site Attributes on Web Sites of Cities, Towns, and Villages in Northeast Ohio
Source: Authors’ analysis; Data include cities, villages, and townships that have a Web site.
p* ≤ .05. p** ≤ .01.
Since family income and percentage of college graduates are closely correlated, we ran two versions of our model: one with family income and one without. We find no evidence that a family’s income or the median age of the population play a role in determining the number of attributes on a local government’s Web site. When we include income, population density and urban percentage are statistically significant and positive. Interestingly, we find that the median age of the home in the community explains some of the variation. The older the housing stock, the fewer attributes on a government’s Web site.
When we omit family income from the model, our results are similar except that we find support for our education hypothesis: the percentage of college graduates is positive and statistically significant. A 10 percent increase in the number of college graduates increases the number of Web attributes by two.
In short, we find support for some of our hypotheses but not for others. In addition to education, we find support for our urban, population, and housing age hypotheses. We find no support for our income or generational hypothesis.
Conclusion
The results of our Web site surveys are consistent with previous suggestions that the development of e-government capacities is not inevitable. Among the 428 local governments in our sample, only a handful appear to be heavily engaged in using a wide range of Web site elements to engage citizens. Most of have a reasonably modest Web presence, as the average number of Web site attributes identified is approximately seven—less than one-fifth of the universe we identified for investigation. In addition, one-third of the local governments we investigated still do not appear to have any World Wide Web site presence at all. The World Wide Web is now well over ten years old, and this study reenforces the conclusion that we are still some distance from realizing the full potential that some observers predicted.
Second, we find evidence that the more educated and urban the population, the more likely it is for the local government to have a Web site. Other possible factors that might affect a local government’s decision to develop a Web site were not statistically significant including income, age of the population, age of the housing stock, or population density.
And finally our analysis finds that the number of attributes included on a government’s Web site is, in part, a function of: population density (a positive factor); percentage of the population that lives in urban areas (positive factor); and the age of the housing stock (a negative factor). When we remove income from the analysis, we also find that the level of education is a positive and statistically significant influence on the number of Web site attributes.
What does this mean for public officials seeking to develop a strategy for creating a Web presence or enhancing their Web site? The most important implication from our findings is that neither policy makers nor citizens should take the development of government Web sites for granted. While there is significant evidence that government Web sites offer innovative ways by which governments can communicate with and serve citizens and businesses, the adoption and implementation of Web technology is by no means a natural process. Societal and demographic factors shape the context in which public officials make choices. For example, our findings suggest that it is particularly important for public officials in rural communities or communities with lower levels of human capital to demonstrate the value-added of a government Web site. This can be accomplished through outreach to the broader community including churches, schools, and businesses. Officials can also demonstrate the value of a government Web site by tailoring Web features and applications to the particular needs and demands of a locale’s residents.
In short, while the research presented here confirms many of the conclusions reached in previously published e-government literature, it also suggests that the growth in e-government is neither uniform nor inexorable. The findings here underscore the importance of societal factors in creating challenges and opportunities for policy makers seeking to build a Web presence for their government. While the research underlying this article must be viewed as preliminary, it does provide direction for future research efforts that take account of the differing purposes of government and the ways in which they may affect e-government both now and in the future.
Footnotes
Appendix A
Local Government Web site Attribute Distribution
| Web site Attributes | Percentage of counties with Web site attribute | Percentage of cities with Web site attribute | Percentage of villages with Web site attribute | Percentage of townships with Web site attribute | Percentage of northeast (NE) Ohio Local Governments with Web site attribute |
|---|---|---|---|---|---|
| Phone directory | 100 | 95 | 64 | 47 | 65 |
| Downloadable forms | 100 | 91 | 44 | 30 | 50 |
| Online meeting minutes | 92 | 81 | 39 | 37 | 50 |
| Calendar | 46 | 81 | 43 | 28 | 45 |
| Contact Us page | 46 | 57 | 42 | 27 | 42 |
| Email contact addresses | 62 | 63 | 35 | 33 | 42 |
| Special links—visitors, and so on | 77 | 77 | 27 | 14 | 31 |
| Employment opportunities | 85 | 65 | 7 | 6 | 23 |
| Search engine | 54 | 51 | 12 | 10 | 21 |
| Online taxes | 38 | 56 | 9 | 0 | 17 |
| Citizen feedback request | 23 | 24 | 14 | 8 | 14 |
| Contract opportunities | 85 | 25 | 5 | 4 | 12 |
| Emergency notification | 62 | 25 | 5 | 5 | 12 |
| Citizen complaints | 23 | 22 | 8 | 5 | 10 |
| Email updates | 31 | 24 | 11 | 2 | 10 |
| Date of last update | 8 | 5 | 9 | 11 | 9 |
| Privacy statements | 38 | 25 | 4 | 2 | 9 |
| Public records search | 92 | 19 | 1 | 0 | 7 |
| Road closure alerts | 31 | 12 | 4 | 5 | 7 |
| Pay utility bills | 8 | 18 | 5 | 1 | 6 |
| Public records requests | 46 | 16 | 2 | 1 | 6 |
| Pay parking/court fines | 31 | 13 | 3 | 0 | 5 |
| Public records available online | 23 | 16 | 0 | 1 | 5 |
| Audio files | 15 | 12 | 0 | 1 | 4 |
| Live video streaming | 8 | 19 | 3 | 5 | 4 |
| RSS feeds | 23 | 8 | 4 | 1 | 4 |
| Blog/blogs | 0 | 3 | 0 | 0 | 1 |
| Language translator | 15 | 4 | 0 | 0 | 1 |
| Licenses online | 8 | 0 | 0 | 0 | 1 |
| Podcast/podcasts | 8 | 2 | 0 | 1 | 1 |
| Online form Submittal | 0 | 1 | 0 | 1 | .5 |
| Text only | 0 | 0 | 2 | 0 | 0.5 |
| Building permits online | 0 | 1 | 1 | 0 | 0 |
Source: Authors’ analysis of local government Web sites in northeast Ohio.
Appendix B
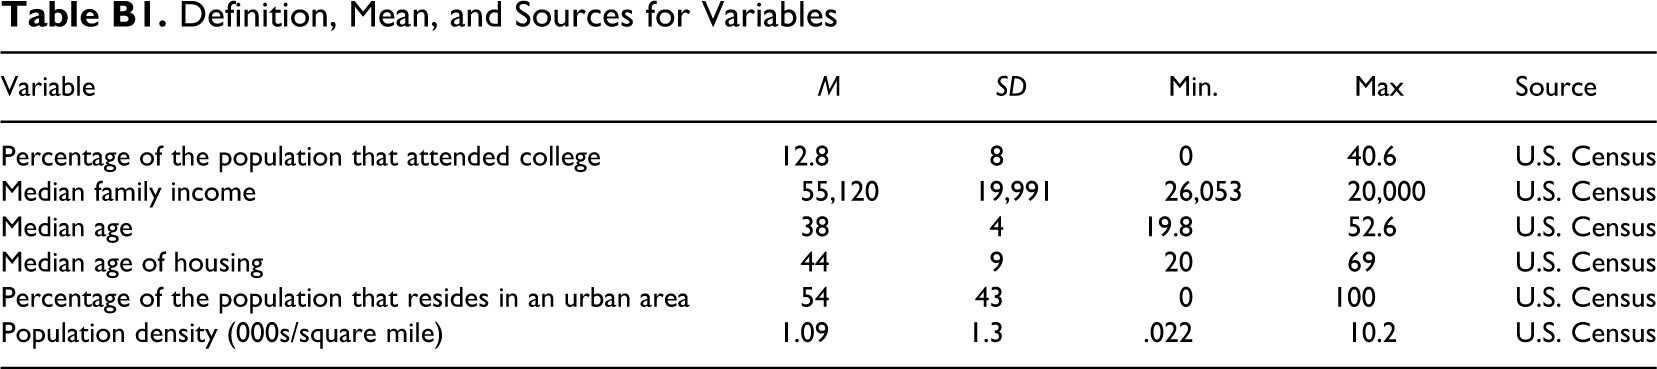
Definition, Mean, and Sources for Variables
| Variable | M | SD | Min. | Max | Source |
|---|---|---|---|---|---|
| Percentage of the population that attended college | 12.8 | 8 | 0 | 40.6 | U.S. Census |
| Median family income | 55,120 | 19,991 | 26,053 | 20,000 | U.S. Census |
| Median age | 38 | 4 | 19.8 | 52.6 | U.S. Census |
| Median age of housing | 44 | 9 | 20 | 69 | U.S. Census |
| Percentage of the population that resides in an urban area | 54 | 43 | 0 | 100 | U.S. Census |
| Population density (000s/square mile) | 1.09 | 1.3 | .022 | 10.2 | U.S. Census |
Acknowledgments
The authors would like to express their appreciation to Great Lakes Innovations for providing funding support to Kent State University’s Center for Public Administration and Public Policy to conduct the research underlying this article. They would also like to thank Mr. John Hoornbeek, Mr. Brian Kelley, Ms. Melissa Koeka, Ms. Yunnan Li, Mr. Kent Soward, Mr. Matthew Flemming, Ms. Sayantani Satpathi, Mr. Sam Janson, Ms. Ashley Lerch, and Ms. Kerry Macomber. They are grateful to the four northeastern Ohio public officials who were willing to share their insights about citizen engagement activities associated with their local government Web sites.
The authors declared no potential conflicts of interest with respect to the research, authorship, and/or publication of this article.
The authors received no financial support for the research, authorship, and/or publication of this article.