
Abstract
This study employs input–output (I/O) modeling at the state and county level to compare national estimates of the federal Supplemental Nutrition Assistance Program (SNAP). The results show that more localized economies cannot achieve the results predicted by national models likely because of leakage of economic activity outside the boundaries of a single state or county. This study sheds light on methodological tools that forecasters and policy makers can use in making decisions based on economic impact of social safety net programs.
Introduction
Since at least 2008, weak tax collections and a sluggish economy have affected how state and local governments provide public services (Oliff, May, and Palacios 2012). Public sector organizations initiate economic development projects, support policy creation or change, expand or contract service provision, make infrastructure investments, or any number of other development and policy related activities based on the projections of economic impact. This fragile fiscal ecosystem means that to the greatest degree possible, estimates of program utilization and cost must be accurate and reliable. This is accomplished through generating economic multiplier models.
Multipliers are used in a range of policy areas including economic development (Moretti 2010; Monacelli and Perotti 2011; McGregor et al. 2000), poverty (Miguel-Velez and Perez-Mayo 2010), and social safety net programs (Azis and Mansury 2003). This is an especially important consideration when local and state governments incur costs to administer and/or market participation in economic development strategies or federal transfer programs. One such program is the Supplemental Nutrition Assistance Program (SNAP, formerly food stamps).
SNAP is now the government assistance program most often used by needy families and is a critical component of the social safety net in the United States. Multipliers generated for the program as a whole (across the United States) suggest that it generates a return of about seventy-nine cents for every dollar spent. The problem is that multipliers with a national scope may not have the sensitivity to detect differences in population, income, and industry makeup in a local or state economy and may overstate local impacts. As a result, state and local policy makers may be left with unrealistic expectations for the future.
Improving the accuracy and reliability of local economic multipliers may be possible through examining what geographic level is most appropriate for estimating economic impact. The complex interactions between firms, industries, workers, consumers, households, and institutions at different scales make it important to balance the depth of information available in more localized regions with the economies of scale that arise from larger geographies. Even the methods commonly used to generate multiplier estimates including static input–output (I/O) models (e.g., IMPLAN), as well as more complex econometric models (e.g., Regional Economic Models Incorporated [REMI]) can affect the reliability of the results.
There are two purposes for this article. The first is to examine economic impact multiplier models focusing specifically on the geographic unit of analysis as a determining factor of multiplier reliability. This methodological question is aimed at whether models encompassing large geographic areas, for example national studies, are sensitive to the individual dynamic of state and local economies with the hypothesis that national studies overstate potential economic benefit at the state and local levels. The analysis then builds on the modeling discussion through a policy debate regarding policy implementation of social welfare programs. The means for measuring economic impact is of particular interest to how multipliers relate to decision making around federal transfer programs implemented by states. The central question for this second component of the article is whether multiplier models should be created at the geographic level at which policy is funded or that where administration and implementation occur.
Studying economic impact analyses through the lens of a social safety net program is appropriate for three reasons. Food insecurity, defined as lacking access to enough food for an active, healthy life (U.S. Department of Agriculture [USDA] 2011), is a major public policy problem in the United States, and especially throughout the southeastern region where more than 18 percent of households affirmed lacking the money to purchase food on more than one occasion during 2010 and 2011 (Food Research and Action Center [FRAC] 2012a). In addition, while national multiplier models exist (see Hanson 2010; Zandi 2010) and are often cited in discussions about hunger policy, they may be cast too broadly for decision making by the state or local governments that might benefit from more localized projections of spending and job creation patterns.
North Carolina (NC) is used as the test case to study how federal subsidy programs impact local economies through dollar spending associated with SNAP. The state is a part of the Sunbelt and Appalachian regions where poverty and food insecurity are persistent problems. There are seven food banks in NC. At least five of those are actively engaged in formal outreach efforts to boost SNAP participation. As the nonprofit groups generate greater numbers of applicants, state and local governments will need to prepare for both the administrative and fiscal challenges of the SNAP.
While the article uses a federal entitlement program as an example, the intent is not to argue for or against the value of the program specifically, rather the intent is to assert that the level of analysis—whether federal, state, or local—is a key component of generating reliable multiplier estimates. Results of four I-O models are compared to those from two models generated for the United States. The article proceeds with an overview of food assistance, as well as SNAP, to give context to the discussion. The basic assumptions of I-O models are reviewed, as are details about techniques employed. The article concludes with presentation of results, conclusions, and a call for future research.
Hunger and the Social Safety Net in the United States
Adequate nutrition is a cornerstone for healthy living, development, and prosperity. Even so, hunger has been a persistent problem in the United States throughout its history. With the onset of the Great Depression, the issue became a part of the public agenda. As the federal government developed programs to address hunger, the first version of SNAP originated in 1939. In 2008, the reauthorization of the Farm Bill resulted in renaming the program SNAP, rather than Food Stamp Program (USDA 2011). It is now the largest nutrition assistance program in the United States and represents the majority of federal funding for USDA.
There are a number of rules associated with SNAP (USDA 2012d). Participants cannot buy alcoholic beverages, nonfood, hot food, or items that can be eaten within the store (USDA 2012e; USDA 2012f; “Policy Basics” 2011). Most participants are required to work or actively seek employment. Eligible college students must either participate in a federal work-study program or maintain at least a twenty-hour workweek (USDA 2012e; Lavallee 2011; Leftin, Eslami, and Strayer 2011; “Policy Basics” 2011; FitzGerald et al. 2012). Only thirteen states have a full ban on whether convicted drug felons and legal immigrants can receive aid (USDA 2012e; Certification of Eligible Households 2012; Puro 2010).
The program is a key component of the hunger prevention strategy in the United States. Over time, demand and utilization have increased (Hoefer and Curry 2012). The USDA reported that more than 40 million people living in almost 19 million households used SNAP during the 2010 fiscal year (USDA 2011). By 2012, the number rose to 46 million people served at a cost of $81 billion in benefits (USDA 2012b). The Congressional Budget Office estimated that the number of SNAP participants doubled between Fiscal Year (FY) 2001–2005 and tripled between FY 2007–2011 (FitzGerald et al. 2012). The rate of participation outpaced cost until about ten years ago when costs started rising dramatically (see Figure 1).

Historical food stamp program trends. Source: USDA (U.S. Department of Agriculture). 2012a. A Short history of SNAP. United States Department of Agriculture. Food and Nutrition Services. http://www.fns.usda.gov/snap/rules/Legislation/about.htm. (Accessed January 17, 2014).
The rise in participation and associated benefits spending is due to the Great Recession and weak economy, as well as expanded eligibility criteria authorized by the enactment of the American Recovery and Reinvestment Act of 2009 (FitzGerald et al. 2012; Geewax 2011). Overall, SNAP has reduced the overall level of food insecurity among low-income households in the United States (Lombe, Yu, and Nebbitt 2009).
Even so, the program has substantial public cost in addition to benefits provided by the federal government for food. Though the federal government pays about half of the administrative costs for the program, states must bear administrative costs known as “Maintenance of Effort” (MOE) to receive federal transfer payments for many federal grant programs including SNAP. MOE requirements are designed to ensure that a state uses its own money for administrative costs of the program rather than setting aside federal grant dollars to deliver the services. State administrative costs fluctuate depending on participation, state and local salary levels, inflation, type of issuance system (cash vs. electronic benefit), worker training, and other costs. In FY 2011, NC issued $2.3 billion in benefits with federal administrative cost of $89 million and $78 million more at the state level (FNS 2012).
Though many eligible households use SNAP, a sizable number of eligible lower-income households (almost a third between 2008 and 2010) fail to take advantage of the program (Cunnyngham, Sukasih, and Castner 2013) and increase food insecurity. Thus, increasing participation in SNAP has the potential to generate revenue across the economy. Boosting participation is likely to lead regional and even localized economic benefit. One reason is that recipient households will spend cash as well as SNAP benefits as soon as either is available.
Lower-income households are sometimes without sufficient resources to meet basic needs including food (Paynter, Berner, and Anderson 2010). People who are food insecure trade off buying food for other life necessities such as utility bills, rent or mortgage, child care, transportation, medication, and costs of health care (Berner, Ozer, and Paynter 2008). In contrast, households with higher annual incomes have the luxury making major purchases like buying houses or cars, planning for retirement, or putting money into a savings account. That is, funds available to non-SNAP households are not always injected into the economy.
Because lower-income households have a higher marginal propensity to consume, any change in income or transfer payments has the potential to create an immediate economic boost. For example, a family of three who has a monthly income of about $1,600 (based on weekly earnings of $10 per hour) would receive $198 SNAP benefits, a 12 percent income boost (CBPP 2013). Policy makers, elected officials, and agency administrators may use forecasting model as the foundation for outreach and educational activities aimed at increasing participation in this safety net program. The question remains which geographic unit is most appropriate for projecting economic activity
I-O Multiplier Models
Multiplier models have a long and rich history. Early multiplier models were used to predict the effect that government intervention would have on stimulating the economy and fiscal policy. I-O models are reasonable approximations of the transactions within a regional economy.
I-O models have been used widely for regional economic development and planning purposes ranging from studies of fisheries (Seunga and Watersby 2009), tourism and hospitality (Bonn and Harrington 2008), to Medicaid (Dumas, Hal, and Garrett 2008). Duncombe and Wong (1998) explain in great detail the differences between simple methods for estimating regional economic impact, including basic multipliers like the export base model (assuming growth export outside the region is the only source of economic growth) and Keynesian multipliers (models dollars leaking outside the economy) as well as more sophisticated models including the I-O models that arise from export and Keynesian techniques. I-O models dominate state and local impact study literature especially in estimating public sector impact (see, e.g., Eamon, Wu, and Zhang 2012).
The economic impact of social programs is often approached through an I-O model as demonstrated through studies of Medicaid (Blair and Millea 2002), Windows Imaging Component (WIC; Hanson and Oliveria 2009), school meals programs (Hanson 2003), living wage ordinances (Pollin, Brenner, and Luce 2002), and food stamps (Hanson 2010; Hanson et al. 2002). These models focus on relationships that include interindustry transactions and induced consumption effects.
But, the literature on SNAP multipliers is limited and most are on a national scale. The USDA produces the Food Assistance National Input–Output Model (FANIOM) that links food assistance programs, agricultural activity, and the national economy (for a detailed explanation of this model, see Hanson 2010). In 2011, the FANIOM was used to generate a multiplier of 1.79 for the United States as a whole; meaning that for every SNAP dollar expended, an additional seventy-nine cents of economic activity was generated. Zandi (2010) estimated an alternative macroeconomic model. Here spending and tax proposals incorporated the 2009 federal stimulus package and assumed that government borrowing has little or no crowding out effect. This proprietary model suggests a national multiplier of 1.72. Other work (see Congressional Budget Office [CBO] 2010) suggested a variety of possible multiplier effects, ranging from as low as 1.0 and as high as 2.5. Given that more than $87 billion budgeted for the program annually (FRAC 2012b), SNAP has a marked impact on the national economy. Accurately projecting future impact is important.
Most SNAP multiplier models use data based on five-year intervals from the Economic Census (Hanson 2010). While this is an effective macroeconomic strategy, states and local communities rarely realize the full benefit projected in national models because temporal or regional effects may occur more quickly in a microeconomic setting (Hanson 2010). As a result, wide estimates are derived. For example, the FANIOM suggests that for every $1 billion SNAP spending between 8,500 and 17,900 jobs will be created across the United States (Hanson 2010). This range is too large to have much utility for policy creation, implementation, or impact estimates at the state and local level. An additional challenge is that a model based on billions of dollars in national spending is difficult, if not impossible, to scale down to represent economic impact for a state or localities where spending projections are much lower.
Thus far, no state or local level multiplier models examining SNAP spending have been published in scholarly outlets. In 2009, Santa Cruz County in California conducted an I-O analysis using IMPLAN. The model produced a food stamp multiplier of 1.47 for that region (Haveman, Fisher, and Tseng 2009). This estimate was considerably lower than nationally derived results.
Method
The present study uses industry standard methodology for economic impact analyses and I-O modeling to estimate direct, indirect, and induced economic impacts of SNAP spending at the local and regional levels. The data for this study come from a variety of sources including FY2009 SNAP participation reports obtained from the North Carolina Department of Health and Human Services (NCDHHS, 2012) and five-year estimates from the 2009 American Community Survey (Census 2009). Exogenous demand changes were modeled using Sector 324, Retail Food and Beverage Stores found in IMPLAN 3.0.
IMPLAN Group, LLC (formerly Minnesota IMPLAN Group LLC) developed IMPLAN, a package of data, software, and external hard drives for I-O and multiplier analysis, especially at the state and local level. These data come from the U.S. Census Bureau, the Bureau of Economic Analysis, and other data sets and are used to create a social accounting matrix based on economic variables. A social accounting matrix expands the I-O model by accounting for taxes, savings, and other interinstitutional income flows. Because IMPLAN is intended for regional deployment, even down to the ZIP code level, temporal factors such as when a business migrates in or out of the area have more weight on the output. IMPLAN is a common and accepted economic impact modeling program widely used by practitioners and academics (see, e.g., Cline, Weiler, and Aydin 2011; Hughes et al. 2008; McMahon and Smith 2013; Pordelli, McClung, and Martin 2008). IMPLAN is a static model that does not account for structural changes in the economy. Therefore, caution should be exercised when utilizing the model across time periods.
This study generates three types of multipliers. The first, a type I multiplier, focuses on direct and indirect effects of an exogenous demand change or fiscal stimuli (i.e., the number of jobs directly created by increased SNAP spending perhaps including grocery store clerks or farm hands). Type II multipliers consider induced effects that arise from labor income (e.g., jobs that are created when the grocery store clerk or farm hands spends income generated through jobs arising as direct and/or indirect effects of SNAP spending). A third type of multiplier known as type social accounting matrix (type SAM) uses a social account matrix to estimate induced effects, or effects generated by changes in household spending (Miller and Blair 1985). Type SAM multipliers are the most comprehensive multipliers, as these include interinstitutional transfers, social security and income tax leakages, and commute patterns (IMPLAN Professional 2.0 2004), which combined reflect a more realistic pattern of economic interaction. Social accounting matrices, upon which the type SAM multipliers are based, contain both market-based and nonmarket financial transactions and transfers between institutions and various levels of government, including SNAP appropriations from federal to state and local governments. In this scenario, the total effects of the increased SNAP spending would be included in the estimates.
Exogenous changes within a geographic region can be modeled by specifying the desired multiplier (type I, II, or SAM), usually including government expenditures and payments. It is possible to adjust for regional purchase coefficients in the model so that leakages can be computed. The direct economic impacts are equal to the total SNAP dollars spent within a local area (e.g., county or state). Amounts paid to entities located outside of the local area are excluded from the direct impact value. This is because these dollars are not circulated within the local economy. Indirect economic impacts are generated by the interindustry purchaser–supplier transactions that occur between industries as a result of the direct spending. Induced economic impacts represent changes in household spending that result from the new direct and indirect industry activity. Combined, these three impacts represent the multiple rounds of economic activity that result from a given investment or expenditure.
Four models were developed to assess the economic impact of SNAP spending in NC. The first two consider SNAP spending as a change in demand in the retail food and beverage store industry sector while the latter consider SNAP spending as a change in household income. The distinction between retail spending and household income is important because of its effect on how household dollars are treated in the analyses.
The County Aggregate Retail model assesses the economic impact of SNAP spending at the county level using the retail food and beverage store industry change approach. This approach considered SNAP spending to be a change in spending in the retail food and beverage stores industry sector, excluding sales tax and other unallowable spending (such as alcohol or tobacco). SNAP dollars would be directly spent in this industry sector. A spending estimate for each of the 100 counties in NC was developed to determine the county-level impact of SNAP activities. The 100 individual county-level models were then aggregated to demonstrate one common error in the estimation of state-level estimates.
The strength of results derived through the County Aggregate Retail model is its specificity. However, the aggregation of individual county estimates into a single state-level multiplier has the potential to understate the statewide impact due to the exclusion of leakages that occur at the county level. The federal government allocates SNAP dollars to the states. In NC, this money is passed through to county governments. Recipients apply for and receive benefits through county departments of social services. The benefits can be spent anywhere across the United States where electronic benefits cards for the SNAP are accepted. Most SNAP funds are spent close to home, often within the issuing county, but there are some places, especially in the rural parts of NC, where a lack of retail outlets in a particular county makes travel across county lines for shopping options a necessity. Chatham County (population 65,976) is the dark area in Figure 2 and it is a good illustration for this point.
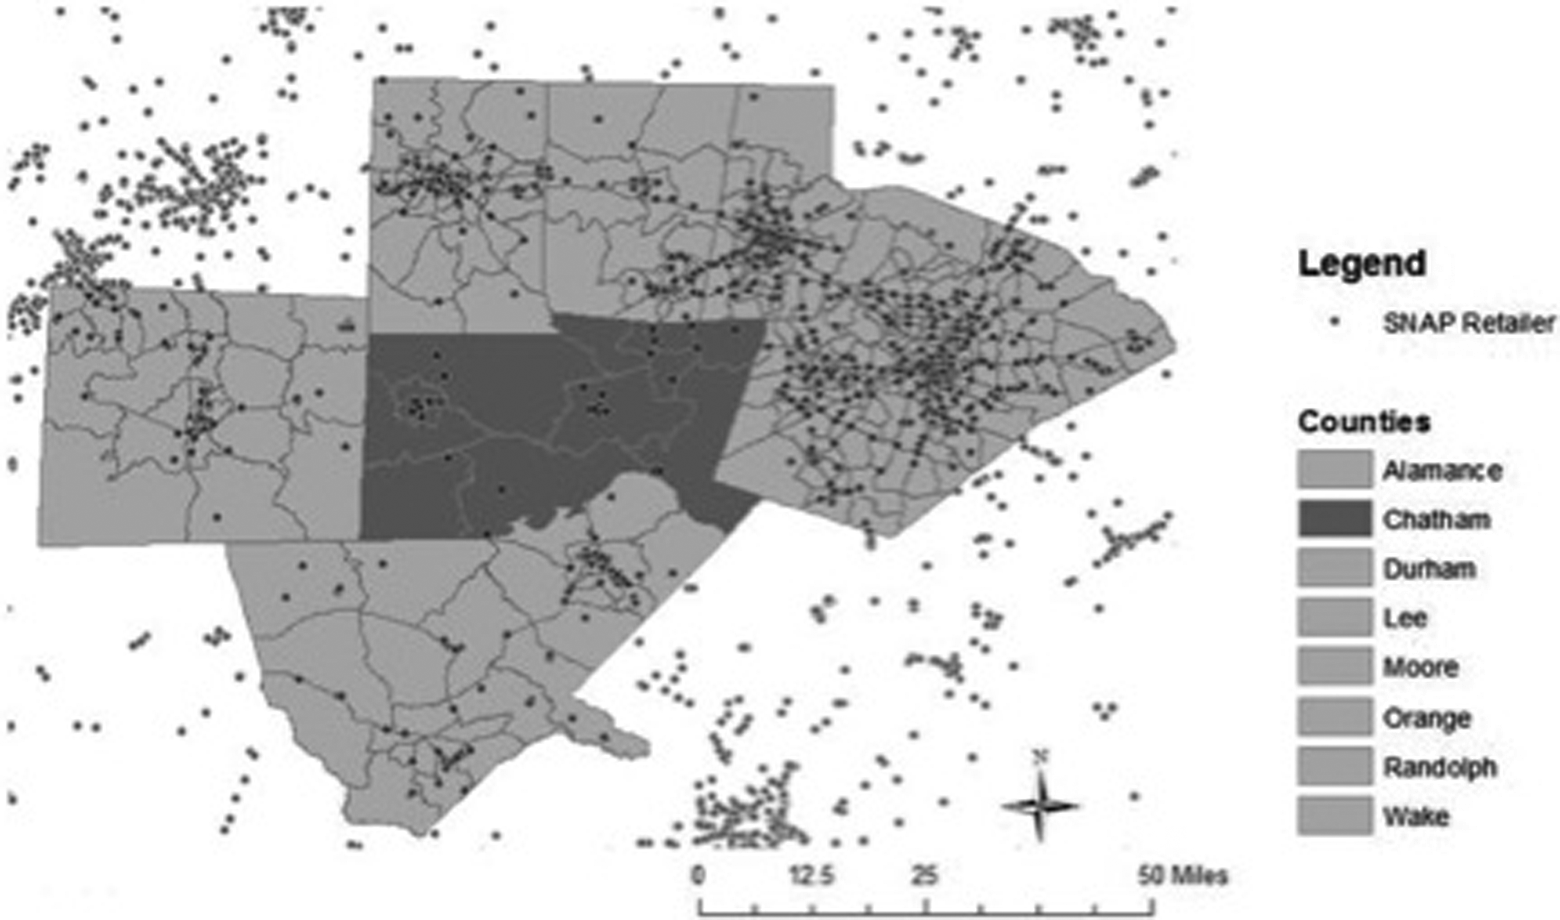
SNAP retail locations in Chatham County, NC.
Chatham County is surrounded by more heavily populated, urban areas: on the east side is Raleigh, the state capital, situated in Wake County with a population nearing 1 million; to the north are Durham County (population 279,641) and Orange County (population 137,941); and, to the west is the Randolph County (population 142,466) which is more than twice as populated as Chatham. The number of SNAP retailers (black dots in Figure 1) in Chatham County (n = 39) is small relative to its neighbors where the range is from 67 in Moore County to 564 in Wake County. As a result of the increased opportunities for shopping in bordering counties, SNAP retail spending is very likely to leak outside Chatham County.
To account for leakage and to determine a more realistic statewide effect, The State Retail model was developed as a state-level model that treats total SNAP spending in NC as a change in the retail food and beverage industry sector. Like in The County Aggregate Retail model sales tax and other unallowable spending (such as alcohol or tobacco) were excluded. The State Retail Model accounts for the leakages of spending across county borders, but not across state lines. SNAP dollars are limited to the purchase of certain food items. This limitation served as the justification for developing models 1 and 2 using a retail food and beverage spending approach. However, the behavioral effects of receiving SNAP dollars are likely to extend beyond simply purchasing food. Receiving SNAP dollars allows households to free up money that would otherwise be spent on food. This increased spending is modeled as an income substitution effect in models 3 and 4. The County Aggregate Household Income model captures the impact of aggregation of 100 individual county models and The State Household Income model demonstrates the impact of a statewide model.
As previously discussed, SNAP dollars may create a substitution effect for recipients and free up cash for the purchase of previously neglected household items. The substitution effect better captures the impact SNAP benefits have on increasing net purchasing power of households. The SNAP benefits displace a portion of existing household income previously spent on food, therefore freeing up this income to be spent on other household needs. That is, without SNAP, a low-income household makes decisions about whether to buy food or medicine, food or utilities, food or transportation, but with SNAP that household may be able to have food and medicine, food and utilities, or food and transportation. For this reason, we submit that using the Household Income model is more appropriate. For comparative purposes, we present results from both the Retail Sector models and Household Income models in the section that follows.
To develop the inputs necessary for the I-O models, the amount of SNAP benefits received by households within certain income ranges was imputed using total county-level SNAP disbursement estimates, decennial census income distribution estimates, and the 2009 federal poverty thresholds. The first step was to calculate the maximum income a household could record while still qualifying for SNAP benefits. Qualifying for SNAP can be complicated, given that certain conditions extend income eligibility as high as 200 percent of the federal poverty line in NC. However, most households that participated in 2009 had far less income; most (87.3 percent) fell beneath the federal poverty line (USDA 2012c). To account for the households over the poverty line, but beneath the maximum qualification amount, we included all households at or below 150 percent of the federal poverty line for an average household in NC.
The federal poverty thresholds are estimated relative to household size. Individual county estimates from the 2010 Decennial Census are used to identify the most appropriate federal poverty income threshold. The size of an average household in NC was 2.3 and ranged from 2.22 to 2.94 persons per household across the 100 counties during 2009. For those counties with an average household size nearest to two persons, the maximum eligible income was approximately $21,000 per year while counties with an average household size at or around three could earn up to $26,000 and still fall below the poverty line.
The next step was to collect the data on income distribution of each county in the state. The proportional distribution of households that were in the three Census income categories equal to $24,999 or less in the year 2010 was calculated. This distribution was applied to the SNAP benefit totals for each county to arrive at an estimate of the total dollar value of SNAP benefits received by households within each income range.
To account for the lack of retail sales taxation on SNAP benefits, indirect business taxes for retail food and beverage stores (IMPLAN industry code Sector 324) were zeroed out. Indirect Business Taxes (IBT) include sales, property, and production taxes and exclude taxes on income and contributions made by employers for social insurance. Eliminating the IBT for this sector ensures a greater proportion of the total SNAP injection is received by retailers rather than inaccurately diverted as sales taxes.
The last part of this study focused on job creation. It is important to note that the employment impact estimates generated by IMPLAN are reported in job-years. A job-year is equivalent to one job in a local area for one year. The jobs-years reported for a single year may or may not exist in subsequent years. For this reason, jobs estimates cannot be summed over time. Labor income, on the other hand, simply represents the monetary value of all forms of employment income including wages, benefits, and proprietor income. This type of multiplier is a value-added multiplier that considers both indirect and induced effects generated by local industries. Value added is the difference between the total output of an industry and the cost of its intermediate inputs. Economic or industry output simply represents the total value of production for a given industry or economy. The final demand change is multiplied by the type SAM multiplier to yield an estimate of the value added in the economy. Each measure is a standard output of an IMPLAN analysis and is reported for all models.
Results
All models include results categorized as employment, labor income, total value added, and total economic output by IMPLAN Group, LLC (Day nd). Employment includes both full- and part-time annual average employment including self-employed workers. Total value added is analogous to regional gross domestic product and refers to aggregate of labor income, property income, for example, corporate profits, and taxes collected by businesses for the government such as sales tax. Total economic output represents the value of production and includes total value added plus additional monies spent on goods and services to create production for the industry (Day n. d.).
The County Aggregate Retail model is an IMPLAN model computed for the individual counties in NC. The results are presented in Table 1. To model exogenous demand change using Sector 324 Retail and Food Beverage Store, the 2009 annual SNAP benefits were considered by county. Indirect business and sales taxes were excluded from the model. Results from individual counties were summed to arrive at an impact estimate for the state. In this most conservative approach, more than 10,000 jobs are created and $605 million in economic output is generated. This demonstrates economic impact as a result of the $1.78 billion in SNAP injected into the NC economy in 2009. In practice, aggregation of county-level results into a state-level estimate is not preferred for several reasons; chief among them is that aggregation of county-level data does not account for leakage across geographic borders. There are rural areas across NC where people live, but they travel some distance for shopping or work, occasionally crossing county borders in the process. A state-level model is also preferred, as this is the point of food stamp program administration; the local level is where the program is implemented. This first estimate projects the fewest jobs created and lowest economic output among the four models.
Economic Impact Using a County Aggregate Retail Model.

Source: Authors.
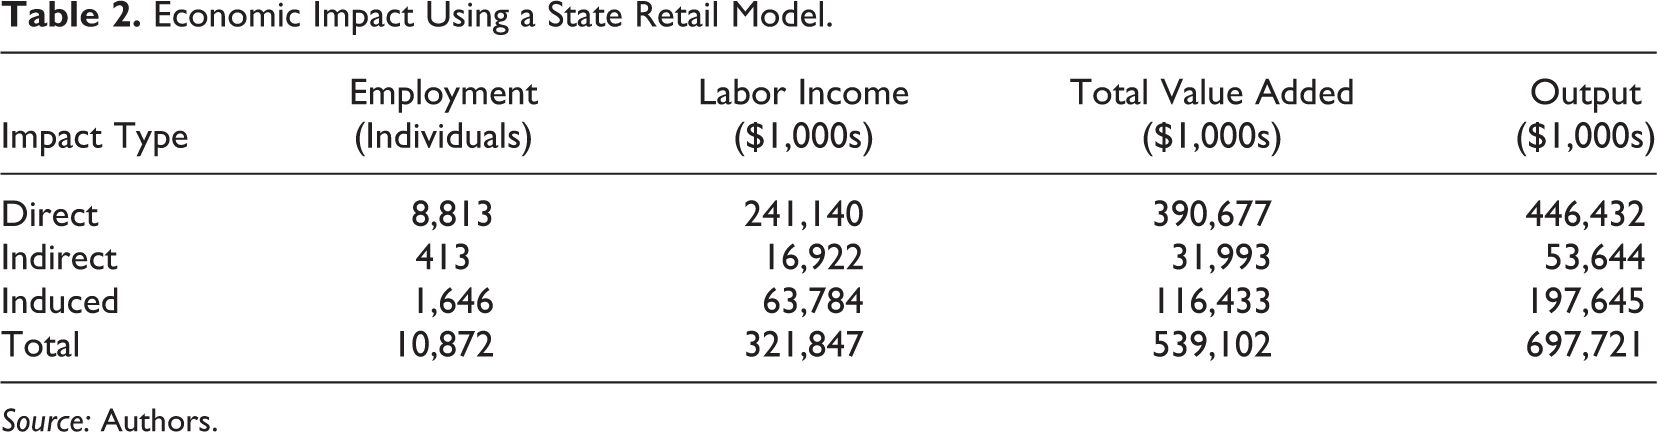
The second model accounts for leakage across county lines and examines SNAP spending by asking what would happen if a change in spending in the retail sector in NC as a whole is considered. The State Retail model (see Table 2) generated direct, indirect, and induced impact. The same method was employed as in The County Aggregate Retail model, but the estimated impacts were slightly higher with a single statewide model.
Economic Impact Using a State Retail Model.
Source: Authors.
In the second model, the employment numbers increased by about 600 over the initial estimates in the County Aggregate Retail model. The State Retail model ensures all jobs created across all counties in the state are accounted for and in the process corrects for the type of leakage described in the earlier Chatham County example.
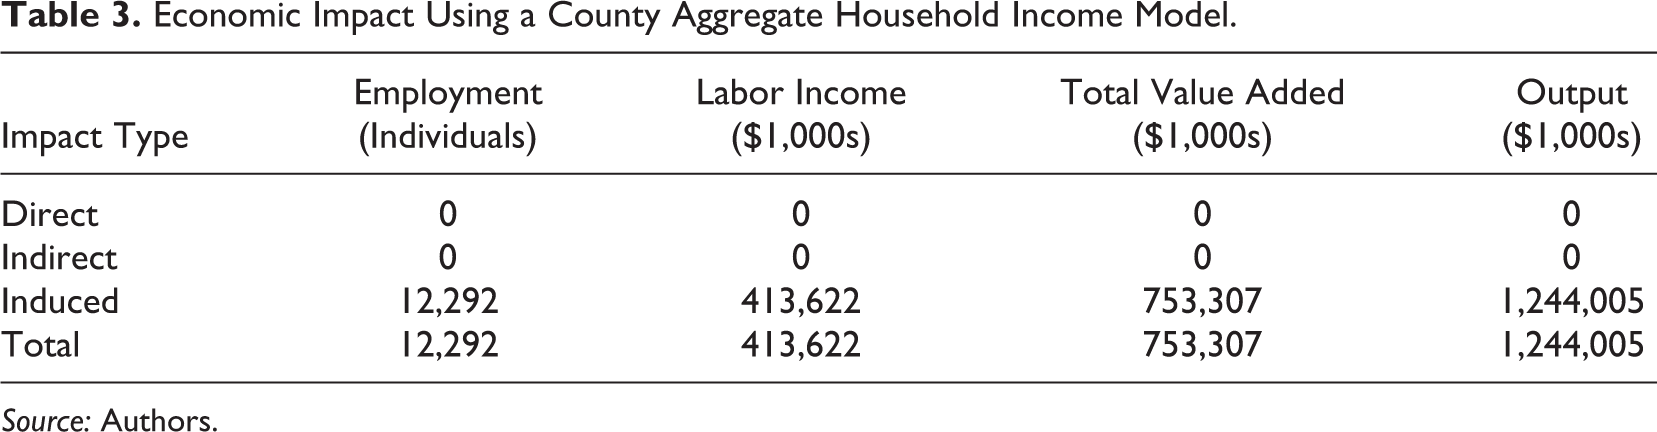
Local-level data do not estimate the true effect of SNAP spending because it is difficult to control for leakage outside county borders. SNAP funding is generated at the federal level but policies controlling eligibility and program administration are created at the state level, and implementation occurs at the local level. Measuring the impact of the program at the local and federal levels fails to provide a true estimate of the impact of this program. The appropriate unit of analysis is that at which policy decisions occur, in this case at the state level. However, this is not to suggest that county-level models are without value. These models could be informative where counties much make cost–benefit decisions about whether to invest in promoting increased participation in federal programs to their citizens or when these counties bear administrative costs or unfunded mandates associated with federal transfer programs. In these cases, a county may wish to examine multiplier effects to determine whether the increased output in terms of jobs or economic output is worth the increased costs of marketing or administration. The third model estimates the effect of food stamp spending using a household income approach (Table 3).
Economic Impact Using a County Aggregate Household Income Model.
Source: Authors.
As with the county retail spending model results are affected by leakage across county borders. For this reason, we aggregate the household income estimates at the state level in the manner as with model 2 presented previously discussed. Results of this compilation follow in Table 4.
Economic Impact Using a State Household Income Model.

Source: Authors.
The County Aggregate and State Household Income models capture better the substitution effect associated with food stamp dollars because SNAP benefits are treated as a change in household income. Like The County Aggregate Retail model, because SNAP spending is limited to households, impact models derived using a household income change do not report direct or indirect effects. The induced effect only considers the jobs generated as a result of increased household spending that comes from receiving SNAP benefits. That is, $100 in food stamp dollars that he or she did not have before should be treated as household income because it allows substitution of dollars spent on food for other necessities.
Modeling the economic impact of SNAP using retail sector spending models using either aggregated county-level results or a statewide model falls far short of estimates generated through national multiplier models. Retail sector models ignore important assumptions about households with limited financial power, chief among them the fact that households with fragile economic conditions are likely to spend funds as they become available—whether this is through income generated via a salary or benefits from social safety net programs. Modeling via retail sector spending patterns inaccurately estimates the value of SNAP in a local or regional economy. County household spending models more appropriately estimate economic activity even though leakage for work, shopping, commutes, and other spending is likely to occur on a regional basis. Again, the effect is overestimated.
The employment and economic output projections for all four NC models are considerably lower than those estimates provided by the national FANIOM developed by Hanson. The FANIOM estimates that every $1 billion in SNAP benefits generates between 8,900 and 17,900 full-time equivalent jobs—a very wide range of job projections. The Fiscal Stimulus model (Zandi 2010) does not provide an employment multiplier. In 2009, NC had $1.78 billion in SNAP spending occur in the state; application of Hanson’s multiplier would yield between 15,865 up to 31,908 jobs in NC. The County Aggregate Retail, State Retail, and County Aggregate Household Income models suggest considerably lower levels of employment than the lower bound of the FANIOM, while the preferred statewide household spending substitution method (the State Household Income model) projects 16,006 jobs, barely within the lower bounds of the FANIOM. Moreover, because IMPLAN will not allow the separation of full- and part-time jobs created, the estimates presented combine all jobs generated by SNAP spending whereas FANIOM represents only full-time positions.
IMPLAN publishes full-time equivalent (FTE) conversion factors for each IMPLAN economic sector based on estimates provided by the Bureau of Economic Analysis (BEA; IMPLAN FTE 2013). BEA captures the ratio of full-time to part-time employment for each industry sector. The FTE conversation factors range from a high of 0.9912 to a low of 0.6873 depending on the IMPLAN economic sector. The highest factor would mean that 100 jobs in IMPLAN would be equivalent to 99.12 FTEs, while the lowest factor would be equivalent to 68.73 FTEs. Even application of the highest FTE conversation factor to the 16,006 IMPLAN jobs yields only an FTE of 15,865 jobs—just touching the lowest estimate of the FANIOM. However, the highest conversion factor is only applicable to a handful of the 440 economic sectors associated with the IMPLAN model and is not representative of the diversity of sectors, most with much lower conversation factors, impacted by SNAP spending. Therefore, in practice, the employment number generated by the State Household Income model likely falls outside the bounds of the FANIOM, given that an indeterminate share of the jobs, at the very least more than 141, are part-time positions.
As Table 5 reveals, the comparison of economic output multipliers generated in county- and state-level modeling approaches fall well short of national projects. The FANIOM (2010) projects that for every $1 of SNAP benefits economic output increases by $1.79. This includes the initial federal spending on SNAP benefits (i.e. the initial $1) and another $0.79 of economic output occurs as this money circulates throughout the economy. The Fiscal Stimulus (2010) model projects similar estimates with a multiplier of 1.72. Consider the $1.78 billion in SNAP benefits in NC leads to total economic output ranging from $606 million (The County Aggregate Retail model) to $1.85 billion (The State Household Income model) and multipliers ranging from 0.36 (The County Aggregate Retail model) to 1.09 (The State Household Income model). Models 1–3 have multipliers less than 1, which means that the total output generated from $1.78 billion in SNAP spending is actually less than the original input.
Comparison of SNAP Multipliers.
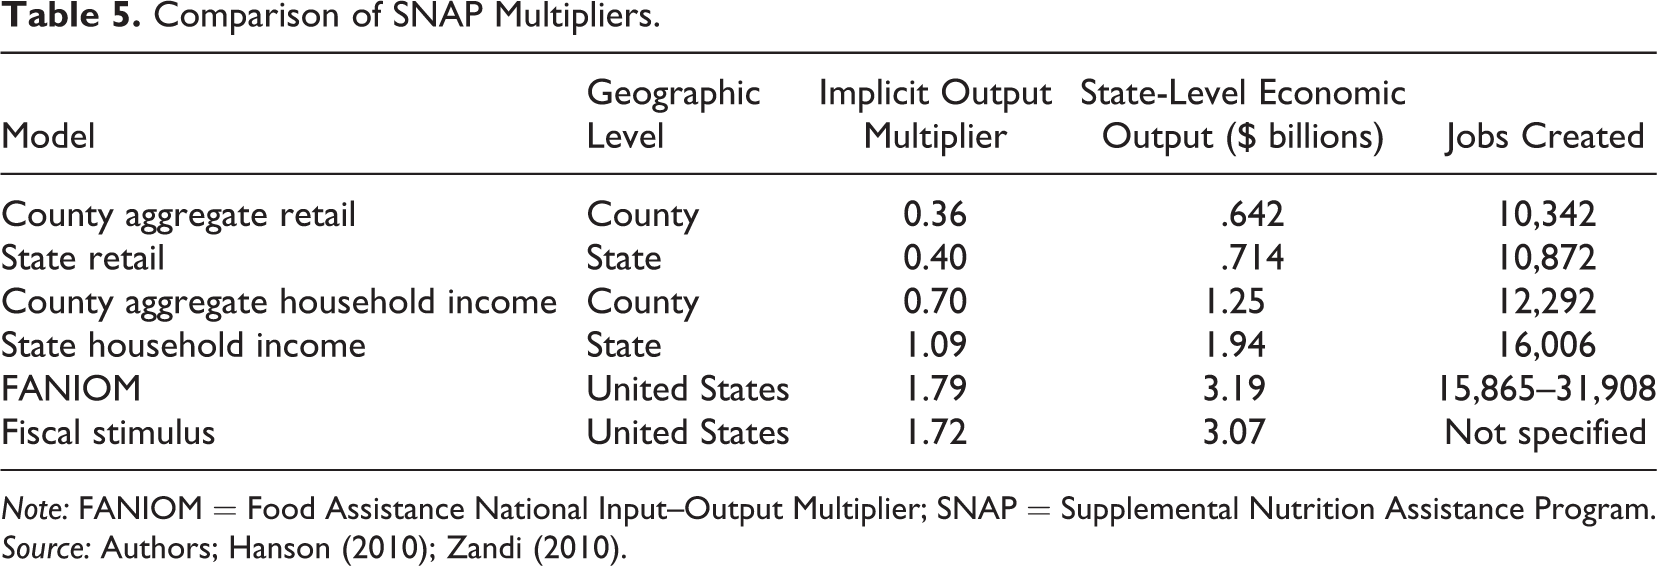
Note: FANIOM = Food Assistance National Input–Output Multiplier; SNAP = Supplemental Nutrition Assistance Program.
Source: Authors; Hanson (2010); Zandi (2010).
At first pass, spending $1.78 billion but receiving less than $1.78 billion seems counterintuitive. This is the result of leakage outside of counties and the state that occurs when economic transactions take place. Consider retail-spending models. One could reasonably presume that some share (likely a large share) of SNAP spending occurs at regional and national supermarket chains headquartered outside of the state of NC. Likewise, some SNAP spending takes place at large discount retail centers such as Wal-Mart that sell groceries. A large percentage of spending at these companies leaks out to cover the wholesale costs of the food products as well as leaked profits to company headquarters for redistribution to shareholders. A limited portion of this spending is retained in the county or state where the spending occurred.
A lower multiplier also results from the substitution effect models. The aggregation of county-level models (the County Aggregate Household Income model) do not account for the leakage of spending and economic output across county borders, which explains the lower multiplier output and employment effects. The spending on household goods in the County Aggregate Household Income model also has leakage out of the county/state. For example, money spent on rent or utilities is also likely to ultimately leak out of the county of original spending and accrue as profit to a mortgage holder or utilities headquarters. The State Household Income model does demonstrate a multiplier above 1, as the spending of $1.78 billion in SNAP dollars leads to an economic output of $1.85 billion in the state of NC. Therefore, we demonstrate that the substitution effect model is the preferred model for evaluating the economic impact of SNAP.
Policy Implications
This analysis raises two fundamental issues—(1) what modeling technique is likely to produce the most reliable results and (2) what geographic level is appropriate for modeling economic output. For the reasons previously outlined, the substitution technique is the best reflection of spending patterns among the households that use SNAP. Accurately modeling the likely behavior of a group of people is difficult but even so the economically fragile situation in which most lower-income households exist means that as resources are available they are used. The geographic level question is a bit more difficult to decipher.
Using the federal level for modeling clearly results in overstating both economic output and jobs created. The question then is whether state or local government would be the appropriate lens for multiplier models based on federal transfer dollars. The problem is that state models may overstate the total value added as well as jobs created for localities in the same way federal models exaggerate effects for lower levels of government. The real question is whether the lowest common denominator, in this case the county level, is best. Because intercounty shopping, labor shed, transportation patterns, and other factors make leakage within a state a major issue, multipliers that can take regional factors into account are most appropriate. In this case, the most reasonable estimates can be derived at the state level. A critical issue in this assessment is that states make required public investment through MOE funds to maintain safety net programs. Because a state must make a concerted effort to sustain the programs through administrative costs then understanding the economic benefit that can be generated for the entire region is critical. Utilizing this approach could be extended to other safety program including estimates of the impact of Medicaid, welfare, social security, and others.
A related question for state- or local-level policy makers is whether to support boosting participation in safety net programs. Underlying this issue is the very important condition that economic output estimates used to inform decisions should be as accurate and reliable as possible. Politicians are right to question whether impact estimates are accurate.
While the findings demonstrate that the expected benefit of SNAP spending is lower than projected by national models, SNAP spending still offers positive benefits to state and local governments. This is especially true in areas where the programs are underutilized. In NC, approximately 23 percent of the population lived in a household at or below 125 percent of the poverty line in 2011, all of whom would have been eligible for SNAP benefits. A number of households with incomes up to 200 percent of the poverty line would also qualify for publicly funded food assistance. Even so, across all 100 counties only about 74 percent of those eligible actually participated in SNAP. Unclaimed benefits could provide resources for the poorest residents of the state as well as the communities where they live. Increasing utilization of SNAP benefits in underutilized areas offers an immediate, and now measureable, benefit for many NC counties where the qualifying population may underutilize the benefits.
The most significant limitation for this effort is that the impact is greatest for government spending, but the models cannot assume that there is no limit for that. There has to be a balance between payments into the system and expenditures. While the potential economic benefit is likely greatest for impoverished individuals and communities, the danger in this approach is that there is a limit to government’s ability for unrestricted spending. A component of an economic development strategy could be to connect these individuals with safety net programs.
National level models rely on economies of scale than cannot be replicated, and likely overstate economic benefits, at the state and local level. The benefit of this moving the model from a macro-level analysis to a more regionalize or even localized study is that results are more specific and realistic based on conditions present in states and communities. This demonstrates efforts to connect the poor with food stamps and perhaps other social safety net programs can have a measurable employment and economic impact in communities suggesting that these strategies may be viable approaches in impoverished communities. This might be part of an economic development portfolio that helps those on the lowest levels of economic tiers.
The County Aggregate Retail and State Retail models yield economic impacts considerably lower than those predicted by applying national level multipliers to SNAP spending in NC. The County Aggregate Substitution and State Household Income models yield results that are at the lower bound of economic impacts predicted by national models. The analysis concludes that while increased SNAP participation represents an immediate job creation opportunity, especially for areas having experienced rapid decline in employment, the impact of this activity is likely to be smaller than predicted by national models. This study suggests that food stamp spending not only has a direct benefit to program participants but also to the citizenry at large through job creation effects associated with this spending. That is, jobs are generated and populated by people outside the scope of the SNAP.
Studies have suggested (Hanson 2010; Zandi 2010) that full utilization of SNAP would have a stimulus-like effect by putting additional resources into the hands of individuals with high marginal propensity to consume and who would immediately utilize these resources. The shortcoming of these national models is that they are not able to reflect accurately the prospective state and local impact of full SNAP participation. Using a methodology such as the State Household Income model is likely to boost the overall reliability of the impact analysis.
Conclusion
This study suggests that full utilization of social safety net programs may have an economic impact that transcends the immediate recipient of food and extends through the community as jobs are created and sales tax revenue is generated. Having a more realistic picture of what might happen from both revenue and jobs created perspectives would give the state, regional, or local governments better opportunities to project the value that can be harvested from extending outreach efforts aimed at boosting participation in federally funded safety net programs as well as lessening the negativity that might be associated with supporting a program that never lives up to expectations. The bottom line is that there is a benefit to promoting participation and it has the potential to be a significant force in places that have little hope of attracting major employers or other sorts of economic development project. This type of economic activity benefits the people who need it most as well as the community at large through jobs created and sales tax revenue generated on purchases other than food.
In effect, when a person gets a food stamp dollar he or she uses that to buy food and substitutes other available financial resources for purchasing items that contribute to the overall tax revenue in a region. In practice, working to increase the number of citizens receiving SNAP benefits may not be a politically palatable strategy for many communities. Yet, the reality is that many impoverished areas have experienced rapid loss of low-skilled job opportunities as a part of the Great Recession and the general trend toward globalization; many of these localities have limited prospects for engaging in traditional economic development strategies such as recruiting new industry. Increased SNAP participation represents an immediate job creation opportunity for all areas and a particularly pliable option for areas having experienced rapid decline in jobs and manufacturing. SNAP utilization has the potential to drive increases in private sector job growth.
Most importantly, this article assists in providing a methodology for states and localities to use in assessing the economic benefits of SNAP spending in communities. It is common for state and local officials to pursue additional federal dollars as part of community economic development strategies. These strategies typically include attracting, retaining, or expanding military bases, attracting or retaining federal transportation dollars for transit or highway projects, attempting to win federal contracts or grants, or even attracting federal government facilities or regional offices. Modeling the likely economic impact of participation in transfer programs appropriately is an important step for programmatic and policy decisions. Single state case studies inevitably suffer from limitations associated with external validity. While other states are likely to experience lower economic impacts from SNAP spending than is currently predicted from national models, the magnitude of those impacts will vary depending on the industry composition with each state. A suggestion for future research is a comparative study examining the differences in the economic impact of SNAP spending across states.
Footnotes
Declaration of Conflicting Interests
The authors declared no potential conflicts of interest with respect to the research, authorship, and/or publication of this article.
Funding
The authors received no financial support for the research, authorship, and/or publication of this article.