
Abstract
Policy makers allocate billions of dollars each year to tax incentives that increasingly favor creative industries. This study scrutinizes that approach by examining motion picture incentive programs used in over thirty states to encourage film and television production. It uses a quasi-experimental strategy to determine whether those programs have contributed to employment growth. Results mostly show no statistically significant effects. Results also indicate that domestic employment is unaffected by competing incentives offered outside the United States. These findings are robust to several alternative models and should lead policy makers to question the wisdom of targeted incentives conferred on creative industries.
For over a century, state and local policy makers have sought to encourage economic development by offering incentives that target specific firms and industries. But targeted incentives have only recently drawn considerable scrutiny, thanks in part to their escalating cost. For example, Tesla agreed in 2014 to build a factory in Nevada after officials there offered tax and other incentives valued at US$1.3 billion. Foxconn decided in 2017 to locate new facilities in Wisconsin in response to incentives valued at between US$3 billion and US$4.5 billion. Several governments later competed over Amazon’s HQ2 project with incentive packages worth as much as US$8.5 billion.
Whether through so-called megadeals or other programs that attract less notice, the use of targeted incentives shows no sign of abating. Sixty-eight percent of state and local governments offered them in 1999; by 2009, it was 95 percent (Florida 2018). The roots of that growth lay in the political environment. Policy makers use incentives to signal proactiveness on the economy, and targeting a specific firm or industry brings greater visibility to their efforts than offering nonparticularized incentives. If the target ultimately locates in an area that proposed incentives, policy makers benefit by taking credit. If it settles elsewhere, policy makers may still benefit by taking credit for making an attempt to create jobs, deflecting any blame to problems beyond their control.
Of course, policy makers do not act in a vacuum. Offered a choice between a policy maker who offers incentives and one who does not, voters prefer the former even if both attract the same development (Jensen and Malesky 2018). For their part, businesses develop rent-seeking relationships with policy makers to protect incentives against electoral turnover—a quid pro quo that metastasizes to other rent-seeking arrangements (Coyne, Sobel, and Dove 2010; McChesney 1997).
If there’s a voice of caution in the milieu, it comes from those who assess targeted incentives. Indeed, studies commonly find that they do not yield promised benefits (e.g., Peters and Fisher 2004). But evaluative research has failed to keep pace with targeted incentives’ proliferation, making it difficult for policy makers to judge whether or not they’re a prudent use of resources.
This study investigates the employment impact of motion picture incentive (MPI) programs, a combination of corporate tax incentives and other services made available by over thirty state governments to encourage film and television production. MPI programs are one component of a broader strategy across those governments to diversify economies by incenting a creative industry believed to yield stable, high-wage jobs. To that end, policy makers in some states have approved higher tax expenditures for MPI programs than many prominent megadeals. As such, they are a relevant case from which to draw implications about the efficacy of targeting an industry with exclusive incentives—in this case, a creative industry with a high degree of mobility and, in theory, high sensitivity to those incentives.
Targeted Economic Development Incentives in Context
The inclination toward targeted economic development approaches in the United States has roots in the Great Depression. During that period, policy makers in southern states enacted bond programs that subsidized factories and other facilities, thereby lowering firms’ effective capital costs. That bond-supported infrastructure was publicly owned and exempt from property taxation yielded further cost advantages (LeRoy 2005). Many observers believed this tactic successfully enticed labor and capital from northern states, where policy makers responded with retaliatory incentives. Competition accelerated through the 1970s and 1980s and became more global in scope (Jenn and Nourzad 1996). Incentives evolved toward further particularization as policy makers—seeking ever-narrowing competitive advantages—began to target specific firms and industries as well as locations (e.g., downtown cores, enterprise zones, and brownfield sites) and events (e.g., the Summer Olympics).
The accumulated findings of an extensive literature on targeted incentives converge toward a single conclusion about their efficacy. In short, studies suggest policy makers should avoid the practice altogether, especially with incentives that carry tax expenditures, because they fail to stimulate commensurate economic gains (e.g., Fox and Murray 2004; Hicks and LaFaive 2011; Kolko and Neumark 2010; Neumark and Kolko 2010; Patrick 2014; Reese 2014). In instances where gains materialize, they may be short term (e.g., O’Keefe 2004; Wassmer 1994; see also Hamersma 2008).
Lackluster outcomes have many causes. Most state and local business tax frameworks are not appreciably different, rendering any single incentive unable to rouse substantial firm relocation or expansion (Wasylenko 1997). Furthermore, taxes for many industries are not a primary operating cost. Among manufacturers, for example, taxes compose around 1 percent of input costs compared to over 21 percent for labor (Keynon, Langley, and Paquin 2012). Marginal tax reductions offered in one area may thus fail to compensate for other costs that may be higher in the same area. Competitive targeting can also create a zero-sum game in which one area’s “win” comes at the expense of another’s loss (Chirinko and Wilson 2008; Wilson 2009).
Targeting nevertheless endures, and the targets have evolved. Policy makers in many state and local governments have oriented their economic development strategies toward growing the “creative class” and building “creative cities” into a “creative economy” (Florida 2002; Howkins 2001; Scott 2000). The strategy is vested in a belief that creative, knowledge-intensive industries—that is, sectors in which intellectual property is the output—produce stable, high-wage jobs that serve as a growth driver and a buffer against economic shocks. The argument is especially attractive in areas where policy makers have struggled to revive economies decimated by losses in manufacturing and other heavy industries.
But the approach engenders an intractable Catch-22. For all the benefits of a creative economy, there are drawbacks, among them gentrification, rising housing costs, and higher inequality. Compared to traditional industry clusters, the market for creative labor and capital is more global and competitive (Florida 2005). And relative to other industries (e.g., agriculture, manufacturing, and natural resource extraction), those built on intellectual property are less tethered to any one location. Incentives can create jobs more rapidly, but those jobs can just as rapidly leave.
Chasing Hollywood
Incentives conferred on the motion picture industry, including film, television, and commercial production, have been a crucial element of strategies focused on creative industry development (Christopherson 2008). Most states and some local governments have made relatively low-cost support services, such as location assistance coordinated by a taxpayer-funded film office, available to the industry for decades. But in the late-1990s and early-2000s, policy makers in many states expanded those services and added corporate tax incentives that were not available to other sectors (Christopherson and Rightor 2010). These MPI programs eventually spread to forty-four states, carried by rising unemployment and domestic competition (Leiser 2017; Thom and An 2017).
Although the number of MPI programs has declined, investment has not. In 2017, according to state government reports, over thirty states granted the industry a combined US$1.7 billion in corporate income tax expenditures, not including the value of other program services. About 77 percent was concentrated in five high-expenditure states (New York, Louisiana, Georgia, Connecticut, and Massachusetts) that represented only 58 percent of expenditures five years earlier. Cumulative spending in these states rival those for prominent economic development megadeals (see Table 1).
Cumulative and Projected Motion Picture Incentive Program Tax Expenditures among High-expenditure States.

Source: New York: Empire State Development Quarterly Report and Department of Taxation and Finance Annual Report on New York State Tax Expenditures; Louisiana: Office of Entertainment Industry Development; Georgia: Department of Audits and Accounts Tax Expenditure Report; Connecticut: Department of Economic and Community Development Annual Reports; and Massachusetts: Executive Office for Administration and Finance Tax Expenditure Budgets.
Note: Cumulative expenditures are reported through 2017 and in constant 2017 dollars, adjusted using the Consumer Price Index. Projected expenditures assume the state’s most recent annual tax expenditure will remain fixed for the balance of a program length of twenty years.
Each high-expenditure state’s MPI program has common features, including location assistance, advertising, and preferential regulatory treatment. Some include sales and transient occupancy tax waivers and incentives for building production-related infrastructure. States differentiate themselves with corporate income tax credits that vary from 10 to 40 percent of production spending, with a typical range of 25–30 percent. Specific information on each state’s program is available in Supplement Table S1.
Because tax credit rates are high, tax credit values exceed most productions’ state corporate income tax liability. To resolve the difference, a state designates its credit as either refundable (i.e., the state issues a cash refund for the difference between the credit’s value and the production’s tax liability) or transferrable (i.e., the state allows the production to transfer the excess credit to other projects and/or allows the production to sell the excess credit to a third party). Among high-expenditure states, two have refundable tax credits (New York and Louisiana), two have transferrable tax credits (Georgia and Connecticut), and one allows each production a choice (Massachusetts). Regardless of tax credit structure, by reducing effective production costs, MPI programs theoretically encourage hiring activity that would not have transpired otherwise, thus encouraging each state’s creative economy.
Research Design
Scope
The typical method for evaluating MPI programs is a panel study that includes all states (e.g., Swenson 2017; Thom 2018). While studies adopting that frame have yielded valuable insights, their results have three limitations. First, they do not consistently account for incentive differences across the states. Second, they rarely produce state-specific findings, leaving unresolved the question of whether MPI programs are consistently poor performers or if middling impacts result instead from negative effects in some states canceling out positive effects elsewhere. Third, they do not address how incentives offered outside the United States affect domestic employment.
This study aims to advance understanding of MPI programs, and incentives that target creative industries more broadly, by addressing those limitations. It focuses on the high-expenditure states described in Table 1. Over three-quarters of recent tax expenditures occurred in those five states, and if employment increases have not emerged there, then states with markedly lower investment can scarcely hope to achieve a better outcome. Moreover, thanks to billions of dollars in investment, the likelihood of MPI program termination in high-expenditure states is low, suggesting these programs will remain in effect (Thom and An 2017). Estimating a separate model for each state also produces a more nuanced view of program impacts: It is likely that, despite implementing a similar incentive scheme, each state has experienced a different outcome.
Outcome Variable
Scrutinizing a tax incentive’s employment impact requires careful attention. Analyses funded by the motion picture industry and some from economic development agencies tend to credit tax incentives for job creation and blame a lack of incentives for job losses. But common sense and data from the U.S. Bureau of Labor Statistics suggest another reality. To wit, each high-expenditure state reported hundreds, if not thousands, of motion picture industry jobs before MPI program implementation and the number of jobs varied from year to year. But both conditions were also present after incentives were available. This study’s objective is thus to determine the degree to which those incentives, rather than confounding factors, drove employment changes.
Consistent with prior research, the outcome variable is the annual percentage-point change in each state’s motion picture industry employment. The variable is derived from Quarterly Census of Economics and Wages (QCEW) data on North American Industry Classification System Code 512110, “Motion Picture and Video Production.” This category includes employment tied to the production of “motion pictures, videos, television programs, or television commercials.” Given the emphasis on job creation, assessing employment is advantageous to the raw number of incented television or film productions. Evaluating annual employment changes instead of annual employment totals also avoids one source of endogeneity that states with high employment established an MPI program (perhaps as a result of industry lobbying) and subsequently continued to report high employment.
Explanatory Variables
Explanatory variables fall into two categories: internal factors and competitive factors. Internal factors comprise two characteristics specific to each state. First and most important, all models incorporate changes to tax expenditures issued under each MPI program as reported by each state. If targeted tax incentives motivate positive employment outcomes, then an increase in tax expenditures should correspond with an increase in employment. Second, given the relationship between labor costs and employment in any industry, all models incorporate changes in average Motion Picture and Video Production wages per employee reported in the QCEW. 1 Each variable is measured as the annual percentage-point change in constant-dollar figures.
Competitive factors comprise a set of variables that reflect the dynamic tax incentive environment. Because any of the high-expenditure states may lose or gain employment as a result of changes to competing governments’ tax incentives, each state’s annual employment change is modeled as a function of both their tax expenditure and tax expenditures in competing areas. All models control for tax expenditures in each of the other high-expenditure states; all other states combined; and Canada, inclusive of Canadian federal incentives and provincial incentives offered in British Columbia and Ontario, adjusted to their then-current U.S. dollar equivalents. Canada’s inclusion is essential; it has long been invoked as a competitor for domestic motion picture industry employment. The industry, its labor unions, and economic development officials regularly use the presence of Canadian incentives, and those available in British Columbia and Ontario in particular, as justification to expand domestic incentives. Failing to do so, they argue, will result in “runaway production”—a flight of jobs from the United States to Canada. Each variable is measured as the annual percentage-point change in constant-dollar figures.
Controls
All models include two control variables: the national change in Motion Picture and Video Production employment (excluding the state in question) and the change in each state’s overall private-sector labor force (excluding Motion Picture and Video Production employment). Each variable is measured as the annual percentage-point change in annual employment totals reported in the QCEW. Descriptive statistics for all variables are available in Supplement Table S2.
Empirical Strategy
This study uses an interrupted time series analysis (ITSA). Generally speaking, ITSA models separate longitudinal data into observations drawn before and after a discrete intervention and estimate the intervention’s effect on postintervention observations. Since ITSA models are comparable to randomized experimental designs (St. Clair, Cook, and Hallberg 2014), they are widely used in health and behavioral economics research and also have broad reach in policy analysis, where experimental designs are often unworkable (e.g., Bonham et al. 1992; Muller 2004; Sutherland et al. 2017; see also Cook 2014).
As applied here, MPI program implementation is the intervention. Data from each state are separated into a preintervention phase (i.e., data from years preceding implementation) and postintervention phase (i.e., data from years following implementation; see Table 2). To produce symmetric phases that avoid time bias, pre- and postintervention phases are of equal length. For example, New York enacted its Film Production Tax Credit in 2004, but applications were not accepted until the latter half of 2004. Since 2005 was the first year in which any employment effects were likely measurable, New York’s postintervention phase is 2005–2017 or thirteen years in length. Its preintervention phase is also thirteen years in length, 1992–2004. The only exception is Louisiana. Its preintervention phase should be 1987–2001, but the QCEW does not report industry- and state-specific data from 1987–1990. Consequently, Louisiana’s preintervention phase is truncated by four years.
Pre- and Postintervention Phases for Time Series Analysis.
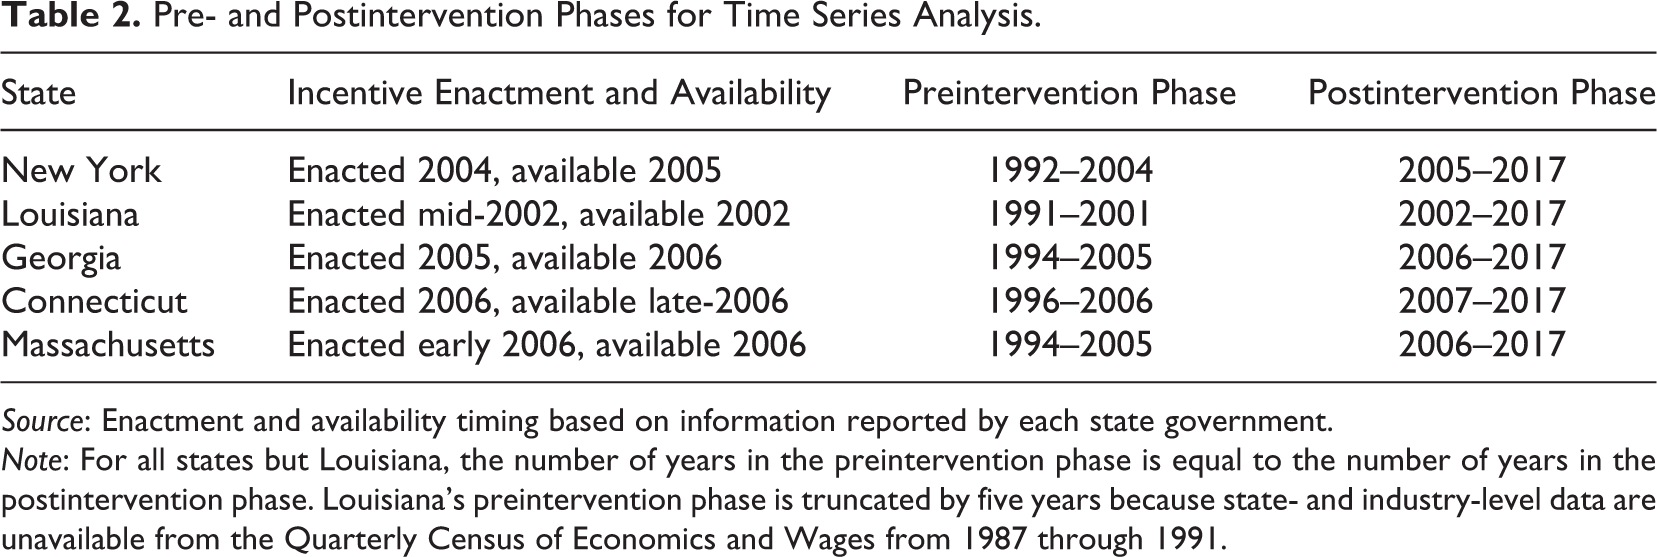
Source: Enactment and availability timing based on information reported by each state government.
Note: For all states but Louisiana, the number of years in the preintervention phase is equal to the number of years in the postintervention phase. Louisiana’s preintervention phase is truncated by five years because state- and industry-level data are unavailable from the Quarterly Census of Economics and Wages from 1987 through 1991.
While many ITSA iterations exist, this study uses the model developed by Linden (2015), which utilizes a generalized least-squares regression that assumes a first-order autoregressive error structure but no heteroscedasticity. Initial diagnostic tests supported both assumptions. In addition to coefficients for explanatory and control variables, the model estimates additional parameters of interest: the annual motion picture industry employment change prior to MPI program implementation (β1), the program’s immediate employment impact (β2), and its impact over time (β3).
ITSA offers certain advantages over alternative empirical strategies. Since the model uses each state’s preintervention phase as a counterfactual, it sidesteps the challenges inherent to other methods (e.g., regression discontinuity and difference-in-differences designs) that require identifying one or more control states without incentives to benchmark against states that have them. Given the dearth of control candidates—only six states never enacted an MPI program—and the distinctive nature of each state’s motion picture industry—from the size of the labor force to the state’s incentive timing, tax expenditures, and climate and geographic features that shape production location choice—those methods are inadvisable. Additional information on this study’s empirical strategy appears in Text 1 Supplement.
Findings
Empirical results are reported in Table 3. Each model is a strong fit of the underlying data. Additional goodness-of-fit information is available in Figure 1 Supplement. Turning first to the question of how MPI programs impacted employment in the five high-expenditure states, the results show the answer is “not much.” This study’s empirical strategy sheds light on three outcomes of interest: β2, which represents the immediate, permanent program impact; β3, which represents the subsequent, annual effect that may add or subtract from β2; and a separate coefficient for tax expenditures.
Impact of Motion Picture Incentive (MPI) Programs and Other Factors on the Annual Change in Motion Picture Industry Employment in High-expenditure States.
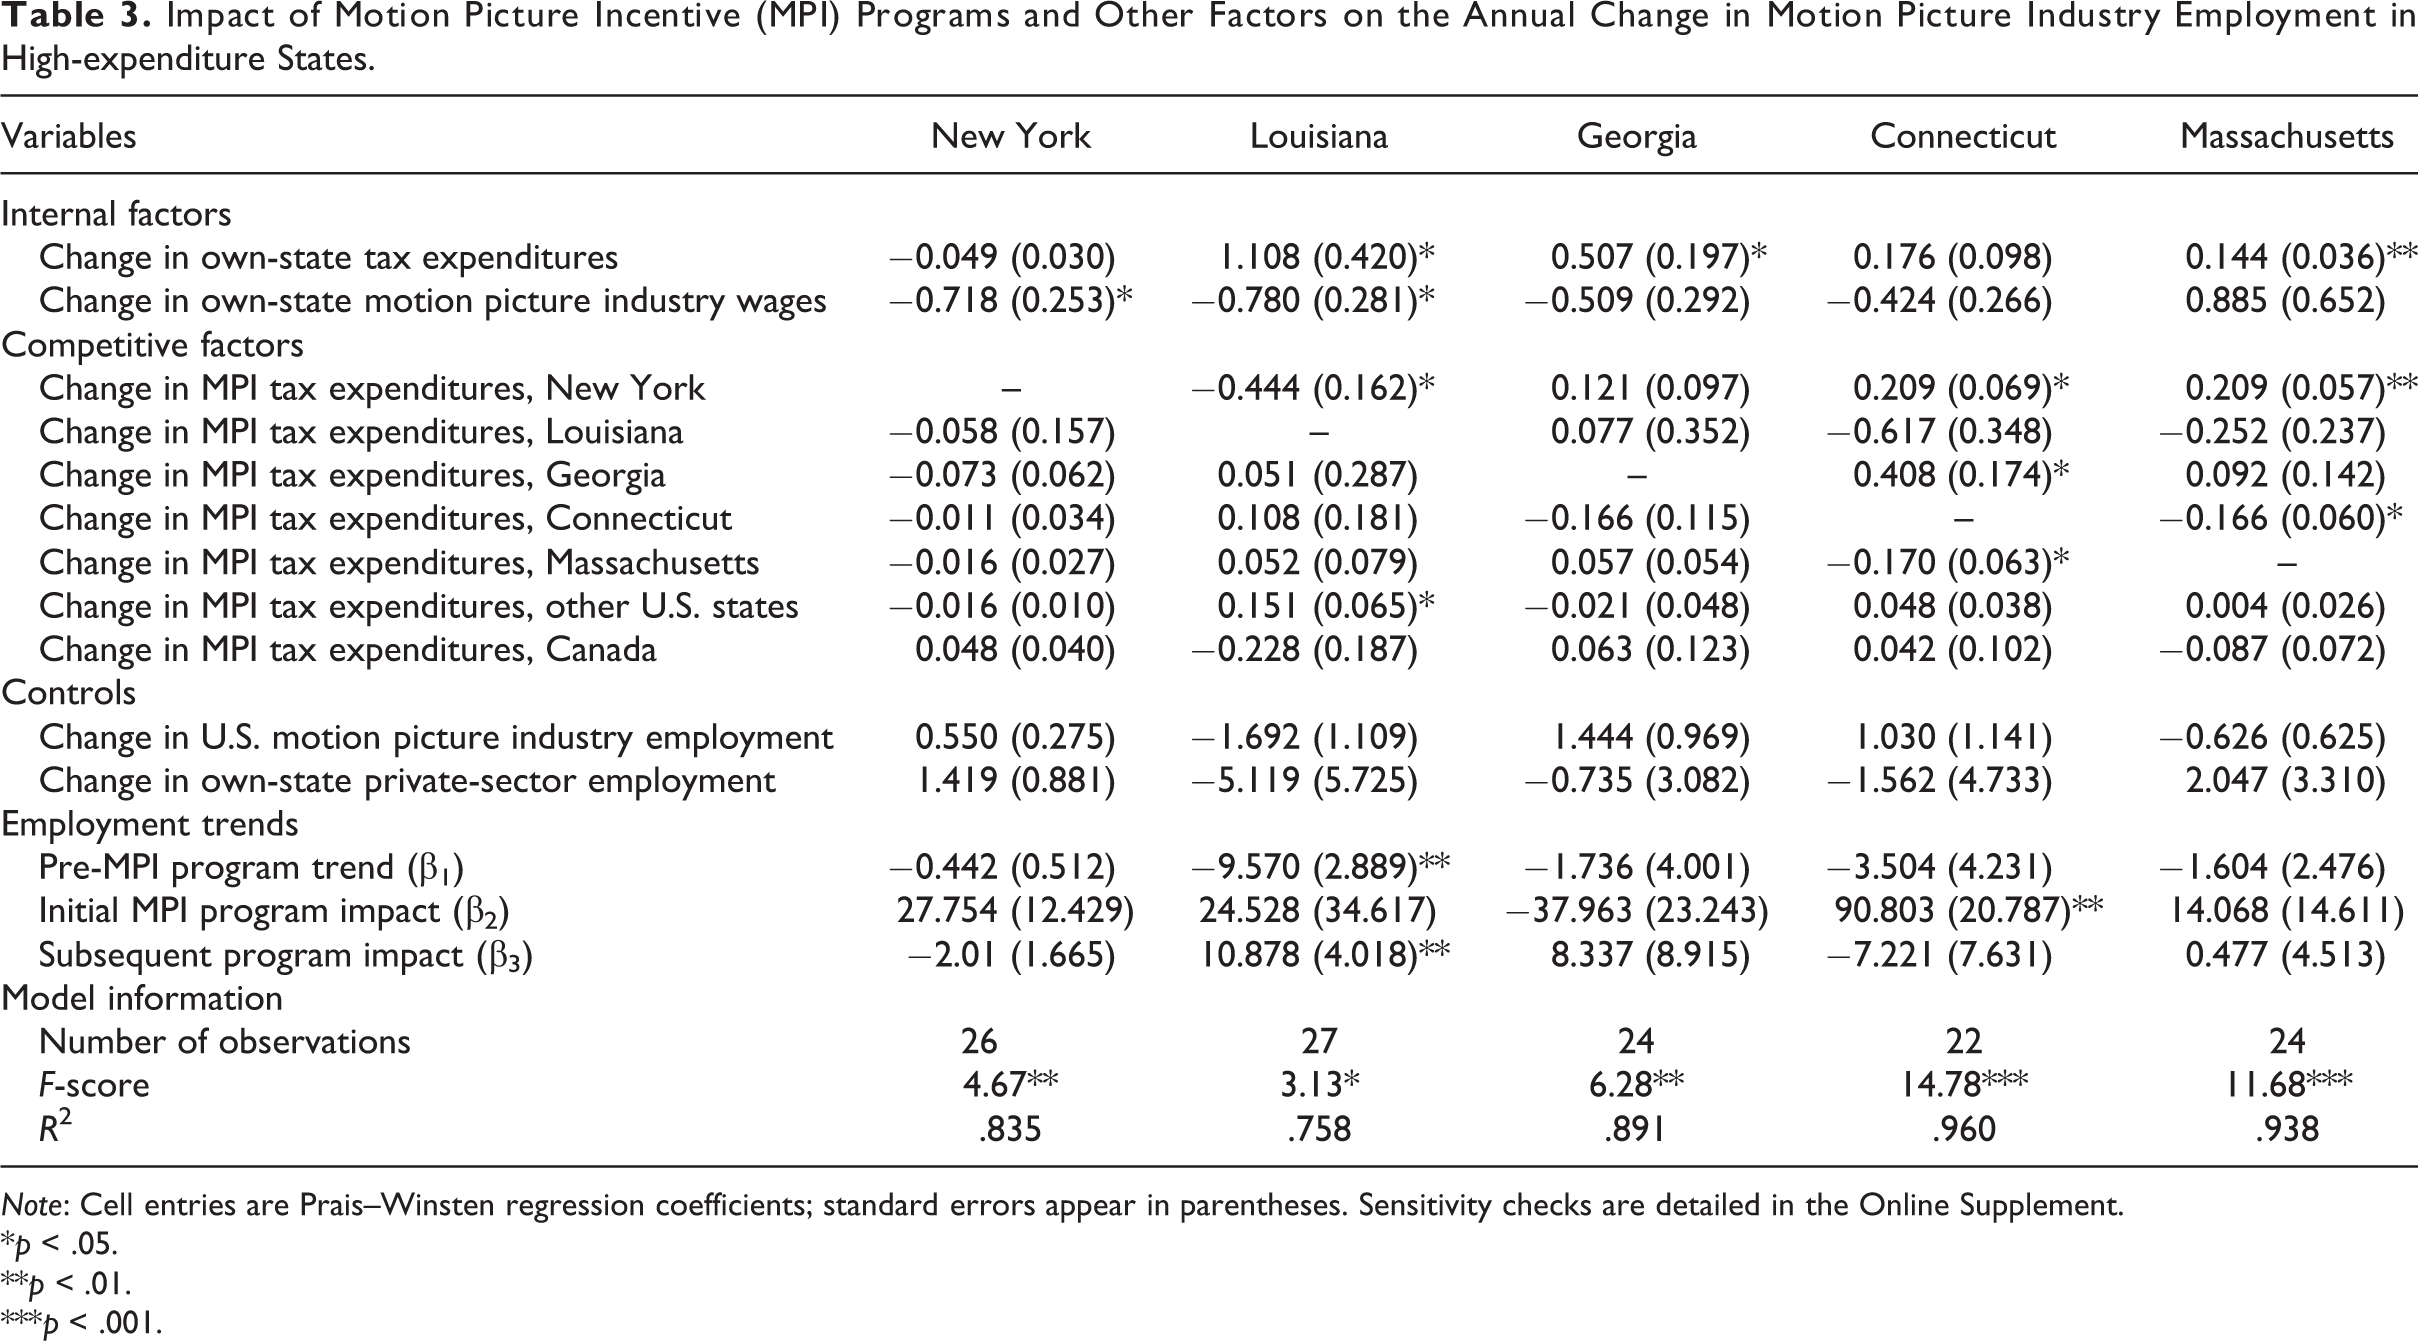
Note: Cell entries are Prais–Winsten regression coefficients; standard errors appear in parentheses. Sensitivity checks are detailed in the Online Supplement.
*p < .05.
**p < .01.
***p < .001.
The results show a statistically significant, immediate impact in one state: Connecticut, where the coefficient is large (β2 = 90.803 or about 91 percentage points). Two points of context are important when interpreting this finding. First, the increase is attributable to nontax components of the state’s MPI program. The tax expenditure coefficient is not statistically significant, indicating that larger expenditures did not contribute to employment gains in Connecticut nor did smaller expenditures contribute to employment losses. Second, at about 500 employees, Connecticut’s motion picture industry labor force was small when the state’s MPI program was implemented. That skews the proportionality of an otherwise small improvement in total employment. A relatively slight increase of fifty employees would equate to a 10 percentage point increase in Connecticut, for instance, but only a 3 percentage point increase in Massachusetts, where the workforce is larger.
The results show a statistically significant program effect over time in one state, Louisiana (β3 = 10.878 or about 11 percentage points annually). Unlike Connecticut, the Louisiana model suggests employment was responsive to changes in corporate tax incentives (b = 1.108, indicating each 1 percentage point increase in tax expenditures corresponded with a 1.108 percentage point increase in employment). These findings should also be interpreted with caution. Due to limited data availability, the Louisiana model was estimated using unbalanced pre- and postintervention phases; if the model is reestimated with balanced phases, both coefficients lose statistical significance.
The influence of corporate tax expenditures on employment elsewhere was mixed. Like Connecticut, expenditures in New York had no statistically significant relationship with employment. Although statistically significant, coefficients for Georgia (b = 0.507) and Massachusetts (b = 0.144) indicate that employment there was inelastic to tax expenditures— a 1 percentage point change in tax expenditures did not propel a comparable change in employment. There is no clear pattern between these findings and whether the tax credit was refundable (New York), transferrable (Connecticut and Georgia), or both (Massachusetts), but—consistent with Thom (2018)—two of the three states with transferrable credits showed at least some employment sensitivity. It may be that because it is more difficult to monetize transferrable credits, productions that wish to realize those credits’ full value must return to the issuing state and engage in further economic activity. That, in turn, may drive additional—if trivial—employment gains.
The results offer evidence of interstate competition, but all coefficients suggest inelastic responses. For example, at the national level, employment in Louisiana decreased as tax expenditures rose in New York (b = −0.444), perhaps because New York’s program was enacted just two years after Louisiana’s and quickly grew to become the largest. At a regional level, employment in Massachusetts increased as tax expenditures rose in contiguous New York (b = 0.209) but decreased as tax expenditures rose in contiguous Connecticut (b = −0.166). But in Connecticut, employment fell by an almost identical degree (b = −0.170) as tax expenditures rose in Massachusetts. That finding implies minor labor competition between Connecticut and Massachusetts, proximate states with other shared characteristics (e.g., climate and a coastal border).
Three additional findings are worth underscoring. First, the results suggest a trade-off between employment gains and wage gains in two states (see also Note 1). Each 1 percentage point wage increase in Louisiana was associated with a 0.780 percentage point decrease in employment. Results for New York point to a similar trade-off. While the industry’s highly transitory nature makes it likely wage and employment changes occur in close time proximity, both of these findings were robust to lagging wages by one year.
Second, the models do not indicate any domestic employment sensitivity to Canadian tax incentives. The associated variable merged Canadian federal incentives with those offered in two provinces, but the finding was robust to estimating each model to control for federal and provincial incentives separately. Null effects were mostly robust to expanding the model to include competing incentives in California and in the United Kingdom. 2
Third, employment changes in four states showed no association with motion picture employment changes nationally. The sole exception is New York, which had the largest preexisting motion picture industry labor force. It is to be expected that as the industry’s employment rose and fell nationwide, the effect would be mirrored in New York regardless of the presence or absence of an MPI program.
Finally, the findings reported in Table 3 were robust to several alternative model specifications. These are described and reported in Text 2 Supplement, Table 3 Supplement, Text 3 Supplement, Table 4 Supplement, Text 4 Supplement, and Table 5 Supplement.
Conclusions
State and local governments in the United States allocate tens of billions of dollars annually to economic development incentives that target specific firms and industries. In recent years, policy makers have shown a preference for conferring corporate tax incentives and other supports on the creative sector in the hopes of creating stable, high-wage jobs. That trend has occurred despite academic research that questions whether targeting is an effective strategy.
This study contributes to that literature by reporting the impact of MPI programs, a bundle of corporate tax incentives and other services for the motion picture industry. Its objective was to determine whether MPI programs impacted employment in the five states with the highest cumulative tax expenditures. Instead of a panel analysis, this study utilized a quasi-experimental, interrupted time series model. Results showed that in most cases, MPI programs had no statistically significant employment impact. Findings that achieved statistical significance nevertheless failed to show practical significance. These uninspiring employment effects reiterate those in other econometric (e.g., Swenson 2017; Thom 2018) and state-specific MPI program assessments (e.g., Adkisson 2013; Gross and Stogel 2010; Murray and Bruce 2017). And they further reinforce the existing literature’s general conclusion that, as an economic development strategy, targeted incentive programs that carry large tax expenditures fail to encourage meaningful job creation.
This study’s results should encourage policy makers to exercise caution before pursuing targeted economic development programs, especially those that incent creative industries. When the output is intellectual property, production can occur anywhere, and the jobs created as a result of incentives—if any—are far from long term. In a competitive market, the only hope to retain those jobs is to increase tax and other incentives, the very same “race to the top” observed when state and local governments try to outbid each other for the latest purported engine of economic growth (e.g., Tesla, Foxconn, Amazon, or a professional sports franchise). That inevitably creates a bubble in which policy makers have overinvested in a program relative to the program’s ability to yield a return on investment (Maor 2014).
This study has some limitations. It does not provide a direct assessment of MPI cost-effectiveness, yet a separate analysis may not be required. Comparing the tax expenditures reported in Table 1 against the scarcity of employment gains attributable to that investment suggests MPI programs are anything but a prudent use of taxpayer dollars. This study also does not thoroughly investigate the relationship between MPI programs and industry wages. However, some evidence points toward a trade-off between employment gains and wage gains, particularly in New York and Louisiana.
This study also highlights avenues of future research. The employment dynamics considered here state level, not local. Whether MPI programs facilitate job creation at the city or county level remains understudied, and so does whether those gains—if any—are real increases or merely a relocation of jobs from one locality to another. The motion picture industry also has specific characteristics, such as relatively short production time frames, that differentiate it from other creative industries that have a higher likelihood of remaining in one location for extended periods, including publishing, fashion, and architecture. Whether incentives targeting those or other less nomadic creative industries have similar effects to those targeting the motion picture industry warrants further scrutiny. To that end, researchers should explore the use of ITSA models and other quasi-experimental research designs that seek to isolate program impacts from confounding factors, an ever-present challenge in economic development analysis.
Supplemental Material
Supplemental Material, SLGR_19-0008R3,_Figure_1_Supplement - Do State Corporate Tax Incentives Create Jobs? Quasi-experimental Evidence from the Entertainment Industry
Supplemental Material, SLGR_19-0008R3,_Figure_1_Supplement for Do State Corporate Tax Incentives Create Jobs? Quasi-experimental Evidence from the Entertainment Industry by Michael Thom in State and Local Government Review
Supplemental Material
Supplemental Material, SLGR_19-0008R3,_Table_1-5_Supplement - Do State Corporate Tax Incentives Create Jobs? Quasi-experimental Evidence from the Entertainment Industry
Supplemental Material, SLGR_19-0008R3,_Table_1-5_Supplement for Do State Corporate Tax Incentives Create Jobs? Quasi-experimental Evidence from the Entertainment Industry by Michael Thom in State and Local Government Review
Supplemental Material
Supplemental Material, SLGR_19-0008R3,_Text_1,2,3_and_4_Supplement - Do State Corporate Tax Incentives Create Jobs? Quasi-experimental Evidence from the Entertainment Industry
Supplemental Material, SLGR_19-0008R3,_Text_1,2,3_and_4_Supplement for Do State Corporate Tax Incentives Create Jobs? Quasi-experimental Evidence from the Entertainment Industry by Michael Thom in State and Local Government Review
Footnotes
Declaration of Conflicting Interests
The author declared no potential conflicts of interest with respect to the research, authorship, and/or publication of this article.
Funding
The author disclosed receipt of the following financial support for the research, authorship, and/or publication of this article: Koch Foundation.
Supplemental Material
Supplemental material for this article is available online.
Notes
References
Supplementary Material
Please find the following supplemental material available below.
For Open Access articles published under a Creative Commons License, all supplemental material carries the same license as the article it is associated with.
For non-Open Access articles published, all supplemental material carries a non-exclusive license, and permission requests for re-use of supplemental material or any part of supplemental material shall be sent directly to the copyright owner as specified in the copyright notice associated with the article.