



Abstract
This paper analyzes the determinants of legislation to increase state gasoline taxes from 1985 to 2013. It closely considers the motives of the political actors considering adoption, comparing the predictive power responsive government and excessive government theories. It finds strong evidence for responsive governments: traffic fatalities per-capita and the proportion of bridges deemed structurally deficient are among the strongest predictors of state gas tax increases. The conclusion of this paper is that gasoline tax increases in the American states represents a case of responsive taxation.
All fifty states employ some form of gasoline tax. The most common tax is paid directly by the consumer at the pump and is fixed in terms of cents per gallon. Lack of inflation indexing in most states means that gas tax revenues do not keep up with highway expenditures unless altered by state legislatures. As such, the level of gas tax is frequently debated in statehouses and increases are adopted with regularity. Indeed, between 1978 and 2013 there were 174 legislatively enacted gas tax increases in the fifty states, a rate of almost five per year. This paper seeks to explain the timing, incidence, and magnitude of legislated increases to the gas tax.
To understand the politics of gas tax adoption, this paper closely considers the motives of elected officials. Officials may hold a variety of conflicting motivations, born from multiple constituencies, ideological preferences, or partisan prerogatives. Following a classification from previous scholarship, this paper compares the predictive power of responsive government and excessive government motivations (Lowery and Berry 1983) as well as other factors previously identified as significant determinants of tax adoption (Hansen 1983; Berry and Berry 1992, 1994). The original contribution is an empirical evaluation of the desire of elected officials to improve transportation safety, an inherently responsive consideration. Whereas past scholarship concluded that considerations relevant to political opportunity had preeminent explanatory power, this paper finds measures of unmet transportation safety needs, a responsive motivation, are among the strongest predictors of tax increases.
The gas tax has properties that are amenable to quantitative analysis and the test of this paper’s theory in particular. For one, directional changes to this tax are relatively easy to identify. This is in contrast to changes to income tax laws, which often have diverging distributional consequences. Additionally, unlike the sales tax, changes to the gas tax occur with relative frequency in the time series. Finally, in many states, gas taxes share the unique property of being constitutionally tied to transportation expenditures through earmarking. This direct relationship makes it easier to detect the motivations of legislators choosing to increase this particular tax.
Motives in Tax Adoption
Previous scholars have analyzed tax adoptions with respect to the “motive, method, and opportunity of political actors” (Hansen 1983, 33). Motives may encapsulate government responsiveness, as argued here, or less public-minded incentives, such as those held by a Leviathan government, or politicians following ideological or special interest prerogatives. This dichotomy follows scholarship on the growth of government, which compares “responsive government” theories to “excessive government” theories (Lowery and Berry 1983). Analysis of methods of tax adoption often includes consideration of stable institutions, such as fiscal constitutions and the effect of federalism. Finally, scholars that focus on opportunity assert that politicians will pass tax increases when it is most politically convenient for them. The findings of both Hansen (1983) and Berry and Berry (1992) suggest that the political opportunity school of thought has preeminent explanatory power. This paper argues that motivations play a larger role than previously specified, largely due to insufficient operationalizations.
Responsive government theories that explain the size of government look to the effect of income growth, urbanization, and growth of high-demand populations, such as the elderly (Lowery and Berry 1983; Lewis-Beck and Rice 1985). Researchers who employ these variables to predict tax increases, however, often find that they are insignificant or even signed in the opposite direction as predicted (Berry and Berry 1992; Hayes and Dennis 2014; Golden, Ribisl, and Perreira 2014). This may be because their glacial movement makes them better suited to explain growth of government expenditures than discrete events. Additionally, these factors are often endogenous to other, often countervailing, forces that affect causal interpretation. This paper considers the effect of a state’s total population, driving population, and income growth on gas tax increases.
An innovation of this research is its alternative measurement of public demand for increased services. Here, demand is operationalized based on need using national transportation statistics on traffic fatalities, bridge condition, and traffic congestion. Driver fatalities were measured as the number of persons fatally injured in motor vehicle crashes per 10,000 people on all road surfaces. Bridge condition was measured by the proportion of bridges that the National Bridge Inventory considered “structurally deficient” and “functionally obsolete.” Finally, change in traffic congestion was calculated as a ratio of vehicle miles traveled (VMT) to lane mileage in urban areas. 1 These three variables were lagged to reflect available statistics at the time of potential legislative decision making. We expect the strongest relationship between gas tax increases and unmet safety concerns, as physical safety is the pinnacle of the conventional conception of the hierarchy of needs. 2
Renewed attention to responsive motivations to raise taxes is merited given the resurgence in recent research on government responsiveness in state politics more generally (Butler and Nickerson 2011; Caughey and Warshaw 2018; Lax and Phillips 2012; Matsusaka 2010; Pacheco 2013; Tausanovitch 2019). New measures of both state-level policy and public opinion have allowed scholars to better map the relationship between these two factors (Jacoby and Schneider 2009; Caughey and Warshaw 2018). Evidence for responsive state governments hold in several articles that focus explicitly on government responsiveness in the realm of state spending but not yet taxation (Butler and Nickerson 2011). Caughey and Warshaw’s measure of mass economic liberalism was included in this analysis.
Responsive government motivations are compared to excessive government motivations. Brennan and Buchanan’s classic work The Power to Tax (1980) describes with clarity legislators’ motives: revenue maximization. In their conception, a “leviathan” government acts as a monopolist, raising taxes unless confronted by prohibiting institutions such as decentralization or tax limitations. In the real world, revenue maximization, as noted in other literature, often collides with the premise of fiscal capacity (Mikesell 2007; Tannenwald and Cowan 1997). Rising incomes increase a state’s fiscal capacity and therefore may be associated with tax increases. This prediction, known as Wagner’s Law, thus fits both responsive government and excessive government theories (Yousefi and Abizadeh 1992; Garand 1988). In this paper, income growth was operationalized as the first difference of the log of real personal income in the state.
Other scholars consider preferences for revenue maximization to have ideological grounding. While traditional scholarship finds parties to have little impact on fiscal outcomes (Dye 1966; Winters 1976; Hansen 1983; Garand 1988; Dilger 1998), more-recent scholarship has seen a resurgence of studies that show Democrats to be more likely than Republicans to expand the size of government (Alt and Lowry 1994; Smith 1997; Alt and Lowry 2000). In this paper, partisan balance of state government was controlled for using dummy indicators of Democratic and Republican unified control of state government, with divided government serving as the omitted baseline.
Previous research also suggests that legislative motives are affected by the interest group environment (Baumgartner and Leech 1998; Gray and Lowery 1996). Examples of interest-group politics and its influence on tax policy can be found in taxation on e-commerce (Best and Teske 2002; Propheter 2012) and tobacco excise taxes (Golden, Ribisl, and Perreira 2014). Notably, the influence of interest groups on the gas tax is up for debate. Nelson (2002) finds that employment of manufacturers of petroleum products has little influence on a state’s excise tax on those products, while Decker and Wohar (2007) find positive effects of the freight industry on taxes on diesel gasoline. In this paper, a state’s production of crude oil by volume was used as a proxy for the influence of this industry.
Data, Methods, and Competing Explanations
The adoption of legislation to increase gas taxes was analyzed using repeated event history analysis. The data encompassed forty-nine U.S. states, excluding Alaska, from 1985 to 2013. A logistic regression was employed that includes state fixed effects and accounts for the passage of time. Descriptive statistics and sourcing for all variables are available online in Supplemental Table 1.
Repeated event history analysis is an appropriate estimation technique for this case. The purpose of event history analysis is to explain the occurrence of events while accounting for temporal dependence. An assumption implicit in this form of analysis is that a tax increase is inevitable in the time series. This is a reasonable assumption for state gas taxes since most states employ flat, cents-per-gallon rates that require updating to keep up with inflation. Following the advice of Box-Steffensmeier and Jones (2004), a logistic regression that included cubic splines was estimated. The first term of the spline counts upward from the start of the time series, resetting to zero when a state adopts a gas tax increase. The second and third terms are polynomial interpolations of this counter variable. These terms accounts for the linear and nonlinear nature of time dependence.
The usage of state fixed effects is critical to the research design. The fixed effects estimator leverages variation within as opposed to across states. This heightens causal inference since wide variation across states is often correlated with unobservable differences, and is easily subject to endogeneity concerns. Because past research has shown a potential for bias in unconditional fixed effect regressions with small numbers of groups, the model was run using the conditional logistic fixed effects estimator as a precaution (Katz 2001; Beck 2018). The results are robust to both specifications, with only negligible differences in coefficients and marginal effect estimates.
The coding of gas tax increases is original. The coding process began by reviewing gas tax rates from Heckelman and Dougherty (2010), the World Tax Database (2010), NASBO Fiscal Surveys of the States (various years), as well as miscellaneous state records. For every reported change in the gas tax rate, newspaper analysis and online state records were consulted to code the precise year of legislative action. This additional research was necessary to confirm that the rate increase was not the result of previous mandates such as phased-in step increases, sunsets, or, in the case of states with variable rate gas taxes, automatic changes linked to economic variation. Gas tax increases that resulted from new legislation to change the formula of a variable rate gas tax were included. Gas taxes can be collected from a variety of means: excise taxes, fees, wholesale petroleum taxes, as well as through the sales tax, all of which were considered in this analysis. All verified, legislative actions to increase gas taxes were coded dichotomously based on the calendar year of adoption.
Alternative Explanations: Method and Opportunity
Although this paper is primarily interested in the motives of elected officials, other considerations are important to account for and consider comparatively. Here we discuss factors that fall into the “method” and “opportunity” schools of thought (Hansen 1983).
The method of tax adoption was conceived in the vein of new institutionalism (Shepsle 1989). The role of stable institutions in matters of state and local public finance is well documented (Besley and Case 2003; Rose 2010). This analysis tested for the effect of two stable institutional variables: supermajority requirements to raise taxes and variable-rate gas tax policies. Each of these variables is, as a dummy variable based on the first year of implementation. Previous research has shown that supermajority requirements to raise taxes have been effective in reducing revenue growth (Knight 2000; Besley and Case 2003). The indicator for variable-rate gas taxes comprised all policies that have a practical effect of updating the tax over time without legislative action. This included what is most traditionally characterized as a variable-rate gas tax—legislation that pegs the tax to inflation, population, or price—but also the application of sales taxes to gasoline or petroleum business taxes, which are applied to the wholesale price of gasoline. The expected relationship between this variable and gas tax adoption is negative.
Federalism is another institution known to affect state and local finance practices. In a phenomenon known as the “flypaper effect,” researchers hypothesize that grants-in-aid increase the spending of the recipient jurisdiction overall (Hines and Thaler 1995; Wyckoff 1991) as well as for transportation expenditures in particular (Gamkhar 2000, 2003; Nesbit and Kreft 2009; Leduc and Wilson 2017). Here a flypaper effect was tested for using the apportionment of federal funds administered by the Federal Highway Administration relative to state highway expenditures. This ratio captures the relative importance of federal funding to state transportation coffers and avoids bias associated with per-capita measures in small states. Because of an interest in changes to federal funding, the first difference of this measure was taken.
The political opportunity school of thought asserts that politicians will pass tax increases when it is most politically convenient for them (Hansen 1983; Berry and Berry 1992). Berry and Berry’s (1992) conception of political opportunity was closely followed, with consideration of the effects of unified government, election timing, fiscal stress, and geographic diffusion. Added to this model is a measure of the real price of gasoline as measured in dollars per barrel and levels of competing tax sources, namely the sales tax rate and top income tax rate for high-wage earners. These variables were included because both effect the tax environment: Lawmakers may be deterred from increasing gas taxes when these measures are high.
The incidence of gas tax increases is expected to be more likely to occur under unified governments, but not in gubernatorial election years. A unified government eases transaction costs associated with political bargaining and negotiation (Hansen 1983; Berry and Berry 1992). However, fears of electoral retribution will lead all governments to strategically avoid tax increases during election years (Kiewiet and McCubbins 1985; Berry and Berry 1992). Gubernatorial elections were chosen because governors are the drivers of fiscal policy in their states and they are often held responsible at the polls for tax increases (Kone and Winters 1993; Niemi, Stanley, and Vogel 1995; Lowry, Alt, and Ferree 1998; Davis and Nicholson-Crotty 2016). Klarner (2013) provided the dichotomous measures of both of these variables.
Times of fiscal stress have also been shown to be both opportune and necessary moments to pass new revenues (Hansen 1983; Berry and Berry 1992; Rubin 2019). Practical and political incentives align since state governments are often constitutionally required to balance budgets and budgetary solvency has consequences for political tenure (Lowry, Alt, and Ferree 1998; Brogan 2012). Fiscal stress was measured with two variables. The first measure was the growth of per capita personal income. In contrast to Wagner’s law, political opportunity theory expects this variable to be negatively signed because fiscal stress makes tax increases more politically palatable and necessary. The second measure more precisely indicates a recessionary environment using average, annual recession probabilities by state. These probabilities were constructed from the method described by Owyang, Piger, and Wall (2005). Because recession probabilities and personal income growth are highly correlated (r = 0.46), models were run both with these variables in combination and separately.
Finally, regional diffusion may also increase political opportunities to raise taxes. Voters in one district will use the performance of neighboring jurisdictions as a yardstick by which to judge the performance of their politicians and their fiscal policies (Besley and Case 1995; Berry and Berry 1992; Nelson 2002; Davis and Nicholson-Crotty 2016). Two variables were employed to capture the effects of the diffusion of policy and competition between states. The first was a count variable of the number of legislated gas tax increases by geographic neighbors that occurred in the previous two years. The two-year interval was chosen based on the empirical results of Desmarais et al. (2015). The second variable was a dummy variable indicating whether a state’s gas tax was below the median level of its geographic neighbors’ gas taxes, a variable also obtained through the Federal Highway Administration’s Highway Statistics Series. States whose gas tax is currently below the median of its neighbor states would be more likely to pass a tax increase since the public is likely to use neighboring states as a yardstick for acceptability.
Gas Tax Increase Incidence
Results that explain the incidence of gas tax increases appear in Model 1 of Table 1. For all variables, marginal effects (see Supplemental Figure 1 online) were calculated to ascertain the substantive effect on the probability of a gas tax increase. Marginal effects were estimated going from zero to one for dichotomous variables as well as the recession probability variable and from one standard deviation below the mean to one standard deviation above the mean for all other variables. To ensure reasonable predictions, mean within-state standard deviations were employed.
Gas Tax Increases in the American States: Incidence and Magnitude.
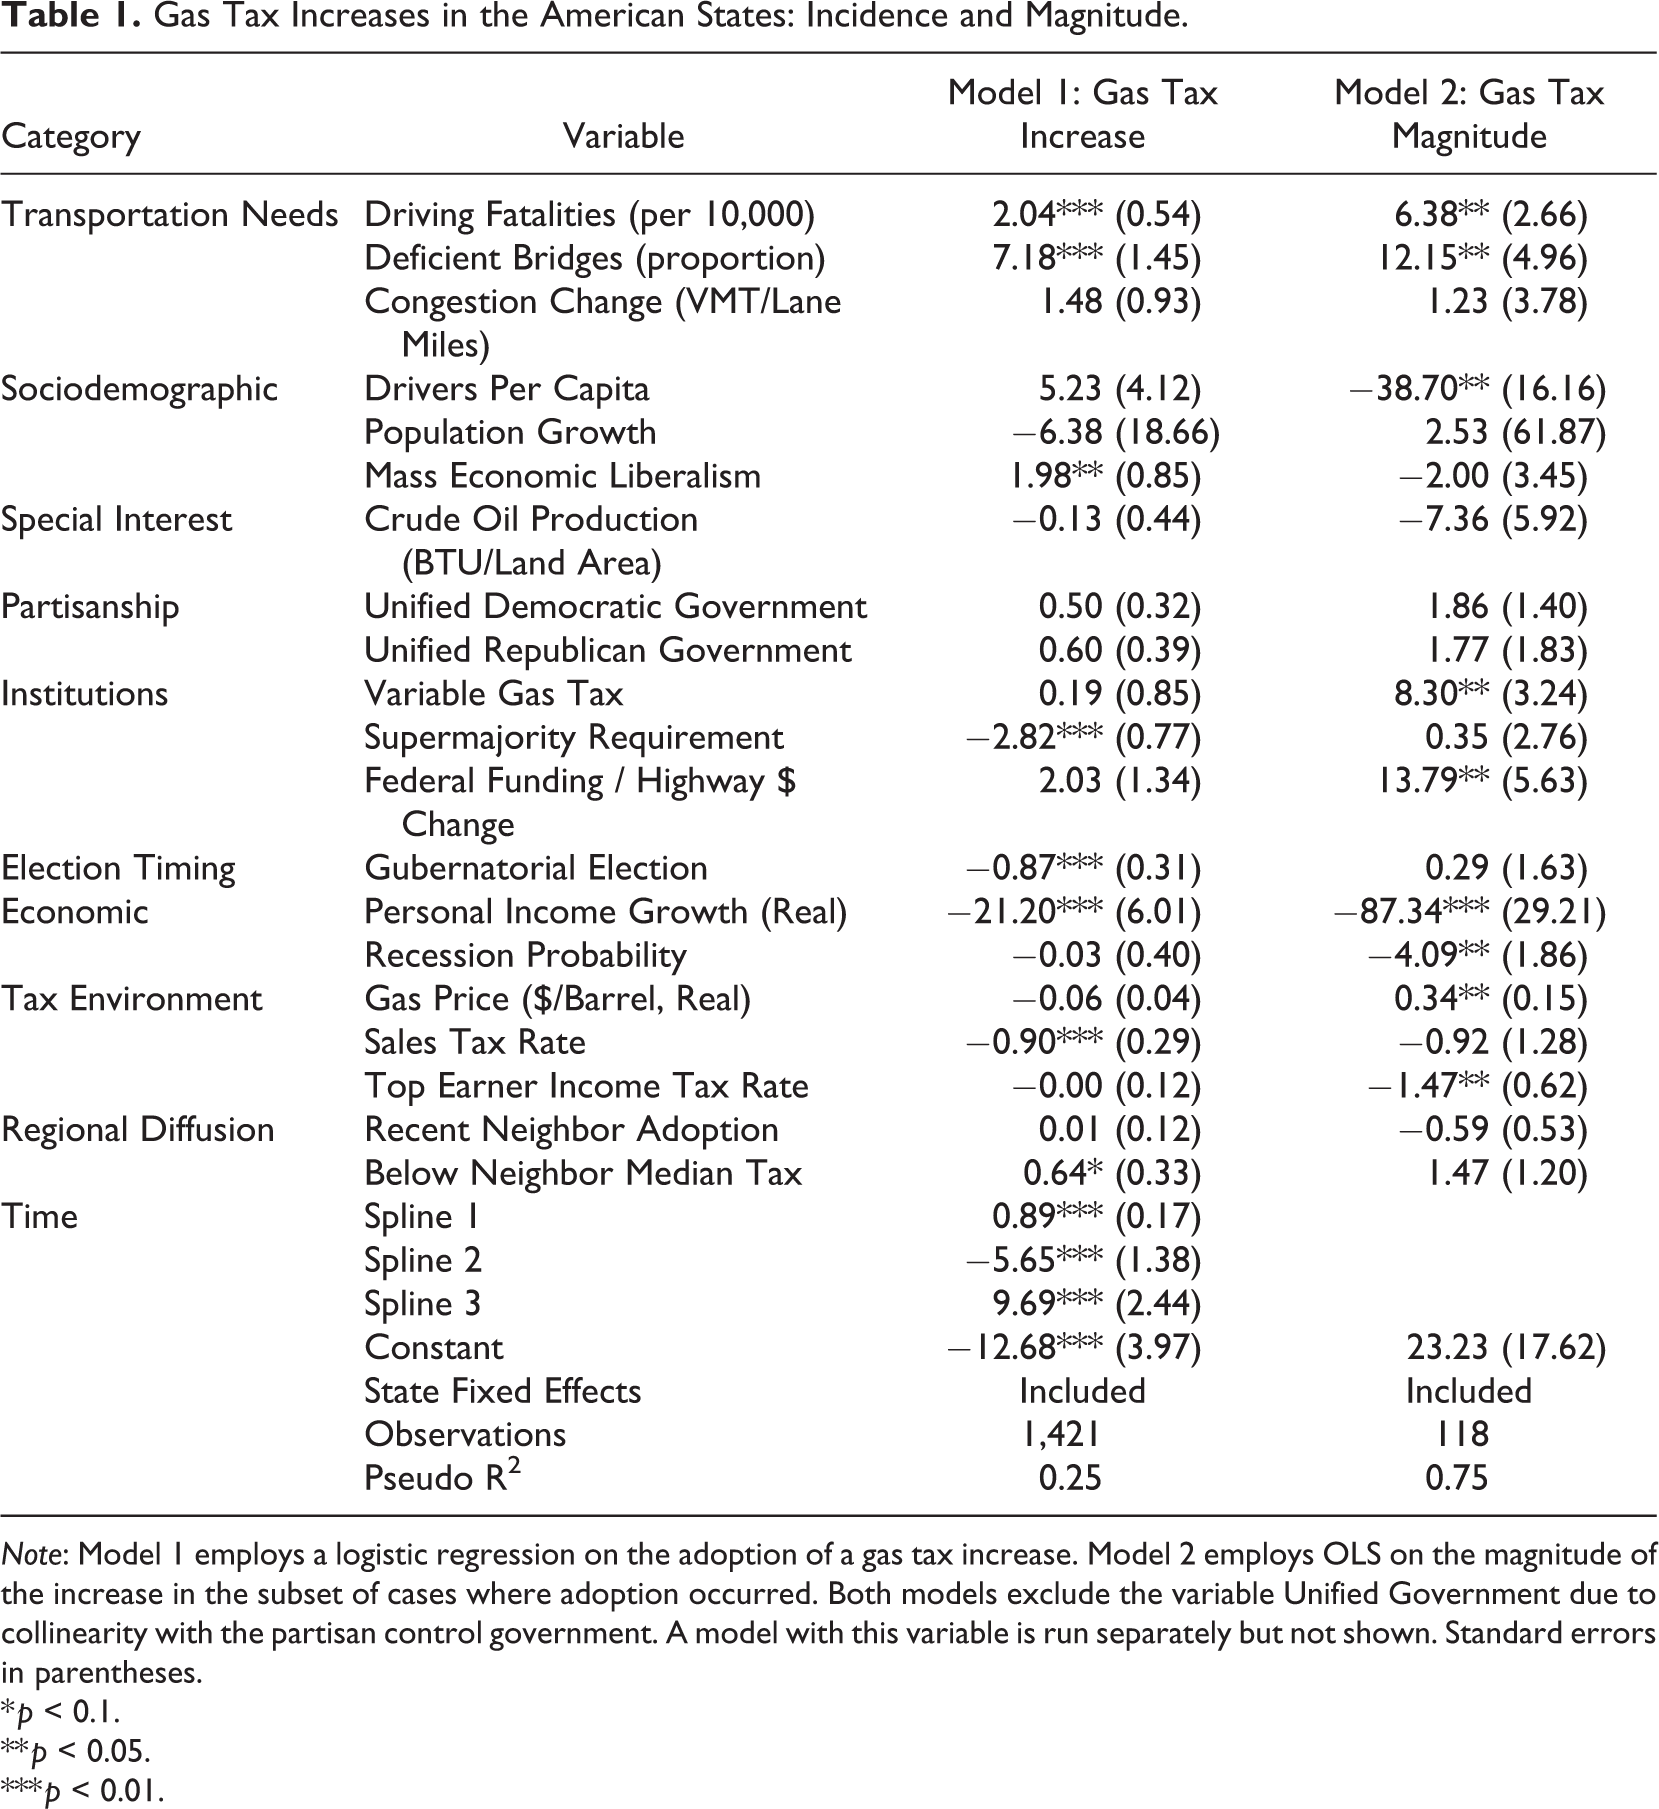
Note: Model 1 employs a logistic regression on the adoption of a gas tax increase. Model 2 employs OLS on the magnitude of the increase in the subset of cases where adoption occurred. Both models exclude the variable Unified Government due to collinearity with the partisan control government. A model with this variable is run separately but not shown. Standard errors in parentheses.
* p < 0.1.
** p < 0.05.
*** p < 0.01.
We start by reviewing the variables that account for the motives of state legislators. First and foremost, the three variables that account for unmet transportation needs performed quite well, particularly those that capture concerns of transportation safety. Driver fatalities and bridge condition were both statistically significant with substantial marginal effects, associated with 0.09 and 0.07 increases in the probability of passing a gas tax increase respectively. The measure of change in traffic congestion was positively signed and obtained a p-value of 0.11. Together, these three variables provide substantial explanatory power in the model. Specifically, the Pseudo R2 falls from 0.25 to 0.20 if these three variables are omitted. Indeed, using this method, bridge deficiency has the single most explanatory power of any variable in the model. Omitting this variable in isolation results in a drop of R2 to 0.22.
Theories of responsive government also found support through a significant finding of a relationship between mass economic liberalism and gas tax increases, which was associated with a 0.04 probability of increasing the gas tax. Two additional sociodemographic variables that spoke to potential motivators for legislators to increase taxes—the size of the population, and the percentage of the population that is licensed drivers—were included in the model but failed to achieve significance.
Excessive government theories of motivation did not perform well in the model. There was no support for the Leviathan theory, as the variable of income growth is signed in the opposite direction than expected by this theory. Further interpretation of this variable is saved for the discussion on fiscal stress. Partisan-driven ideological motives, with Democrats seeking to increase taxes, were not supported in the model in that unified Democratic and Republican control are statistically indistinguishable. Additionally, the empirical results show no support of the hypothesis that within-state variation in corporate interests affects the political calculus, as there was no significant effect for the level of crude oil production.
We now turn to the variables that affect the method of gas tax adoption, those that describe the stable institutional context. The existence of a variable gas tax policy and change in federal funding had no effect on the passage of gas tax increases. In contrast, the absence of a supermajority requirement to pass taxes was the single strongest predictor of the passage of a gas tax increase in terms of marginal effects. States with supermajority limits reduced the probability of a gas tax increase by over 0.11 relative to states without these requirements. The pseudo R2 of the model falls to 0.23 if this variable is excluded.
Turning to variables that capture political opportunity, the results largely replicated the three central findings of Berry and Berry (1992). Significant results were achieved for the effect of fiscal stress and election timing, and to a lesser extent the regional diffusion hypothesis. Specifically, the first measure of fiscal stress, the growth of personal income, was associated with a 0.06 drop in the likelihood of passing a gas tax. Recession probabilities were insignificant in the model, but collinearity largely explains this outcome. 3 Gubernatorial election years were associated with a 0.05 drop in the likelihood of passage. The variable that counted the number of geographic neighbors that passed legislation was insignificant but states were 0.04 more likely to increase their gas tax when their current gas tax was at or below the median of their neighbors (p-value = 0.053). Unlike Berry and Berry (1992), this paper replicated Hansen’s (1983) finding that the presence of a unified partisan government provides a political opportunity to pass tax increases: The presence of a unified government relative to a divided government was marked by a 0.05 increase in the probability of legislation to increase gas taxes (analysis through separate model, results not shown).
Finally, there is some evidence that the tax environment, specifically high gas prices and high tax rates for some alternative taxes, deter gas tax passage. In particular, high sales tax rates were associated with a 0.05 decreased likelihood of passing a gas tax. The coefficient on gas prices was in the predicted direction, but failed to achieve significance (p = 0.11). Top-earner income tax rates appear wholly unrelated to gas tax adoption.
Gas Tax Increase Magnitude
This section expands the analysis to determine whether the magnitude of gas tax increase is similarly dependent on factors related to motive, method, and opportunity. The dependent variable is the total size of the gasoline tax, including planned phase-in or step increases, in real cents per gallon. Analysis was completed using Ordinary Least Squares and includes fixed effects. The results, which appear in Model 2 of Table 1, confirm this paper’s key finding on tax incidence. Both driver fatalities and bridge conditions are positively and significantly associated with larger gas tax increases. Specifically, a two standard deviation shift in driving fatalities was associated with a 3.8-cent larger gas tax increase. A two standard deviation increase in bridge deficiency was associated with a 1.9 cent larger gas tax increase. Traffic congestion was not a significant predictor of the magnitude of the increase.
Once again, we could not statistically distinguish between unified Republican and Democratic controlled governments, though once again a positive and significant effect is found in combination (results not shown). The presence of supermajority limits, the strongest predictor of gas tax legislation adoption, did not predict the magnitude of the increase. Both federal funding and variable gas tax policies were positively related to the magnitude of the increase. The former is supportive of a flypaper effect, as expected, but the latter is a somewhat counterintuitive finding. Endogeneity concerns cannot be ruled out, however, in that perhaps the states with variable-rate tax policies are simply more amenable to higher gas taxes than other states.
The fiscal stress hypothesis received mixed results in this analysis. Both increases in personal income growth and the presence of a recession are associated with smaller gas tax increases. These results are not due to collinearity, as they directionally hold when each variable is modeled in isolation. Smaller magnitude increases during recessions follows intuition, as legislators are simply trying to balance budgets, not engage in new infrastructure ventures. The negative effect of personal income growth is more perplexing but perhaps suggests that the largest magnitude gas tax increase occurs in average economic settings.
There are several variables significant in this secondary model of gas tax magnitude that did not predict tax adoption itself. Specifically, a higher proportion of drivers in a population and higher top-earner income tax rates were significantly associated with smaller magnitude increases to the gas tax. This may suggest reticence on behalf of legislators to increase taxes when tax burden is already high and when the burden would be widespread. In contrast, gas prices were positively associated with higher magnitude gas tax increases. While this finding may seem contradictory to our initial hypothesis, it makes intuitive sense if legislators think about the cost of gas tax increases for consumers in terms of percent change, not cents-per-gallon.
Conclusion
To understand the adoption of state gas taxes, this paper considered the motive, method, and opportunity of political actors (Hansen 1983). Previous researchers have posited a variety of potential “excessive government” motives for gas tax increases, including revenue maximization, partisan interests, and interest group influence. This paper found limited support for these motivations and instead supports responsive government theories. Specifically, measures of unmet transportation safety needs are among the strongest predictors of gas tax increases. This finding, along with a significant relationship between tax adoption and mass economic liberalism, supports recent research findings in favor of the responsiveness of state governments (Caughey and Warshaw 2018).
Whether the findings can be generalized beyond the gasoline tax is an important question to be answered in future research. The gas tax does have several properties that make it a most-likely case for our theory. Most importantly, the gas tax is constitutionally dedicated to transportation spending in many states. It may be that dedicated funding makes gasoline tax increases more palatable to the public, causing this particular tax alone to pass with increased regularity and in a manner responsive to public needs. Second, the specific public needs addressed by gasoline taxes also have properties that are amenable to our hypothesis. In particular, both driving fatalities and structural bridge deficiencies are visible, easily understandable, and well-documented indicators of transportation safety needs. Each of these characteristics likely makes it easier and more probable that public officials will act responsively.
Future research could expand our efforts by examining whether this is an isolated case of responsive taxation. Both studies of other forms of taxation and of the importance of dedicated funding structures are worthwhile avenues for future research. For example, the fifty states vary on whether sales taxes are dedicated and to which funding purposes. Do either of these variations matter to responsiveness? Crowley and Hoffer (2018) find that states vary widely in their overall usage of earmarked taxes, from only 4 percent in Rhode Island to 84 percent in Alabama. How does this variation affect overall fiscal responsiveness? While this paper does not have answers to these questions at this time, we see great promise in future research that bridges the literature on state taxation and government responsiveness. These initial findings on the case of gasoline taxation gives hope that state taxation does indeed occur responsively.
Supplemental Material
Supplemental Material, Seljam_et.al.,_Figure_1_Supplement - Gasoline Tax Increases in the American States: A Case for Responsive Taxation
Supplemental Material, Seljam_et.al.,_Figure_1_Supplement for Gasoline Tax Increases in the American States: A Case for Responsive Taxation by Ellen C. Seljan, Allison K. Schneider and Dalles Bowen in State and Local Government Review
Supplemental Material
Supplemental Material, Seljam_et._al.,_Table_1_Supplement - Gasoline Tax Increases in the American States: A Case for Responsive Taxation
Supplemental Material, Seljam_et._al.,_Table_1_Supplement for Gasoline Tax Increases in the American States: A Case for Responsive Taxation by Ellen C. Seljan, Allison K. Schneider and Dalles Bowen in State and Local Government Review
Supplemental Material
Supplemental Material, Seljam_et_al.,_Text_1_Supplement - Gasoline Tax Increases in the American States: A Case for Responsive Taxation
Supplemental Material, Seljam_et_al.,_Text_1_Supplement for Gasoline Tax Increases in the American States: A Case for Responsive Taxation by Ellen C. Seljan, Allison K. Schneider and Dalles Bowen in State and Local Government Review
Footnotes
Declaration of Conflicting Interests
The authors declared no potential conflicts of interest with respect to the research, authorship, and/or publication of this article.
Funding
The authors received no financial support for the research, authorship, and/or publication of this article.

Supplemental Material
Supplemental material for this article is available online.
Notes
References
Supplementary Material
Please find the following supplemental material available below.
For Open Access articles published under a Creative Commons License, all supplemental material carries the same license as the article it is associated with.
For non-Open Access articles published, all supplemental material carries a non-exclusive license, and permission requests for re-use of supplemental material or any part of supplemental material shall be sent directly to the copyright owner as specified in the copyright notice associated with the article.
