
Abstract
We present a historical outline of racial inequality in Virginia’s kindergarten through 12th grade educational system focusing on de jure school desegregation and subsequent massive resistance following Virginia’s role in Brown v. Board of Education. Currently, standardized tests are used to evaluate students’ educational progress and knowledge, evaluate teacher and administrative effectiveness, and measure states’ educational efforts. In this article, we use school district-level data to examine racial disparities between black and white students in Virginia in 2010. We find widespread disparities in standardized test score passing rates with the exception of black students’ performance in history and social science before high school. Black students are consistently less likely than white students to earn passing scores in all subject areas at each grade level. We use state-level education data such as school district size, teacher–student ratio, and school funding to contextualize the standardized test data. We find that the locale of schools and their close links to white financial advantage and black student segregation can impact school resources and influence black students’ performance on standardized tests. We argue that the historic denial of equal educational opportunities to black Virginians is related to current educational inequality. We discuss our analyses in relation to policy implications for black student academic achievement.
Personal Reflexive Statements
Rachelle J. Brunn-Bevel: I have experienced a variety of different educational institutions throughout my life. I attended a predominantly black elementary school, a racially and ethnically heterogeneous high school, and predominantly white institutions for my undergraduate and graduate degrees. Moving from high school to college was a bit of a culture shock and I have been interested in educational inequality ever since. While racial disparities initially piqued my curiosity, my research currently focuses on how students’ race, ethnicity, class, gender, and immigrant status intersect to influence their educational experiences and outcomes. There is evidence of an achievement gap in many aspects of American education and the standardized test score gap is particularly durable. This study examines both the historical and contemporary causes of racial disparities in standardized test scores focusing on school segregation and resource inequality.
W. Carson Byrd: Reflecting on our educational experiences can oftentimes help us with understanding how our social position influenced our own research and theoretical perspectives. These reflections of our schools, classmates, classes, activities, and the context of when we went to school sheds light on how we developed into the scholars we are today. I find myself identifying how the numbers in our study below relate to my own experiences going through schools in North Carolina and Virginia. At one point in my life, I was a young white boy in a nearly all-black and brown classroom for remedial students in a large city, and then a few weeks later I was labeled “gifted” and “going places” in a small, mountain town with almost all white peers sitting next to me. The opportunities and resources available to my friends in each school, each classroom for that matter, varied greatly and some of us were lucky to make it to high school graduation. This study reflects another piece of the puzzle that my work on educational inequality and race attempts to clarify with the hope of identifying effective changes to improve the educational opportunities and structures in the future.
Extant research has demonstrated that there are wide disparities in the quality of contemporary public schools in the United States (Darling-Hammond 2004; Kozol 2005, 1991). In 2014, the U.S. Department of Education Office of Civil Rights released several reports (drawing on data from the 2011–2012 Civil Rights Data Collection Survey) that highlighted and reignited a national dialogue on education inequality. In March, the Office of Civil Rights released an Issue Brief on College and Career Readiness, which indicated that white students are overrepresented in gifted and talented education (GATE) programs and black students are underrepresented. Nationwide, approximately 60 percent of students enrolled in GATE programs were white. White students comprised approximately 50 percent of the enrollment in GATE schools, while black students were 9 percent of all students in GATE programs, but 15 percent of students enrolled in schools that offer GATE programs (U.S. Department of Education Office of Civil Rights 2014a).
On the other end of the spectrum, nationwide in 2011–2012, black students were approximately three times more likely to be suspended or expelled than white students (U.S. Department of Education Office of Civil Rights 2014b). Black students are also more likely to attend schools where teachers are not properly certified and where teachers tend to be underpaid relative to their counterparts. Nationwide, in the 2011–2012 school year, black students were approximately four times more likely than white students to attend schools where 20 percent or more of their teachers had not met all state certification and licensing requirements (U.S. Department of Education Office of Civil Rights 2014c). National data illustrate that, “on average, teachers in high schools serving the highest percentage of black and Latino students are paid $1,913 less per year than their colleagues in schools in the same district who serve the lowest percentage of black and Latino students” (U.S. Department of Education Office of Civil Rights 2014c:3). Additionally, public schools continue to be segregated by race, ethnicity, and income.
In theory, the Brown v. Board of Education of Topeka, Kansas (1954) decision should have rapidly accelerated school desegregation in the United States. Virginia was central to the Supreme Court’s 1954 landmark ruling. Prior to the ruling, the dominant sentiment among many white Virginians was that the Commonwealth used more civil and less violent means of keeping blacks and whites separate than other states in the Deep South (Bonastia 2012). In the 1920s and 1930s, many believed that if whites ensured that blacks’ basic needs were met, black citizens would not push for desegregation in neighborhoods and schools. Douglas Southall Freeman (editor of the Richmond News Leader in the 1920s) called this “separation by consent” “the Virginia Way” (Smith 2002:4). In fact, Smith (2002) argues that “Virginia’s reputation for good race relations remained relatively intact until the mid-1950s, when white Virginians led the white South down the path of massive resistance rather than comply with the Supreme Court’s Brown v. Board of Education decision” (p. 8). Despite this civility in dealing with “the race problem,” in the first few years after Brown, “… the NAACP filed more school desegregation suits in Virginia than in any other state” (Lassiter and Lewis 1998:5).
In this article, we present a historical outline of racial inequality in Virginia’s kindergarten through 12th grade (K-12) educational system focusing on de jure school desegregation and subsequent massive resistance following Virginia’s role in the Brown decision. We also discuss how public school districts across Virginia implemented a variety of creative strategies to continue resisting providing equal education for all well after Brown. Gates (1964) contends that there are four Virginias: the Black Belt (consisting of Tidewater and the Southside), the White Belt (the westernmost parts of Virginia), the Middle Ground which lies between the two belts, and the cities such as Norfolk, Richmond, and Roanoke. These four regions of the state differ with regard to their geography, the size of the black population, the character of their economies, and (most importantly for the purposes of our article) their resistance to school desegregation (Bonastia 2012; Gates 1964). White Virginians living close to more heavily populated black regions seemed particularly resistant to school desegregation (Bonastia 2012). However, we argue that since the 1960s the regions have shifted in the state to include the Black Belt (Tidewater and Richmond areas), a “newer” metropolis with the expansion of the Washington, D.C. metropolitan area in Northern Virginia, and the White Belt that encompasses most areas outside of the three main metropolitan areas of the state.
Siegel-Hawley et al. (2013) argue that, “By 1991, the Supreme Court was dismantling desegregation plans across the country. People began to think that desegregation had failed and that there was a way to make schools equal in segregated and unequal communities, through testing and standards or through charter schools” (p. iii). However, black students continue to lag behind white students in standardized test performance and most measures of academic achievement.
Our article explores “the black–white test score gap,” given that it is a key and particularly enduring measure of educational inequality. We also examine access to highly qualified teachers, student–teacher ratio, school funding, and high school graduation rates. Virginia’s responses to school desegregation—both proactive and reactive—can be described in a series of phases. These include efforts to equalize black and white schools in the 1940s, containment or massive resistance in the 1950s to the mid-1960s, token desegregation and “freedom of choice” in the 1960s, busing in the 1970s, and retrenchment in the 1980s and onward (Littlejohn and Ford 2012; Pratt 1992). Various regions in Virginia proceeded through these stages more smoothly than others. Some metropolitan or rural areas skipped stages such as massive resistance and the school closings which we will discuss in detail below. Our article examines the historical factors such as the presence of a sizable black community, commitment to local and state funding of public schools, teacher quality, economic inequality, and white flight. We highlight how these factors manifested themselves in the three major metropolitan areas as compared to the more rural parts of Virginia. In turn, we investigate how these factors influence contemporary black–white disparities in standardized test scores.
In the current era, standardized tests are used to evaluate students’ educational progress and knowledge, teacher and administrative effectiveness, and states’ efforts to educate their citizens as part of the No Child Left Behind Act (NCLB). The expressed purpose of NCLB is “to close the achievement gap” (2002). The act explicitly focuses on improving the academic achievement of disadvantaged students, limited English proficient students and American Indian, Alaskan, and Hawaiian Native Students. States must define adequate yearly progress (AYP) and develop a timeline for implementation. The NCLB mandated that all students be proficient in reading and math by the end of the 2013–2014 academic year (Borman and Cotner 2008). Despite these provisions, the missed deadline, and the heavy use and monitoring of standardized tests results (Alcazar 2006), particularly in the public schools, scholars have not fully explored how state-level results inform the debate on the black–white test gap (see Jencks and Phillips 1998 and Magnuson and Waldfogel 2008 for an overview). The NCLB’s lack of attention to the historical context of U.S. public schools may help explain the racial disparities in standardized test scores.
In this article, we use school district-level data to examine racial disparities between black and white students’ standardized test pass and fail rates in Virginia in 2010. Additionally, we use state-level education data such as school district size, teacher–student ratio, and school funding to contextualize the standardized test data. We build on the previous work of the Civil Rights Project (2013) report referenced above by examining test score disparities in Virginia’s three largest metropolitan areas: Norfolk-Virginia Beach-Newport News, Richmond-Petersburg, and Northern Virginia. Each region has addressed the desegregation of public education in its own way. Correspondingly, seminal court cases (discussed below) were decided in each of the major metropolitan areas. Importantly, as noted further below, the educational disparities found in Virginia’s public schools are not disconnected from the larger racial disparities that plague the educational system nationwide. In order to understand how standardized testing disparities reflect larger issues in America’s schools, our analyses focus on the larger structural aspects of the schools themselves that influence students’ everyday lives in the classroom. We argue that the historical denial of equal educational opportunities to black Virginians has contributed to current educational inequality (standardized test scores are one example) in the Commonwealth.
The Test Score Gap and School Segregation in the United States
A great deal of research has documented black students’ lower reading and math standardized test scores as compared to their white peers (Jencks and Phillips 1998; Magnuson and Waldfogel 2008), while others discuss the ineptness of standardized testing to present accurate representations of learning and students’ knowledge, and predict future success, particularly in relation to the “ultimate” standardized test, the Scholastic Aptitude Test (SAT) (see Lemann 1999; Soares 2011, 2007; Zwick 2004, 2002). There is evidence that the test score gap appears before children enter school and widens as students move through the educational pipeline (Entwisle and Alexander 1993; Magnuson and Waldfogel 2008; Phillips, Crouse, and Ralph 1998).
Previous research indicates that state-level income inequality is related to children’s test scores. Higher income inequality is associated with lower test scores for children regardless of race (Magnuson and Waldfogel 2008). However, attending schools with more income inequality simultaneously raises white students’ test scores, while lowering black students’ scores (Campbell et al. 2008). Researchers argue that income inequality influences both family and school factors such as parental education (Berends and Penaloza 2008; Magnuson and Waldfogel 2008), school segregation (Vigdor and Ludwig 2008), and teacher quality (Corcoran and Evans 2008; Ladd 2008) which in turn affect student test scores.
School segregation is a contributing factor to the test score gap. Berends and Penaloza (2008) argue that the percentage of minority students in schools greatly increased between 1982 and 2004. The authors find that this increase is associated with students’ test scores in 12th grade. Despite the decline of residential segregation in the South (Iceland, Weinberg, and Steinmetz 2002), school desegregation has not kept pace (Clotfelter, Ladd, and Vigdor 2003; Reardon and Yun 2002-2003). This trend, which is also evident nationwide, may relate to parents’ attempts to secure the best opportunities for their children, which are often laced with racialized arguments for why their children may or may not receive certain advantages in school compared to others (see Johnson 2014; Lewis-McCoy 2014). Looking at the United States more broadly, Vigdor and Ludwig (2008) argue that the black–white test score gap would be narrower if schools desegregated more rapidly. In his case study of North Carolina, and Southern schools more broadly, Boger (2002–2003) argues that segregated schools are particularly detrimental to student achievement and test scores because they result in high poverty schools for black and Latino students. Boger asserts that the combination of high stakes accountability testing and resegregation of schools contributes to a “perfect storm” specifically in North Carolina. He contends that this storm could exacerbate white and middle-class flight as well as the flight of quality teachers from segregated schools (Boger 2002-2003). In fact, students from all racial–ethnic groups who attend high-poverty schools have lower academic achievement. The Coleman Report also concluded that the social background of the student body was the most important school-related factor in predicting achievement for students of color (Coleman et al. 1966). School segregation and school assignment policies are inextricably linked (Boger 2002-2003). Importantly, schools that seem racially and ethnically diverse may be more segregated in the actual classrooms as a result of tracking (Clotfelter 2004; Lucas 1999; Oakes 1985; Orfield and Eaton 1996; Tyson 2011). That is, the biased perceptions of students’ abilities result in black students being differentially placed in lower educational tracks, while white students are more often placed in more advanced courses and tracks even within racially diverse schools.
In the following sections, we discuss Virginia’s efforts to create and maintain unequal educational opportunities historically and in the contemporary era. We compare and contrast the responses to school desegregation in Northern Virginia, Norfolk-Hampton Roads, and the Richmond metropolitan areas. We highlight how these efforts are both similar to and different than contemporaneous developments in the South and in the United States as a whole.
Creating and Maintaining Educational Inequality in Virginia
Similar to many Southern states, Virginia witnessed the establishment of a highly segregated and resource-poor system of schools for black communities, while whites received an inordinate amount of privileging in many ways beyond economic resources to advantage their children. The Virginia Constitution was adopted in 1869 and it mandated the creation of free public schools in every county for all children aged 5 to 21. The system of universal free education for whites and blacks was established concurrently (Alexander 1943). Virginia was one of the first states to have state-structured segregated schools during Reconstruction. Following Reconstruction and the Plessy v. Ferguson decision, large and growing disparities between black and white schools (in public funding, teacher salary, and days of instruction) appeared (Hill 1985; Williams 2005). The consequences of this denial of equal educational opportunity to the black residents of Virginia are still being felt today.
Early Era of Segregated Educational Opportunities
The Constitution of 1902 shifted the responsibility for maintaining free public schools from local authorities to the state and a secondary school system was added in 1906 (Alexander 1943). Virginia’s public school system allowed black children to attend schools between 1900 and 1935, mirroring similar Southern states. However, black children did not begin to leave agricultural labor in large numbers until after 1910 as a result of black migration from rural areas to cities (Anderson 1988). During this time, philanthropic funds such as the Slater, Jeanes, and Rosenwald Funds collaborated with the quickly forming state departments of education to emphasize industrial education for black students to secure whites’ privileged position in both educational and economic sectors of society, while limiting the social mobility of blacks (Anderson 1988). Although the Rosenwald program is often seen as a monumental success and buoyed the development of educational opportunities for blacks in the South, this program actually undercut the economic well-being of the black communities committed to these schools as most schools often received 15 percent or less of their total funds from the philanthropic fund (Anderson 1988). Most of the funding for these schools was provided by black community members, often signing land over to the state to build a school for their children. Black communities also had to continuously pay for the upkeep of the school, while schools for white children were supported by state funds. In many cases, black communities were forced into providing funds for industrial schools that tracked children into low-paying, subservient occupations after school, or not having formal educational opportunities at all. As 75 percent of Virginia counties had a Rosenwald school located in their areas, the detrimental impact of relying on schools with limited curricula and on the already resource-poor black communities is evident. These educational opportunities ultimately limited the possibility for future generations in the black community to obtain credentials and education to move out of low-status and low-paying occupations, buffering whites from any serious competition for better-paying jobs in the communities. During this era, only four public high schools existed for black Virginians (Du Bois 1911). Thus, the emphasis on industrial education by the well-funded philanthropies undercut the academic training of black Virginians. However, the damage to black educational progress and economic mobility was done by 1935, when industrial schools were quickly phased out in states across the South, including Virginia (Anderson 1988).
Anderson (1988) contends that blacks suffered “double taxation” and were essentially accommodating southern oppression (p. 156). The taxes they paid were used to fund white schools and county school boards repeatedly claimed that there was little to no money available to support black schools. As a result, blacks made private donations to build and support black “public” schools. To make matters worse, blacks had to deed their contributions to the state in order to receive any public funding. Black residents’ “self-help” efforts also included donating their time, land, labor, and building materials to help build rural schools (Williams 2005).
In addition to educational inequality by race, disparities were evident when comparing county and city schools. City schools tended to provide better educational opportunities, but approximately 75 percent of black children attended county schools. Thus, on average, black students during this era enrolled in schools with less qualified teachers, resources, and funding than those in city school districts. During academic year 1938–1939, approximately 65 percent of counties in Virginia with black students spent no local money for black instruction, yet independent cities spent more than their state allotment on instruction (Alexander 1943).
In an examination of Virginia schools in 1938 and 1939, Alexander (1943) noted that 40 percent of black children had little, if any, meaningful contact with schools despite the compulsory attendance law which required children 7 to 15 years old living within two miles of a school or one and one-half miles from a bus to attend. This problem was exacerbated in counties where transportation was an issue, especially among black students. The situation was even graver in high schools where less than a quarter of black students were enrolled and a large portion dropped out before graduation. In his research, Alexander (1943) found that the primary reasons given for dropout were the failure of the school to address students’ needs and economic disadvantage.
Black educators increasingly challenged the discernable differences in black students’ educational facilities and opportunities compared to their white peers. In 1933, the Virginia State Teachers Association (VTA), which was comprised of black educators native to Virginia, began to press for the equalization of black and white schools’ facilities and funding as well as teachers’ salaries (Picott 1975). Between 1926 and 1939, educational facilities for blacks were greatly improved. Beginning in 1942, new teachers were required to hold a bachelor’s degree although black teachers were often less likely to have such degrees (Alexander 1943).
The Battle for Desegregation and Equal Schools in Virginia
On May 17, 1954, the U.S. Supreme Court unanimously decided that de jure segregation in public schools was unconstitutional because it violated the 14th Amendment right to equal protection under the law overturning the court’s 1896 “separate but equal” ruling in Plessy v. Ferguson . On May 31, 1955, the court ordered that public schools desegregate “with all deliberate speed” (Brown v. Board of Education of Topeka, Kansas 1955). In this case, commonly known as Brown II, the Supreme Court placed the responsibility of implementing desegregation plans with local school authorities. Local courts were charged with overseeing this “good faith implementation” ( Brown v. Board of Education of Topeka, Kansas 1955). Important to both of these cases was the battleground in Prince Edward County, Virginia (Bonastia 2009). The disregard for black students’ educational facilities and opportunities led to a walkout in 1951 followed by a lawsuit filed on behalf of the community (Dorothy E. Davis et al. v. County School Board of Prince Edward County, Virginia et al.) that was folded into the larger Brown case.
Despite these decisions, Virginia led the way in massive white resistance to integrating public schools (Bonastia 2009). In 1955, a state legislative commission report known as the Gray Plan suggested using tuition grants financed from public money to allow whites to send their children to private schools and changing student assignment plans and the compulsory attendance law to resist integrated schools. The recommendations were approved the following year by the legislature (Doyle 2005). Several important leaders, most prominently Richmond News Leader editor James Kilpatrick, advocated for the theory of interposition which argued “… that a state could protect its citizens by nullifying unconstitutional decisions of the federal courts” (Lassiter and Lewis 1998:7). In 1956, Virginia Senator Harry Byrd helped create the Southern Manifesto whereby 101 Southern congressmen vowed to thwart school integration by “massive resistance” (Lassiter and Lewis 1998). In August and September 1956, the Virginia General Assembly took even more radical measures by passing laws that suspended state funding to integrated schools and closed schools that admitted black and white students (Thorndike 1998). Governor Thomas Stanley was a strong supporter of these measures and the final package of massive resistance laws became known as the Stanley Plan. As part of the plan, the governor would appoint a Pupil Placement Board that would approve the assignments and transfers for all public school students. In practice, board members never sent black students to white schools (Pratt 1992).
Black students and their families soon filed suit in Norfolk to enter white public schools and a federal district court ruled in their favor (Doyle 2005). However, the school district would not admit any black students to white schools until 1958 (Doyle 2005). That fall 1958 Governor Lindsay Almond Jr. closed nine schools in Charlottesville, Warren County, and Norfolk in order to avoid desegregation (Bonastia 2009). White students in Charlottesville and Warren County soon attended private schools or were homeschooled but no adequate substitute existed in Norfolk. The schools remained closed for five months, affecting approximately 10,000 white students. This group is known as “The Lost Class of ‘59” (Doyle 2005:67). In January 1959, state and federal courts (James v. Almond and Harrison v. Day; see Doyle 2005) voided statutes intended to thwart desegregation. In February, six schools in Norfolk and one in Arlington County integrated (Bonastia 2009).
Prince Edward County schools’ court-imposed desegregation deadline was September 1959 (Bonastia 2009). However, the county began planning for private schools for whites shortly after Brown II in 1955. The Prince Edward County Board of Supervisors refused to fund public schools for the 1959–1960 school year, and schools remained closed until the Supreme Court prohibited school closings to avert desegregation in 1964 ( Griffin et al. v. County School Board of Prince Edward County et al. 1964). The overwhelming majority of white students attended private Prince Edward Academy which opened in the fall of 1959. State tuition grants were used to offset parents’ tuition costs. Even after public schools opened in 1964, only small numbers of white students attended (Bonastia 2012). “Though enrollment in the county’s public and private schools were expected to be roughly equal {in the 1964-65 school year}, the supervisors appropriated nearly twice as much money for local tuition grants (which would be used by whites) as for the public schools, expected to be overwhelmingly black” (Bonastia 2012:185).
Several scholars have argued that Prince Edward County’s largely nonviolent approach to maintaining school segregation was representative of the Commonwealth of Virginia’s larger strategy (Bonastia 2012; Lassiter and Lewis 1998). Bonastia (2012) argues that Prince Edward County whites’ beliefs that taxes should aid citizens who paid the most, that segregation could be rationalized without discussing race, and that the state should support private schools foreshadowed color-blind conservative arguments which became popular nationwide in the 1960s and 1970s. Many black students who stayed in Prince Edward during the school closures never resumed their formal education (Bonastia 2012).
However, not all Virginia school districts applied Prince Edward County’s approach to segregation and desegregation. Across the state, white Virginians used a variety of different strategies (such as private school tuition subsidies, student assignment laws, freedom of choice plans, and continuous legal deferments) at different points in time to keep black and white students separate (Lassiter and Lewis 1998). Virginia was again thrust into the national spotlight in 1968, when the U.S. Supreme Court explicitly addressed criteria a school district had to implement in order to be declared “unitary”: no racial disparities in the composition of the student body, faculty, staff, transportation, extracurricular activities, and facilities ( Green v. County School Board of New Kent County 1968). The justices ruled that “freedom-of-choice” plans were unconstitutional if black and white students remained largely in separate schools. The court also charged local school boards with devising realistic plans to end segregation immediately (Pratt 1992). The Supreme Court ruling in Swann v. Charlotte-Mecklenburg provided for busing as a means to promote school desegregation ( Swann v. Charlotte-Mecklenburg, North Carolina, Board of Regents 1971). The ruling came two weeks after a U.S. District Court mandated busing in Richmond (Pratt 1992). As a result of busing (and mandatory student assignments), desegregation was finally achieved in Norfolk. In 1975, Norfolk was declared a “unitary school district” and federal supervision terminated (Beckett v. School Board of Norfolk 1956–1975, Doyle 2005). Norfolk’s school system was the first to be designated unitary in the United States (Siegel-Hawley et al. 2013).
In The Color of Their Skin: Education and Race in Richmond, Virginia, 1954–89, Pratt argues that “… Richmond’s ‘passive’ resistance succeeded where Virginia’s ‘massive resistance’ failed” (1992: xi). Most white Richmond residents tolerated token integration. However, when a school’s student body neared 40 percent black, white students began to leave the school (Pratt 1992). In 1970, the Richmond school board submitted three desegregation plans to the district court. While operating under the interim desegregation plan, large numbers of white students began missing school (Pratt 1992). White parents employed several strategies to maintain this absenteeism. These included moving their children in with relatives in nearby counties, renting apartments or using fake addresses outside of Richmond, and sending their children to private school (Pratt 1992). “On April 5, 1971 … Judge Merhige ordered into effect a new desegregation plan, later affirmed by the Supreme Court, that provided for pupil and faculty reassignments and free citywide transportation” (Pratt 1992: 54). The plan required that school racial compositions reflect the proportion of white to black students in the school system as a whole. Because of the high degree of residential segregation in Richmond, this would be achieved through busing (Pratt 1992).
In 1973, the U.S. Supreme Court heard its first case ( Richmond School Board v. Virginia State Board of Education 1973) concerning the attempted consolidation of a city’s schools (Richmond) with adjacent schools in suburban counties (Henrico and Chesterfield) in order to achieve racially integrated schools (Pratt 1992). Due to the Supreme Court’s split decision the school districts were not combined. The issue was laid to rest in 1974, when the justices ruled that Detroit’s public schools could not be consolidated with surrounding suburban schools ( Milliken v. Bradley 1974). Pratt (1992) refers to this decision as “… the first defeat for desegregation since Brown …” (p. 83). This decision certainly did nothing to discourage white residents from leaving Richmond for the suburbs.
Pratt (1992) argues that “white flight” began in the 1940s but likely accelerated as a result of busing. Middle class whites (and wealthy blacks) were especially likely to move to the suburbs. This resulted in a loss of educational resources for Richmond public schools and a corresponding decline in academic performance (Pratt 1992). For example, in the 1988–1989 school year, the failure rate, and the dropout rate were higher in Richmond than Henrico and Chesterfield counties (Pratt 1992). Richmond’s public schools became overwhelmingly black and/or poor and private schools were largely white and/or wealthy (Pratt 1992). In April 1986, district court Judge Merhige approved a neighborhood-school plan that ended busing, and court oversight of the Richmond school system ended the same year (Siegel-Hawley et al. 2013). Also in 1986, Richmond’s school board and some parents sued Virginia to request a program that would alleviate what the board called “lingering vestiges of past state-mandated racial segregation” (Pratt 1992:96), but the case (Bradley v. Baliles 1986, 1987) was ultimately dismissed.
The Norfolk metropolitan area is also important for our analysis, given its large proportion of black residents. Norfolk was facing similar problems as Richmond in the late 1970s. In addition to conflicts over busing, discipline problems and standardized test failure rates were a primary concern (Littlejohn and Ford 2012). The city had the highest dropout rate in Virginia. As in Richmond, middle-class and white parents left the city’s schools in large numbers and many residents began to call for a return to neighborhood schools. In February 1983, the Norfolk school board voted to end busing for elementary students. This decision was not implemented until the Riddick v. School Board of the City of Norfolk case in 1986—“… which was the first federal court decision to allow a school district to end busing for desegregation” (Littlejohn and Ford 2012:192). Busing ended six months later, which resulted in 10 all black elementary schools in Norfolk (Littlejohn and Ford 2012). The city’s schools remained highly segregated through the end of the twentieth century into the current era (Doyle 2005).
Deepening Inequality in Virginia
The above history points to the persistent racial inequalities that plague the decisions and realities of Virginia’s public schools. Approximately 16 percent of black students in Virginia in 2010 attended schools where white students were less than 10 percent of student body enrollment (Siegel-Hawley et al. 2013). The average black student attends schools where almost 47 percent of their peers are black. White students attend schools with approximately 66 percent same-race peers. This is noteworthy, given that Virginia’s public schools are approximately 24 percent black and 50 percent white (Siegel-Hawley et al. 2013). There is also clear evidence of a link between racial isolation and concentrated poverty. Approximately 76 percent of students attending schools where 90 percent or more of the student body were students of color are classified as low income. The share of low-income students rose to approximately 86 percent in schools that were 99 percent to 100 percent students of color (Siegel-Hawley et al. 2013).
Examining specific metropolitan districts, Northern Virginia public schools are the most racially diverse in the state. In Norfolk-Virginia Beach-Newport News, which is located in the Southeastern portion of the state adjacent to the Atlantic Ocean, the proportion of black students attending schools where 90 percent or more of the student body are minority students almost doubled between 1989 and 2010 (Siegel-Hawley et al. 2013). This trend is steeper in this metropolitan area than seen across Virginia as a whole (Siegel-Hawley et al. 2013). It is no wonder that Littlejohn and Ford (2012) contend that Norfolk schools are more segregated today than they have been since 1970. As in most of the nation, students of color in the Richmond-Petersburg metropolitan area began attending suburban schools at a higher rate between 1989 and 2010 (Siegel-Hawley et al. 2013). When compared to the other two major metropolitan areas in Virginia (Norfolk-Virginia Beach-Newport News and Northern Virginia), Richmond-Petersburg has a substantially higher share of students enrolled in schools that are 90 percent or more students of color (Siegel-Hawley et al. 2013). In the wake of Brown, much of the segregation in the Richmond-Petersburg metropolitan area occurred between districts; for example (as discussed earlier) between Richmond, Henrico, and Chesterfield (Siegel-Hawley et al. 2013). However, in recent years, segregation has been comparable across and within districts. This trend also holds for Norfolk-Virginia Beach-Newport News and Northern Virginia (Siegel-Hawley et al. 2013).
Similar to schools nationwide, Virginia’s schools are becoming more racially segregated as we progress through the first decades of the twenty-first century (Orfield, Kucsera, and Siegel-Hawley 2012). Segregated schools often have less per-pupil funding, fewer educational and extracurricular resources and opportunities, and extremely low graduation rates and academic performance levels (Kozol 2005, 1991). These issues have led some scholars to posit that black students may not value education and that they view schooling as more appropriate for white children but not for themselves (see Fordham and Ogbu 1986). However, as Harris (2011) and Tyson (2011) find in their studies, black students value education more than their white peers, do not want to fail, and are often subject to a structure of schooling that gives them little opportunity to achieve, or tracks them out of advanced courses that prepare them for college.
Contemporary Educational Inequality in Virginia
The 100-plus years of segregated and resource-depleted schools that most black students in Virginia attended serves as the foundation for understanding the racial disparities in schools today, particularly when examining test score gaps. In this section, we describe Virginia’s public school composition and discuss disparities in high school graduation rates. Next, we discuss community and school characteristics which are associated with academic achievement such as income, racial composition, student–teacher ratio, teacher quality, and school funding. We then summarize the test scores on the Standards of Learning (SOL) tests in reading, writing, history and social science, mathematics, and science. Finally, we end our data analysis with a comparison of black students’ failure rates across the major metropolitan areas in Virginia.
Data from the decennial census from 1940 to 2009 and the American Community Survey (ACS) conducted by the Census Bureau were used to examine the educational attainment levels of black and white Virginians. From 1940 to 2009, the percentage of white Virginians with a high school diploma increased from 26 percent to 88.7 percent. Black Virginians also experienced dramatic growth over this time period with a nearly 73 percentage point increase in high school diploma attainment. White Virginians experienced significant increases in bachelor’s degree attainment as well, going from only 5.4 percent of the group having a college degree in 1940 to 36.7 percent in 2009. The percentage of black Virginians with a college degree increased from 1.3 percent in 1940 to 18 percent in 2009. As noted earlier, the restriction of education for blacks in the South and many other areas of the United States influenced their educational attainment throughout the twentieth century. Recall that in Virginia, and throughout the South, black students did not have widespread access to public high schools until about 40 years after their white counterparts (Anderson 1988). However, there is still a roughly 10 percent gap in high school completion between black and white Virginians despite universal access to public education. More disturbingly, however, is the large gap that exists in college degree attainment, a nearly 20 percent difference found in Census data noted above.
Public Education Characteristics
To examine public education characteristics in Virginia, data were collected from the National Center for Education Statistics and the Virginia Department of Education. As seen in Figure 1, 55.2 percent of all public school students in Virginia were white and 25.4 percent were black in 2009. Black students continue to be the largest racial–ethnic minority group in Virginia (Siegel-Hawley et al. 2013). The racial disparity reflecting who is identified as “gifted” compared to being a “disciplinary problem” is also present in Virginia’s schools: white students accounted for 67.0 percent of all gifted students in the public school system, while black students only accounted for 12.1 percent of identified gifted students echoing similar disparities in gifted placement nationwide (Ferguson 2001; Irvine 1990; Lewis 2003; Staiger 2004; Tyson 2011). In Virginia, 13.9 percent of all black students had either been suspended or expelled in 2009 compared to only 4.7 percent of white students (Figure 1). These trends privileging white students and disciplining black students further exacerbate test score gaps, driving educational and employment opportunities. They also promote the stereotype that white students are following the rules of American society, while black students are consistently breaking them.

Virginia K–12 characteristics, 2009. Note: Data originate from the Virginia Department of Education; suspended or expelled student percentage originates from 2009 National Center for Education Statistics Digest of Education Statistics. K–12 = kindergarten through 12th grade.
Examining the high school class of 2009 in Virginia (Figure 2), 87.0 percent of all white students and 75.7 percent of all black students graduated with their high school diploma on time. Approximately 3.4 percent of black students and 4.0 percent of white students expected to graduate in 2009 earned their general equivalency diploma (GED). Two numbers are especially troubling in the statistics for the class of 2009. First, 11.3 percent of all black students expected to graduate in 2009 had dropped out of school at some point in time compared to only 5.6 percent of white students. Second, 3.4 percent of black students and 1.2 percent of white students had an “unconfirmed status,” meaning officials in the public school system did not know exactly where these students were in their educational progress. For black students then, 14.7 percent of students “fall through the cracks” while pursuing high school graduation in the Virginia public school system; meaning the public school system does not know if these students have transferred to schools out of state, have pursued private educational opportunities, or dropped out of school completely, among other possibilities.
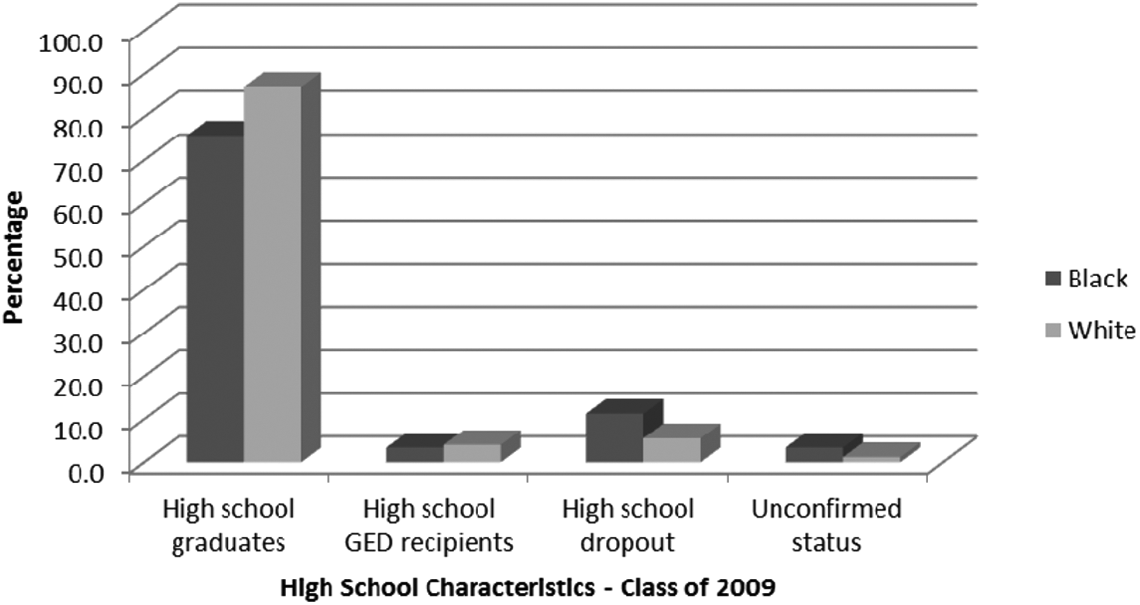
Virginia high school population characteristics, class of 2009. Note: Data originate from the Virginia Department of Education.
An examination of the racial composition of the school districts in Virginia points to the continuing racial inequality in the state. Virginia has 132 school districts with an average district enrollment of 25 percent black students. The historical battlegrounds for educational equality have taken place throughout Virginia but have often centered in the traditional urban centers around Richmond and the Tidewater region that encompasses such cities as Norfolk and Virginia Beach. Additionally, a large proportion of the state’s black population lives in the few metropolitan areas that cover the northern and eastern portions of the state. Thus, understanding the educational disparities in Virginia is to avoid the traditional urban–suburban approach to analysis and rather use a sociohistorical approach that identifies regions within the state that have had different experiences as racial battlegrounds (or not) for educational equality. With this in mind, Table 1 presents our examination of how several community and school characteristics relate to different educational environments that frame educational disparities across Virginia. Each column represents a specific locale. The first column contains the means for the Virginia school districts that are not located in specified metropolitan statistical areas (MSAs) by the Census Bureau. The remaining columns contain the means for school districts located within the three MSAs of the state, which include the Northern Virginia section of the Washington, D.C.–Baltimore MSA, the Greater Richmond MSA, and the Norfolk-Hampton Roads MSA. The Northern Virginia MSA represents a rapidly growing, fairly racially diverse area that is a more recent development in the post–civil rights era, while the Greater Richmond and Norfolk-Hampton Roads MSAs developed during the colonial era and were the key battleground areas for civil rights efforts as well as white resistance to these efforts, specifically around educational equality.
Community and School Characteristics across Metropolitan Areas in Virginia, 2010.

Note: Community characteristics drawn from the Census Bureau’s American Community Surveys 2008–2010; school characteristics were collected from the Virginia Department of Education’s school division reports; school segregation level is as follows: (1) less than 25 percent black student composition, (2) between 25 percent and 50 percent black student composition, and (3) 50 percent or more black student composition. AYP = adequate yearly progress; MSAs = metropolitan statistical areas; Kind.–7th = Kindergarten through 7th grade.
aSignificant difference (p < .05) between school divisions in rural Virginia and Northern Virginia section of the Washington, D.C.–Baltimore MSA.
bSignificant difference (p < .05) between school divisions in rural Virginia and Richmond MSA.
cSignificant difference (p < .05) between school divisions in rural Virginia and Hampton Roads MSA.
dSignificant difference (p < .05) between school divisions in Northern Virginia section of the Washington, D.C.–Baltimore MSA and the Richmond MSA.
eSignificant difference (p < .05) between school divisions in Northern Virginia section of the Washington, D.C.–Baltimore MSA and Hampton Roads MSA.
fSignificant difference (p < .05) between school divisions in Richmond MSA and Hampton Roads MSA.
In relation to the community characteristics of the school districts that span the four locales compared in the table, one stark set of differences exists for the incomes of black and white families. Black families consistently make approximately between US$14,000 and US$20,000 less than their white counterparts regardless of which area of the state is compared. Moreover, the incomes of both black and white families vary across locale with families in the Northern Virginia MSA, making dramatically more than families in other areas of the state, particularly those families not located in metropolitan areas. Unemployment rates of these locales also have slight variations with school districts located in the Northern Virginia MSA having the lowest rate. Significant differences in the percentage of black residents in school districts were found when comparing nonmetro Virginia with the Greater Richmond and Norfolk-Hampton Roads MSAs, which have historically had higher black populations than other locales in the state.
Turning to the school characteristics of each locale, several findings are worth mentioning. School districts in the Norfolk-Hampton Roads MSA have higher teacher to pupil ratios for grades 8–12 than other areas of the state, particularly when compared to nonmetro Virginia districts and those in the Greater Richmond MSA. Norfolk-Hampton Roads MSA districts were also found to have the smallest average of provisionally licensed teachers in the state. Northern Virginia MSA districts have much higher teacher salaries than other areas of the state, and those districts in nonmetro districts had the lowest salaries. Although the districts varied greatly in the total amount of funds provided to the districts from the Commonwealth, the important manifestation of these differences is found in the per-pupil funding as nonmetro districts had the highest levels of funding, while the Northern Virginia MSA had the lowest. Disconcertingly, all districts regardless of locale had low averages of schools that met adequate yearly progress (AYP) as measured by the standardized tests (discussed further below), with districts in the Greater Richmond and Hampton Roads MSAs averaging no schools meeting these state-mandated goals. School districts varied in composition and size across Virginia locales with the highest white student composition found among nonmetro districts averaging 71.55 percent, which was significantly different than the metropolitan areas in the state. Additionally, districts in the Northern Virginia MSA had much lower black student populations than districts throughout the remainder of the state. Lastly, and expectedly, nonmetro school districts were much smaller than metropolitan districts.
Standardized Test Results
We have described the public school population in Virginia including gifted and special education, discussed black–white differences in high school graduation, and have compared relevant community and school characteristics across major metropolitan areas. Next, we examine the black–white disparities in standardized test scores and their association with metropolitan area. In the NCLB era, public school systems around the country use standardized tests to measure the progress of students at various grade levels. These tests, in turn, are used by state education boards to monitor the quality of education provided by school divisions. In Virginia, AYP for each school and school division is identified using the test results of the Virginia Department of Education’s standardized test, the SOL. The SOL subject tests cover multiple grade levels spanning elementary, middle, and high school. Students are given one of three general ratings on these tests: fail, pass with a proficient score, or pass with an advanced score. There are varying cutoff scores for each grade level and subject area, and results are available on the Virginia Department of Education’s website. In Virginia, students must pass both the course and the end-of-course standardized test to move on to the next course for that particular subject area. If a student fails a test twice but is within 25 points of the cutoff score, local schools and school boards can award a “verified credit” following a review of the student’s course work and mastery of the subject area so that the student can proceed to the next course in the subject area (see Virginia Department of Education 2012 for more information).
Using the testing data from the Virginia Department of Education, the Virginia Tech Center for Race and Social Policy Research has created an educational equality index, similar to the larger equality index created by the National Urban League (see Byrd 2011). Each index score was created by dividing the black percentage for each standardized testing measure by the corresponding white percentage. Therefore, scores above 1.0 indicate that black students are more likely than white students to achieve a certain standardized testing result, while scores below 1.0 indicate the reverse. In this study, we describe the general trends found among black and white students who completed the SOL subject tests in 2010. Figures 3 –7 present the line graphs that follow the equality of performance by black and white students in Virginia across grade levels and SOL subject areas.
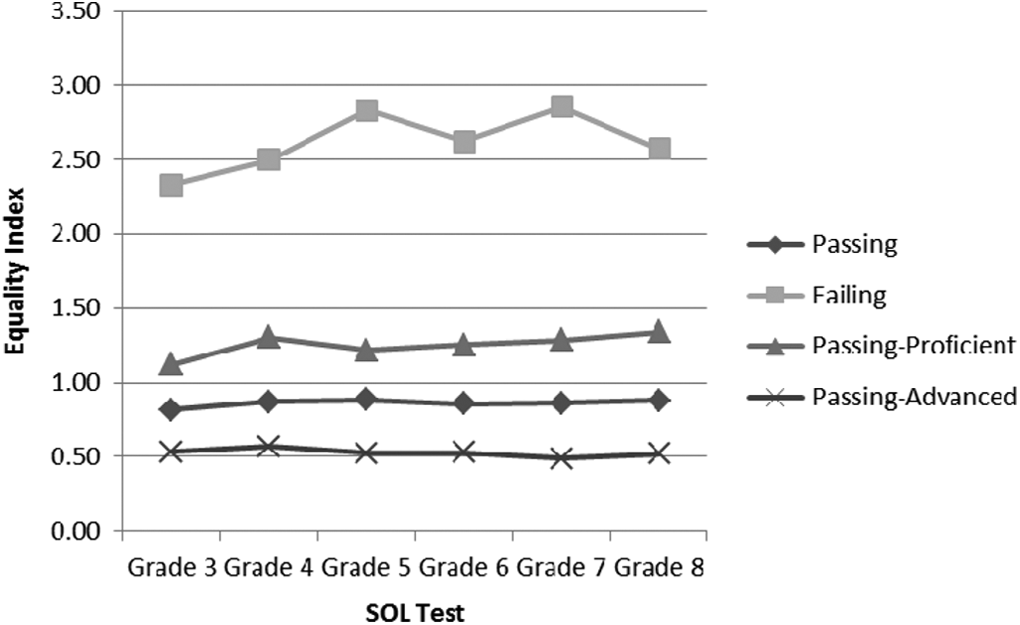
SOL reading equality index, 2010. Note: Data originate from the Virginia Department of Education. SOL = Standards of Learning.
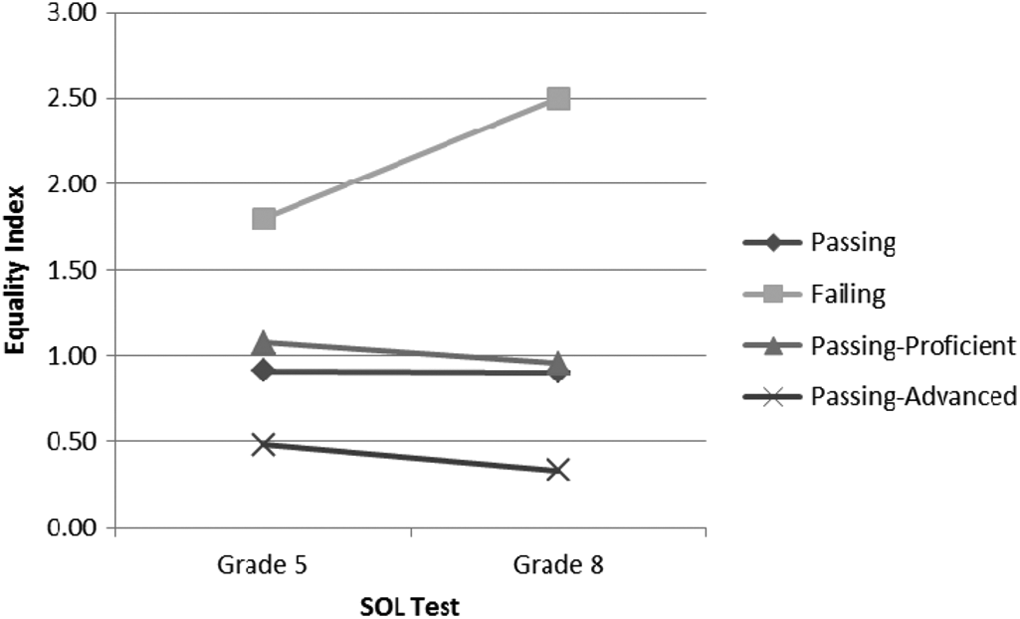
SOL writing equality index, 2010. Note: Data originate from the Virginia Department of Education. SOL = Standards of Learning.

SOL history and social science equality index, 2010. Note: Data originate from the Virginia Department of Education. SOL = Standards of Learning.

SOL mathematics equality index, 2010. Note: Data originate from the Virginia Department of Education. SOL = Standards of Learning.
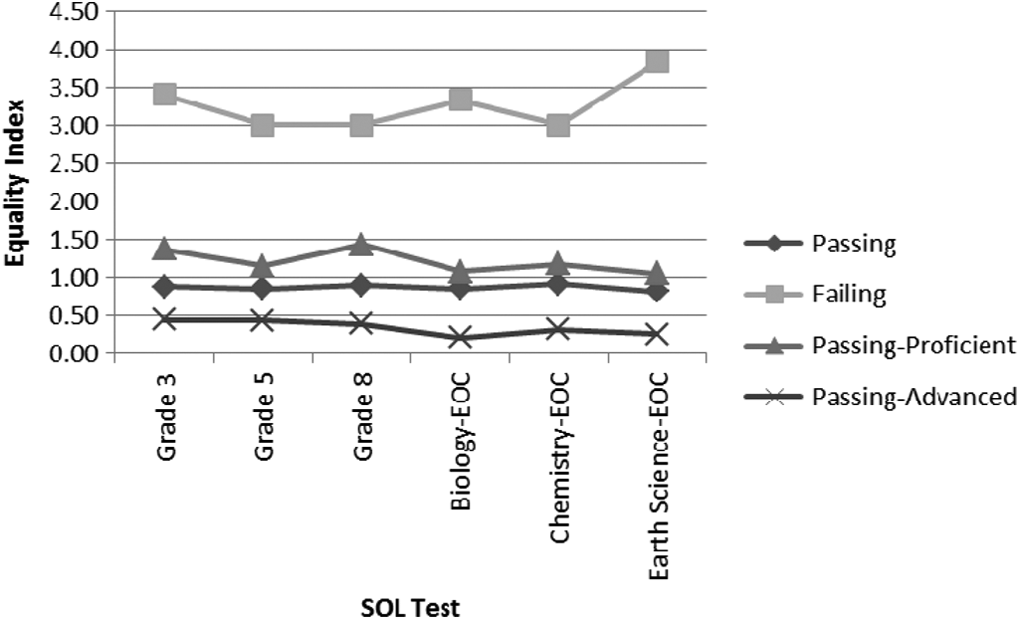
SOL science equality index, 2010. Note: Data originate from the Virginia Department of Education. SOL = Standards of Learning.
Although each data point is of interest regarding the black–white comparison of students’ test results, the patterns are what are of importance for our discussion. In elementary school, Virginia students complete SOL subject tests in reading, history, and mathematics in third, fourth, and fifth grades. In third and fifth grade, students also complete subject tests in science, and in fifth grade students complete a writing subject test. Virginia middle school students complete SOL tests in the subject areas of reading, history, and mathematics in sixth, seventh, and eighth grades. In eighth grade, students also complete SOL tests in the areas of writing and science. In high school, Virginia’s students completed various SOL tests in each grade in history and social science, mathematics, and science. Black students were more likely to fail each of these tests compared to their white peers but were frequently as likely to pass with a proficient score if they did pass the tests. On the SOL history tests, throughout most of elementary school, black students performed on par with, if not slightly better than, their white peers. However, once students entered middle school, black students failed history tests at the same rate as the other subject tests. Across all of these tests and grade levels, black students are less likely than their white peers to pass a test with an advanced score. These figures present a disconcerting picture of the testing patterns among black and white students in Virginia schools as these standardized tests can significantly impact their educational, and later their economic, futures.
In order to try and identify if these patterns found across the state are driven by locale-specific patterns, Table 2 presents the comparisons of black students’ failure rates on the different subject tests at each tested grade level. Little variation exists across the different state locales, but a few notable differences exist that indicate how black students in Virginia perform on these standardized tests may be a result of the specific sociohistorical contexts that surround their educational experiences. Black students in the Norfolk-Hampton Roads MSA school districts had much lower failure rates on the writing SOL tests in fifth grade as well as high school, particularly in comparison to black students in nonmetro school districts. The dramatic rise in black students failing history SOL tests in high school appears to be driven by the Northern Virginia school districts as their failure rates were much higher on these tests than in other areas of the state. Lastly, there are significant differences between the Greater Richmond MSA districts’ failure rates for black students on the fifth grade science and chemistry tests compared to Northern Virginia MSA districts as those Richmond districts have lower rates.
Black Student Failure Rates on Standards of Learning (SOL) Tests, 2010.
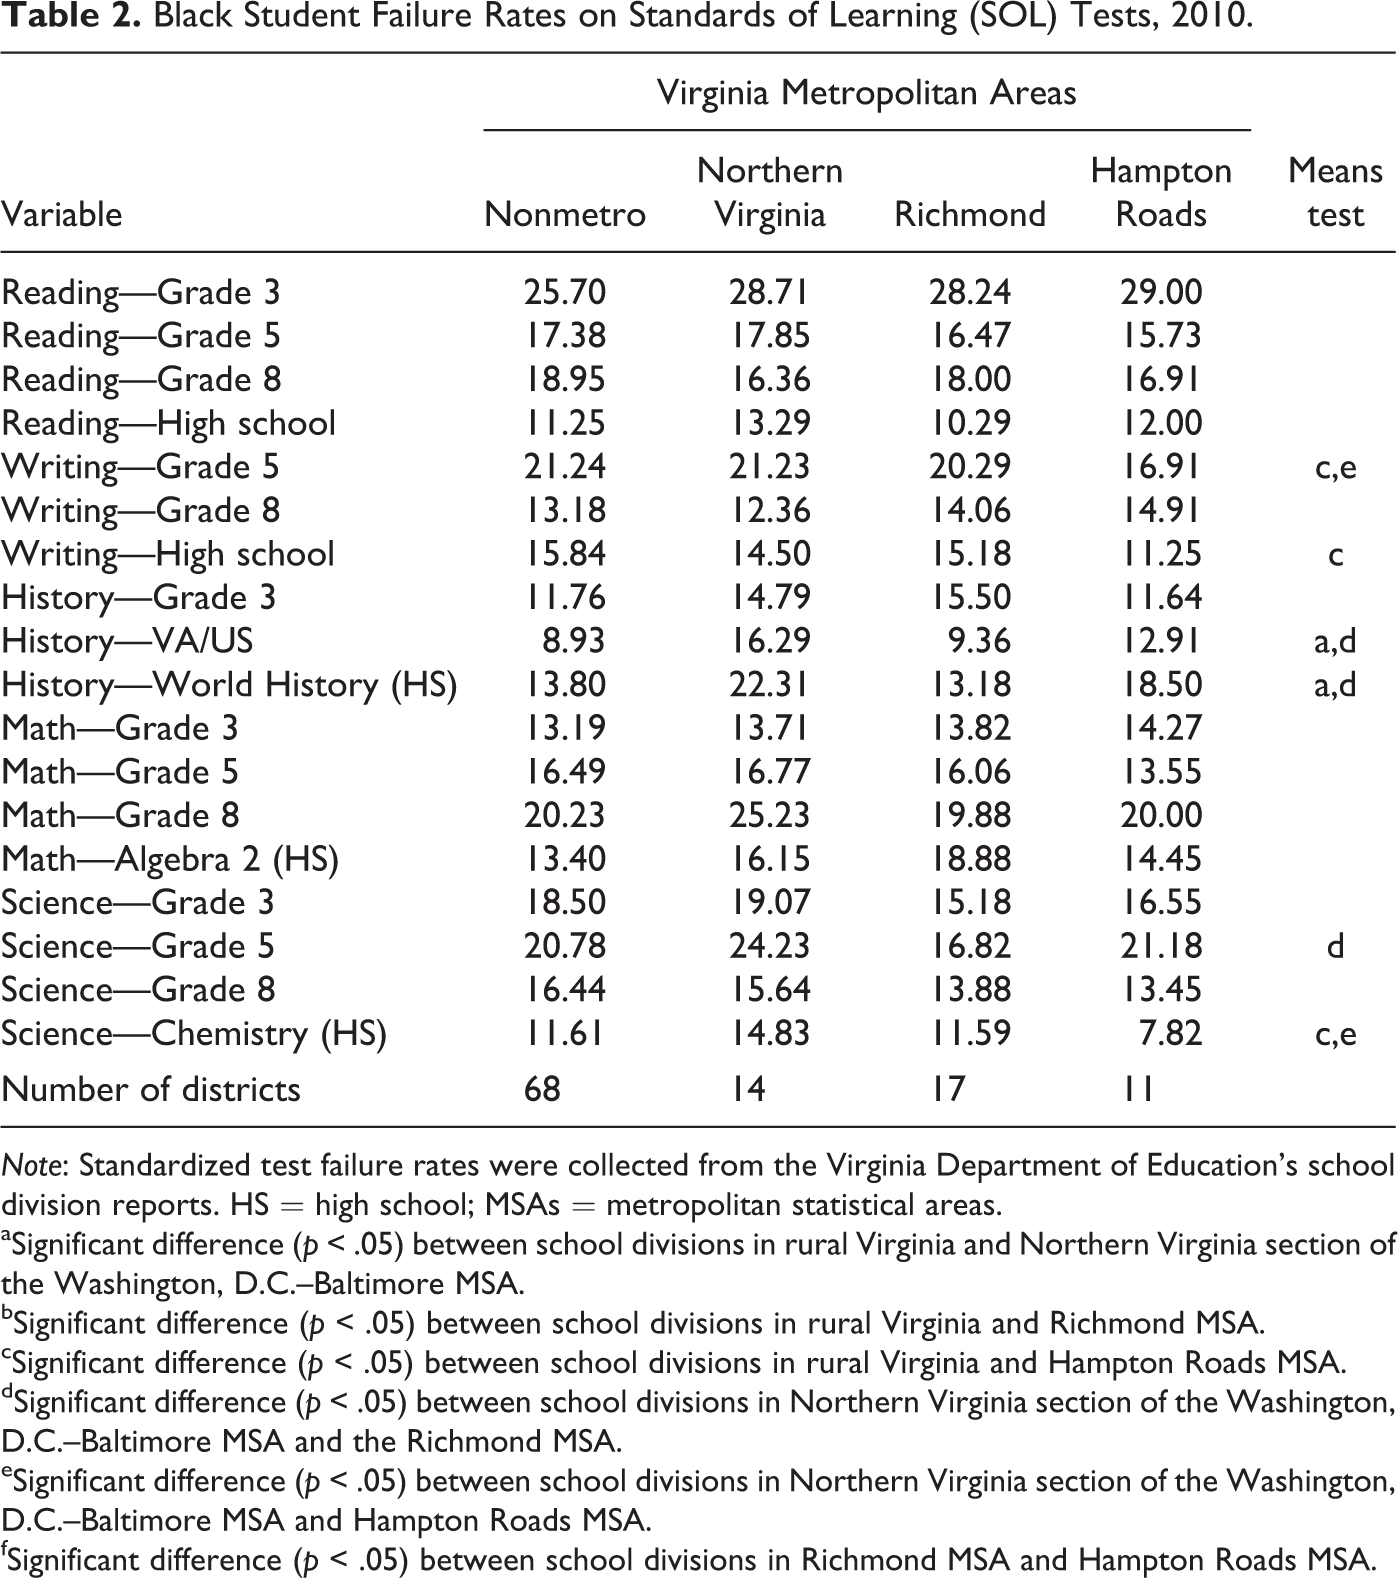
Note: Standardized test failure rates were collected from the Virginia Department of Education’s school division reports. HS = high school; MSAs = metropolitan statistical areas.
aSignificant difference (p < .05) between school divisions in rural Virginia and Northern Virginia section of the Washington, D.C.–Baltimore MSA.
bSignificant difference (p < .05) between school divisions in rural Virginia and Richmond MSA.
cSignificant difference (p < .05) between school divisions in rural Virginia and Hampton Roads MSA.
dSignificant difference (p < .05) between school divisions in Northern Virginia section of the Washington, D.C.–Baltimore MSA and the Richmond MSA.
eSignificant difference (p < .05) between school divisions in Northern Virginia section of the Washington, D.C.–Baltimore MSA and Hampton Roads MSA.
fSignificant difference (p < .05) between school divisions in Richmond MSA and Hampton Roads MSA.
Although these brief examinations of the variations in Virginia’s public schools by their locale and the failure rates of black students on particular standardized tests administered by the state may spark more questions than answers at this point, what is certain is the educational environments that Virginia students experience are starkly different from one locale to the next. Moreover, these differences are arguably anchored by their places in history and recent eras. In the final section of this study, we discuss the implications of these findings for understanding the history of Virginia’s continuing battle for educational equality and the possible future research and policy implications that are garnered from our examination of these school districts across the state.
Discussion
In this article, we have discussed disparities between black and white Virginians in the K–12 public school system. These disparities are evident both in the present and throughout the history of the Commonwealth. In this section, we recap our main findings and discuss the possible policy solutions.
Our analyses highlight black–white standardized test score disparities in Virginia’s public schools that reflect common racial inequalities in education nationwide. With the exception of black students’ performance in history and social science during elementary and middle school, these students consistently fall behind white students in all subject areas at each grade level. The importance of the problem cannot be overstated. As Jencks and Phillips (1998) assert, “… if racial equality is America’s goal, reducing the black–white test score gap would probably do more to promote this goal than any other strategy that commands broad political support” (p. 3–4). Virginia schools and school districts are measured for AYP by the percentage of all students passing SOL tests in separate subject areas. However, this measure allows for the racial inequality in pass rates on these tests to persist without much consideration. As our analyses show, less than 1 percent of schools in Norfolk and Richmond met AYP goals in 2010. This is even more problematic for our student population of interest because these metropolitan areas have a significantly larger proportion of black students than other parts of the state. Recent discussions have explored establishing different pass rates for racial and ethnic student groups, but these discussions have yet to result in any changes to how students are graded on their state standardized tests. The rumored proposals, however, would encourage lower pass rates for black as well as Hispanic and Latino students, which could further exacerbate educational inequality in the state as students would be held to lower expectations that could spill over into many aspects of their educational experience.
The above discussion leads to clarifying one of our study’s major limitations, which shed light on the difficulty of understanding the complete relationship between the policies, racial history, and student outcomes. We were unable to create multivariate models for the school districts and their students’ standardized test data, given the low number of cases and missing or unreported data. This obviously creates a problem with analyzing how segregation or any policy influences student performance. Moreover, attempting to use school-level data is hindered by anonymity and confidentiality issues, as many schools with low numbers of racial and ethnic minority students would need the test results repressed to protect the students’ privacy. All of this prevents a full understanding of many factors that play into students’ educational progress in the state and limits researchers’ and policy makers’ efforts to identify effective policies that could improve students’ performance, particularly black students who have suffered a historical and persistent unjust educational system in Virginia.
Removing the names of schools and school districts and replacing them with random identifying numbers would alleviate these issues and provide more information for policy makers and school administrators of how to increase equality and achievement in schools. Relaying this information to the Department of Education or establishing working relationships to closely monitor specific schools and school districts with the agency would be a highly beneficial step to make in the future. It is difficult to identify a problem within the schools with standardized tests, or any aspect of education and learning for that matter, if data are not available.
Although we closely examined the black failure rates on a large group of the standardized tests in Virginia above, what must not be lost is that black students across the state are still failing at higher rates than their white peers. The disparities facing black students in Virginia’s public schools is a result of continual resistance and possibly apathy on the part of the Commonwealth to effectively address larger issues within the public school system that buoy such disparities well past Jim Crow and the 1970s and 1980s era of retrenchment into the soon-to-be post-Obama era of the twenty-first century. Simply focusing on white flight to private schools misses that public education is still unequal in resources and outcomes for black children, whether white children sit next to them in the classroom or not. More focus is needed on establishing and improving state mandates to provide equal resources and opportunities for the public good that is the state education system, which is at the very least part of the moral imperative to dissolve the persistent racial disparities that afflict black students’ educational experiences and their lives beyond the classroom.
As noted above, black students in elementary and middle school performed equal to, and sometimes better than, their white peers in history and social science. Identifying what is influencing these results and designing an approach to pull black students, and all other students for that matter, to equal performance across grade and subject levels would be invaluable for the future of these students and provide Virginia with a better prepared workforce in the future. It is likely that a complex array of forces is responsible (Ferguson 2001). Jencks and Phillips (1998) and Ladd (2008) recommend lowering class sizes and improving teacher quality to address the gap. Another possible influence of these changes in academic performance among black students relates to the tracking system within Virginia’s public schools. Although we are unable to examine this possibility with the current data, Tyson’s (2011) thorough analysis of 28 schools in North Carolina suggests that racialized tracking may play an important role in the academic performance in various course subjects and the levels within each subject among black students evident in the current study.
Our regional analyses indicate that despite the historical influence of the Virginia way, the four areas of Virginia do exhibit somewhat different patterns of community and educational inequality. Northern Virginia has the most cosmopolitan character. Siegel-Hawley et al. (2013) also note that the region’s public schools are the most racially diverse in the state. 1 Both black and white incomes are also much higher in Northern Virginia. The rural areas of Virginia have much larger white student populations, lower incomes, and higher unemployment. Arguably, Richmond and Norfolk share a more common legacy of Jim Crow segregation and more intense backlash to school desegregation than Northern Virginia and many rural parts of the state. The two regions also exhibit more similar community and, to a lesser extent, educational profiles.
Nevertheless, racial and ethnic disparities in educational attainment exist across Virginia and are noted to have real consequences for the daily lives of black Virginians (Southern Regional Education Board 2009). Equal access to a quality education and equality of educational outcomes are necessary to produce enlightened and productive Virginians in the twenty-first century. There are some clear signs of progress. Black students are performing at or above the level of their white peers on history and social science SOL tests in elementary and middle school. Black students’ failure rates in writing (in fifth grade and in high school) and in high school chemistry are lower in Norfolk than in rural areas of Virginia. Perhaps this is partially due to Norfolk’s lower percentage of provisionally licensed teachers than both rural Virginia and Richmond. However, the negative association between the percentage of black students in a school district and income (particularly among black families) must be discontinued. School districts in Virginia with disproportionate representation of black students continue to have lower teacher salaries and more provisionally licensed teachers. School districts with higher family incomes are also associated with more positive indicators of educational quality. These trends must also be reversed.
Despite the NCLB’s intention to close the achievement gap between advantaged and disadvantaged students and between white and racial–ethnic minority students, disparities in passing standardized test scores still remain. The 2013–2014 deadline has passed and Virginia, with 9 percent of schools making AYP, still has a long way to go. This problem is particularly acute in metropolitan areas with larger proportions of black residents, such as Richmond and Norfolk-Hampton Roads, where less than 1 percent of schools reported AYP. Wide variations in school quality and educational resources (e.g., disparities such as lower teacher salaries and more provisionally licensed teachers which are evident in school districts with black student enrollment above the state average) make it difficult to close the achievement gap. The delayed arrival of the common school movement in the South and the dearth of public high schools were particularly devastating. The focus on industrial training, as an alternative to traditional secondary schools, also delayed the transition into postsecondary education.
When black public high schools were finally built in Virginia, they quickly became overcrowded and lacked many of the resources that were found in most white high schools, echoing similar findings across the country (Kozol 2005, 1991; Orfield, Kuscera, and Siegel-Hawley 2012). These disparities between black and white schools ultimately led to Virginia’s incorporation into the seminal Brown v. Board of Education case. Several counties in Virginia went as far as closing public schools in order to avoid complying with the Supreme Court’s ruling. Although Virginia’s schools are no longer segregated by law, the racial–ethnic disparities in standardized test scores discussed in this article are one indication that closing the achievement gap in the near future is highly unlikely without a radically different approach. This study has documented several other reasons for concern. White children are overrepresented among students identified as gifted in Virginia public schools, while black students are underrepresented. Black students face harsher disciplinary sanctions receiving almost three times the percentage of white students’ suspensions and expulsions. Finally, black students are less likely to graduate on time with their high school diploma and are about twice as likely as white students to drop out of Virginia public high schools. These disparate educational experiences and outcomes strongly suggest that providing equality of educational opportunity for all children remains a compelling social problem that has yet to be adequately solved and are exasperated by accountability systems based on standardized testing that discount the reality of segregated and resource-depleted school environments that face black students in Virginia disproportionally more than their white peers. Until these systems are changed and commitment to a truly equal public school experience is fulfilled, racial disparities will only grow more apparent in Virginia’s as well as the nation’s schools.
Footnotes
Acknowledgments
The authors wish to thank colleagues at Virginia Tech for graciously reading earlier versions of this paper and providing feedback. We also greatly appreciate comments from the reviewers and special issue editors.
Declaration of Conflicting Interests
The author(s) declared no potential conflicts of interest with respect to the research, authorship, and/or publication of this article.
Funding
The author(s) received no financial support for the research, authorship, and/or publication of this article.